the state of exchanges a review of trends and opportunities to
TRANSCRIPT

The State of Exchanges A Review of Trends and Opportunities to Grow and Stabilize the Market Avalere Health | October 2016
Avalere Health T | 202.207.1300 avalere.com
An Inovalon Company F | 202.467.4455 1350 Connecticut Ave, NW Washington, DC 20036
TABLE OF CONTENTS
Executive Summary 1
Introduction 2
Overview of Enrollment and Product Design 2
Key Exchange Market Challenges 3
Low Enrollment 3
Risk Profile 5
Lack of Continuity in Enrollment 8
Inadequate Risk Mitigation 10
Issuer Participation 13
Policy Options to Address Key Market Challenges 15
Improve Risk Mitigation Programs 15
Encourage Enrollment Stability 16
Grow and Diversify Exchange Enrollment 17
Conclusions / Looking Ahead 19
Funding for this analysis was provided by Aetna. Avalere maintained full editorial control.
The State of Exchanges: A Review of Trends and Opportunities to Grow and Stabilize the Market 1
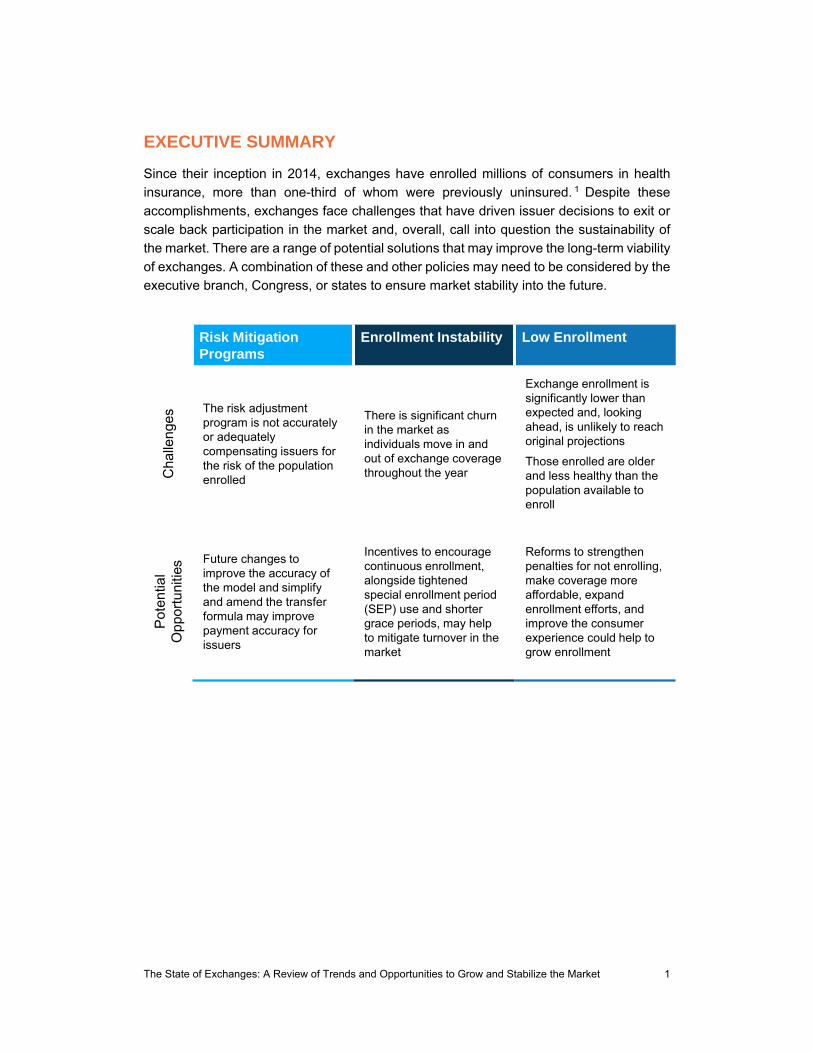
EXECUTIVE SUMMARY
Since their inception in 2014, exchanges have enrolled millions of consumers in health
insurance, more than one-third of whom were previously uninsured. 1 Despite these
accomplishments, exchanges face challenges that have driven issuer decisions to exit or
scale back participation in the market and, overall, call into question the sustainability of
the market. There are a range of potential solutions that may improve the long-term viability
of exchanges. A combination of these and other policies may need to be considered by the
executive branch, Congress, or states to ensure market stability into the future.
Risk Mitigation Programs
Enrollment Instability Low Enrollment
Cha
lleng
es
The risk adjustment program is not accurately or adequatelycompensating issuers for the risk of the population enrolled
There is significant churn in the market as individuals move in and out of exchange coverage throughout the year
Exchange enrollment is significantly lower than expected and, looking ahead, is unlikely to reach original projections
Those enrolled are older and less healthy than the population available to enroll
Pot
entia
l O
ppo
rtu
nitie
s Future changes to improve the accuracy of the model and simplify and amend the transfer formula may improve payment accuracy for issuers
Incentives to encourage continuous enrollment, alongside tightened special enrollment period (SEP) use and shorter grace periods, may help to mitigate turnover in the market
Reforms to strengthen penalties for not enrolling, make coverage more affordable, expand enrollment efforts, and improve the consumer experience could help to grow enrollment

The State of Exchanges: A Review of Trends and Opportunities to Grow and Stabilize the Market 2
INTRODUCTION
Since their inception, the health insurance exchanges created by the Affordable Care Act
(ACA) have successfully enrolled millions of Americans. However, approaching the fourth
open enrollment period, the exchange market faces ongoing, systemic challenges, which
threaten the stability and sustainability of the market.
In examining these challenges, this paper summarizes enrollment, choice, and product
design of 2016 exchange markets and identifies the key challenges facing the market that
have driven issuer participation decisions for the 2017 plan year. Finally, the paper
considers a range of potential policy options that could be combined to improve the
sustainability of the exchange market into the future.
OVERVIEW OF ENROLLMENT AND PRODUCT DESIGN
Despite lower than expected enrollment, exchanges have been successful to-date in
enrolling and delivering choice of insurance to millions of consumers. While some of these
trends are likely to shift into the future, as described later in this paper, the overview below
provides a review of the exchange market in its first three years of operation (2014 to 2016).
Enrollment Has Grown but Falls Short of Expectations
Exchanges have experienced modest enrollment growth each year, rising from 6.3 million
enrollees in 2014, to 8.8 million in 2015, and 10.1 million enrollees projected in 2016.2 3 4
However, enrollment continues to fall well short of expectations, and absent major policy
changes, the market is unlikely to reach the size that was projected when the ACA was
passed.
Premiums Through 2016 Have Been Relatively Stable
Premium growth has been modest each year, increasing by 9 percent, on average,
nationally in 2016.5 These increases are approximately in line with pre-ACA individual
market premiums increases, which rose between 8 percent and 12 percent each year from
2008 and 2011.6 Early analysis of 2017 proposed rates in select states found premiums
continue to vary widely by region, with average proposed premium changes for silver plans
ranging from a 5 percent decrease in Rhode Island to a 19 percent increase in Virginia.7
Overall, premiums are expected to grow more rapidly in 2017 than in previous years.8 9

The State of Exchanges: A Review of Trends and Opportunities to Grow and Stabilize the Market 3
Notably, subsidies cap premiums for eligible consumers at a percentage of income based
on the second-lowest cost silver plan available. As a result, exchange consumers can often
limit their exposure to premium increases, especially if they are willing to switch plans. In
2016, approximately 85 percent of exchange enrollees received premium subsidies.10
Exchanges Offer Consumers Choice of Plan Options
In 2016, consumers choose from a range of plan options offered by a variety of issuers
across four metal levels. Specifically, an average consumer shopping on HealthCare.gov
in 2016 had 50 plan options to choose from, including 3 catastrophic plans, 15 bronze
plans, 19 silver plans, 11 gold plans, and 2 platinum plans.11 Over time, this level of choice
will be impacted by the number of issuers participating in the exchange market.
Plan Options Feature a Range of Benefit Designs
Consumers choose among a range of distinct benefit designs across metal levels and
within the same metal level. In particular, cost sharing, including deductibles and maximum
out-of-pocket spending limits (MOOPs), varies greatly, providing consumers options based
on their healthcare needs and preferences. For example, at the silver plan metal level,
deductibles can range from $0 to $6,850 and MOOPs can range from $3,350 to $6,850.12
Looking ahead to 2017, the Centers for Medicare & Medicaid Services (CMS) established
optional standardized benefit designs in the federally-facilitated exchange (FFE). While
select state-based exchanges (SBEs) have previously adopted standardized plan designs,
it remains unclear how many issuers may offer these plan designs in the FFE or how the
introduction of standardized plans will impact the range of benefit design options available
to consumers.
KEY EXCHANGE MARKET CHALLENGES
Despite some success to date, the exchange market faces significant challenges in the
future. In particular, lower-than-expected exchange enrollment, a costlier and less stable
enrollee population, and inadequate risk mitigation programs are primary factors that could
threaten the stability and sustainability of the market moving forward.
Exchange Enrollment Is Lower than Projected
Since implementation in 2014, exchanges enrolled millions of Americans, but enrollment
continues to fall well short of projections. Specifically, the Congressional Budget Office
(CBO) projected in 2011 that exchanges would enroll 22 million individuals by 2016.13
However, enrollment expectations have been continually downgraded, and year-end
enrollment for 2016 is projected to be just over 10 million, or half of original projections.14
Looking ahead, expectations for future enrollment have also decreased over time,
indicating the market is likely going to be much smaller than anticipated. Indeed, as shown

The State of Exchanges: A Review of Trends and Opportunities to Grow and Stabilize the Market 4
in Figure 1, CBO had projected the exchange market would grow to 24 million by 2021, but
Avalere and others more recently estimate the market will reach its peak around 15 million
consumers.
Figure 1: Projected Exchange Enrollment, in Millions, 2014-202115 16
Low enrollment is problematic for the sustainability of the exchange market for several
reasons. First, low enrollment could pose financial challenges—fewer consumers
purchasing coverage means fewer premiums on which to levy per member per month
(PMPM) user fees. In addition, a small customer base makes the market less attractive to
issuers. Most critical, however, is the impact of low enrollment on the risk pool. While it was
expected that individuals with higher healthcare needs would be the first to sign-up for
coverage, stakeholders assumed that as more people enrolled, better risk would enter the
market and the risk pool would improve.17 Lower enrollment means reduced opportunity
for healthy people to enter the exchange market over time, leading to potentially
unsustainable risk.
The Individual Mandate Penalty May Be Less Effective than Anticipated
While the ACA established an individual mandate penalty for individuals who forgo
purchasing insurance, the penalty may be too low to effectively attract enrollment.
Particularly for middle-income, healthy individuals, the penalty remains low relative to the
cost of coverage, even after accounting for premium subsidies, as shown in Figure 2.18
For example, a 27-year-old earning approximately $24,000, or 200 percent of the federal
poverty level (FPL), in 2016 would spend $1,523 on premiums annually for a low-cost silver
plan, after accounting for premium subsidies.19 However, if this individual does not buy
insurance, he/she would pay just $695 in penalties—more than $800 less than if the
individual had purchased coverage.
6*
9*10
1213
1415 15
9
14
2223 23
24 24 24
0
5
10
15
20
25
30
2014 2015 2016 2017 2018 2019 2020 2021
Avalere Congressional Budget Office: March 2011
* Actual Enrollment
The State of Exchanges: A Review of Trends and Opportunities to Grow and Stabilize the Market 5
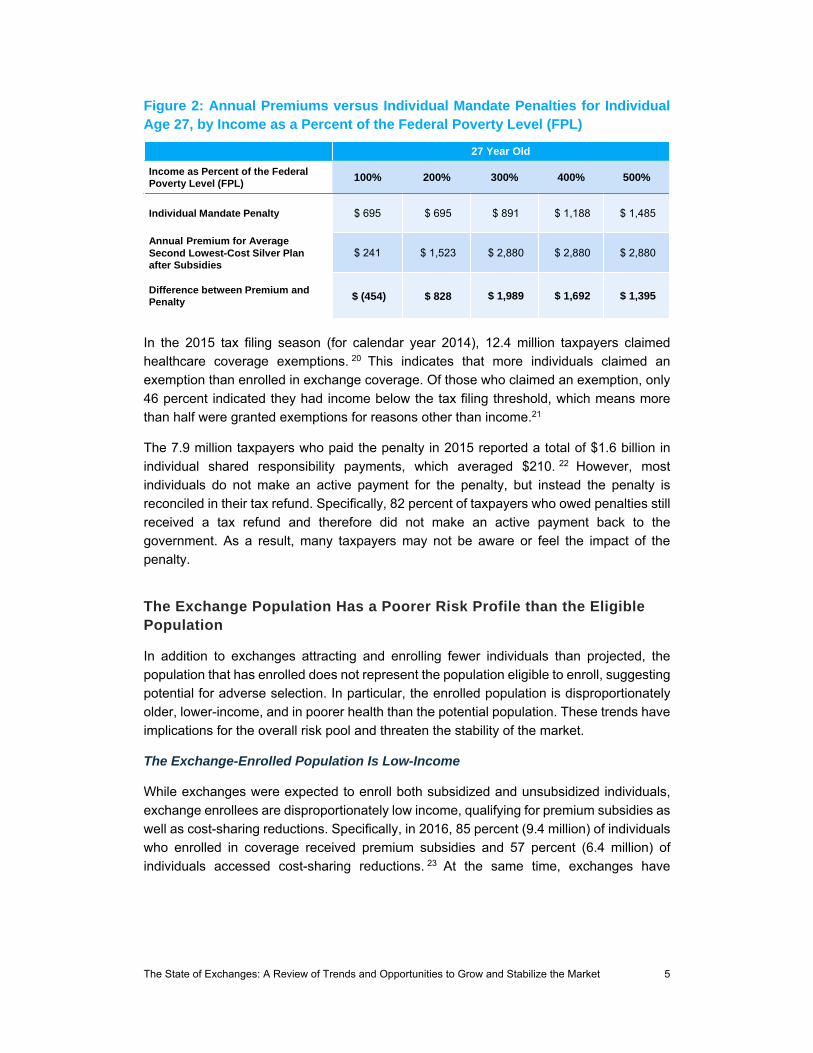
Figure 2: Annual Premiums versus Individual Mandate Penalties for Individual Age 27, by Income as a Percent of the Federal Poverty Level (FPL)
In the 2015 tax filing season (for calendar year 2014), 12.4 million taxpayers claimed
healthcare coverage exemptions. 20 This indicates that more individuals claimed an
exemption than enrolled in exchange coverage. Of those who claimed an exemption, only
46 percent indicated they had income below the tax filing threshold, which means more
than half were granted exemptions for reasons other than income.21
The 7.9 million taxpayers who paid the penalty in 2015 reported a total of $1.6 billion in
individual shared responsibility payments, which averaged $210. 22 However, most
individuals do not make an active payment for the penalty, but instead the penalty is
reconciled in their tax refund. Specifically, 82 percent of taxpayers who owed penalties still
received a tax refund and therefore did not make an active payment back to the
government. As a result, many taxpayers may not be aware or feel the impact of the
penalty.
The Exchange Population Has a Poorer Risk Profile than the Eligible Population
In addition to exchanges attracting and enrolling fewer individuals than projected, the
population that has enrolled does not represent the population eligible to enroll, suggesting
potential for adverse selection. In particular, the enrolled population is disproportionately
older, lower-income, and in poorer health than the potential population. These trends have
implications for the overall risk pool and threaten the stability of the market.
The Exchange-Enrolled Population Is Low-Income
While exchanges were expected to enroll both subsidized and unsubsidized individuals,
exchange enrollees are disproportionately low income, qualifying for premium subsidies as
well as cost-sharing reductions. Specifically, in 2016, 85 percent (9.4 million) of individuals
who enrolled in coverage received premium subsidies and 57 percent (6.4 million) of
individuals accessed cost-sharing reductions. 23 At the same time, exchanges have
27 Year Old
Income as Percent of the Federal Poverty Level (FPL)
100% 200% 300% 400% 500%
Individual Mandate Penalty $ 695 $ 695 $ 891 $ 1,188 $ 1,485
Annual Premium for Average Second Lowest-Cost Silver Plan after Subsidies
$ 241 $ 1,523 $ 2,880 $ 2,880 $ 2,880
Difference between Premium and Penalty $ (454) $ 828 $ 1,989 $ 1,692 $ 1,395

The State of Exchanges: A Review of Trends and Opportunities to Grow and Stabilize the Market 6
enrolled very few higher income individuals, as individuals with incomes over 400 percent
of the FPL represent just two percent of the enrolled population.24
Analysis of participation rates by income among eligible individuals reveals a similar trend.
As shown in Figure 3, exchange participation declines dramatically as incomes increase
and subsidies decrease. Specifically, exchanges enrolled over 80 percent of eligible
individuals with incomes below 150 percent of the FPL, but only two percent of eligible
individuals with incomes above 400 percent of the FPL. In addition, less than one-quarter
(17 percent) of potential exchange enrollees with incomes between 301 and 400 percent
of the FPL selected coverage, even though many may be eligible for premium subsidies.25
Figure 3: Percent of Potential Exchange Population Making Marketplace Plan Selections in 2016, by Income
While this trend is not surprising given individuals with lower incomes have the greatest
financial incentive to enroll in coverage, exchanges will need to better attract individuals
across income levels to ensure the sustainability and stability of the market.
Exchange Enrollees Are Disproportionately Older
Exchange enrollment has also skewed toward older individuals relative to the eligible
population. Specifically, as shown in Figure 4 below, individuals 55 years and older
comprise more than one-quarter (26 percent) of exchange enrollees, despite being just 16
percent of the eligible population. At the same time, while half (50 percent) of the potential
exchange population was under the age of 35, only 37 percent of 2016 exchange enrollees
are in that age bracket.26
81%
45%
33%
26%
17%
2%
100 to 150% 151 to 200% 201 to 250% 251 to 300% 301 to 400% Over 400%
Percent of the Federal Poverty Level (FPL)

The State of Exchanges: A Review of Trends and Opportunities to Grow and Stabilize the Market 7
Figure 4: 2013 Potential Exchange Population and 2016 Enrolled Population, by Age
To ensure a balanced risk pool, exchanges will need to more successfully attract and retain
younger individuals, often described as “young invincibles.” Importantly, this focus on
enrollment growth will likely need to come in parallel to reforms to the risk mitigation
programs to ensure stability.
Exchange Enrollees Have Significant Healthcare Needs
In addition to exchanges enrolling a greater share of lower income and older individuals,
the exchange population is also in poorer health relative to the population in other markets.
This trend has been identified and described by issuers and pharmacy benefit managers
as an issue central to stability of exchanges and the outlook for the market.
For example, Blue Cross Blue Shield plans indicated that 2014 and 2015 exchange
enrollees have higher rates of certain conditions (i.e. coronary artery disease,
hypertension, diabetes, depression, HIV, and Hepatitis C) than the plans’ pre-ACA
individual market enrollees. In addition, the exchange population used significantly more
medical services and had significantly higher costs.27
In addition, pharmacy benefit manager Express Scripts indicates that 2014 exchange
enrollees were nearly twice as likely to have $50,000 or more in annual medication costs
compared to commercial members and were more non-adherent across a range of therapy
classes.28 In 2015, prescription drug spending grew faster in exchanges (14.6 percent)
than in other markets, driven by spending on specialty drugs for HIV, Hepatitis C, oncology,
multiple sclerosis, and inflammatory conditions.29
In addition to emphasizing the need for enrollment growth over time, the data above
underscores the need to base the permanent risk adjustment program on data reflective of
the unique health experiences of consumers in this market.
9%
14%
28%
36%
37%
34%
26%
16%
2016Enrolled
Population
2013Potential
Population
0% 10% 20% 30% 40% 50% 60% 70% 80% 90% 100%
Under 18 18-34 35-54 55 and Older
50%
37%

The State of Exchanges: A Review of Trends and Opportunities to Grow and Stabilize the Market 8
Exchange Enrollment Lacks Continuity
Exchange Enrollees Churn Between Programs
Relative to other markets, the exchange population is more likely to move between
insurance plan options and insurance markets—sometimes referred to as “churn.” Indeed,
many exchange enrollees transition between being uninsured, having Medicaid coverage,
employer-sponsored coverage, and/or switching among exchange plans. More than half
(53 percent) of 2015 exchange enrollees did not have exchange coverage the year prior,
and 29 percent of those who re-enrolled in the coverage chose a new plan for their second
year of enrollment. 30 In addition, Avalere analysis of Inovalon’s Medical Outcomes
Research for Effectiveness and Economics Registry (MORE2 Registry®) claims data finds
that over 30 percent of enrollees in the individual market are enrolled for less than one
year.31
This shift in sources of coverage presents challenges for issuers seeking to understand
their population and effectively manage utilization and costs over time. For enrollees, this
movement threatens continuous coverage and continuity of care (e.g., changes in
formularies, provider networks).
Individuals Enrolling Through SEPs Have Greater Healthcare Needs
The ACA established an annual open enrollment period (OEP) to promote stability in the
market, attracting enrollment at the same time each year to promote full-year enrollment
and mitigate the potential for adverse selection (e.g., individuals signing up for coverage at
any point when they need care and then dropping coverage). The ACA also allows for
enrollment outside of the OEP, through special enrollment periods (SEPs), for some
individuals experiencing life-altering events. However, since the implementation of
exchanges, issuers have raised concerns about the extensive list of SEP qualifying events
vulnerable to abuse.
SEP qualifying events include a range of scenarios, including loss of health coverage,
changes in household size, changes in residence, changes in exchange eligibility or
income, enrollment or plan errors, and other qualifying events.32 These categories are
broad and, as a result, enrollment through SEPs has been significant. Specifically, in the
first half of 2015, approximately 940,000 individuals, or 15 percent of year-end federal
exchange enrollment, enrolled in coverage on the federal exchange through a SEP.33 34
Avalere analysis of Inovalon’s MORE2 Registry®, indicates that individuals who enrolled in
coverage through SEPs in 2015 were enrolled for a shorter period of time (7.8 months for
OEP enrollees vs. 3.6 months for SEP enrollees), used healthcare services (i.e. inpatient
stays and emergency room visits) more frequently, and had 5 percent higher PMPM
healthcare costs than those who enrolled through the annual OEP.35 However, as shown
in Figure 5, while PMPM costs are higher for SEP enrollees than OEP enrollees, their risk
scores are as much as 20 percent lower on average.

The State of Exchanges: A Review of Trends and Opportunities to Grow and Stabilize the Market 9
Figure 5: Average PMPM Healthcare Costs and Average Hierarchical Condition Categories (HCC) Risk Scores for OEP and SEP Enrollees, 2014 and 2015
Risk scores represent a measure of predicted healthcare costs. This data suggests the
shorter enrollment duration of individuals enrolling through SEPs may lead to risk scores
that are not reflective of expected costs. As a result, SEP enrollment, when not
appropriately regulated or accounted for in risk adjustment mechanisms, can have adverse
implications for issuers.
In response to issuer concerns regarding the lack of regulation, CMS began to take steps
to reduce access to SEPs.36 Specifically, CMS has removed a number of SEP qualifying
events that it determined are no longer necessary or due to concerns of inappropriate
use.37 38 Furthermore, CMS has provided additional detail around the documentation
beneficiaries must submit in order to verify SEP eligibility.39
Looking ahead, CMS is likely to pursue additional action around SEPs. In particular, while
CMS did not propose any new changes in the 2018 Notice of Benefit and Payment
Parameters (NBPP) proposed rule, it seeks comment on how to balance appropriate
access via SEPs with concerns regarding risk pool impact.40 In addition, CMS recently
released a Frequently Asked Questions (FAQ) document regarding verification of SEPs
and requests comment on the design of a pilot program to evaluate the impact of pre-
enrollment verification of SEP eligibility and curb potential abuse of SEPs.41
$391
$454
$389 $407
1.36
1.12
1.40
1.12
OEP SEP OEP SEP
PMPM Costs HCC Risk Score
2014 2015

The State of Exchanges: A Review of Trends and Opportunities to Grow and Stabilize the Market 10
Grace Periods May Allow for Inappropriate Continuous Coverage
To help individuals maintain continuous coverage throughout the year, the ACA
established grace periods. Grace periods allow for subsidized individuals, after paying the
first month’s premium, to continue to be enrolled in their exchange plan for 90 days after
failing to make a premium payment. The issuer is required to pay claims for the first month
of the grace period; however, providers are generally at risk when providing services to an
exchange enrollee during the second and third months of a grace period. The grace period
provision may be particularly prone to abuse, as it can allow individuals to pay nine months
of premiums and maintain coverage for twelve months, enrolling again in coverage during
the next OEP. As a result, issuers and providers have suggested that CMS shorten the 90-
day grace period to 30 days.42 43
Third Party Payments May Expose the Risk Pool to Adverse Selection
CMS has been clear that health plans are required to accept third party payments from
certain government health programs (i.e. Ryan White); however, it has discouraged plans
from accepting third party cost sharing and premiums assistance from other entities such
as hospitals and other providers.44 45 Nevertheless, CMS and others have highlighted the
potential negative impact of current third party assistance on the exchange risk pool.46 To
address this potential concern, CMS recently released a Request for Information (RFI) to
explore further the potential ramifications of third party premium payment outside of these
programs on the exchange market.47
The ACA’s Risk Mitigation Programs Are Inadequate
Risk Adjustment Is Not Adequately Accounting for Expected Healthcare Costs
The ACA established three risk mitigation programs (the “3Rs”) to encourage issuer
participation, mitigate risk in the new market, and appropriately compensate issuers for the
financial costs of their enrollees. Two of the three programs, reinsurance and risk corridors,
were designed as temporary programs for the 2014, 2015, and 2016 plan years.
Reinsurance, which seeks to limit issuer losses for high-cost individuals, is estimated to
have been effective in lowering 2014 plan premiums by approximately 10 percent. 48
However, the risk corridors program, which was intended to transfer funds from plans that
have higher-than-projected gains to plans with lower-than-expected gains, has been
significantly underfunded, reducing its effectiveness. In 2014, this program paid only 12.6
percent of total corridor payments due. CMS’ recent announcement that 2015 collections
will exclusively be applied to outstanding 2014 payments suggests the program will
continue to be largely ineffective for 2015 and 2016.49 Many issuers, particularly the ACA’s
Consumer Operated and Oriented Plan (CO-OPs), have cited insufficient risk corridor
payments as a factor driving their exits.

The State of Exchanges: A Review of Trends and Opportunities to Grow and Stabilize the Market 11
Unlike risk corridors and reinsurance, the risk adjustment program is permanent and is
therefore a primary focus of potential improvement in the exchange market. Risk
adjustment establishes transfer payments so that plans with lower-cost enrollees subsidize
those plans with higher-cost enrollees. Plans receive a higher payment for sicker enrollees
with costlier care, and make payments to other plans if they enroll a larger share of healthier
enrollees. The exchange risk adjustment program is “zero sum” in that plans with higher
risk scores receive payments from plans with lower risk scores. These payments or
charges are generally announced six months after the conclusion of the plan year,
potentially surprising some plans with a risk adjustment “bill.” Indeed, CMS’ announcement
of owed risk adjustment payments for 2015 immediately contributed to the closure of
Connecticut CO-OP HealthyCT and Oregon Health CO-OP.50 51 In addition, Maryland CO-
OP Evergreen Health filed suit in federal court over the risk adjustment program.52
The risk adjustment program has a number of weaknesses identified by issuers and
stakeholders as a key concern adding to instability in the market. At its core, the risk model
has several limitations, described in a previous Avalere analysis and CMS white paper,
which increase the likelihood of inaccuracy in calculating risk score and transfer
payments.53 54 In the recently released NBPP for the 2018 plan year, CMS proposed a
number of specific changes to the risk model to address some of these challenges. 55
Specific weaknesses of the current risk adjustment program include:
Data Sample: The large group employer population dataset that CMS used to
estimate the model does not closely mirror the currently-enrolled individual and
small group commercial population. Due to this mismatch, the risk model may not
properly estimate costs for the exchange population.
Payment for High Cost Enrollees: The current model may not accurately
compensate plans for high-cost enrollees. To address this problem, CMS proposes
in the 2018 NBPP to reintroduce an element of reinsurance by covering 60 percent
of claims above $2 million for any enrollee from a separate pool of funds. The pool,
which will be funded by a percent-of-premium assessment on issuers, will
aggregate costs across states. However, such proposal may have limited impact
due to the high attachment point of $2 million. Analyses suggest that a $2 million
attachment point is too high to materially improve the conditions for plans with high-
cost enrollees.56
Adjustment for Partial Year Enrollment: The model does not account for higher
than expected costs for partial year enrollees, a concern that issuers have raised
as contributing to financial losses. In the 2018 NBPP, CMS proposes to include in
the 2017 risk model partial year enrollment duration (ED) factors. The ED factors
will incrementally increase the risk score of an enrollee who is covered for less
than one year. CMS is also proposing to incorporate ED factors into the 2018
model.57

The State of Exchanges: A Review of Trends and Opportunities to Grow and Stabilize the Market 12
Ability to Predict Costs for Healthy Individuals: CMS also indicated it is
considering a range of approaches to recalibrate the risk models to better predict
risk for healthier subpopulations. While issuers report not enough money is being
transferred to plans for high-cost individuals, analyses also indicate that too much
money is being transferred away from healthier enrollees. Specifically, issuers are
incurring losses on individuals who are not assigned any Hierarchical Condition
Categories (HCCs) in the risk adjustment model. For example, issuers face a loss
ratio of 126 percent for individuals without any HCCs, but just 69 percent for
individuals with five HCCs.58 Anthem reported in its 2016 second quarter earnings
that risk adjustment “over-charges for healthy and over-reimburses for certain
moderately unhealthy disease states.”59
Disease Selection: The model currently relies upon the diseases and conditions
used in the Medicare risk adjustment model, which may not be appropriate for the
individual and small group market. Perhaps as a result, only approximately 20
percent of the enrollees from the large group population used to estimate the
model have at least one HCC.60 This disease selection could be a contributing
factor to the issue described above—namely that risk scores are too low for the
healthy individuals because a very small percentage of enrollees have at least one
HCC.
Prescription Drug Data: Currently, the model does not include available
prescription drug information to determine diseases and assign severity, yet the
model is designed to predict medical and drug costs. In the 2018 NBPP, CMS
proposes to include prescription drug data in the 2018 risk adjustment model. In
this model, prescription drug use would provide an additional source to indicate a
disease and would indicate the relative severity of an enrollee’s condition for the
purposes of calculating the risk score. CMS added 12 Prescription Drug
Categories (RXCs) to the risk model and developed RXC-HCC pairs.
However, CMS’ proposal to include prescription drug data lacks clarity regarding
which drugs will be included in each RXC. As a result, CMS could intend to include
all drugs within a class or only particular drugs. These approaches would have
varying implications for the risk adjustment model and, depending on how it is
implemented, may be unlikely improve model accuracy.
Challenges Associated with the Transfer Formula
In addition to reforms to make the risk adjustment model more accurate, there are
additional considerations related to the transfer formula used to calculate plan payments.
Lack of Predictability of Transfer Payments: The unpredictability of the risk
adjustment program poses significant challenges for issuers. Plans may struggle

The State of Exchanges: A Review of Trends and Opportunities to Grow and Stabilize the Market 13
to predict their risk adjustment receipts or payment responsibilities throughout the
year and, as a result, plans may owe a significant and unexpected amount. For
example, the difference between expected and actual 2015 risk adjustment
payments for a number of CO-OPs exceeded $10 million, or over 10 percent of
their revenue.61
Effect of Including Administrative Expenses in Transfer Payment: The
calculation of the risk adjustment transfer payment may not appropriately
incentivize efficiency. Specifically, the transfer payment is calculated as a percent
of the average premium in the market, and the average premium incorporates
administrative costs. As a result, more efficient plans with lower administrative
costs may be subsidizing less efficient plans.
Zero Sum Transfer Formula: The zero sum nature of the transfer formula may
be insufficient to cover the aggregate risk in the market, given the smaller size and
greater health needs of the enrolled population as compared to the potential
population. Currently, the risk adjustment program is zero sum, meaning that there
are “winners” and “losers” in the program. While incrementally more healthy people
may exacerbate the current inaccuracy of the model in predicting enrollee costs
without HCCs, low enrollment may hinder the ability of the current zero sum
formulation to be effective.
ISSUER PARTICIPATION
As issuers have gained experience in the market and developed a clearer understanding
of the population, many have expressed broad concerns about the financial sustainability
of offering exchange coverage. In particular, many of the challenges mentioned above are
driving issuers’ decisions regarding future participation in the market.
Ahead of the 2017 plan year, several large national and regional issuers have indicated
they will significantly scale back or no longer participate in the exchange market because
of unsustainable financial losses. In addition to CO-OPs and large national issuers exiting
the market for 2017, there are also a range of local and regional issuers that are exiting or
scaling back participation. In particular, LifeWise (Oregon), WellCare (Kentucky, New
York), and Scott & White Health (Texas), among others, have announced they are exiting
select states. 62 63 64 65 Harken Health, a subsidiary of United, intended to expand its
current exchange participation beyond Illinois and Georgia to offer coverage in Florida in
2017, but recently announced it will exit all exchange markets for 2017. In addition to
issuers exiting entire states, some issuers (e.g., BlueCross BlueShield of Tennessee and
Premera Blue Cross in Washington) will also decrease participation within existing states
in 2017. 66 67

The State of Exchanges: A Review of Trends and Opportunities to Grow and Stabilize the Market 14
Figure 6, below, displays the announced changes in exchange participation and the
financial losses as described by notable exchange exits: United, Humana, Aetna, and the
CO-OPs.
Figure 6: Exchange Issuer Participation and Financial Losses
Issuer Exchange Participation
Financial Losses 2016 2017
United ——
"The smaller overall market size and shorter-term higher risk profile within this market segment continue to suggest we cannot broadly serve it on
an effective and sustained basis."68
1,855 counties across 34 states69
3 states—Nevada, New York, and
Virginia70
United experienced losses of $475 million on the exchanges in
2015 and expects to lose over $600 million in
2016.71
Humana ——
"Humana anticipates proposing a number of
changes to retain a viable product for individual
consumers, where feasible, and address persistent risk
selection challenges."72
1,351 counties across 19 states
156 counties across 11 states73
Humana expects losses for 2016 individual commercial plans,
including exchanges, to total $337 million.74
Aetna ——
“This population dynamic, coupled with the current
inadequate risk adjustment mechanism, results in
substantial upward pressure on premiums and creates significant sustainability
concerns."75
778 counties across 15 states
242 counties across 4 states—Delaware, Iowa, Nebraska and
Virginia76
Aetna’s losses have totaled more than $430
million for individual products since January
2014.77
Aetna expects 2016 losses to exceed $300
million.78
CO-OPs ——
“Between reduced congressional appropriations
and disappointments with respect to risk adjustment or risk corridors, it's a lot for any
startup to overcome.”79
23 CO-OPs were established under the ACA and offered coverage in 2014
As of October 2016, 6 CO-OPs
remain in operation, and it remains unclear how many will continue to
participate in 201780
CO-OPs originally received $2.4 billion in federal funding. The 16
closed CO-OPs received $1.7 billion.81
Most remaining CO-OPs are incurring losses—4
CO-OPs lost a combined $46.5 million in the first
half of 2016.82

The State of Exchanges: A Review of Trends and Opportunities to Grow and Stabilize the Market 15
Importantly, Avalere analysis of issuer decisions indicates that consumer choice may
decrease substantially for 2017. As shown in Figure 7, nearly 36 percent of exchange
market rating regions may have only one participating issuer offering plans in 2017.83
Similar analyses from other experts underscore these findings. McKinsey predicts that at
least 12 percent of consumers will have access to just one issuer in 2016, up from 2 percent
in 2015, and Kaiser Family Foundation finds that 31 percent of counties may have just one
issuer in 2016.84 85
Figure 7: Issuer Participation in Exchange Rating Regions, 50 States & DC
Carrier participation decisions are likely to evolve up until open enrollment begins on
November 1. For example, since the Avalere analysis described in Figure 7 was released,
Blue Cross and Blue Shield of Nebraska, Indiana University Health Plan (Indiana), and
Oscar (New Jersey), among other issuers, have announced plans to exit select state
exchanges for 2017.86 87 While select issuers have also announced intent to enter into new
states or regions, 2017 participation is expected to be substantially lower than 2016 overall.
POLICY OPTIONS TO ADDRESS KEY MARKET CHALLENGES
Given the current state of the exchanges heading into the 2017 plan year, there are
potential changes that may help stabilize the market into the future. A number of these
solutions have been discussed by stakeholders and/or explored by CMS to date.
Improve Risk Mitigation Programs
There are several opportunities to improve the risk adjustment program, including
amending proposed changes and introducing new and more fundamental changes.
Combined, these changes could improve the accuracy and predictability of the model and,
as a result, promote stability in the market.
4%
36%29%
19%
67%
45%
2016 2017
Per
cent
of R
atin
g R
egio
ns
3+ Plans
2 Plans
1 or Fewer
The State of Exchanges: A Review of Trends and Opportunities to Grow and Stabilize the Market 16
Increase Accuracy of Risk Model
Improve Disease Selection: Reconsider coverage criteria for the diseases
included in the model, as the same conditions used for the Medicare model
development may not be appropriate for the individual and small group commercial
population.
Align Data Sample: Recalibrate the model based on individual and small group
commercial enrollees, rather than the current MarketScan database.
Improve Proposed Inclusion of Drug Data: Restructure how prescription drugs
are included in the model to mitigate the potential for adverse implications. In
particular, each RXC should be an accurate predictor of healthcare spending. This
goal may be accomplished by adding subcategories of drugs within each RXC or
by selecting a more homogenous set of drugs.
Improve New Reinsurance Element
Reduce Reinsurance Attachment Point: Examine the impact of lowering the
attachment point from the proposed $2 million to $1 million, $500,000, or
$100,000.88
Amend and Simplify Transfer Formula
Create a New Transfer Formula: Create a system where plans are paid based
on the risk of their population, regardless of how that risk compares to other plans’
customers to help insurers better predict their risk transfer payments and alleviate
concerns stemming from the zero sum nature of the model. This approach might
require dedicated funding for the risk adjustment program overall, similar to the
Medicare Advantage program.
Exclude Administrative Costs from Transfer Formula: Remove administrative
costs from the transfer payment calculation to mitigate the variation in issuers’
efficiency.
Encourage Enrollment Stability
Encouraging enrollees to continue to stay enrolled in their plan for a longer period of time
may also help stabilize the market and mitigate concerns related to adverse selection.
Specifically, verifying that enrollees are eligible to enroll and creating incentives for
individuals to remain enrolled throughout the year will promote a more stable and
predictable market.
Increase Market Integrity Oversight
Tighten SEP Use: Further reduce the number of SEP qualifying events and/or
heighten verification and documentation requirements, beyond what CMS has
already proposed. Importantly, changes to SEP rules will need to balance market
stability with access to coverage.
Shorten Grace Periods: Reduce the 90-day grace period to, for example, 30
days. Alternatively, place additional enrollment restrictions and/or penalties on

The State of Exchanges: A Review of Trends and Opportunities to Grow and Stabilize the Market 17
beneficiaries who lose coverage because of non-payment of premium in one year
and seek coverage in the following plan year.
Increase Transparency of Third Party Payments: Promote transparency and
issuer identification of third party payments from providers that may result in
individuals who are eligible for Medicare or Medicaid enrolling in exchange
coverage.
Incentivize Enrollment Stability
Create Incentives to Retain Coverage: Introduce incentives for longer-term,
continuous enrollment, such as:
o Multi-Year Contracting: Give issuers the ability to offer plans on a multi-year
basis and to provide premium discounts to members who commit to plan
membership over multiple years.
o Benefit Design Incentives: Change benefit designs to reward loyal members
(e.g., deductibles that decrease as tenure in a plan increases).
Grow and Diversify Exchange Enrollment
In addition to changes that improve the exchange risk adjustment mechanisms and
establish a more stable risk pool, opportunities to grow enrollment are likely to add stability
to the market overall.
Strengthen Penalties for Not Enrolling
Increase Individual Mandate Penalty: Increase the individual mandate penalty
amount for future years to make the tradeoff between purchasing insurance or
paying the penalty less attractive for those forgoing insurance.
Strengthen Regulation of Mandate: The Internal Revenue Service (IRS) could
more strictly regulate mandate penalty exemptions to ensure each individual
granted an exemption is qualified. Alternatively, Congress could grant the IRS
authority to collect individual mandate penalties as it typically would for owed
taxes.
Create Late Enrollment Penalty: Exchanges could institute new penalties for late
enrollment in order to further incent enrollment in the current plan year. Individuals
who forgo signing up for insurance in prior years would be required to pay an
additional amount when signing up for coverage in the future. The late penalty
could be similar to the penalty that currently exists under the Part D program, which
is added on to beneficiaries’ monthly premiums. For example, if structured similar
of the Part D program, a 50 year-old individual who is not eligible for subsidies and
forgoes enrolling in coverage for 10 months would pay, approximately, an
additional $50 per month added to the total premium for the duration of his/her
exchange enrollment.
The State of Exchanges: A Review of Trends and Opportunities to Grow and Stabilize the Market 18
Alternatively, a late enrollment penalty could be implemented in the form of
reduced coverage for the initial months of enrollment. For example, following late
enrollment, an individual may only receive coverage for preventive services and
emergency room visits for a specified period of time.
Tie Coverage to Public Program Participation: Make health insurance a
condition of other public programs, such as obtaining a driver’s license. For
example, in order to obtain a driver’s license, an individual would be required
provide evidence of continuous health insurance coverage.
Increase Subsidies to Promote Premium Affordability
Restructure Subsidy Allocation: As an alternative to increasing subsidy
amounts overall, reduce subsidies for individuals between 300% FPL and 400%
FPL in order to increase subsidies for individuals at lower income levels.
Expand Enrollment Efforts
Increase Funding for Enrollment Efforts: As more states continue to rely on the
federal platform, additional funding for federal exchange education and enrollment
assistance could help grow enrollment. Exchanges may reinvest in enrollment and
outreach efforts to promote awareness of available coverage options and financial
assistance, as well as in enrollment assistance to facilitate the enrollment process.
Notably, presidential candidate Hillary Clinton has proposed to invest $500 million
per year in “an aggressive enrollment campaign” to grow exchange enrollment.89
Improve the Consumer Experience
Enhance Consumer Tools: Consumers may benefit from more understandable
consumer shopping tools, including user-friendly searchable formularies, provider
networks, and out-of-pocket cost tools. These tools may help individuals choose
the right coverage for their unique care needs and preferences, which may result
in enrollees remaining in the plan longer. Notably, in 2014, approximately one-third
of exchange enrollees with chronic conditions had to switch providers because
they were not in-network and over one-fourth of enrollees switched their
medication, making the case for increased consumer education and tools that
increase transparency in plan selection.90
Streamline the Enrollment Process: Enhancing and streamlining the processes
for individuals to enroll through brokers and other qualified third parties could help
grow enrollment. Third-party websites have long facilitated enrollment for shoppers
in the individual market, and now bring strong decision support tools that are easily
accessible to consumers. Initiatives to make it easier for brokers to enroll
consumers directly and/or mitigate the back-and-forth interaction with exchange
platforms could streamline the enrollment process.
Attract “Young Invincibles”
Adjust Age Rating: Modify the current age rating band from 3:1 to 5:1. Changing
the age rating bands would lower premiums for younger individuals and raise
premiums for older consumers.
The State of Exchanges: A Review of Trends and Opportunities to Grow and Stabilize the Market 19
Offer New Plan Options: Provide lower cost plan options, such as a copper plan
(50 percent actuarial value), to attract younger and healthier enrollees. Copper
level plans would feature lower premiums, in exchange for higher cost sharing.91
Alternatively, design new plan options that include additional benefits (e.g., vision)
or first-dollar coverage for commonly used services. CMS suggests that
consumers prefer plans that cover and pay for services before the deductible is
reached.92
LOOKING AHEAD / CONCLUSIONS
Despite moderate enrollment success to date, the exchange market faces significant
uncertainty approaching the fourth open enrollment period. Lower-than-expected
enrollment, instability in coverage, and inadequate risk mitigation programs are top
concerns driving issuer decisions to limit participation in the market. While carrier
participation is expected to decrease in 2017, opportunity exists for the next administration
and/or Congress to stabilize the exchange market through a combination of potential policy
solutions.

The State of Exchanges: A Review of Trends and Opportunities to Grow and Stabilize the Market 20
REFERENCES 1 Katherine G. Carman, Christine Eibner, and Susan M. Paddock. Trends In Health Insurance Enrollment, 2013−15. May 2015. http://content.healthaffairs.org/content/early/2015/05/04/hlthaff.2015.0266.abstract 2 CMS. March 31, 2015 Effectuated Enrollment Snapshot. June 2, 2015. https://www.cms.gov/Newsroom/MediaReleaseDatabase/Fact-sheets/2015-Fact-sheets-items/2015-06-02.html 3 CMS. December 31, 2015 Effectuated Enrollment Snapshot. March 11, 2016. https://www.cms.gov/Newsroom/MediaReleaseDatabase/Fact-sheets/2016-Fact-sheets-items/2016-03-11.html 4 Avalere All-Payer Enrollment Model. 5 Avalere PlanScape®, a proprietary analysis of exchange plan features, November 2015. 6 ASPE and NORC at the University of Chicago. Trends In Premiums In The Small Group And Individual Insurance Markets, 2008-2011. https://aspe.hhs.gov/report/trends-premiums-small-group-and-individual-insurance-markets-2008-2011 7 Avalere. UPDATE: Early Analysis Finds 2017 Proposed Exchange Premiums for Low Cost Silver Plans Increasing 8 Percent on Average. http://avalere.com/expertise/life-sciences/insights/update-early-analysis-finds-2017-proposed-exchange-premiums-for-low-cost-si 8 Kaiser Family Foundation. Analysis of 2017 Premium Changes and Insurer Participation in the Affordable Care Act’s Health Insurance Marketplaces. July 2016. http://kff.org/health-reform/issue-brief/analysis-of-2017-premium-changes-and-insurer-participation-in-the-affordable-care-acts-health-insurance-marketplaces/ 9 McKinsey & Company. 2017 exchange market: Emerging pricing trends. September 2016. http://healthcare.mckinsey.com/2017-exchange-market-emerging-pricing-trends 10 CMS. March 31, 2016 Effectuated Enrollment Snapshot. June 2016. https://www.cms.gov/Newsroom/MediaReleaseDatabase/Fact-sheets/2016-Fact-sheets-items/2016-06-30.html 11 ASPE. Health Plan Choice And Premiums In The 2016 Health Insurance Marketplace. https://aspe.hhs.gov/sites/default/files/pdf/135461/2016%20Marketplace%20Premium%20Landscape%20Issue%20Brief%2010-30-15%20FINAL.pdf 12 Avalere PlanScape®, a proprietary analysis of exchange plan features, December 2015. In the FFM landscape file, plans note either a “combined” deductible, which includes the medical and drug deductible, and other plans note separate medical and drug deductibles. In addition, plans note either a “combined” MOOP limit, which includes one MOOP for all medical and drug spending, or separate medical MOOP and drug MOOP limits. The information above examines only plans with a combined deductible and combined MOOP limit. 13 Congressional Budget Office. (March 30, 2011). CBO’s Analysis of the Major Health Care Legislation Enacted in March 2010: http://www.cbo.gov/sites/default/files/03-30-healthcarelegislation.pdf 14 Avalere All-Payer Enrollment Model. 15 Avalere All-Payer Enrollment Model. 16 Congressional Budget Office. (March 30, 2011). CBO’s Analysis of the Major Health Care Legislation Enacted in March 2010: http://www.cbo.gov/sites/default/files/03-30-healthcarelegislation.pdf 17 CMS. Report: Unchanged Medical Costs Show Strength of Affordable Care Act’s Marketplace. August 11, 2016. https://www.hhs.gov/about/news/2016/08/11/report-unchanged-medical-costs-show-strength-affordable-care-act-s-marketplace.html 18 Avalere. Individual Mandate Penalty May Be Too Low to Attract Middle-Income Individuals to Enroll in Exchanges. April 24, 2015. http://avalere.com/expertise/managed-care/insights/individual-mandate-penalty-may-be-too-low-to-attract-middle-income-individu 19 Avalere analysis of premium payments versus individual mandate penalty amounts. Second-lowest silver (benchmark) plan premium data is from ASPE, Health Plan Choice and Premiums In The 2016 Health Insurance Marketplace. https://aspe.hhs.gov/basic-report/health-plan-choice-and-premiums-2016-health-insurance-marketplace#_ftnref20

The State of Exchanges: A Review of Trends and Opportunities to Grow and Stabilize the Market 21
20 IRS. Preliminary Data on the Premium Tax Credit Provision. January 8, 2016. https://www.irs.gov/pub/newsroom/irs_letter_aca_stats_010816.pdf 21 H&R Block. H&R Block’s Final ACA Stats: Refunds Impacted for Most Who Received Advance Tax Credit. April 27, 2015. http://newsroom.hrblock.com/hr-blocks-final-aca-stats-refunds-impacted-for-most-who-received-advance-tax-credit 22 IRS. Preliminary Data on the Premium Tax Credit Provision. January 8, 2016. https://www.irs.gov/pub/newsroom/irs_letter_aca_stats_010816.pdf 23 CMS. March 31, 2016 Effectuated Enrollment Snapshot. June 2016. https://www.cms.gov/Newsroom/MediaReleaseDatabase/Fact-sheets/2016-Fact-sheets-items/2016-06-30.html 24 ASPE. Health Insurance Marketplaces 2016 Open Enrollment Period: Final Enrollment Report. March 2016. https://aspe.hhs.gov/sites/default/files/pdf/187866/Finalenrollment2016.pdf 25 Avalere analysis, May 2016. Analysis of the number of potential exchange enrollees was determined using 2013 American Community Survey data on the uninsured and non-group market populations prior to implementation of the health insurance exchanges. Analysis includes the 38 states relying on healthcare.gov in 2016. In states that expanded Medicaid, the potential exchange population includes those with incomes above 138% FPL. In states that did not expand Medicaid, the potential exchange population includes 100% FPL and above. This analysis does not consider citizenship status. 26 Avalere analysis, May 2016. Analysis of the number of potential exchange enrollees was determined using 2013 American Community Survey data on the uninsured and non-group market populations prior to implementation of the health insurance exchanges. Analysis includes the 38 states relying on healthcare.gov in 2016. In states that expanded Medicaid, the potential exchange population includes those with incomes above 138% FPL. In states that did not expand Medicaid, the potential exchange population includes 100% FPL and above. This analysis does not consider citizenship status. 27 BCBSA. Newly Enrolled Individuals in the Individual Health Insurance Market After Health Care Reform: The Experience From 2014 and 2015. http://www.bcbs.com/healthofamerica/newly_enrolled_individuals_after_aca.pdf 28 Express Scripts. Exchange Pulse Report. June 2015. http://lab.express-scripts.com/lab/insights/Government-Programs/First-Look-2015-Public-Exchange-Plan-Rx-Trends 29 Express Scripts. Exchange Pulse Report. June 2016. http://lab.express-scripts.com/lab/publications/exchange-pulse-public-exchanges-report-june-2016 30 Health and Human Services. Nationwide nearly 11.7 million consumers are enrolled in 2015 Health Insurance Marketplace coverage. http://www.hhs.gov/about/news/2015/03/10/nationwide-nearly-11-point-7-million-consumers-are-enrolled-in-2015-health-insurance-marketplace-coverage.html Html#. Mar. 10, 2015. 31 Avalere. Evolving the Risk-Adjustment Model to Improve Payment Accuracy in the Individual & Small Group Market. March 2016. http://go.avalere.com/acton/attachment/12909/f-02b6/1/-/-/-/-/20160324_Avalere%20Evolving%20Risk%20Adjustment%20Model_FINAL.pdf 32 CMS. Special Enrollment Periods for the Health Insurance Marketplace. https://marketplace.cms.gov/outreach-and-education/special-enrollment-periods-for-marketplace.pdf 33 CMS. 2015 Special Enrollment Period Report – February 23 – June 30, 2015. August 2015. https://www.cms.gov/Newsroom/MediaReleaseDatabase/Fact-sheets/2015-Fact-sheets-items/2015-08-13.html 34 CMS. December 31, 2015 Effectuated Enrollment Snapshot. March 11, 2016. https://www.cms.gov/Newsroom/MediaReleaseDatabase/Fact-sheets/2016-Fact-sheets-items/2016-03-11.html 35 Inovalon. Medical Outcomes Research for Effectiveness and Economics Registry (MORE2 Registry®). 36 “Special Enrollment Periods for the Health Insurance Marketplace.” Centers for Medicare and Medicaid Services. May 6, 2016. https://www.cms.gov/Newsroom/MediaReleaseDatabase/Fact-sheets/2016-Fact-sheets-items/2016-05-06.html 37 The CMS Blog. Clarifying, Eliminating and Enforcing Special Enrollment Periods. January 19, 2016. https://blog.cms.gov/2016/01/19/clarifying-eliminating-and-enforcing-special-enrollment-periods/ 38 HHS. Patient Protection and Affordable Care Act; Amendments to Special Enrollment

The State of Exchanges: A Review of Trends and Opportunities to Grow and Stabilize the Market 22
Periods and the Consumer Operated and Oriented Plan Program. Interim Final Rule. May 6, 2016. https://www.regulations.gov/document?D=CMS-2016-0070-0001 39 CMS. Strengthening the Marketplace – Actions to Improve the Risk Pool. June 8, 2016. https://www.cms.gov/Newsroom/MediaReleaseDatabase/Fact-sheets/2016-Fact-sheets-items/2016-06-08.html 40 HHS. Patient Protection and Affordable Care Act; HHS Notice of Benefit and Payment Parameters for 2018. Proposed Rule. August 30, 2016. https://s3.amazonaws.com/public-inspection.federalregister.gov/2016-20896.pdf 41 CMS. Frequently Asked Questions Regarding Verification of Special Enrollment Periods. September 6, 2016. https://www.cms.gov/CCIIO/Resources/Regulations-and-Guidance/Downloads/FAQ-Regarding-Verification-of-SEPs.pdf 42 Health Affairs. The Ninety-Day Grace Period. October 2014. http://healthaffairs.org/healthpolicybriefs/brief_pdfs/healthpolicybrief_128.pdf 43 The Hill. GOP surprises with push for smaller ObamaCare changes. June 10, 2016. http://thehill.com/policy/healthcare/283055-gop-surprises-with-push-for-smaller-obamacare-changes 44 HHS. Patient Protection and Affordable Care Act; Third Party Payment of Qualified Health Plan Premiums. Interim Final Rule with Comment Period. March 19, 2014. https://www.federalregister.gov/articles/2014/03/19/2014-06031/patient-protection-and-affordable-care-act-third-party-payment-of-qualified-health-plan-premiums 45 CMS. Third Party Payments of Premiums for Qualified Health Plans in the Marketplaces. November 2013. https://www.cms.gov/CCIIO/Resources/Fact-Sheets-and-FAQs/Downloads/third-party-qa-11-04-2013.pdf 46 CMS. Request for Information: Inappropriate Steering of Individuals Eligible for or Receiving Medicare and Medicaid Benefits to Individual Market Plans. August 2016. https://s3.amazonaws.com/public-inspection.federalregister.gov/2016-20034.pdf 47 CMS. Request for Information: Inappropriate Steering of Individuals Eligible for or Receiving Medicare and Medicaid Benefits to Individual Market Plans. August 2016. https://s3.amazonaws.com/public-inspection.federalregister.gov/2016-20034.pdf 48 CBO. Private Health Insurance Premiums and Federal Policy. February 2016. https://www.cbo.gov/sites/default/files/114th-congress-2015-2016/reports/51130-Health_Insurance_Premiums.pdf 49 CMS. Risk Corridors Payments for 2015. September 9, 2016. https://www.cms.gov/CCIIO/Programs-and-Initiatives/Premium-Stabilization-Programs/Downloads/Risk-Corridors-for-2015-FINAL.PDF 50 Oregon Division of Financial Regulation. Oregon's Health CO-OP FAQs. http://dfr.oregon.gov/public-resources/Pages/co-op-faqs.aspx 51 Connecticut Insurance Department. Insurance Department Places HealthyCT Under Order of Supervision. July 5, 2016. http://www.ct.gov/cid/cwp/view.asp?Q=582452&A=1269 52 Washington Post. Maryland health co-op sues over ‘flawed’ Obamacare requirement. June 13, 2016. https://www.washingtonpost.com/local/md-politics/maryland-health-co-op-sues-over-flawed-health-care-law-requirement/2016/06/13/4867982a-317e-11e6-8758-d58e76e11b12_story.html 53 Avalere. Evolving the Risk-Adjustment Model to Improve Payment Accuracy in the Individual & Small Group Market. March 2016. http://go.avalere.com/acton/attachment/12909/f-02b6/1/-/-/-/-/20160324_Avalere%20Evolving%20Risk%20Adjustment%20Model_FINAL.pdf 54 CMS. March 31, 2016, HHS-Operated Risk Adjustment Methodology Meeting. March 24, 2016. https://www.cms.gov/CCIIO/Resources/Forms-Reports-and-Other-Resources/Downloads/RA-March-31-White-Paper-032416.pdf 55 HHS. Patient Protection and Affordable Care Act; HHS Notice of Benefit and Payment Parameters for 2018. Proposed Rule. August 30, 2016. https://s3.amazonaws.com/public-inspection.federalregister.gov/2016-20896.pdf 56 Layton, T. and McGuire, T. Marketplace Plan Payment Options For Dealing With High-Cost Enrollees. National Bureau Of Economic Research. August 2016. http://www.nber.org/papers/w22519.pdf 57 HHS. Patient Protection and Affordable Care Act; HHS Notice of Benefit and Payment Parameters for 2018. Proposed Rule. August 30, 2016. https://s3.amazonaws.com/public-inspection.federalregister.gov/2016-20896.pdf 58 Wakely Consulting Group. Society of Actuaries Health Meeting. June 16, 2015. 59 Anthem. Q2 2016 Anthem Inc Earnings Call. July 27, 2016.

The State of Exchanges: A Review of Trends and Opportunities to Grow and Stabilize the Market 23
60 Centers for Medicare & Medicaid Services, Office of Information Products & Data Analytics. The HHS-HCC Risk Adjustment Model for Individual and Small Group Markets under the Affordable Care Act. Medicare & Medicaid Research Review. 2014. https://www.cms.gov/mmrr/Downloads/MMRR2014_004_03_a03.pdf 61 RWJF. Risk Adjustment and Co-op Financial Status. July 2016. http://www.rwjf.org/en/library/research/2016/07/risk-adjustment-coop-finance-status.html 62 Scott and White Health Plan. SWHP Marketplace Announcement. https://swhp.org/en-us/news-and-information 63 WellCare. WellCare of New York is exiting Qualified Health Plans. https://www.wellcare.com/en/New-York/Members/Health-Care-Exchange/Health-Insurance-Marketplace-2016/Marketplace-Plan-Update 64 WellCare. Kentucky Marketplace Plan Exit. https://www.wellcare.com/en/Kentucky/Providers/Bulletins/Kentucky-Marketplace-Plan-Exit 65 Avalere State Reform 360. 66 BlueCross BlueShield of Tennessee. What’s Changing for 2017 Individual/Marketplace Plans. http://www.bcbst.com/why-bcbst/about-us/news-center/2017ACAplans.page 67 Premera Blue Cross. Premera Blue Cross announces individual market changes for 2017. https://www.premera.com/wa/producer/products/individual-and-family-plans/2017-product-updates/ 68 UnitedHealth Group. Q1 2016 Earnings Call. 69 Kaiser Family Foundation. Analysis of UnitedHealth Group’s Premiums and Participation in ACA Marketplaces. April 2016. http://kff.org/health-reform/issue-brief/analysis-of-unitedhealth-groups-premiums-and-participation-in-aca-marketplaces/ 70 UnitedHealth Group. Q1 and Q2 2016 Earnings Calls. 71 UnitedHealth Group. Q1 and Q2 2016 Earnings Calls. 72 Humana. Q1 Earnings Report. May 4, 2016. http://press.humana.com/press-release/humana-reports-first-quarter-2016-financial-results-reaffirms-2016-financial-guidance 73 Humana. Q2 Earnings Report. August 3, 2016. http://phx.corporate-ir.net/phoenix.zhtml?c=92913&p=irol-newsArticle&ID=2187208 74 Humana. Q2 Earnings Report. August 3, 2016. http://phx.corporate-ir.net/phoenix.zhtml?c=92913&p=irol-newsArticle&ID=2187208 75 Aetna. Aetna to Narrow Individual Public Exchange Participation. August 11, 2016. http://investor.aetna.com/phoenix.zhtml?c=110617&p=irol-newsArticle&ID=2195571 76 Aetna. Aetna to Narrow Individual Public Exchange Participation. August 11, 2016. http://investor.aetna.com/phoenix.zhtml?c=110617&p=irol-newsArticle&ID=2195571 77 Aetna. Aetna to Narrow Individual Public Exchange Participation. August 11, 2016. http://investor.aetna.com/phoenix.zhtml?c=110617&p=irol-newsArticle&ID=2195571 78 Aetna Reports Second-Quarter 2016 Results. August 2, 2016. http://investor.aetna.com/phoenix.zhtml?c=110617&p=irol-newsArticle&ID=2191689 79 Mike Adelberg, former CMS official overseeing CO-OPs. Faegre Baker Daniels LLP. Federal Funding Shortfalls Push Some Affordable Care Act ‘Co-Ops' Over the Ledge, Mike Adelberg Tells The Hill. October 2015. http://www.faegrebdc.com/federal-funding-shortfalls-push-some-affordable-care-act-co-ops 80 Avalere State Reform 360. 81 House Energy and Commerce Committee. Another One Bites The Dust – CO-OPs Dwindle to 7 With Illinois Collapse, Losses Eclipse $1.7B. July 13, 2016. https://energycommerce.house.gov/news-center/press-releases/another-one-bites-dust-co-ops-dwindle-7-illinois-collapse-losses-eclipse 82 Politico. Most Surviving Co-Ops Continue To Lose Money. August 2016. 83 Avalere. Experts Predict Sharp Decline in Competition across the ACA Exchanges. August 19, 2016. http://avalere.com/expertise/life-sciences/insights/experts-predict-sharp-decline-in-competition-across-the-aca-exchanges 84 McKinsey & Company. 2017 exchange market: Emerging carrier participation. August 2016. http://healthcare.mckinsey.com/2017-exchange-market-emerging-carrier-participation 85 Kaiser Family Foundation. Preliminary Data on Insurer Exits and Entrants in 2017 Affordable Care Act Marketplaces. August 28, 2016. http://kff.org/health-reform/issue-brief/preliminary-data-on-insurer-exits-and-entrants-in-2017-affordable-care-act-marketplaces/ 86 Blue Cross and Blue Shield of Nebraska. Our Decision to Exit the ACA Marketplace. September 23, 2016. https://www.nebraskablue.com/about/news-and-media/news-releases/Our-Decision-to-Exit-ACA-Marketplace?_ga=1.203420561.1694073996.1474576332
The State of Exchanges: A Review of Trends and Opportunities to Grow and Stabilize the Market 24
87 Avalere State Reform 360. 88 Layton, T. and McGuire, T. Marketplace Plan Payment Options For Dealing With High-Cost Enrollees. National Bureau Of Economic Research. August 2016. 89 Hillary Clinton. Clinton Will Build on the Affordable Care Act While Sanders Would Start Over and Reopen a Contentious Debate. https://www.hillaryclinton.com/briefing/factchecks/2016/03/09/clinton-will-build-on-the-affordable-care-act-while-sanders-would-start-over-and-reopen-a-contentious-debate-2/ 90 “Measuring the Patient Experience in Exchanges.” Lake Research Partners. http://www.nationalhealthcouncil.org/sites/default/files/NHC-LakeResearch--Patient_Exchange_Experience.pdf 91 S.1729 - Expanded Consumer Choice Act. https://www.congress.gov/bill/113th-congress/senate-bill/1729 92 HHS. Patient Protection and Affordable Care Act; HHS Notice of Benefit and Payment Parameters for 2018. Proposed Rule. August 30, 2016.

The State of Exchanges: A Review of Trends and Opportunities to Grow and Stabilize the Market 1
Avalere is a vibrant community of innovative thinkers
dedicated to solving the challenges of the healthcare
system. We deliver a comprehensive perspective,
compelling substance, and creative solutions to help
you make better business decisions. As an Inovalon
company, we prize insights and strategies driven by
robust data to achieve meaningful results. For more
information, please contact [email protected]. You
can also visit us at avalere.com.
Avalere Health An Inovalon Company 1350 Connecticut Ave, NW Washington, DC 20036 202.207.1300 | Fax 202.467.4455 avalere.com
About Us
Contact Us