the spatial distribution of heavy metal lead and … spatial...43 introduction demak regency,...
TRANSCRIPT
43
INTRODUCTION
Demak Regency, located in Central Java, geo-graphically, lies in the coordinates of 6o43’26” South and 110o27’58”–110o48’47” East. This re-gion extends over 89,743 ha. It borders with Je-para regency and the Java Sea to the north, Kudus and Grobogan regencies to the east, Grobogan and Semarang regencies to the south and Sema-rang to the west. Demak consists of 14 subdis-tricts. A few rivers flow through Demak, includ-ing Tuntang, Buyaran, and the biggest river in Demak, Serang [https://idwikipedia.org].
Demak waters are located to the east of Port of Tanjung Emas Semarang. It became an in-fluential element of fishery industry, as it pro-duces 308.556 tons of anchovies and 139.296 tons of shrimps [BPS, 2013]. However, high
ecological pressure was also found in this area [Hastuti et al., 2013].
On the basis of the previous studies carried out in Moro Demak waters, it was revealed that the Cd content in the surface water reached 0.116 mg/l whereas the Cd content in the sediment was 1.372 mg/l. It means that it had surpassed the wa-ter quality standard. When the concentration of heavy metal Pb in the water and sediment increas-es, the accumulation of heavy metal Pb in Anadara granosa will be elevated as well [Sitorus, 2004]. It leads to a bioaccumulation in the blood clam Anadara granosa clam [Wulandari et al., 2009].
The coliform bacteria constitute the in-dicator of patogenic bacteria existence. The more coliform we found within the water, the worse the water quality would be. The coliform bacteria include various bar shaped
Journal of Ecological Engineering Received: 2018.04.01Accepted: 2018.05.15Published: 2018.07.01Volume 19, Issue 4, July 2018, pages 43–54
https://doi.org/10.12911/22998993/89715
The Spatial Distribution of Heavy Metal Lead and Cadmium Pollution and Coliform Abundance of Waters and Surface Sediment in Demak
Agus Tjahjono1*, Djoko Suwarno2
1 Engineering Department, Semarang Merchant Marine Polytechnic (Politeknik Ilmu Pelayaran Semarang), Singosari 2 a Semarang, 50242, Central Java, Indonesia
2 Civil Engineering Department, Unika Soegijapranata Chatolic University, Pawiyatan Luhur IV/1 Bendan Dhuwur, Semarang, 50234, Central Java, Indonesia
* Corresponding author’s e-mail: [email protected]
ABSTRACTVarious activities such as farming, industry, household waste, fish pond, and fishery can possibly affect the estua-rine and coastal ecosystem. Demak waters, located to the east of Tanjung Emas Semarang, become an influential element of fishery industry that mostly produces anchovies and shrimps. This research was aimed at (1) analyzing the spatial distribution of heavy metal Pb and Cd in the surface water and sediment; and (2) investigating the abun-dance of coliform in Demak waters. Moreover, in this research, water pollution index was also analyzed and com-pared to other polluted water areas. It was found that the Pb content ranged from 0.6037 to 0.6647 mg·1–1 whereas the Cd content ranged from 0.064 to 0.1707 mg·1–1. Both lead and cadmium contents had surpassed the water quality standard. The Pb content in sediment ranged from 0.563 to 0.6823 mg·kg-1 whereas the Cd content reached 0.0047 to 0.0577 mg·kg-1. It showed that this sediment was not polluted by Pb and Cd. The analysis of water pol-lution index revealed that the pollution level found in Morosari, Rejo, Tuntang, and Lohbener estuary was low. On the other hand, Wedung and Serang estuary were heavily polluted. Compared to some previous studies, most of Pb and Cd contents in Demak waters were greater. However, lead and cadmium content in sediment was lower.
Keywords: Demak waters, spatial distribution of Pb and Cd in surface water and sediment, the abundance of Coliform, water pollution index

Journal of Ecological Engineering Vol. 19(4), 2018
44
bacteria, gram-negative bacteria, non-spore-forming bacteria, and lactose-fermenting bac-teria which produce gas and acid when being incubated at 37°C in less than 48 hours [Widy-aningsih et al., 2016]. The existence of these bacteria is due to pollutants produced by hu-man activities around the river.
Heavy metals are generally defined as the metals with relatively high densities, atomic weights, or atomic numbers. Heavy metals dif-fer from other metals due to the effect they pro-duce when being bound to the living organism. The heavy metal Pb is commonly used in the industry producing batteries and cables. How-ever, the use of water-related contamination, the metal was added as an additive to the engine fuel to increase the octane value. The heavy metal Cd is used as a mixture in the chemical industry [Palar, 2012; Ridhowati, 2013].
This research was aimed at analyzing the spatial distribution of Pb and Cd in the surface water and sediment, as well as the abundance of Coliform in Demak waters. This research also analyzed the water pollution index and compared the results to the previous studies on water pollution.
MATERIALS AND METHODS
Research object
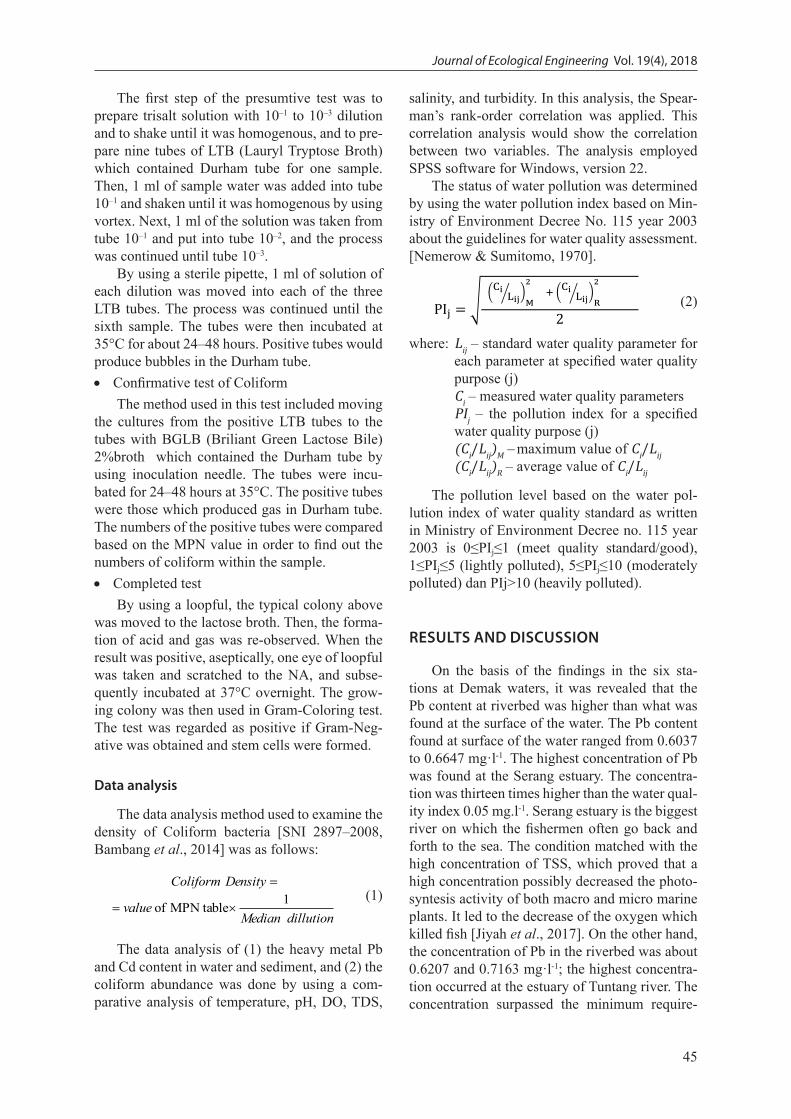
The research was held in May 2017 when the high tide occured at Demak waters, Central Java, Indonesia. The purposeful sampling was done at six stations including station 1, Morosari estuary (6°92’60” South, 110°46’07” East), Rejo estu-ary (6°85’20” South, 110°51’40” East), Tuntang estuary (6°83’24” South, 110°51’76” East), Loh-bener estuary (6°77.09’ South, 110°56’85” East), Wedung estuary (6°74.54’ South, 110°53’24” East), and Serang estuary (6°71’99” South, 110°54’37” East).
In each station, the sampling was done three times. The Morosari estuary was taken as the sampling location because firstly, it was mangrove area which is the fishery habitat and secondly, absorption of heavy metal possibly occurs in this area. Other estuaries were also used as the sampling locations since they were close to the fishermen settlement and fish farming.
Data collection methods
The materials of this research included the sample of sea water and sediments which con-tained Pb, Cd, and Coliform taken from Demak waters. In this research, primary and secondary research data were applied. The primary data in-cluded the data which were taken directly when the research took place including seawater, pH, DO, TDS, water turbidity, water depth, salinity, current, and the water transparency.
The determination of heavy metal concentra-tion (Pb and Cd) in the seawater.
Firstly, 500 mililiters of sea water was put into teflon separatory funnel. The pH scale was then set at pH 4 by adding liquid HCl. APDC (Amo-nium Pirolidin Ditio Carbamat) and NaDDC (Natrium Dietil Ditio Carbamat) were also added before it was shaken for one minute. Afterwards, 25 ml of MIBK (Metil Iso Butil Keton) was also added and the solution was shaken again for 30 seconds. The aqueous phase was then separated. Subsequently, 10 ml of distilled and deionized water was poured into the upper phase. It was shaken and the aqueous phase was then separated. After that, 1 ml of HNO3 was added, shaken, and left standing for about an hour. Then, 19 ml of distilled and deionized water was added, shaken, and aqueous phase was collected to be analyzed by using furnace AAS (Atomic Absorption Spec-troscopy) with argon gas and Pb and Cd lamps [Sitorus, 2004; APHA, 2012].
The sample of sediment was dried at 105°C for 24 hours. Then 10–20 grams of the dried sedi-ment was put into a centrifuge tube (polyethyl-ene), 500 ml of distilled and deionized water was added and shaken. It was afterwards centrifuged for 30 minutes in 2000 RPM. The aqueous phase was then discarded. It was dried at 105°C (oven-dry weight) for 24 hours. 1 gram of sediment was put into a sealed teflon beaker. Subsequently, 5 ml of aqua regia and 6 ml of HF (Hygrogen Fluoride) were added. It was then heated at 130 °C until it was dried up. Next, 9 ml of distilled and deion-ized water was added. It was then analyzed by using furnace AAS with argon gas and Pb and Cd lamps based on the types of the metal which were being analyzed [Sitorus, 2004; APHA, 2012].
The coliform bacteria determination used MPN (Most Probable Number) method [SNI-01–2332–1991; Ijong, 2015]. The method was as follows: • Presumtive test of coliform
45
Journal of Ecological Engineering Vol. 19(4), 2018
The first step of the presumtive test was to prepare trisalt solution with 10–1 to 10–3 dilution and to shake until it was homogenous, and to pre-pare nine tubes of LTB (Lauryl Tryptose Broth) which contained Durham tube for one sample. Then, 1 ml of sample water was added into tube 10–1 and shaken until it was homogenous by using vortex. Next, 1 ml of the solution was taken from tube 10–1 and put into tube 10–2, and the process was continued until tube 10–3.
By using a sterile pipette, 1 ml of solution of each dilution was moved into each of the three LTB tubes. The process was continued until the sixth sample. The tubes were then incubated at 35°C for about 24–48 hours. Positive tubes would produce bubbles in the Durham tube. • Confirmative test of Coliform
The method used in this test included moving the cultures from the positive LTB tubes to the tubes with BGLB (Briliant Green Lactose Bile) 2%broth which contained the Durham tube by using inoculation needle. The tubes were incu-bated for 24–48 hours at 35°C. The positive tubes were those which produced gas in Durham tube. The numbers of the positive tubes were compared based on the MPN value in order to find out the numbers of coliform within the sample. • Completed test
By using a loopful, the typical colony above was moved to the lactose broth. Then, the forma-tion of acid and gas was re-observed. When the result was positive, aseptically, one eye of loopful was taken and scratched to the NA, and subse-quently incubated at 37°C overnight. The grow-ing colony was then used in Gram-Coloring test. The test was regarded as positive if Gram-Neg-ative was obtained and stem cells were formed.
Data analysis
The data analysis method used to examine the density of Coliform bacteria [SNI 2897–2008, Bambang et al., 2014] was as follows:
dillutionMedianvalueDensityColiform
1 tableMPN of
dillutionMedianvalueDensityColiform
1 tableMPN of
(1)
The data analysis of (1) the heavy metal Pb and Cd content in water and sediment, and (2) the coliform abundance was done by using a com-parative analysis of temperature, pH, DO, TDS,
salinity, and turbidity. In this analysis, the Spear-man’s rank-order correlation was applied. This correlation analysis would show the correlation between two variables. The analysis employed SPSS software for Windows, version 22.
The status of water pollution was determined by using the water pollution index based on Min-istry of Environment Decree No. 115 year 2003 about the guidelines for water quality assessment. [Nemerow & Sumitomo, 1970].
PIj = √
(Ci Lij⁄ )M
2+ (Ci Lij⁄ )
R
2
2 (2)
where: Lij – standard water quality parameter for each parameter at specified water quality purpose (j)
Ci – measured water quality parameters PIj – the pollution index for a specified
water quality purpose (j) (Ci/Lij)M – maximum value of Ci/Lij (Ci/Lij)R – average value of Ci/Lij
The pollution level based on the water pol-lution index of water quality standard as written in Ministry of Environment Decree no. 115 year 2003 is 0≤PIj≤1 (meet quality standard/good), 1≤PIj≤5 (lightly polluted), 5≤PIj≤10 (moderately polluted) dan PIj>10 (heavily polluted).
RESULTS AND DISCUSSION
On the basis of the findings in the six sta-tions at Demak waters, it was revealed that the Pb content at riverbed was higher than what was found at the surface of the water. The Pb content found at surface of the water ranged from 0.6037 to 0.6647 mg·l-1. The highest concentration of Pb was found at the Serang estuary. The concentra-tion was thirteen times higher than the water qual-ity index 0.05 mg.l-1. Serang estuary is the biggest river on which the fishermen often go back and forth to the sea. The condition matched with the high concentration of TSS, which proved that a high concentration possibly decreased the photo-syntesis activity of both macro and micro marine plants. It led to the decrease of the oxygen which killed fish [Jiyah et al., 2017]. On the other hand, the concentration of Pb in the riverbed was about 0.6207 and 0.7163 mg·l-1; the highest concentra-tion occurred at the estuary of Tuntang river. The concentration surpassed the minimum require-
Journal of Ecological Engineering Vol. 19(4), 2018
46
ment of the water quality index; it was fourteen Times higher than what was required (Figure 2).
The Pb within seawater was able to accu-mulate to the benthic. The largest accumulation was found in hard branching coral which was fol-lowed by soft coral Alcyonaceae. For example, the accumulation of Acropora aspera and Pocil-lopora damicornis, within ten days, turned into 0.895 mg·kg-1 [Samawi et al., 2014; Panuntun et al, 2012]. The pollution of Pb led to the highest accumulation in the sediment. The accumulation was followed by biota and seawater [Usman et al., 2013]. The metal accumulation additionally showed the toxic effect of Pb to Cromileptus al-tivelis. The effect of Pb caused the damage of he-par cell (concentration 0.15 ppm) in the form of fatty degeneration, hydropic degeneration, hem-orrhage, congestion, and necrosis hepatica (liver cell death) [Triadayani et al., 2010]. The accumu-lation of Pb in mullet fish Mugin cephalus (Lin-naeus, 1758) in Cilacap waters was three times higher than those which were taken from 0-500 m and >1000 m from the pollution source point [Heriyanto & Subiandono, 2011].
The content of Pb in the sediment possibly af-fected the organisms living at the riverbed, such as the Strombus canarium snail. The greater con-tent of the heavy metal in the sediment, the higher content of Pb found in the organism [Nasution & Siska, 2011]. Blood clam Anadara granosa and
mangrove shell Polymesoda bengalensis were also found in the sediment. When the content of Pb within the sediment reached 0.823 mg·kg-1, an accumulation of both organisms was twice higher (1.750 mg.kg-1) [Amriani et al., 2011]. Moreover, Anadara granosa was highly prone to chromium accumulation[Suprapti, 2008].
The content of Cd found in the surface water was about 0.064 and 0.1707 mg·l-1; the highest concentration was found in the estuary of Rejo river. The concentration of Cd had surpassed the water quality index beingseventeen times higher. However, the concentration decreased as it went to the east. The condition did not occur in the es-tuary of Lohbener river. The concentration in the riverbed was about 0.055 and 0.12 mg·l-1; Cd was also found at the estuary of Tuntang river. The concentration surpassed the water quality index; it was 12 times greater than the index (Figure 3).
The Cd affected the fish such as Gulama Sci-aena russelli living in Dumai waters. The accu-mulation of Cd was mostly found in the fins and gills. In terms of Cd, Cu, Pb, and Zn, the highest accumulation was found in the gills, since it con-stitutes the respiratory organ where gas exchange occurred [Nurrachmi et al., 2011].
Cd also correlated to green shell Perna viridis in Jakarta bay. In this area, the numbers of sperma-tozoa (r = 0.64) which influenced the development of the spermatozoon were affected to the greatest
Fig. 1. Research location

47
Journal of Ecological Engineering Vol. 19(4), 2018
degree. It was followed by the sex cells (r = 0.60) [Jalius et al., 2008]. Bioaccumulation also oc-curred in green shell Amusim pleuronectes which was found in Wedung waters, Demak the content in sediment reached 0.4694 mg·kg-1 whereas the content on soft tissue became 12.61 times higher (5.9212 mg·kg-1) [Azhar et al., 2012].
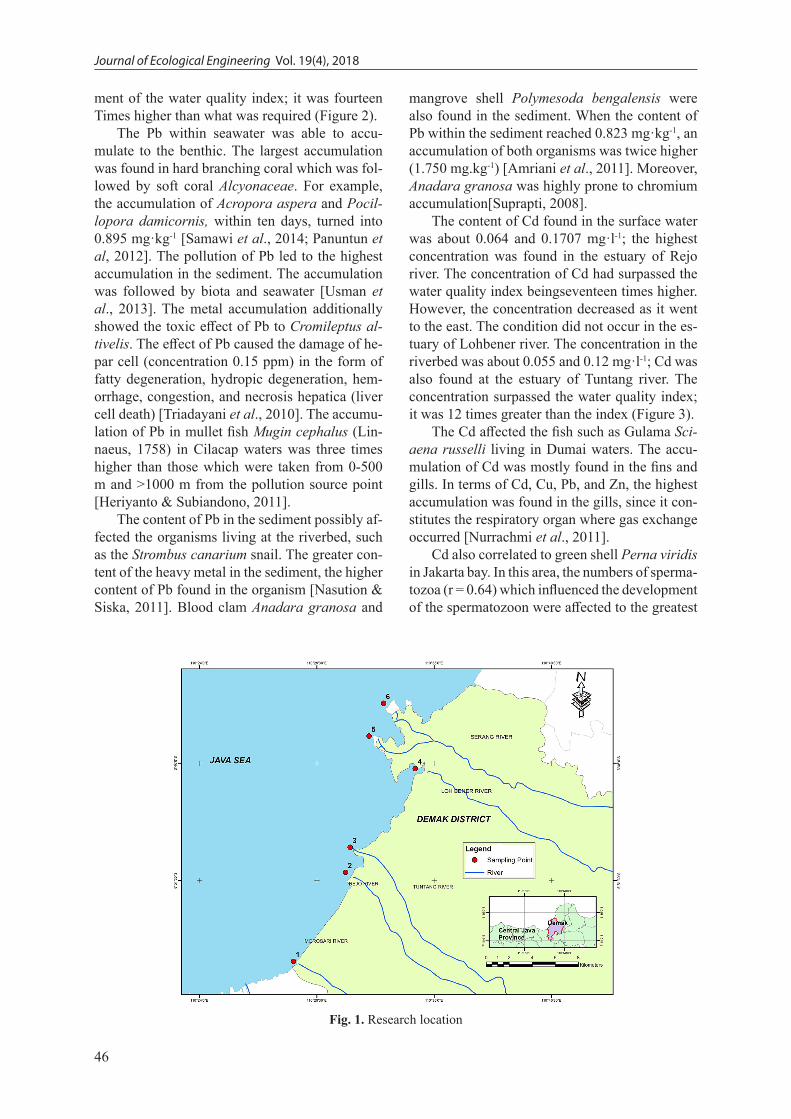
The Pb content in the surface sediment ranged from 0.2563 to 0.6823 mg·kg-1 whereas the Cd content ranged from 0.0047 to 0.0577 mg·kg-1; the maximum concentration occurred in Lohben-er estuary (Figure 4 and 5). The correlation be-tween the sediment particle (sand, mud and clay) and the heavy metal (Pb and Cd) showed that the
Fig. 2. The distribution of Pb (mg·l-1) in Demak waters
Fig. 3. The distribution of Cadmium (mg·l-1) in Demak waters
Journal of Ecological Engineering Vol. 19(4), 2018
48
heavy metal was positively correlated with sand, mud, and clay fraction. It was found that the more mud there was, they more heavy metal (Pb and Cd) we found [Kinasih et al., 2015]. The con-tent of Pb and Cd was below CEQG (Canadian Environmental Quality Guidelines) 2002 which are 30 mg·kg-1 and 0.7 mg·kg-1. It is in line with the guidelines of USEPA (United States Enviro-mental Protection Agency) (1989) which require that the Pb content should be below 40 mg·kg-1. It means that according to this condition, it was regarded as not polluted.
The distribution of coliform bacteria in the six stations starting from the estuary of Morosari river to Lohbener riverhad met the quality stan-dard, except for the station 5 Wedung and station 6 Serang, as each of them surpassing the qual-ity standard of Coliform abundance by 400 times (Figure 6). It was influenced by the polluted eco-system. Moreover, the household waste produced by human activities also affected the coliform abundance [Kunarso, 2011].
The analysis of the quality and condition of Demak waters included temperature, pH, DO, TDS, turbidity, salinity, current, water transpar-ency, and depth. The water temperature of the six estuaries was about 29.08°C and 30.15°C, which is common tropical water temperature. The solu-bility of oxygen decreased as the water tempera-ture increased. The increase of water temperature
also possibly elevated the content of some materi-als [Usman et al., 2013].
The pH ranged from 7.25 to 7.7475 which was at pH tolerance limit. However, the pH of water was quite low, below 8, which was influ-enced by the river estuary. It was due to the condi-tion of river estuary. This sea water pH influenced the chemical toxicity [Sindhu, 2005].
The water salinity was about 18.5 and 35.45 PSU. High salinity was found in the estuary of Morosari river. It was observed showed that the seawater’s influence was greater than the fresh water, because during the high tide, the sea water flow kept moving toward the river estuary.
The oxygen solubility reached 5.06 mg·l-1 and 6.268 mg·l-1. The high oxygen solubility sur-passed the minimum quality standard for aqua-culture (3 mg·l-1) [Murtini & Peranginangin, 2006]. The solubility showed that the presence of heavy metals influenced the respiration of aquatic organism. The shortage of oxygen could possibly occur due to the increase of the nutrient supply and organic material such as fish farm waste or fertilizer run-off [Rangkuti et al., 2017].
Total Dissolved Solids (TDS) is defined as any dissolved and colloid materials which are in the form of chemical compound that are not filtrated by the filter with the diameter of 0.45 [Rao, 1992]. The content of TDS was 3.861 mg·l-1 and 6.786 mg·l-1. The maximum TDS was found in the estu-
Fig. 4. Pb content in surface sediment (mg·l-1) in Demak waters

49
Journal of Ecological Engineering Vol. 19(4), 2018
ary of Morodemak river. The river depth ranged from 0.74 to 3.84 m and the water transparency was also low (Table 1).
The flow pattern during a high tide showed that the water moved to the land and the south east. When the observation took place, there was a high tide and a low tide. The highest tide oc-
curred at 09:00 and the diurnal tide occurred at 19:00. This flow pattern caused the creation of the sediment and solution, despite spreading out to the sea, they gathered downstream and at the estuary (Figure 7).
On the basis of the analysis, it was revealed that Pb in water showed a low correlation with the
Fig. 5. Cd content in surface sediment (mg·l-1) in Demak waters
Fig. 6. Coliform abundance (MPN.-1000 ml) in Demak waters

Journal of Ecological Engineering Vol. 19(4), 2018
50
temperature, TDS, salinity, and turbidity. Howev-er, Pb had a moderate correlation with DO. On the other hand, Cd in water had a very low cor-relation with TDS and the turbidity. It also had a low correlation with the temperature, DO, and salinity. Moreover, it has a significant correlation to pH. The Pb in sediment had a very low correla-tion with pH, DO, TDS, salinity, and turbidity. On the other hand, it had a moderate correlation with the temperature. It was also found that the Cd in sediment had a very low correlation with pH, DO, TDS, salinity, and turbidity. However, the Cd in sediment was highly correlated with the tempera-ture. Coliform was also highly correlated with the temperature but had a low correlation with pH, TDS, and salinity. Moreover, it had a very low correlation with DO (Table 2).
The analysis revealed that the estuaries of Mo-rosari, Rejo, Tuntang, and Lohbener were lightly polluted. However, the estuaries of Wedung and Serang were considered as heavily polluted. The pollution was caused by the abundance of coli-form, which was 2400 times higher than the wa-ter quality standard of 1000 MPN·ml-1. Moreover, the content of TDS also had surpassed the Class II water quality standard, based on Government Regulation No. 82 year 2001 about managing the quality of water and controlling water pollution. This regulation defines the requirement of water usable for fisheries. The highest content of TDS was found in the Morodemak estuary, whereas the lowest was found in the Rejo estuary (Table 3).
Comparing to other studies, the Pb content in Demak rivers was higher than what was found in
Table 1. The quality and physical condition of Demak Waters
Parameter/ Station 1 2 3 4 5 6Temperature (0C) 29.08±0.492 29.35±0.129 29.98±0.39 29.95±0.351 29.8±0.762 30.15±0.47pH 7.458±0.069 7.38±0.008 7.43±0.17 7.25±0.087 7.375±0.081 7.7475±0.05DO (mg.l-1) 5.06±0.312 6.268±0.102 6.033±0.35 5.635±0.232 5.51±0.872 6.2475±0.59TDS (mg.l-1) 6,786±286.3 4,596±398.9 3,861±2,553 4,240±1,991 5,796±739.1 5,310±308Turbidity (NTU) 3.623±1.539 1.918±0.319 4.503±1.82 5.035±2.413 10.64±6.371 32.5±4.79Salinity (ppt) 35.45±0.129 17.65±0.129 19.15±0.47 18.5±0.294 19.1±0.52 18.75±0.13Current (m.s-1) 0.083 0.125 0.143 0.333 0.25 0.125Transparency (m) 1.05 2.45 1.8 0.91 0.59 0.47Depth (m) 2.7 3.84 2.9 1.7 0.74 1.2
Fig. 7. Currents in Demak waters

51
Journal of Ecological Engineering Vol. 19(4), 2018
some other water areas in Indonesia, such as Ba-bon waters and estuary, port of Parepare, Katin-gan & Kahayan waters, Kendari and Kelabat bay. Moreover, the Pb content in Demak waters was 1640 higher than the Pb content in Kelantan, but was equal to the one in Jinzhou bay. The content of Cd in Demak water was also greater than in
those areas, except for Kelabat and Jinzhou bay. However, the content of Pb in the sediment found in Demak was lesser than in the areas above, ex-cept for Tanjung Tias waters. The Cd content in the sediment investigated in this research was also lower than the contents which revealed in previous studies (Table 4).
Table 3. Pollution Index Test
No. Parameters1 2 3 4 5 6
Lij
1 2 3 4 5 6Cimax PIj
1 Turbidity 4.96 2.25 6.09 7.14 16.14 36.6 4
3.14 2.95 2.95 2.85 145.95 146.45
2 pH 7.56 7.39 7.58 7.33 7.45 7.8 73 TDS 7050 4962 6193 6058 6472 5592 10004 DO 5.34 6.36 6.32 5.82 6.27 6.81 65 Salinity 35.5 17.9 19.5 18.9 20 18.9 346 Cd 0.15 0.171 0.12 0.13 0.064 0.065 0.017 Pb 0.7 0.648 0.72 0.64 0.64 0.695 0.058 Coliform 4 3 1,100 1,100 2,400,000 2,400,000 1,000
Table 2. Spearman correlation between heavy metal and Coliform toward physicochemical variables
Temperature pH DO TDS Salinity TurbidityPb in water -0.314 0.086 0.429 -0.429 -0.143 -0.429Cd in water 0.257 0.943** 0.2 0.143 0.314 0.143Pb in sediment 0.543 -0.6 -0.029 -0.314 -0.371 -0.314Cd in sediment 0.714 -0.371 0.143 -0.371 -0.429 -0.371Coliform 0.771 0.257 -0.029 0.029 0.2 0.029
** significant at 0.01 (2 tailed)
Table 4. Comparison of the current research to the previous studies
WatersConcentration in Sea Water
(mg·l-1)Concentration in Surface Sediment
(mg·kg-1) ReferencesPb Cd Pb Cd
Demak estuary 0.6506±0.0229 0.0938±0.0264 0.3918±0.1493 0.0247±0.0202 Recent studyBabon estuary 0.02901±0.0114 NA NA NA Kartikasari et al., 2002Tangerang coastal NA NA 7.822±6.2786 0.1±1.4629 Hariyadi et al., 2017Ambon island NA 0.01–0.03 NA 0.17–0.32 Rumahlatu, 2011Morodemak NA 0.011 NA 1.372 Wulandari et al., 2009Parepare port 0.3468±0.2591 NA 46.5199±12.4573 NA Usman et al., 2013Katingan & Kahayan 1.2942±0.1869 0.0053±0.0003 6.1861±1.3302 0.06±0.0037 Harteman et al., 2008
Kendari bay 0.0125±0.005 NA 0.7605±0.0587 NA Amriani et al., 2011 Betahlawang NA NA 4.78–6.26 2–3.1 Kinasih et al., 2015Sayung estuary NA NA 19.899±2.4741 NA Amalia et al., 2014Tanjung Tias BDL 0.067 0.126 0.094 Achyani & Salim, 2014Kelabat Bay 3.925±1.1471 0.825±0.9743 NA NA Arifin, 2011Tanjung Emas port NA NA 10.88±3.09 1.05±2.29 Tjahjono et al., 2017Yalujiang estuary 0.0004–0.0018 0.0008–0.0013 12.3–29.9 0.05–0.41 Li et al., 2017Kelantan estuary NA NA 52.0133±12.1 0.0733±0.0306 Wang et al., 2017Jinzhou Bay 0.61 0.92 NA NA Wang et al., 2012
Remarks: NA (Not Avaliable), BDL (Below Detection Limit)

Journal of Ecological Engineering Vol. 19(4), 2018
52
CONCLUSION
The lead content in Demak waters was higher in the riverbed than the content found on the river surface. The content of Pb in the river surface ranged from 0.6037 to 0.6647 mg·l-1 whereas the content of Cd in the river surface ranged from 0.064 to 0.1707 mg·l-1. Both the content of Pb and Cd surpassed the water quality standard. The Pb content in the sediment ranged from 0.2563 to 0.6823 mg·kg-1 whereas the Cd content ranged from 0.0047 to 0.0577 mg·kg-1. Both contents found in the sediment revealed that the sediments were not polluted. The pollution index test showed that Morosari, Rejo, Tuntang and Lohbener estu-aries were considered as lightly polluted, whereas Wedung and Serang estuaries were heavily pol-luted. Most of the Pb and Cd contents in Demak waters were higher than in the previous studies. However, the Pb and Cd content in the sediment considered in the current research was lower than what had been found in the previous studies.
Acknowledgment
First of all, the writer’s deepest gratitude goes to Funding of Budget Project Instructions (DIPA) PIP Semarang year of 2017 without whom this research would never be conducted. The writer also would like to express gratitude to the team of Faculty of Fisheries and Marine Diponegoro University, especially to Vian and Andreas who had willingly helped in collecting the samples. Last but not least, to Health Laboratory Semarang which had done the measurement of heavy metal content in both seawater and sediment and coli-form abundance, thank you. This research could not have been completed without your help.
REFERENCES
1. Achyani R., Gazali S. 2014. Evaluation and accu-mulation of heavy metals on Anadara Granosa and Anadara inaequivalvis in Tarakan waters (In Indo-nesian). Jurnal Harpodon Borneo, 7(1), 19–26.
2. Amalia R., Widada S., Hariyadi. 2014. Analysis of heavy metal Lead in riverbed sediment of Sayung estuary, Demak regency (In Indonesian). Jurnal Oseanografi, 3(2), 167–172.
3. Amriani, Hendrarto B., Hadiyarto A. 2011. Bioac-cumulation of heavy metals Lead (Pb) and Zinc (Zn) in blood cockles (Anadara granosa L.) and mangrove cockles (Polymesoda bengalensis L.) in
Kendari Bay waters (In Indonesian). Jurnal Ilmu Lingkungan, 9(2), 45–50.
4. APHA (American Public Health Association). 2012. Standard methods for examination of water and waste water, 22nd edition. Street NW (US) : Water Environment Federation, pp. 1496.
5. Arifin Z. 2011. The concentration of heavy met-als in water, sediment, and biota in Kelabat Bay, Bangka Island (In Indonesian). Jurnal Ilmu dan Teknologi Kelautan Tropis, 3(1), 104–114.
6. Azhar H., Widowati I., Suprijanto J. 2012. Study of the contents of heavy metal Pb, Cu, Cd, Cr in simping scallop (Amusim pleuronectes), water, and sediments found in Wedung waters Demak and maximum toler-able intake analysis in humans (In Indonesian). Jour-nal of Marine Research, 1(2), 35–44.
7. Bambang A.G., Fatimawali, Kojong N. 2014. Analysis of Coliform contamination and Esche-richia coli identification in water refills of Manado city depots (In Indonesian). Universitas Sam Ratu-langi, Manado. Jurnal Ilmiah Farmasi, 3(3).
8. BPS (Biro Pusat Statistik). 2013. Area of Demak regency in 2013 (In Indonesian). https://demakkab.bps.go.id, diakses 14 January 2018.
9. BPS (Biro Pusat Statistik). 2015. Fish production based on type of fresh fish sold in 2 fish auction in Demak regency 2015 (In Indonesian). https://de-makkab.bps.go.id acessed January 14th 2018.
10. Effendi H. 2003. Assessment of water quality for water source and environmental management (In Indonesian). Penerbit Kanisius, Yogyakarta.
11. Hariyadi S., Muflih A., Mashar A., Widigdo B., Wardiatno Y. 2017. Spatial distribution of some heavy metals in the sediments of Tangerang coastal waters, Banten Province, Indonesia. AES Bioflux, 9(2).
12. Hartenan E., Soedharma D., Winarto A., Sanusi H.S. 2008. Detection of heavy metals in waters, sediments, and fish fins of Badukang (Arius caela-tus HAN A. Maculatus) at the esturies of the Ka-hayan and Katingan rivers, Central Kalimantan (In Indonesian). Berita Biologi, 9(3), 275–283.
13. Hasan S. 2004. Analysis of characteristics of aquatic environment affecting on the accumulation of heavy metals Lead in the body of blood clam in the coastal waters of eastern North Sumatra (In Indonesian). Jurnal Ilmu-Ilmu Perairan dan Peri-kanan Indonesia, 1(1), 53–60.
14. Hastuti E.D., Anggoro S., Pribadi R. 2013. The influence of vegetation type and density on the content of Cd and Cr sediment in coastal areas of Semarang and Demak (In Indonesian). Prosiding Seminar nasional Pengelolaan Sumber daya alam dan lingkungan.
15. Heriyanto N.M., Subiandono E. 2011. Absorption of heavy metal pollutants (Hg, Pb and Cu) by man-grove species (In Indonesian). Jurnal Penelitian

53
Journal of Ecological Engineering Vol. 19(4), 2018
Hutan dan Konservasi Alam, 8(2), 177–188.16. Ijong F.G. 2015. Fisheries & marine microbiology
(In Indonesian). Rineka Cipta, Jakarta.17. Jalius, Setiyanto D.D., Sumantadinata K., Riani E.,
Ernawati Y. 2008. The heavy metal of accumula-tion and its effects to spermatogenesis on the green mussel (Perna viridis). Jurnal Ilmu-Ilmu Perairan dan Perikanan Indonesia, 15(1), 77–83.
18. Jiyah, Sudarsono B., Sukmono A. 2017. Distribution analysis of Total Suspended Solid (TSS) in coastal waters of Demak regency using LANDSAT imagery (In Indonesian). Jurnal Geodesi Undip, 6(1).
19. Kartikasari V., Tandjung S.D., Sunarto. 2002. The accumulation of heavy metals Cr and Pb on man-grove Avicennia Marina at Babon estuary the bor-der of Semarang and Demak regency of Central Java (In Indonesian). Manusia dan Lingkungan, IX, Nov, 137–147.
20. Keputusan Menteri Negara Lingkungan Hidup No-mor 115 Tahun 2003 tentang [Guidelines on Water Quality Status Determination] [In Indonesian].
21. Keputusan Menteri Negara Lingkungan Hidup Nomor 51 Tahun 2004 tentang Water Quality Stan-dard for Coastal water (In Indonesian).
22. Kinasih A.R.N., Purnomo P.W., Ruswahyuni. 2015. Analysis of the relationship texture sediment with organic materials, heavy metal (Pb and Cd) and macrozoobenthic at Betahlawang river, De-mak. Diponegoro Journal of Maquares Manage-ment of Aquatic Resources, 4(3), 99–107.
23. Kunarso D.H. 2011. The quality of waters in Makassar strait viewed from bacteriological aspect (In Indonesian). Biosfera, 28(1), 32–34.
24. Li H., Li L., Ye S., Li H., Fan J.. 2017. Assessment of nutrient and heavy metal contamination in the seawater and sediment of Yalujiang Estuary. Ma-rine Pollution Bulletin, 117, 499–506.
25. Murtini J.T., Peranginangin R. 2006. Heavy metal contents in Asiatic Hard Clams (Meritrix meritric) and sea water in Banjarmasin (In Indonesian). Jur-nal Perikanan, VIII (2), 177–184.
26. Nasution S., Siska M. 2011. The content of heavy metal lead (Pb) in sediments and snails (Strombus canarium) in the coastal waters of Bintan island (In Indonesian). Jurnal Ilmu Lingkungan, 5(2), 82–93.
27. Nemerow N.L. & Sumitomo H. 1970. Benefits of wa-ter quality enhancement. Report no. 16110 DAJ, pre-pared for the U.S. Environmental Protection Agency.
28. Nurrachmi I., Amin B., Habibi M.N. 2011. Bioacu-mulation of Cd, Cu, Pb and Zn in some parts of Gu-lama (Sciaena russelli) body from Dumai waters, Riau (In Indonesian). Maspari Journal, 02(01–10).
29. Palar H. 2012. Pollution and toxicology of heavy metals (In Indonesian). Rineka Cipta, Jakarta.
30. Panuntun P., Yulianto B., Ambariyanto. 2012. Ac-
cumulation of heavy metal Pb on coral Acropora aspera: a preliminary study (In Indonesian). Jour-nal of Marine Research, 1(1), 153–158.
31. PP (Peraturan Pemerintah) Nomor 82 Nomor 2001 about Water quality management and pollution control (In Indonesian).
32. Priyatno D. 2008. Independently learning SPSS (Statistical Product and Service Solution) for data analysis & statistical test (In Indonesian). Media-kom, Yogyakarta.
33. Priyatno D. 2010. Easy and fast technique to per-form data analysis with SPSS and question and answer on exams (In Indonesian). Penerbit Gava Media, Yogyakarta.
34. Rangkuti A.M., Cordova M.R., Rahmawati A., Yulma, Adimu H.E. 2017. Coastal and marine eco-systems of Indonesia (In Indonesian). Bumi Ak-sara, Jakarta.
35. Rao C.S. 1992. Environmental pollution control engi-neering. Wiley Eastern Limited, New Delhi, pp. 431.
36. Ridhowati S. 2013. Identifying Metal Pollution (In Indonesian). Graha Ilmu, Yogyakarta.
37. Rumahlatu D. 2011. Concentrations of heavy met-als Cadmium in water, sediment and Deadema se-tosum (Echinodermata, Echinoidea) in the waters of Ambon island (In Indonesian). Ilmu Kelautan, Juni, 16(2), 87–85.
38. Samawi M.F., Tambaru R., Husain A.A., Burhan-uddin A.A. 2014. Distribution of heavy metal Lead (Pb) in benthic organisms and sediments of Bone-batang waters (In Indonesian). Prosiding Simpo-sium Nasional Kelautan dan Perikanan 2014, Uni-versitas Hasanuddin Makassar.
39. Sindhu S.F. 2005. The content of heavy metals Cu, Zn and Pb in water, tilapia (Oreochromis niloticus) and common carp (Cyprinus carpio) in floating net cages, Saguling Reservoir (In Indonesian). Skripsi, diterbitkan Jurusan Manajemen Sumberdaya Per-airan FKIP IPB, Bogor.
40. SNI (Standar Nasional Indonesia) 2897–2008. Method of microbial contamination assessment in meat, eggs, milk and dairy products (In Indonesian).
41. SNI (Standar Nasional Indonesia)-01–2332–1991. Determination of Coliform and Escherichia coli (In Indonesian).
42. Suprapti N.H. 2008. Chromium content in waters, sediments and blood clams (Anadara granosa) in coastal area around the estuary of Sayung River Morosari Village Demak Regency, Central Java (In Indonesian). BIOMA, 10(2), 36–40.
43. Tjahjono A., Bambang A.N., Anggoro S. 2017. Pollution assessment in surface sediments of trace metal in port of Tanjung Emas Semarang. Ad-vanced Science Letters, 23, 2215–2219.
44. Triadayani A.E., Aryawati R., Diansyah G. 2010.

Journal of Ecological Engineering Vol. 19(4), 2018
54
The influence of metal Lead (Pb) in humpback grouper’s liver tissue (Cromileptes altivelis) (In In-donesian). Maspari Journal, 1, 42–47.
45. USEPA. 1989. Sediments classification methods compendium. Draft final report. United States En-vironmental Protection Agency, Watershed Protec-tion Division, USA.
46. Usman S., Nafie N.L., Ramang M. 2013. Quan-titative Distribution of heavy metals Pb in water, sediment and Crimson Snapper (Lutjanus eryth-ropterus) around Parepare waters (In Indonesian). Marina Chimica Acta, 14(2).
47. Wang A-j, Bong C.W., Xu Y-h., Hassan M.H.A., Ye X., Bakar A.F.A., Li Y-h., Lai Z-k., Xu J., Loh K.H. 2017. Assessement of heavy metal pollution
in surficial sediments from a tropical river-estau-ary-shelf system: a case study of Kelantan River, Malaysia. Marine Pollution Bulletin, http://dx.doi.org/10.1016/j.marpolbul.2017.08.010.
48. Wang J., Liu R.H., Yu P., Tang A.K., Xu L.Q., Wang J.Y. 2012. Study on the pollution character-istics of heavy metals in seawater of Jinzhou Bay. Procedia Environmental Sciences, 13, 1507–1516, doi 10.1016/j demak, accesed Januari 14th 2018.
49. Wulandari S.Y., Yualianto B., Santoso G.W., Su-wartimah K. 2009. The content of heavy metals Hg and Cd in water, sediment and blood clam (Anada-ra granossa) using Neutron Activation Analysis Method (APN) (In Indonesian). Ilmu Kelautan, 14(3), 170–175.