the southern african power pool - united states energy ... overview.pdf · southern african power...
TRANSCRIPT

SOUTHERN AFRICAN POWER POOL
The Southern African Power Poolwww.sapp.co.zw
Overview of the SAPP
byEng. Musara Beta
MSC Exchange Visit to the USA23 February 2013 to 2 March 2013

SOUTHERN AFRICAN POWER POOL
1. INTRODUCTION TO SAPP
2. SAPP DEMAND & SUPPLY SITUATION
3. SAPP TRADING ARRANGEMENTS
4. SAPP CHALLENGES
5. CONCLUSION
CONTENTS

SOUTHERN AFRICAN POWER POOL
INTRODUCTION TO THE SAPPKey Facts
DR CongoTanzania
ZambiaAngola Malawi
Zimbabwe
MozambiqueBotswanaNamibia
South AfricaLesotho
Swaziland
12 Countries
280 Million people
Installed Generation Capacity – 56 GW
Available Generation Capacity – 51 GW
Peak Demand – 54 GW

SOUTHERN AFRICAN POWER POOL
Thermal Southern Network
DRC
Tanzania
AngolaZambia
Malawi
Mozambique
Zimbabwe
Botswana
Namibia
South AfricaSwaziland
Lesotho
Hydro Northern Network
Historic

SOUTHERN AFRICAN POWER POOL
The two networks were linked by weak lines 220kV &132kV via Botswana until 1995 when the 400kV wasconstructed.
The interconnection of the northern and southern networkscreated a platform for regional trade and cooperation.
In 1995, the Ministers responsible for energy in theSouthern African Development Community (SADC) signedan Inter-Government MOU that led to the creation of apower pool under the name, Southern African Power Pool(SAPP).
The Aim was to optimise the use of available energyresources in the region and support one another duringemergencies.
HISTORIC

SOUTHERN AFRICAN POWER POOL
The SAPP Vision is to:
Facilitate the development of a competitive electricity market in the Southern African region.
Give the end user a choice of electricity supply.
Ensure that the Southern African Region is the region of choice for investment by energy intensive users.
Ensure sustainable energy developments through sound economic, environmental & social practices.
SAPP Vision

SOUTHERN AFRICAN POWER POOL
No Full Name of Utility Status Abbreviation Country
1 Botswana Power Corporation OP BPC Botswana
2 Electricidade de Mocambique OP EDM Mozambique
3 Electricity Supply Corporation of Malawi NP ESCOM Malawi
4 Empresa Nacional de Electricidade NP ENE Angola
5 ESKOM OP Eskom South Africa
6 Lesotho Electricity Corporation OP LEC Lesotho
7 NAMPOWER OP Nam Power Namibia
8 Societe Nationale d’Electricite OP SNEL DRC
9 Swaziland Electricity Board OP SEB Swaziland
10 Tanzania Electricity Supply Company Ltd NP TANESCO Tanzania
11 ZESCO Limited OP ZESCO Zambia
12 Zimbabwe Electricity Supply Authority OP ZESA Zimbabwe13 Copperbelt Energy Corporation ITC CEC Zambia14 Lunsemfwa Hydro Power Station IPP LHPS Zambia15 Hidro Cahora Bassa OB HCB Mozambique16 Mozambique Transmission Compamy OB MOTRACO Mozambique
SAPP Membership -2013
OP: Operating NP: Non-Operating ITC: Independent Transmission Company
OB: Observer IPP: Independent Power Producer

SOUTHERN AFRICAN POWER POOL
SAPP Governance Structure
SADC-DIS
Executive Committee RERA
Management Committee
Planning Sub-
Committee
Operating Sub-
Committee
Coordination Centre Board
Coordination Centre
Environmental Sub-
Committee
Markets Sub-
Committee

SOUTHERN AFRICAN POWER POOL
Inter-Governmental MOU Established SAPP. Signed by SADC Member Countries in 1995. Revised document signed on 23 February 2006.
Inter-Utility MOU Established the Management of SAPP. Revised document signed on 25 April 2007.
Agreement Between Operating Members Signed by Operating Members. Revised document signed May 2008
Operating Guidelines Under Review.
Market Guidelines (New in the SAPP Hierarchy) Under Development.
Governing Documents

SOUTHERN AFRICAN POWER POOL
Funding of SAPP Activities
SAPP Coordination Centre activities are funded as follows:
Annual contribution from Members using an agreed formula.
Administration fees levied on market participants.
Donor support:
The Government of Norway (NORAD).
Sida (Sweden)
The World Bank
DBSA, AfDB, USAID, DFID, DANIDA and others

SOUTHERN AFRICAN POWER POOL
SAPP Demand and Supply Situation
No. Country Utility
Installed Capacity
[MW] As at Jan 2013
Available Capacity
[MW] Jan 2013
Suppressed Demand & Forecast Demand
Capacity Shortfall including reserves,
MW
Calculated Reserve Margin, %
1 Angola ENE 1,793 1,480 13412 Botswana BPC 352 322 6043 DRC SNEL 2,442 1,170 13984 Lesotho LEC 72 72 1385 Malawi ESCOM 287 287 4126 Mozambique EDM /HCB 2308 2,279 6367 Namibia NamPower 393 360 6358 South Africa Eskom 44,170 41,074 424169 Swaziland SEC 70 70 25510 Tanzania TANESCO 1380 1,143 144411 Zambia ZESCO / CEC/LHPC 1,870 1,845 2287
#REF! Zimbabwe ZESA 2,045 1,600 2267
57,182 51,702 53,833 (7,709) -4.1%
53,722 48,792 50,636 (7,079) -3.8%
TOTAL SAPP
Total Interconnected SAPP

SOUTHERN AFRICAN POWER POOL
Demand and Supply Balance Forecast with Planned Projects
Projects identified to address the challenges
-7996
-5393
-1997
1268
3662
-9000-8000-7000-6000-5000-4000-3000-2000-1000
010002000300040005000
2013 2014 2015 2016 2017
Capacity Shortfall / Surplus, MW
-4284
-2418
-115
1001
3059
-5000
-4000
-3000
-2000
-1000
0
1000
2000
3000
4000
2013 2014 2015 2016 2017
Capacity Shortfall / Surplus, MWSAPP OPERATING MEMEBRS ONLY
No Country
2013 2014 2015 2016 TOTAL1 Angola 0 645 550 2415 3,610 2 Botswana 600 - - 300 900 3 DRC 55 - 580 - 635 4 Lesotho - 25 300 - 325 5 Malawi 64 - - - 64 6 Mozambique - 150 300 300 750 7 Namibia 60 - - - 60 8 RSA 923 3,105 2,543 1,322 7,893 9 Swaziland - - - - -
10 Tanzania 60 160 500 1,110 1,830 11 Zambia 230 315 600 164 1,309 12 Zimbabwe - 300 690 900 1,890
1,992 4,700 6,063 6,511 19,266 TOTAL
NEW GENERATION CAPACITY, MW

SOUTHERN AFRICAN POWER POOL
Reserve Margins with Planned Projects
Tight Reserve Margin Position forSAPP Members - GenerationCapacity shortfalls up to 2016.
-4.6
0.6
6.8
12.3
16.0
-6.0
-3.0
-
3.0
6.0
9.0
12.0
15.0
18.0
2013 2014 2015 2016 2017
All SAPP - Reserve Margin, %Best practice
reserve margin
SAPP weighted average reserve
margin
1.7
5.6
10.0 12.0
15.5
-
3.0
6.0
9.0
12.0
15.0
18.0
2013 2014 2015 2016 2017
Operating Members Only - Reserve Margin, %
Best practice reserve margin
SAPP weighted average reserve
margin

SOUTHERN AFRICAN POWER POOL
Bilateral contracts
EARLY YEARS
Bilateral contracts Short-Term Energy Market (STEM) - 2001 Post STEM (Balancing Market) - 2002
FROM YEAR 2001
Bilateral contracts Day-Ahead Market (DAM) – From 2009 Energy Imbalance Settlement – From 2010 Ancillary Services Charges – From 2013 Balancing Market – From 2014 Financial Markets – more futuristic
CURRENT AND FUTURE
SAPP Trading Arrangements

SOUTHERN AFRICAN POWER POOL
Co-operative Competitive
Migration from pure cooperation to competition
SOUTHERN AFRICAN POWER POOL
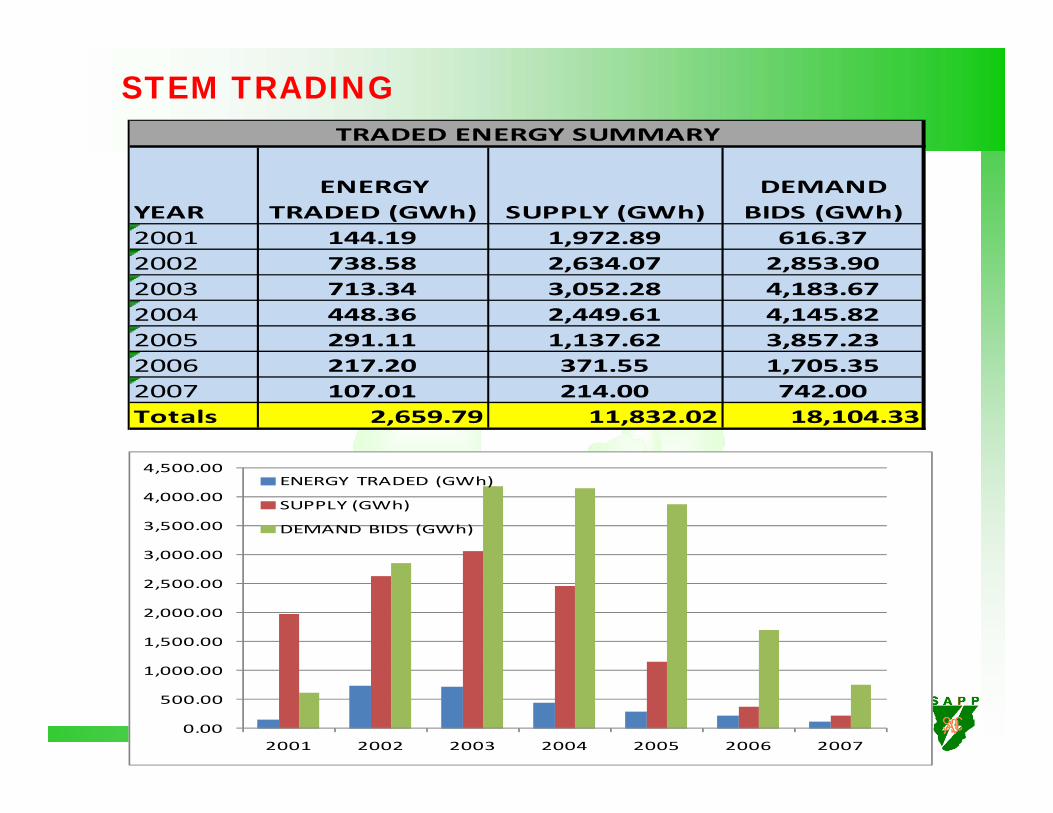
STEM TRADING
YEARENERGY
TRADED (GWh) SUPPLY (GWh)DEMAND BIDS (GWh)
2001 144.19 1,972.89 616.372002 738.58 2,634.07 2,853.902003 713.34 3,052.28 4,183.672004 448.36 2,449.61 4,145.822005 291.11 1,137.62 3,857.232006 217.20 371.55 1,705.352007 107.01 214.00 742.00Totals 2,659.79 11,832.02 18,104.33
TRADED ENERGY SUMMARY
0.00
500.00
1,000.00
1,500.00
2,000.00
2,500.00
3,000.00
3,500.00
4,000.00
4,500.00
2001 2002 2003 2004 2005 2006 2007
ENERGY TRADED (GWh)
SUPPLY (GWh)
DEMAND BIDS (GWh)

SOUTHERN AFRICAN POWER POOL
DAM TRADING
Year
ENERGY TRADED (GWh)
SUPPLY (GWh)
DEMAND (GWh)
2009‐2010 0.55 31.45 7.732010‐2011 27.40 395.64 258.422011‐2012 10.41 285.68 525.102012‐2013 22.45 563.81 360.08Totals 60.80 1,276.58 1,151.32
TRADED ENERGY SUMMARY
0.00
100.00
200.00
300.00
400.00
500.00
600.00
2009‐2010 2010‐2011 2011‐2012 2012‐2013
ENERGY TRADED (GWh)
SUPPLY (GWh)
DEMAND (GWh)

SOUTHERN AFRICAN POWER POOL
CHALLENGESThe SAPP is faced with the following main challenges:
a. The migration from a cooperative to a competitive pool.
b. The implementation of a competitive market at a time that the region is running out of generation reserve surplus capacity – difficult for members to trust short term markets e.g DAM.
c. Generation shortfall and Transmission Capacity Constraints
To address the problem of diminishing generation surplus capacity, the region would need to:
Create an enabling environment for investors to invest ingeneration and transmission infrastructure.
Embrace the principle of cost reflective tariffs, and
Adopt regulatory principles that would enhance costreflective tariffs.
d. The restructuring of the SAPP and the recognition and admission of new members into the SAPP.

SOUTHERN AFRICAN POWER POOL
Challenges of Operating the Transmission Grid
Dem Rep of CongoCongoGabon
Luanda
Windhoek
Lusaka
Harare
Lilongwe
Nairobi
Dar es Salaam
GaboronePretoria
Johannesburg
Cape Town
MaputoMbabane
KinshasaBrazzaville
Angola
Tanzania
Kenya
Mozambique
South Africa
Swaziland
Lesotho
Namibia
Zambia
BotswanaZimbabwe
Malawi
RwandaBurundi
H
H
H
HH
H
H
H
H
H H
H
H
HH
H
PH
H
T
T
T
T
TT TT
TTTTT T
T
T
HH
H
TH
P
N
HH
Transmission Interconnections covering large geographical area.
Adherence to operational discipline vital.
Transmission Congestion Management critical.
Good metering and telecommunication systems needed.
Trust and transparency needed
Transmission capacity challenges – how to prioritise allocation
SOUTHERN AFRICAN POWER POOL
Conclusions
SAPP believes that the creation of a competitivemarket would:
Help to optimise the use of regional resources
Assist in determining the correct electricityprice in the pool
Send signals for investments and real timeutilization of existing assets; transmission,generation and consumption.
Enable the demand side to respond to thesupply side price signals.