the socialization of performance goals
TRANSCRIPT

HAL Id: hal-01523730https://hal.archives-ouvertes.fr/hal-01523730
Submitted on 16 May 2017
HAL is a multi-disciplinary open accessarchive for the deposit and dissemination of sci-entific research documents, whether they are pub-lished or not. The documents may come fromteaching and research institutions in France orabroad, or from public or private research centers.
L’archive ouverte pluridisciplinaire HAL, estdestinée au dépôt et à la diffusion de documentsscientifiques de niveau recherche, publiés ou non,émanant des établissements d’enseignement et derecherche français ou étrangers, des laboratoirespublics ou privés.
The Socialization of Performance GoalsNicolas Sommet, Vincent Pillaud, Bart Meuleman, Fabrizio Butera
To cite this version:Nicolas Sommet, Vincent Pillaud, Bart Meuleman, Fabrizio Butera. The Socialization of PerformanceGoals. Contemporary Educational Psychology, Elsevier, 2017, �10.1016/j.cedpsych.2017.03.008�. �hal-01523730�

PERFORMANCE GOALS SOCIALIZATION 1
Accepted for publication in: Contemporary Educational Psychology
The Socialization of Performance Goals
Nicolas Sommet
Vincent Pillaud
Université de Lausanne
Bart Meuleman
Universiteit Leuven
Fabrizio Butera
Université de Lausanne
Acceptance Date: March 20, 2017
Nicolas Sommet, Vincent Pillaud and Fabrizio Butera, Laboratoire de Psychologie Sociale
(UNILaPS), Université de Lausanne, Switzerland. Bart Meuleman, Centre for Sociological
Research, University of Leuven, Belgium. Correspondence concerning this article should be
addressed to Fabrizio Butera, Université de Lausanne - ISS-SSP, Geopolis. CH 1015 -
Lausanne, Switzerland. E-mail: [email protected]. Phone number: + 41 21 692 3248.

PERFORMANCE GOALS SOCIALIZATION 2
Abstract
How are competitive goals transmitted over time? As most competence-relevant
contexts (e.g., school) are hierarchy-relevant (e.g., teacher/students), supervisors’
performance-approach goals (desire to outperform others) should play a major role. We
formulated a performance goals socialization hypothesis: The higher a supervisor’s
performance-approach goals, the stronger the effects of time on followers’ performance-
approach and -avoidance (desire not to be outperformed by others) goals. Study 1, involving
coaches and their soccer players, showed that indeed a performance goals socialization
phenomenon exists. Study 2, involving thesis supervisors and their Ph.D. students, showed its
consequences: performance goals socialization reduced subordinates’ motivation and well-
being over time. Study 3, involving video game team leaders and their players, showed its
enabling condition: the stronger the subordinates’ identification to their team, the more
pronounced the performance goals socialization. Study 4, involving schoolteachers and their
pupils, showed its directional moderator: the higher the subordinates’ perceived self-
competence, the higher the change in performance-approach goals over time, and the lower
that in performance-avoidance goals. It is then crucial to consider social hierarchy when
studying goal formation.
Keywords: Performance goals, leadership, socialization, social identification, self-
competence.

PERFORMANCE GOALS SOCIALIZATION 3
The Socialization of Performance Goals
1. Introduction
Asserting one’s competence relative to others is one of the most deeply rooted goals in
the Western world. From university laboratories (Hirsh, 2005) to sports fields (Grehaigne,
Godbout, & Bouthier, 1997), performance-approach goals are culturally promoted (Kasser,
Cohn, Kanner, & Ryan, 2007). Yet, these goals also have some social costs, as they have been
linked to academic dishonesty (Murdock & Anderman, 2006) or moral disengagement in
sporting activity (Kavussanu, 2006). We are then left to wonder how performance goals could
be reproduced. We argue that group supervisors are agents of goals socialization in
achievement settings: The more supervisors pursue performance-approach goals, the more
their subordinates will develop performance-based goals over time. In this article, we use the
general terms supervisor (the agent of socialization) and subordinate (the target of
socialization) to encompass various forms of hierarchical relations in educational (here, an
amateur sports club, a university, and a school) and non-educational (a video-game
tournament) settings.
1.1. The Performance Goals Socialization Phenomenon
Achievement goals are social-cognitive mental frames that guide individuals in
interpreting, processing, and coping with competence-relevant situations (Kaplan & Flum,
2010). The first generation of achievement goals research distinguished mastery goals (the
orientation toward the acquisition of competences) from performance goals (the orientation
toward the demonstration of competences; Dweck 1986), whereas the second generation
differentiated performance-approach goals (the desire to outperform others) from
performance-avoidance goals (the desire not to be outperformed by others; Elliot, 1999).1
Past research mostly focused on subordinates, be they pupils, employees, or athletes
(see Elliot, McGregor, & Gable, 1999; Van Yperen, 2003; Halvari & Kjørmo, 1999,

PERFORMANCE GOALS SOCIALIZATION 4
respectively). It was shown that subordinates’ achievement goals are both stable traits (Elliot
& Thrash, 2002) and transient states (e.g., as shaped by perceptions of learning environment,
Anderman & Anderman, 1999). Hence, it is possible to track changes in mastery,
performance-approach, and performance-avoidance goals over time (Corker, Donnellan &
Bowles, 2013; Fryer & Elliot, 2007; Muis & Edwards, 2009). Although scholars have studied
some predictors of change in individuals’ achievement goals (e.g., exam performance; Senko
& Harackiewicz, 2005), they overlooked the dynamics involved by the hierarchical nature of
their social environment.
Supervisors’ mastery and performance-approach goals have been defined
isomorphically to those of subordinates, that is, respectively, as a will to improve their
professional competences and as a will to outperform other supervisors (for teachers, see
Butler, 2007; for employers, Dragoni, 2005; for coaches, Stephens, 2000). To date the level-1
(i.e., subordinates) and level-2 (i.e., supervisors) streams of achievement goals research have
progressed independently of each other. Although no published studies have addressed the
issue of supervisors-to-subordinates transmissions of achievement goals over time, two sets of
indirect evidence suggest that such a phenomenon could occur: (i) classroom goal structure;
(ii) achievement goal contagion.
On the one hand, Ames (1992) has described how educators’ practices could generate
mastery (vs. performance) classroom goal structure. Mastery-oriented instructors tend to
engage in mastery-oriented practices (e.g., Retelsdorf & Günther, 2011) and trigger the
emergence of subordinates’ mastery goals over time (Patrick, Kaplan, & Ryan, 2011).
Performance-approach-oriented instructors tend to engage in performance-oriented practices
and trigger the emergence of subordinates’ performance-approach and -avoidance goals over
time (Church, Elliot, & Gable, 2001).

PERFORMANCE GOALS SOCIALIZATION 5
On the other hand, Eren (2009) developed a model of achievement goal contagion,
whereby learners might infer and endorse the goals of their instructors over time. Thus,
students could read their teacher’s performance-approach goals via external cues. Then, they
would come to endorse performance-approach or performance-avoidance goals, depending on
individual factors such as self-efficacy. Importantly, the author raised the possibility that
“mastery goals [could not] be included in the achievement goals contagion framework” (p.
240), their expression by instructors being less salient in classroom environment.
The two aforementioned lines of research have paved the way to research on goal
socialization, but are limited by two complementary issues. The work on classroom goal
structure has primarily focused on subordinate-reported perceptions of supervisors rather than
on supervisor-reported measures per se (for a similar point, see Wolters, Fan, & Daugherty,
2010). The model of achievement goal contagion is mechanistic in nature: Supervisor-to-
subordinates goal contagion is conceived of as automatic. Our framework departs from this
past research by offering a systematic study of the achievement goals socialization
phenomenon, that is, a study of the social processes by which subordinates come to endorse
the achievement goals of their supervisor.
Before we formally state our hypothesis, we need to mention three caveats. First, we
do not formulate predictions for mastery goals. As previously indicated, supervisors’ mastery
goals might be less socially discernible for subordinates, as they rely on a self-referenced—
and not socially situated—standard of competence (Elliot, 1999). Moreover, mastery goals are
often expressed for social desirability reasons, with individuals reporting unreliable and
overemphasized responses to gain favorable judgement (Dompnier, Darnon, & Butera, 2009).
Second, powerful individuals tend to pursue unequivocal goals (Guinote, 2007), to inhibit
alternative goals (Slabu, & Guinote, 2010), and to resist others’ (goals) influence (Galinsky,
Magee, Gruenfeld, Whitson, & Liljenquist, 2008). Although group socialization is generally

PERFORMANCE GOALS SOCIALIZATION 6
conceived as a mutual influence process, supervisors have more influence on their
subordinates than the reverse (for a relevant review, see Feldman, 1994). Thus, it is
reasonable to assume that supervisors pursue goals that are relatively unaffected by the social
environment and remain constant over time. Third, holding a position of power is associated
with the activation of the behavioral approach system (Keltner, Gruenfeld, & Anderson,
2003), with a sensitivity to rewards rather than to threats (Smith & Bargh, 2008), and with the
endorsement of approach rather than avoidance goals (Willis & Guinote, 2011). As a matter
of fact, leaders tend to have lower performance-avoidance goals than performance-approach
goals (for an illustration, see Hendricks & Payne, 2007). Thus, supervisors’ performance-
avoidance goals are not considered in the present research.
Given the reviewed literature and the above caveats, we formulate a general
performance goals socialization hypothesis and its corollary, tested in Study 1 (for a graphical
representation, see Figure 1, first panel from the top): The higher a supervisor’s performance-
approach goals, the stronger the effects of the time on subordinates’ performance-approach
goals (Hypothesis 1a) and, by extension, on performance-avoidance goals (Hypothesis 1b).
1.2. The Consequences of Performance Goals Socialization
Performance-approach and -avoidance goals may have detrimental consequences over
time. Performance-approach goals are associated in the long run with lower reports of
motivation for low-achievers (Harackiewicz, Barron, Tauer, & Elliot, 2002), a shortage of
salesmen’s efforts (VandeWalle, Brown, Cron, & Slocum, 1999), or a lack of involvement in
sport trainees (Papaioannou, Bebetsos, Theodorakis, Christodoulidis, & Kouli, 2006).
Likewise, performance-avoidance goals are associated in the long run with students’
dissatisfaction (Tuominen-Soini, Salmela-Aro, & Niemivirta, 2012), workers’ progressive
disinterest in their job (Tanaka, Okuno, & Yamauchi, 2013), or athletes’ exacerbated focus
over mistakes (Stoeber, Stoll, Pescheck, & Otto, 2008). These studies suggest that students’,
PERFORMANCE GOALS SOCIALIZATION 7
workers’, and athletes’ performance-based goals predict a decrease in their motivation or
well-being. We argue that such a decline could stem from supervisors’ performance-approach
goals.
Only a few studies adopted a cross-level perspective when testing the effects of
supervisors’ achievement goals on subordinate-related outcomes. Preenen, Vianen, and Pater
(2014) showed that managers’ performance-approach goals were negatively related to their
employees’ experience of challenge while being assigned a task. Barić (2007) reported that
coaches’ performance-approach goals were negatively associated to their players’ investment
and enjoyment. Franklin, Porter, and Swider (2013) showed that leaders’ performance-
approach goals negatively predicted team task commitment. These studies provide
preliminary evidence that supervisors’ performance-approach goals may negatively predict
subordinates’ motivation or well-being. We argue that such a negative influence might be
accounted for by performance goals socialization.
Thus, we formulate an exploratory hypothesis and its corollary, examined in Study 2
(for a graphical representation, see Figure 1, second panel from the top): A supervisor’s
performance-approach goals may predict the evolution of subordinates’ pattern of motivation
and well-being over time, through the emergence of subordinates’ performance-approach
goals (Hypothesis 2a) and, by extension, performance-avoidance goals (Hypothesis 2b).
1.3. The Enabling Condition of Performance Goals Socialization
Socialization is the process by which individuals acquire the values, attitude, and goals
present in one’s group (Moreland & Levine, 1982). A series of studies suggested that group
supervisors might be agents of socialization. Newcomb (1943) reported that professors
contribute to the progressive increase in the liberal attitudes of their students, and their
maintenance over the course of the lifespan (25 years after: Newcomb, Koenig, Flacks, &
Warwick, 1967; 50 years after: Alwin, Cohen, & Newcomb, 1991). Grojean, Resick, Dickson

PERFORMANCE GOALS SOCIALIZATION 8
and Smith (2004) discussed the fact that managers can relay specific ethical norms and
transmit individualistic values to their followers. Steinfeldt and colleagues (2011) showed that
coaches convey masculinity values, such as competitiveness, to their players.
Self-categorization theory describes the three steps involved in such socialization
processes (Turner, Hogg, Oakes, Reicher, & Wetherell, 1987; for an historical review, see
Hornsey, 2008). First, individuals categorize themselves as members of a particular social
group (e.g., a pupil identify with his/her class). Second, individuals recognize the typical
values, attitudes, or goals of their group (e.g., a pupil notice that competition is valued in
his/her class). Third, individuals internalize these values, attitudes, or goals (e.g., a pupil
embrace the competitive values of his/her class). Thus, self-categorization as a group member
(or social identification) is the first and foremost condition for the acquisition and the
internalization of group-based values, attitudes, and goals. Accordingly, when one identifies
with his/her group, socialization is more likely to arise (Terry & Hogg, 1996). For instance,
from the first to the fourth year of their training program, military students who strongly
identified as military officers were found to espouse the group-based dominant beliefs,
whereas military students who weakly identified as officers tended to maintain their beliefs
(Guimond, 2000). Likewise, employees with a high organizational identification are more
likely to embody the same values and goals as their managers than those with a low
organizational identification (Martin & Epitropaki, 2001).
Thus, we argue that supervisor-to-subordinates transmission of performance-based
goals corresponds to the same process as any supervisor-based socialization. Subordinates’ in-
group identification is posited to be the enabling condition of the recognition (and integration)
of supervisors’ performance-approach goals. As in prior work on socialization, social
identification is therefore conceived as a moderating variable: With time, high-identifiers
should be more likely than low-identifiers to endorse the goals of the agent of socialization

PERFORMANCE GOALS SOCIALIZATION 9
(see Gatto, Dambrun, Kerbrat, & De Oliveira, 2010; McAuliffe, Jetten, Hornsey, & Hogg,
2003; Wenzel, 2004). Thus, we formulate a moderation hypothesis and its corollary, tested in
Study 3 (for a graphical representation, see Figure 1, third panel from the top): Over time, the
higher subordinates’ group identification, the stronger the effects of supervisor’s
performance-approach goals on subordinates’ performance-approach goals (Hypothesis 3a)
and, by extension, performance-avoidance goals (Hypothesis 3b).
1.4. The Direction of Performance Goals Socialization
Elliot and Church (1997) showed that high competence expectancies were an
antecedent of performance-approach goals, whereas low competence expectancies were an
antecedent of performance-avoidance goals. More recently, Law, Elliot and Murayama (2012)
reported that when perceived competence is high, performance-approach goals are pursued
unencumbered by performance-avoidance goals, whereas when perceived competence is low,
performance-approach and performance-avoidance goals tend to be pursued simultaneously.
In the same vein, Senko and Harackiewicz (2005, Study 1) reported that high exam
performance (i.e., a positive competence feedback) was associated with a subsequent increase
in performance-approach goals, whereas poor early exam performance (i.e., a negative
competence feedback) was associated with a subsequent increase in performance-avoidance
goals (see also Jagacinski, Kumar, Boe, Lam, & Miller, 2010).
A series arguments lead us to think that perceived self-competence could determine
whether performance goals socialization results in strengthening performance-approach or
performance-avoidance goals. Wolter (2004) showed that the perception of classroom
performance goals structure is positively associated with the emergence of both performance-
approach and -avoidance goals. Moreover, Urdan and Schoenfelder (2006) suggested that
students embedded in such a structure and who are confident in their ability should develop
performance-approach goals, whereas students who doubt their ability should develop
PERFORMANCE GOALS SOCIALIZATION 10
performance-avoidance goals. Likewise, Murayama and Elliot (2012a, 2012b) showed that
structural and perceived competition increase concerns about one’s normative standing and
that individuals regulate these concerns by pursuing performance-approach and performance-
avoidance goals. They also suggested that perceived competence could operate as a
moderator: Individuals perceiving themselves as being sufficiently competent to face the
demand of competition appraise the situation as a challenge and should endorse performance-
approach goals; conversely, individuals perceiving themselves as being insufficiently
competent appraise the situation as a threat and should endorse performance-avoidance goals.
As supervisors’ performance-approach goals create a social environment conducive to
competition, it is legitimate to think that subordinates perceiving themselves as competent
may come to endorse performance-approach goals (winning the competition), whereas those
perceiving themselves as incompetent may come to endorse performance-avoidance goals
(not losing the competition). Thus, we formulate a fourth, second-order interaction hypothesis
and its corollary, tested in Study 4 (see Figure 1, fourth panel from the top): Over time, the
higher subordinates’ perceived self-competence, the stronger the effect of supervisor’s
performance-approach goals on subordinates’ performance-approach goals (Hypothesis 4a)
and, by extension, the weaker the effect on subordinates’ performance-avoidance goals
(Hypothesis 4b).
2. Study 1. Coaches and Soccer Players
2.1. Method
2.1.1. Participants and procedure. One hundred and fifty-eight players of Swiss amateur
soccer teams and their 14 coaches filled in a questionnaire prior to their weekly training
session. Five players were excluded due to missing data and two others due to impossibly
extreme values on the time variable. The final sample consisted of N = 151 players (level 1:
140 men and 11 women; Mage = 22.66, SD = 10.17) nested in K = 14 male coaches (level 2:

PERFORMANCE GOALS SOCIALIZATION 11
Mage = 40.9, SD = 14.5; seniority, M = 3 years, SD = 2.53; n = 10.8 players per coach, min =
5, max = 16).
2.1.2. Measures.
Coaches’ achievement goals (level 2). From 1 (“not at all”) to 7 (“completely”),
coaches answered six items, extracted from Elliot and McGregor’s (2001) Achievement Goal
Questionnaire (AGQ; validated in French by Darnon and Butera, 2005). Items were adapted
to fit the domain of sport. Three items measured mastery-approach goals (e.g., “When I coach
my team, I want to improve my training methods as much as possible”; α = .84, M = 6.26, SD
= 1.23) and three measured performance-approach goals (e.g., “When I coach my team, it is
important for me to do better than other coaches”; α = .89, M = 4.14, SD = 2.01).
Soccer players’ achievement goals (level 1). Using the same response scale, players
also answered items adapted from the AGQ. Three items measured mastery-approach goals
(e.g., “When I play soccer, I want to learn the sport techniques as much as possible”; α = .80,
M = 5.67, SD = 1.32, sk = -1.00), three measured performance-approach goals (e.g., “When I
play soccer, it is important for me to play better than the players of the other teams”; α = .74,
M = 5.58, SD = 1.30, sk = -1.19)2, and three measured performance-avoidance-goals (e.g.,
“When I play soccer, I just want to avoid playing poorly; .60, M = 4.57, SD = 1.42, sk = -
0.36).
Number of years under the supervision of the coach (level 1). In an open-ended
question, players reported “the date from which [they] have been playing with [their] actual
coach.” The variable was transformed in number of years (M = 1.68, SD = 2.16)3. We refer to
this variable as “time.” We use this label invariably across studies.
2.2. Results
Predictors, coefficient estimates, and confidence interval are presented in Table 1.

PERFORMANCE GOALS SOCIALIZATION 12
2.2.1. Multilevel modeling procedure and preliminary analysis. We aimed at testing the
cross-level interaction effects between coaches’ performance-approach goals and time on the
three goal outcomes (players’ mastery, performance-approach, and -avoidance). We built
three multilevel models (one per goal outcome). Each model included the following three
grand-mean centered predictors: coaches’ performance-approach goals, time, and the
interaction (see Supplementary Material for the details of the procedure).
Three sets of preliminary analysis were conducted. First, we tested the effects of
coaches’ mastery goals (no effects reached significance). Second, we tested the effects of the
quadratic term of time to account for potential floor/ceiling effects (an effect was observed for
performance-avoidance goals and we kept the term for this outcome). Third, we ran a
complete analysis of covariance to determine the need for controlling other covariates (we
decided not to keep any of them; see Supplementary Material for the details of the analysis).
2.2.2. Socialization of achievement goals.
Players’ mastery goals. No effect reached significance (ps ≥ .25).
Players’ performance-approach goals. Consistent with Hypothesis 1a, the interaction
was significant, B = 0.07, 95% CI [0.03, 0.11]4, Z = 3.71, p < .001. As reported in Figure 2
(left panel), time was more positively associated with subordinates’ performance-approach
goals when coaches’ performance-approach goals were high, B = 0.15, RSE = 0.03, Z = 5.04,
p < .001, than when they were low, B = -0.14 [-0.27, -0.02], Z = -2.22, p = .026.
Players’ performance-avoidance goals. In line with Hypothesis 1b, the interactions
between coaches’ performance-approach goals and time were significant for the linear term, B
= 0.07 [0.01, 0.13], Z = 2.32, p = .02, and for the quadratic term, B = -0.03 [-0.04, -0.01], Z =
-3.33, p < .001. As reported in Figure 2 (right panel), time was more positively associated
with subordinates’ performance-avoidance goals when coaches’ performance-approach goals
were high (for the linear term: B = 0.14 [-0.10, 0.37], Z = 1.15, p = .25; for the quadratic term:

PERFORMANCE GOALS SOCIALIZATION 13
B = -0.05 [-0.09, -0.01], Z = -2.62, p = .009) than when they were low (for the linear term: B
= -0.17 [-0.28, -0.06], Z = -2.95, p = .003; for the quadratic term: B = 0.06 [0.03, 0.10], Z =
3.59, p < .001).
2.3. Discussion
In line with Hypothesis 1a, Study 1 showed that the higher the supervisors’
performance-approach goals (in this case, coaches), the stronger the effects of time on
subordinates’ performance-approach goals (in this case, soccer players). In line with
Hypothesis 1b, results revealed the same phenomenon for subordinates’ performance-
avoidance goals, notwithstanding the intervention of a floor effect (for supervisors endorsing
low performance-approach goals) and a ceiling effect (for supervisors endorsing high
performance-approach goals). This unexpected polynomial interaction suggests a somehow
faster performance goals socialization for performance-avoidance goals (reaching their
minimum / maximum more rapidly than performance-approach goals). Moreover,
achievement goals socialization was only found for performance goals: Supervisors’ mastery
goals did not significantly interact with time in predicting soccer players’ mastery,
performance-approach or performance-avoidance goals.
Given the cross-sectional nature of Study 1, we cannot rule out the possibility that the
results are (partially) due to a (self-)selection process rather than a socialization process:
When having a different level of performance-based goals than supervisors, subordinates may
be excluded from (or leave) the group (see Bachman, Sigelman, & Diamond, 1987). This
issue is addressed in Study 4. Additionally, two limitations point out the need for replication.
First, while sample size at level 1 was satisfactory, at level 2, it was low. Second, Study 1
took place in a sport setting. The processes of achievement goals socialization was not
expected to depend on the achievement domain, and therefore Study 2 aimed to replicate
PERFORMANCE GOALS SOCIALIZATION 14
Study 1’s findings within more numerous academic groups, while also exploring Hypotheses
2a and 2b.
3. Study 2. Thesis Supervisor and Ph.D. Students
3.1. Method
3.1.1. Participants and procedure. Seventy-nine Ph.D. students of two Swiss universities
(Social and Technical Sciences) and their 41 thesis supervisors filled in an online
questionnaire. Eight Ph.D. students were excluded due to missing data and another one was
identified as an outlier5. The final sample consisted of N = 70 students (level 1: 37 social
sciences students and 33 technical sciences students; 45 men and 25 women; Mage = 28.39, SD
= 3.61) nested in K = 41 thesis supervisors (level 2: 38 men and 3 women; n = 1.7 students
per supervisor, min = 1, max = 5).
3.1.2. Measures.
Thesis supervisors’ achievement goals (level 2). As in Study 1, thesis supervisors
answered items adapted from the AGQ. This time, items were adapted to fit the academic
domain. Three items measured mastery-approach goals (e.g., “In my research work, I want to
learn as much as possible about my subject”; α = .89, M = 6.49, SD = 0.56) and three
measured performance-approach goals (e.g., “In my research work, my goal is to have more
publications than most other researchers”; α = .81, M = 3.76, SD = 1.22).
Ph.D. students’ achievement goals (level 1). Ph.D. students also answered items
adapted from the AGQ. Three items measured mastery-approach goals (e.g., “In my thesis
work, I want to learn as much as possible about my subject”; α = .536, M = 6.52, SD = 0.50, sk
= 0.18), three measured performance-approach goals (e.g., “In my thesis work, it is important
for me to do better than other Ph.D. students; α = .92, M = 3.34, SD = 1.51, sk = -0.83) and
three measured performance-avoidance-goals (e.g., “In my thesis work, I just want to avoid
doing poorly”; α = .72, M = 3.46, SD = 1.44, sk = -0.01).

PERFORMANCE GOALS SOCIALIZATION 15
Number of years Ph.D. student spent under the supervision of the director (level 1).
In an open-ended question, Ph.D. students reported “when did [they] start [their] Ph.D.,”
which was transformed in number of years (M = 2.42, SD = 1.49).
Ph.D. students’ intention to drop out of thesis. From 1 (“not at all”) to 7
(“completely”), students answered two items (e.g., “I often think about quitting my thesis in a
near future”; α = .55, M = 2.29, SD = 1.37, sk = -0.74), extracted from the Michigan
Organizational Assessment Questionnaire (Cammann, Fichman, Jenkins, & Klesh, 1979).
Ph.D. students’ satisfaction. From 1 (“not at all”) to 7 (“completely”), Ph.D. students
answered the five items of the Bacharach, Bamberger and Conley’s (1991) Job Satisfaction
Scale (e.g., “In my thesis, I am satisfied of my research work in light of my career
expectations”; α = .82, M = 4.86, SD = 1.14, sk = 0.75).7
3.2. Results
3.2.1. Replication of Study 1’s findings.
Predictors, coefficient estimates, and confidence intervals are presented in Table 2.
Multilevel modeling procedure and preliminary analysis. Again, we aimed at testing
the cross-level interaction effects between thesis supervisors’ performance-approach and time
on the three goal outcomes. As the intraclass coefficient correlations and the between-cluster
variations of the effect of time were not significantly different from zero, we built three
standard regression models with standard errors adjusted for clustering (one per goal
outcome). Each model included the following four grand-mean centered predictors: coaches’
performance-approach goals, time, the interaction, as well as university affiliation (to account
for potential sample effects; coded “-0.5” for “Social Science” and “+0.5” for “Technical
Science”; see Supplementary Material for the details of the procedure).
Two sets of preliminary analyses were conducted. First, we tested the effects of
coaches’ mastery goals (no effect reached significance). Second, we ran a complete analysis

PERFORMANCE GOALS SOCIALIZATION 16
of covariance to determine the need for controlling other covariates (no effect reached
significance; see Supplementary Material for the details of the analysis).
Ph.D. students’ mastery goals. No effect reached significance (ps ≥ .31).
Ph.D. students’ performance-approach goals. Consistent with Hypothesis 1a, the
interaction between supervisors’ performance-approach goals and time was significant, B =
0.20 [0.03, 0.38], Z = 2.26, p = .024 (a1 path in Figure 3). As in Study 1, time was more
positively associated with subordinates’ performance-approach goals when supervisors’
performance-approach goals were high, B = 0.20 [-0.10, 0.49], Z = 1.30, p = .20, than when
they were low, B = -0.30 [-0.64, 0.05], Z = -1.68, p = .093.
Ph.D. students’ performance-avoidance goals. Consistent with Hypothesis 1b, the
interaction between supervisors’ performance-approach goals and time was significant, B =
0.15 [0.04-0.26], Z = 2.70, p = .007 (a2 path in Figure 3). As in Study 1, time was more
positively associated with subordinates’ performance-avoidance goals when supervisors’
performance-approach goals were high, B = 0.10 [-0.09, 0.30], Z = 1.01, p = .31, than when
they were low, B = -0.27 [-0.54, 0.00], Z = -1.94, p = .052.
3.2.2. Consequences of performance goals socialization.
Predictors, coefficient estimates, and confidence intervals are presented in Table 3.
Ph.D. students’ intention to drop out of thesis.
Total effect of supervisors’ performance-approach goals over time. As a first step, we
aimed at exploring the consequences over time of supervisors’ performance-approach goals
on Ph.D students’ intention to drop out of thesis. We built a multilevel model including the
same four predictors as before (see Supplementary Material for the details of the procedure).
The interaction between supervisors’ performance-approach goals and time was significant, B
= 0.19 [0.05, 0.33], Z = 2.67, p = .008 (c1 path in Figure 3). As reported in Figure 4 (left
panel), time was more positively associated with intention to drop out when supervisors’

PERFORMANCE GOALS SOCIALIZATION 17
performance-approach goals were high, B = 0.73 [0.51, 0.94], Z = 6.68, p < .001, than when
they were low, B = 0.26 [-0.01, 0.53], Z = 1.92, p = .05.
Indirect effect of supervisors’ performance-approach goals through Ph.D. students’
goals. As a second step, we aimed at determining the potential role of Ph.D. students’
achievement goals in explaining the interaction between supervisors’ performance-approach
goals and time on intention to drop out. All grand-mean centered students’ achievement goals
and their interactions were included in the model8. The interaction between supervisors’
performance-approach goals and time remained the same, B = 0.18 [0.05, 0.31], Z = 2.71, p
= .007 (c1’ path in Figure 3)9. More importantly, Ph.D. students’ performance-approach goals
were positively associated with intention to drop out, B = 0.18 [0.03, 0.34], Z = 2.37, p < .018
(b1 path in Figure 3). As Ph.D. students’ performance-approach goals could be a good
candidate in explaining the moderation effect between supervisors’ performance-approach
goals and time on students’ intention to drop out, the indirect effect was calculated using
Monte Carlo simulations (MacKinnon, Lockwood, & Williams, 2004)10. It was B = 0.02
[0.001, 0.093] (a1 * b1 path in Figure 3).
Ph.D. students’ satisfaction.
Total effect of supervisors’ performance-approach goals over time. In a first step, we
built the same multilevel model used for intention to drop out, but this time predicting
students’ satisfaction (see Supplementary Material for the details of the procedure). The
interaction between thesis supervisors’ performance-approach goals and time was significant,
B = -0.26 [-0.40, -0.13], Z = -3.76, p < .001 (c2 path in Figure 3). As it can be seen in Figure 4
(right panel), time was more negatively associated with satisfaction when supervisors’
performance-approach goals were high, B = -0.25 [-0.45, -0.05], Z = -2.40, p = .016, than
when they were low, B = 0.39 [0.13, 0.66], Z = 2.89, p = .004.

PERFORMANCE GOALS SOCIALIZATION 18
Indirect effect of supervisors’ performance-approach goals through Ph.D. students’
goals. In a second step, we aimed at determining the potential role of Ph.D. students’
achievement goals in explaining the interaction between thesis supervisors’ performance-
approach goals and time on satisfaction. All grand-mean centered Ph.D. students’
achievement goals and their interactions were included in the model. The interaction between
supervisors’ performance-approach goals and time remained the same, B = -0.25, [-0.38, -
0.12], Z = -3.91, p < .001 (c2’ path in Figure 3). More importantly, Ph.D. students’
performance-avoidance goals were negatively associated with their satisfaction, B = -0.18 [-
0.33, -0.02], Z = -2.22, p = .026 (b2 path in Figure 3). The indirect effect of supervisors’
performance-approach goals on satisfaction via performance-avoidance goals was B = -0.02 [-
0.061, -0.001] (a2 * b2 path in Figure 3).
3.3. Discussion
Consistent with what observed in Study 1, but for a different achievement domain,
Study 2 showed that the higher the supervisors’ performance-approach goals (in this case,
thesis supervisors), the stronger the effects of time on subordinates’ (in this case, Ph.D.
students) performance-approach (Hypothesis 1a) and performance-avoidance (Hypothesis 1b)
goals. Contrasting with Study 1, the polynomial interaction between supervisors’
performance-approach goals and time was not significant. The tighter range of our time
variable might explain such an absence of floor / ceiling effect.
Beyond the replication of performance goals socialization, Study 2 provided an
illustration of its consequences. First, in line with Hypothesis 2a, Study 2 showed that
supervisors’ performance-approach goals were directly and indirectly—through subordinates’
performance-approach goals—associated with intention to drop out. These findings are
consistent with the one establishing a positive relationship between performance goal climate
and dropout behaviors (Sarrazin, Vallerand, Guillet, Pelletier, & Cury, 2002). However, the

PERFORMANCE GOALS SOCIALIZATION 19
valence of the performance goals mediator is surprising, as individuals’ performance-
approach (vs. -avoidance) goals have been found to positively predict persistence (Elliot et
al., 1999). This could be explained by the specificity of our participants (i.e., Ph.D. students),
who are often expected to work on complex scientific material (e.g., state-of-the-art findings)
in collaboration with others (e.g., with co-authors). When conducting difficult task within
groups, performance-approach goals typically impair team adaptation (LePine, 2005), which
could favor disengagement and dropout (Rumberger, 2001).
Second, in line with Hypothesis 2b, Study 2 showed that, over time, supervisors’
performance-approach goals were directly and indirectly—through subordinates’
performance-avoidance goals—associated with satisfaction. These findings are consistent
with research reporting a negative relationship between performance goal climate and
satisfaction (Treasure & Robert, 2001), and a negative effect of performance-avoidance goals
on satisfaction (Diseth & Samdal, 2014).
Now that we have empirically defined performance goals socialization and identified
(some of) its consequences, we intend to show that this phenomenon is indeed a socialization
process. Since self-categorization is the prerequisite for socialization processes to occur, we
expect identification to one’s group to be the enabling condition of performance goals
socialization. Specifically, after having spent a substantial amount of time in a group led by a
performance-approach-oriented supervisor, subordinates highly (vs. poorly) identified with
their group should pursue more performance-approach goals (Hypothesis 3a) and
performance-avoidance goals (Hypothesis 3b). This idea was tested in another achievement
setting, albeit more informal: video game teams (see Ryan, Rigby, & Przybylski, 2006).

PERFORMANCE GOALS SOCIALIZATION 20
4. Study 3. Video Game Team Leaders and Players
4.1. Method
4.1.1. Participants and procedure. Sixty-six players from 24 teams of an online multiplayer
video game filled in an online questionnaire. The video game is an online first-person shooter
named “Quake Live.” The particularity of the teams from this game is to be hierarchically
structured. Each member has an explicit status: Initiate, Member, Veteran, Clan Leader, and
Clan Officer (from the lowest to the highest rank). The latter two ranks allow the players to
invite new members to join the team, and to promote, demote or exclude existing members.
The Clan Officers (or Clan Leaders in the case of teams having no Clan Officer) were treated
as supervisors, whereas the players having inferior ranks were treated as subordinates. Eight
participants were excluded due to missing data or because they were not yet in the team at the
time of data collection. The final sample consisted of N = 33 team-member (level 1: 32 men
and 1 woman; Mage = 24.09, SD = 4.46) nested in K = 25 leaders (level 2: 24 males and 1
missing value; Mage = 25.74, SD = 3.56; n = 1.4 team-member per leader, min = 1, max = 4)11.
4.1.2. Measures.
Leaders’ performance-approach goals (level 2). As in Studies 1 and 2, leaders
answered items adapted from the AGQ. This time, items were adapted to fit the area of video
games. Only the three items measuring performance-approach goals were considered (e.g.,
“When I play, I want to perform better than the other players.”; α = .81, M = 5.29, SD = 1.16).
As in Studies 1 and 2 supervisors’ and subordinates’ mastery goals were not found to produce
consistent results and these goals were no longer considered.
Team-members’ performance goals (level 1). Team-members answered the same
performance goals items as their leaders. Three items measured performance-approach goals
(α = .56, M = 5.21, SD = 1.01, sk = -0.20) and three measured performance-avoidance goals

PERFORMANCE GOALS SOCIALIZATION 21
(“When I play, I want to avoid being worse than the other players.”; α = .82, M = 4.71, SD =
1.68, sk = -0.65).
Team-members’ identification with their team (level 1). From 1 (“not at all”) to 7
(“completely”), each team-member answered three items adapted from Falomir-Pichastor,
Mugny, Invernizzi, Di Palma and Estrada (2007); i.e., “Do you identify with your clan?”; “Do
you feel close to the members of your clan?”; and “Do you think you're similar to the
members of your clan?”; α = .85, M = 5.50, SD = 1.09.
Time team-members spent under the supervision of the leader (level 1). During the
completion of the questionnaire, the date on which team-members joined their team was
collected. This information was publicly accessible via the players’ game statistics profile.
The variable was transformed in number of months (M = 10.73, SD = 9.94).
Team-members’ average game performance (level 1). As performance was reported
as an antecedent of achievement goals (Senko & Harackiewicz, 2005) and could be
confounded with the effect of leaders’ performance-approach goals, team-members’ average
accuracy was used as a measure of performance. This measure was collected on players’
game statistics profile. It was an average percentage for all games and could range from 0%
(perfect inaccuracy: Each time the participant shoots, s/he misses the opponent) to 100%
(perfect accuracy: Each time the participant shoots, s/he hits the opponent; M = 29.18, SD =
6.39).
4.2. Results
Predictors, coefficient estimates, and confidence interval are presented in Table 4.
4.2.1. Multilevel modeling procedure and preliminary analysis. Again, we aimed at testing
(second order) cross-level interaction effects. We built two multilevel models (one per goal
outcome). Each model included the following eight grand-mean centered predictors: leaders’

PERFORMANCE GOALS SOCIALIZATION 22
performance-approach goals, time, team-members’ identification, and the interactions (see
Supplementary Material for the details of the procedure).
As in Studies 1 and 2, we ran a complete analysis of covariance to determine the need
for controlling other covariates (an effect of team-members’ performance was observed for
both performance-based goals and we kept the term; see Supplementary Material for the
details of the analysis).
Team-members’ performance-approach goals. Consistent with Hypothesis 3a, the
three-way interaction between leaders’ performance-approach goals, time, and members’
identification was significant, B = 0.05 [0.004, 0.09], Z = 2.13, p = .033. As shown in Figure 5
(left panel), when time was high (+1 SD), the interaction between leaders’ performance-
approach goals and members’ identification was significant, B = 0.59 [0.02, 1.15], Z = 2.02, p
= .043, whereas this was not the case when it was low (-1 SD), B = -0.37 [-0.81, 0.07], Z = -
1.63, p = .103. Specifically, when time was high, leaders’ performance-approach goals were
more positively associated with subordinates’ performance-approach goals when subordinates
were highly identified (+1 SD), B = 0.41 [-0.41, 1.24], Z = 0.98, p = .327, than when they
were poorly identified (-1 SD), B = -0.86 [-1.66, -0.06], Z = -2.11, p = .035. The three-way
interaction is plotted in an alternative way (a 3-D surface chart) in Supplementary Material.
Team-members’ performance-avoidance goals. Consistent with Hypothesis 3b, the
three-way interaction between leaders’ performance-approach goals, time, and members’
identification was significant, B = 0.06 [0.01, 0.10], Z = 2.50, p = .012. As shown in Figure 5
(right panel), when time was high (+1 SD), the interaction between leaders’ performance-
approach goals and members’ identification was significant, B = 0.86 [0.35, 1.36], Z = 3.34, p
< .001, while this was not the case when it was low (-1 SD), B = -0.29 [-0.87, 0.29], Z = 0.99,
p = .324. Specifically, leaders’ performance-approach goals were more positively associated
with subordinates’ performance-avoidance goals when subordinates were highly identified

PERFORMANCE GOALS SOCIALIZATION 23
(+1 SD), B = 1.06 [0.19, 1.93], Z = 2.38, p = .017, than when they were poorly identified (-1
SD), B = -0.81 [-1.77, 0.15], Z = -1.65, p = .098. The three-way interaction is plotted in an
alternative way (a 3-D surface chart) in Supplementary Material.
4.3. Discussion
Extending the findings of Studies 1 and 2, and consistent with Hypotheses 3a and 3b,
Study 3 showed that, over time, the higher the subordinates’ identification with their group (in
this case, video game team-members), the stronger the effects of supervisors’ performance-
approach goals (in this case, team leaders) on performance-approach goals (Hypothesis 3a) and
performance-avoidance goals (Hypothesis 3b). Thus, the enabling condition of supervisor-to-
subordinate performance goal transmission is the same as that of any socialization: Self-
categorization is the condition for subordinates’ performance-based goal to be influenced by
those of their supervisors.
In sum, the moderating role of identification implies that performance goals
socialization is truly an in-group process. For high identifiers, performance-approach-oriented
supervisors promote performance-approach and -avoidance goals, which may have various
downstream consequences on subordinates’ attitudes and behaviors (e.g., on persistence, as in
Study 2; see also, Elliot et al., 1999). For low-identifiers, performance-approach-oriented
supervisors have a more limited influence, which may counteract the potential deleterious
effects (or cancel out the potential beneficial effects) of performance goals socialization.
One might wonder whether the performance goals socialization effects—although
moderated by group identification processes—actually correspond to a progressive
endorsement of goals over time (i.e., a socialization effect) or to the fact that subordinates not
pursuing the same goals as their supervisors are eventually excluded from (or decide to leave)
the group (i.e., a (self-)selection effect; Bachman et al., 1987). Study 4 used a longitudinal
design to rule out this alternative possibility.

PERFORMANCE GOALS SOCIALIZATION 24
Another important issue remains unaddressed. In Studies 1 to 3, supervisors’
performance-approach goals were found to be associated with the emergence of both
subordinates’ performance-approach and -avoidance goals over time. Yet, these two goals are
distinct constructs and produce competing effects (Murayama, Elliot, & Yamagata, 2011). It
is therefore critical to specify when supervisors’ performance-approach goals predict one or
the other. Since high perceived self-competence is an antecedent of performance-approach
goals and low self-competence is an antecedent of performance-avoidance goals (for a
review, see Murayama & Elliot, 2012b), we expected perceived self-competence to be the
directional moderator of performance goals socialization. Supervisors’ performance-approach
goals should prompt performance-approach goals for subordinates perceiving themselves as
being sufficiently competent (Hypothesis 4a) and performance-avoidance goals for
subordinates perceiving themselves as being insufficiently competent (Hypothesis 4b). This
idea was tested in a fourth type of achievement setting, namely secondary education.
5. Study 4. Schoolteachers and Pupils
5.1. Method
5.1.1. Participants. NT1 = 625 French middle school students and their 25 teachers
concurrently took part in the first wave of the study. NT2 = 496 of the first-wave pupils whose
teacher(s) participated fully completed the second wave questionnaire. One teacher was
removed due to incomplete data. The final pupil sample consisted of 496 pupils (259 boys and
237 girls; 124 sixth-graders, 124 seventh-graders, 139 eight-graders, and 109 ninth-graders;
Mage = 13.16, SD = 1.19). The final teacher sample consisted of 24 teachers (7 men and 17
women; Mage = 41.0, SD = 11.04; years of seniority, M = 15.06 years, SD = 11.42; 20.7 pupils
per teacher, min = 5, max = 44).
5.1.2. Procedure.

PERFORMANCE GOALS SOCIALIZATION 25
Wave 1. At the beginning of the school year (i.e., late September), two experimenters
submitted a first questionnaire to the pupils of a French middle school. Parents were informed
by mail about the general purpose of the study two weeks before. All except four pupils were
allowed to participate in the study. The Wave 1 questionnaire measured pupils’ achievement
goals and perceived self-competence in six disciplines, namely Mathematics, First Foreign
Language, French, Physical Education, History and Geography, and Earth and Life Science.
Additionally, pupils were asked whether or not “[they] knew [their] teacher before this school
year” for the six same disciplines (1435 negative answers, 585 positive ones, and 40 missing).
At the same time, the teachers in the six aforementioned disciplines (6 in Mathematics, 6 in
First Foreign Language, 5 in French, 3 in Physical Education, 2 in History and Geography,
and 2 in Earth and Life Science) reported, in a paper-and-pencil or on-line questionnaire, their
performance-approach goals for teaching12. In sum, there were N = 2060 discipline-based
units (level 1), both nested in K2a = 496 pupils (level 2a; n2a = 4.2 observations per children)
and in K2a = 24 teachers (level 2b; n2b = 85.83 observations per teacher).
Wave 2. Four months later (i.e., late January), two experimenters invited the pupils to
fill in a second questionnaire, once again measuring their goals for the same six disciplines.
5.1.3. Measures.
Teachers’ performance-approach goals (level 2b). In Wave 1, as in Studies 1 to 3,
teachers answered items adapted from the AGQ. This time, items were adapted to fit the
school domain (e.g., “When I am teaching, it is important for me to teach better as compared
to other teachers”; α = .87, M = 2.58, SD = 1.61).
Pupils’ perceived self-competence (level 1). In Wave 1, on a scale ranging from 0
(“not competent at all”) to 100 (“fully competent”), pupils reported their perceived self-
competence in the aforementioned six disciplines (M = 62.38, SD = 25.05). For the ease of
reading, the variable was divided by 10 (M’ = 6.24, SD’ = 2.51).

PERFORMANCE GOALS SOCIALIZATION 26
Change in pupils’ performance goals from Wave 1 to Wave 2 (level 1). For each
wave, pupils answered the performance goal items adapted from the AGQ. One of the
performance-avoidance items was removed due to reliability issue (i.e., “My fear of
performing poorly in this discipline is what motivates me”; as in past research, e.g., Darnon,
Harackiewicz, Butera, Mugny, & Quiamzade, 2007). For each discipline, three items
measured performance-approach goals (e.g., “My goal in this discipline is to have better grade
than most of others pupils”) at Wave 1 (average of the six Cronbach’s alpha for all
disciplines, Mα = .86, M = 4.03, SD = 1.89) and Wave 2 (Mα = .90, M = 3.75 SD = 1.97).
Change in performance-approach goals was computed by subtracting the latter from the
former (M = -0.29, SD = 1.70, sk = 0.01). Two items measured performance-avoidance goals
(e.g., “I just want to avoid doing poorly in this discipline”) at Wave 1 (Mα = .58, M = 5.84, SD
= 1.46) and Wave 2 (Mα = .71, M = 5.64, SD = 1.62). Change in pupils’ performance-
avoidance goals was also computed by subtracting the latter from the former (M = -0.20, SD =
1.60, sk = -0.22). 14
5.2. Results
Predictors, coefficient estimates, and confidence interval are presented in Table 5.
5.2.1. Multilevel modeling procedure and preliminary analysis. In the present data,
discipline-based observations were cross-classified by pupils and teachers. Thus, we built two
cross-classified multilevel models (one for change in pupils’ performance-approach goals and
another for change in pupils’ performance-avoidance goals). Each model included the
following four grand-mean centered predictors: teachers’ performance-approach goals,
pupils’ perceived self-competence, the interaction, as well as change in pupils’ performance-
avoidance goals when the outcome was performance-approach goals, and vice versa (to
disentangle the effects of one goal from the effect of the other; see Supplementary Material
for the details of the procedure).13

PERFORMANCE GOALS SOCIALIZATION 27
As in Studies 1-3, we ran a complete analysis of covariance to determine the need for
controlling additional covariates. We observed an effect of the fact that the teacher was
known before the school year on change in pupils’ performance-avoidance goals (the
covariates was coded “-0.5” for “teacher unknown” and “+0.5” for “teacher known” and is
referred to as teacher familiarity). Thus, the term was kept for this outcome (see
Supplementary Material for the details of the analysis).
5.2.3. Change in pupils’ performance-approach goals. The intercept was found to be
significantly different from zero, B = -0.29 [-0.41, -0.17], Z = -4.67, p < .001, suggesting a
general decrease of pupils’ performance-approach goals from Wave 1 to Wave 2. More
importantly, in line with Hypothesis 4a, the analyses revealed an interaction between
teachers’ performance-approach goals and pupils' perceived self-competence, B = 0.02 [0.01,
0.04], Z = 2.94, p = .003. As shown in Figure 6 (left panel), when perceived self-competence
was high (+1 SD), teachers’ performance-approach goals were more positively associated
with change in performance-approach goals, B = 0.05 [0, 0.10], Z = 1.87, p = .062, than when
perceived self-competence was low (-1 SD), B = -0.06 [-0.12, -0.004], Z = -2.09, p = .037.
5.2.4. Change in pupils’ performance-avoidance goals. The intercept was again found to be
significantly different from zero, B = -0.13 [-0.24, -0.02], Z = -2.27, p = .023, suggesting a
general decrease in performance-avoidance goals for Wave 1 to Wave 2. More importantly,
the second-order interaction between teachers’ performance-approach goals, pupils’ perceived
self-competence, and teacher familiarity was significant, B = 0.04 [0.01, 0.07], Z = -2.52, p
= .012. Specifically, the interaction between teachers’ performance-approach goals and
pupils’ perceived self-competence was not significant when the teacher was known before the
beginning of the school year, B = 0.02 [0, -0.05], Z = 1.62, p = .105, whereas it was
significant when s/he was unknown, B = -0.02 [-0.04, -0.001], Z = -2.11, p = .035. As shown
in Figure 6 (right panel), when perceived self-competence was low (-1 SD), teacher’s

PERFORMANCE GOALS SOCIALIZATION 28
performance-approach goals were more positively associated with change in performance-
avoidance goals, B = 0.08 [0.01, 0.14], Z = 2.29, p = .022, than when perceived competence
was high (+1 SD), B = -0.02 [-0.07, 0.04], Z < |1|, p = .585.
5.3. Discussion
Extending the findings of Studies 1 to 3, and consistent with Hypotheses 4a and 4b,
Study 4 showed that perceived self-competence moderated performance goals socialization.
On the one hand, the higher subordinates’ perceived self-competence (in this case,
middle school students), the stronger the effect of supervisors’ performance-approach goals
(in this case, teachers) on the change in subordinates’ performance-approach goals
(Hypothesis 4a). On the other hand, the lower subordinates’ perceived self-competence, the
stronger the effect of supervisors’ performance-approach goals on the change in subordinates’
performance-avoidance goals (Hypothesis 4b). However, Hypothesis 4b was confirmed only
when pupils did not know their teacher before the beginning of the school year. This
unexpected result is coherent with a socialization process, to the extent that it means that
pupils who already knew their teacher could have already been socialized. As this difference
was not observed for performance-approach goals, it also suggests a somehow faster
performance-avoidance (vs. performance-approach) goals socialization (as in Study 1).
However, it should be emphasized that we decided to include teacher familiarity as an
additional moderator following the preliminary analysis. Thus, the results pertaining to
performance-avoidance goals should be considered as exploratory and would require further
confirmation using a deductive approach.
In sum, the moderating role of perceived self-competence implies that the outcome of
performance goals socialization is not invariable. For subordinates high in self-competence,
performance-approach-oriented supervisors prompt the endorsement of performance-
approach goals, which are typically associated with a mixed pattern of adaptive and

PERFORMANCE GOALS SOCIALIZATION 29
maladaptive outcomes (e.g., high performance but low openness to collaboration; see Senko,
Hulleman, & Harackiewicz, 2011). However, for subordinates low in self-competence,
performance-approach-oriented supervisors prompt the endorsement of performance-
avoidance goals, which are typically associated with a pattern of maladaptive outcomes (e.g.,
low performance and interaction anxiety; Valentiner, Mounts, Durik & Gier-Lonsway, 2011).
One might wonder why a general decline in both performance goals was observed.
Shim, Ryan, and Andersen (2008) has reported similar within-school-year decline in all types
of achievement goals for 6th and 7th graders. The authors argued that novelty or uncertainty at
the beginning of the school year may generally heighten the pursuit of achievement goals.
The overall decline in achievement goals might also be due to fall-to-spring change in pupils’
concerns about evaluation (Meece & Miller, 2001) or to a progressive increase of pupils’
normative clear-sightedness (Bigot, Pichot, & Testé, 2004; especially for performance goals
which are socially undesirable; Dompnier, Darnon, Delmas, & Butera, 2008; Pekrun, Maier,
& Elliot, 2006).
6. General Discussion
Performance-based goals have high social costs for groups, to the extent that they have
been associated with hostile responses to academic disagreements within learning dyads
(Sommet et al., 2014), non-cooperative organizational behaviors within work teams
(Poortvliet, & Giebels, 2012), or unsportsmanlike conducts within sport teams (Boardley &
Kavussanu, 2010). It is thus crucial to understand how—in spite of these detrimental costs—
social reproduction of these goals operates. In the present research, we focused on the
function of group supervisors as agents of performance goals socialization.
Across various achievement domains, four studies provided convergent evidence for
performance goals socialization, as well as empirical illustrations of its consequences,
enabling condition, and directional moderator. With respect to the phenomenon itself, in a

PERFORMANCE GOALS SOCIALIZATION 30
first cross-sectional study involving sport teams, coaches’ performance-approach goals were
found to be positively associated with the emergence of their players’ performance-approach
and -avoidance goals. With respect to its consequences, in a second cross-sectional study
involving academic organizations, thesis supervisors’ performance-approach goals were
found to be associated with an increase over time (directly and indirectly through the
emergence of performance-approach goals) in their Ph.D. students’ intentions to drop out and
with a decrease over time (directly and indirectly through the emergence of performance-
avoidance goals) in their Ph.D. students’ satisfaction. With respect to its enabling condition,
in a third cross-sectional study involving video game teams, leaders’ performance-approach
goals were found to be more positively associated with the emergence of performance-
approach and -avoidance goals, as team-members’ in-group identification increased. Since
self-categorization is needed for goal influence to occur, this result underlines that the
phenomenon under study is indeed a form of socialization. With respect to its directional
moderator, in a last longitudinal study involving secondary school classrooms, teachers’
performance-approach goals were found to be more positively associated with change in
performance-approach goals as pupils’ perceived competence increased, and with change in
performance-avoidance goals as it decreased.
6.1. Theoretical Contributions
The first contribution of the present set of studies pertains to the issue of the predictors
of performance-based goals. Independently of each other, some scholars addressed this
question at a structural level (e.g., group goal structure; Wolter, 2004), while others addressed
it at the intrapersonal level (e.g., perceived self-competence; Elliot & Church, 1997). In
adopting an integrative cross-level approach, the findings of Studies 1, 2 and 4 allow to
articulate these two levels of analysis. At level 2, group-supervisors promote the endorsement
of performance-based goals socialization, whereas at level 1, subordinates’ perceived self-

PERFORMANCE GOALS SOCIALIZATION 31
competence is a predictor of the approach vs. avoidance component associated with these
performance-based goals. Considering both supervisors’ and subordinates’ goals, our results
extend the work on performance goals adjustment over time (e.g., Kumar & Jagacinski, 2011;
Meece, & Miller, 2001, Senko & Harackiewicz, 2005), by showing the importance of taking
interpersonal and inter-positional perspectives (studying the (goals) dynamics between
individuals different in status; Doise, 1986) in understanding that adjustment (Poortvliet &
Darnon, 2010).
The second contribution of the present set of studies pertains to the place of
achievement goals in the literature on socialization. On the one hand, achievement goals
theorists have shown that the expression of performance-approach goals depends on the
norms of a given social system (Dompnier, Darnon, & Butera, 2013). On the other hand,
group socialization theorists have accumulated evidence that social identification was the sine
qua non condition of the social transmission of normative values, attitudes, and goals over
time (e.g., Guimond, 2000). Building a bridge between these two literatures, Study 3’s
findings reveal that the enabling condition involved in performance goals socialization is
analogous to that of any socialization process: High-identifiers under the supervision of a
performance-approach-oriented leaders may come to recognize performance-based goals as
the social-normative achievement goals and come to integrate it. Another implication of such
phenomenon is that clear-sighted subordinates under the supervision of a performance-
approach-oriented leader may perceive performance-based goals as socially desirable and
endorse them for self-presentation purpose (to gain positive evaluation; see Darnon,
Dompnier, & Poortvliet, 2012). Since supervisors often try to secure compliance and
conformity via authority (Michel, Wallace, & Rawling, 2013), but subordinates often
genuinely embrace their group-leaders’ goals (Tyler, 2006), future research is needed to
determine the extent to which performance goals socialization is a manifest or a latent

PERFORMANCE GOALS SOCIALIZATION 32
phenomenon (Bender, 1967). These questions notwithstanding, our findings highlight the
need to take a structural perspective in understanding the effects of performance goals, that is,
studying the (goals) dynamics as a function of social norms (Doise, 1986; Poortvliet &
Darnon, 2010).
6.2. Applied Contributions
This research also has an important practical implication: Study 2 shows that
performance-approach-oriented supervisors elicit—via performance goals socialization—the
emergence of a maladaptive pattern of motivation and well-being (drop out and
dissatisfaction). More generally speaking, subordinates’ performance goals are not only
associated with a series of detrimental intrapersonal behaviors (e.g., long-term learning,
Murayama & Elliot, 2011; for a discussion of their more adaptive outcomes, see Senko et al.,
2011), but also with detrimental intragroup behaviors (e.g., hostile, antisocial, uncooperative
conducts; see Sommet, Darnon, & Butera, 2015). Thus, it would seem reasonable to assume
supervisors’ performance-approach goals to predict—via performance goals socialization—
dysfunctional regulation of in-group behaviors.
Because of performance goals’ elevated social cost for groups, small group researchers
argued that these goals should be discouraged within learning groups and formulated practical
recommendations. Relying on an individual-level approach, Dierdorff and Ellington (2012)
proposed interventions aiming at reducing trainees’ focus on normative performance (and by
extension performance-based goals). Given our results, one might doubt that performance-
oriented trainees could easily be re-socialized, given the permanent presence of their
performance-approach-oriented team-leader. However, relying on a structural-level approach,
Gully and Phillips (2005) recommend leaders to use feedback and focus the reward system on
processes rather than outcomes (thus reducing followers’ performance-based goals). Again,
given our results, one might doubt that performance-approach-oriented leaders would rely on

PERFORMANCE GOALS SOCIALIZATION 33
such management practices, as they could conflict with their own goals. For our part, relying
on a cross-level approach, we suggest that interventions should be framed in such a way as to
reduce supervisors’ personal performance-approach goals, therefore resulting in a more
profound change in their managing practices. In this regard, Skaalvik and Skaalvik (2013)
reported a correlation between teachers’ perception of their school performance goals
structure (i.e., school emphasizing performance goals) and their personal performance-
approach goals. Policies based on structural changes might reduce the performance goals of
supervisors and, through socialization, that of their subordinates.
6.3. Limitations
Some limitations should be noted. First, it should be stressed that the samples used in
the present study consisted of convenience samples, and replications using more
representative samples might provide a hint on the prevalence of performance goals
socialization. This limitation notwithstanding, the variety of the contexts of the data collection
speaks in favor of a potential generalization of our results: Performance goals socialization
was observed in sport teams, academic organizations, video game teams, and middle school
classrooms, and is likely to be observed across other social groups.
Second, higher-level sample sizes varied from one study to another (KS1 = 14, KS2 =
41, KS3 = 24, KS4 = 24). In multilevel modelling, the number of clusters is more important
than the number of participants (or than the average number of participants per cluster). For
instance, with 30 clusters, standard errors for the second-level variance components are
estimated about 15% too small (see Maas & Hox, 2005). Although the overall pattern of
results speaks in favor of the robustness of performance goals socialization, replications with
larger number of level-2 units would be an important future endeavor.
Third, the empirical evidence related to the effect of supervisors’ performance-
approach goals on the emergence of subordinates’ performance-avoidance goals were

PERFORMANCE GOALS SOCIALIZATION 34
substantially more complex. In Study 1, unexpected ceiling and floor effects of time were
found, whereas in Study 4’s, the effect was only found when subordinates (pupils) did not
know their supervisors (teachers). These findings might reflect the fact that the socialization
of performance-avoidance goals operates rather rapidly, to the extent that, in Study 4,
subordinates who knew their performance-approach-oriented supervisors before the study
might have already been socialized. Hence, we caution scholars willing to investigate the
effect of supervisors’ goals on their subordinates’ performance-avoidance goals that it might
be more difficult to detect.
Fourth, Studies 1 and 2’s results did not provide any evidence of mastery goals
socialization: Supervisor’s mastery goals did not significantly predict subordinates’ mastery
goals over time. On the one hand, such a null effect might be explained by a perceptual bias.
In explaining why cooperation is often (wrongly) perceived as being less prevalent than
competition, Kohn (1992) argued that “cooperation is not always plain in the eyes, whereas
competition […] can be readily observed” (p. 22; for an empirical illustration, see Maki,
Thorngate, & McClintock, 1979). As mastery goals rely on a self-referenced standard of
competence evaluation, whereas performance-approach goals rely on an other-referenced
standard (Elliot, 1999), supervisors’ performance-approach goals might be more easily
detectable (and endorsed) by subordinates (Eren, 2009). On the other hand, the null effect
might be explained by a social desirability bias. Since mastery goals are more socially
desirable than performance-approach goals, the level of self-reported mastery goals in the
literature is generally inflated relative to that of performance-approach goals (see Darnon et
al., 2009). As a matter of fact, in Studies 1 and 2, the distribution of mastery goals was highly
skewed to the left, which may have prevented to find evidence of mastery goals socialization.
It is therefore not implausible for mastery goals socialization to be observed in social
environments in which these goals are not perceived as socially desirable (e.g., organizations

PERFORMANCE GOALS SOCIALIZATION 35
in which competitiveness is valued and culture is focused on making profit; see Browaeys &
Price, 2008).
Fifth, the present set of studies did not study the mechanism(s) by which supervisors’
performance-approach goals are communicated to their subordinates. Drawing on the research
on classroom goal structure, it is legitimate to think that supervisors’ management and
instructional practices could mediate the relationship between supervisors’ performance-
approach goals and subordinates’ performance-based goals (Ames, 1992). Performance-
approach-oriented supervisors were found to use more repetitive task, to provide more
normative feedbacks (Meece, Anderman, & Anderman, 2005), or to display more
transactional leaderships (based on control and monitoring; Hamstra, Van Yperen, Wisse, &
Sassenberg, 2013). These performance-oriented practices may allow subordinates to detect
the supervisor’s performance-approach goals. Future research might also examine other
potential mediators, such as group performance-approach goals (i.e., the desire of the group as
an entity to outperform other groups; Porter, 2008) or perceived social utility of performance-
based goals (e.g., the perception of performance-approach goals as being an effective tool to
succeed; Dompnier et al., 2013).
6.4. Conclusion
Scholars have documented various effects pertaining to the hierarchical transmission
of values or motives: from caretakers to children (Elliot & Thrash, 2004), from instructors to
trainees (Radel, Sarrazin, Legrain, & Wild, 2010), or from principals to schoolchildren
(Berson & Oreg, 2016). The present work expands this research by offering a systematic
analysis of the phenomenon of performance goals socialization, and providing evidence on its
consequences, enabling condition, and directional moderator. Specifically, we have unraveled
the role of supervisors, as well as the influence of group-identification and perceived
competence, in explaining the evolution of subordinates’ performance-based goals. In

PERFORMANCE GOALS SOCIALIZATION 36
conclusion, the present set of studies sheds a new light on the process of achievement goals
construction and shows the critical importance of considering social hierarchy when studying
performance goals formation.

PERFORMANCE GOALS SOCIALIZATION 37
Authors’ Note
We wish to thank Alexandre Crisci, Alex Dionisio Calado, Vincent Reymond, Yannick
Sauter, Jeanne Ythier, and Guillaume Bonnaud for their help with data collection. We also
wish to thank Clanbase, ESReality, Maxime "Xou" Roussel, and Perpetual War, for their help
in recruiting Quake players. Finally, we wish to thank the principal of the secondary school in
which Study 4 was conducted, Martine Giovacchini, Mimon Flandin, who put us in contact
with her, and Suzanne Faber, for her help with recruitment of participants. This work was
supported by the Swiss National Science Foundation, and was part of Nicolas Sommet’s
doctoral thesis under the supervision of Fabrizio Butera.

PERFORMANCE GOALS SOCIALIZATION 38
References
Alwin, D. F., Cohen, R. L., & Newcomb, T. M. (1991). Political attitudes over the life span:
The Bennington women after fifty years. Madison, WI: The University of Wisconsin
Press
Ames, C. (1992). Classrooms: Goals, structures, and student motivation. Journal of
Educational Psychology, 84, 261-271.
Anderman, L. H., & Anderman, E. M. (1999). Social predictors of changes in students'
achievement goal orientations. Contemporary Educational Psychology, 24, 21-37.
Bacharach, S. B., Bamberger, P., & Conley, S. (1991). Work‐home conflict among nurses and
engineers: Mediating the impact of role stress on burnout and satisfaction at work.
Journal of Organizational Behavior, 12, 39-53.
Bachman, J. G., Sigelman, L., & Diamond, G. (1987). Self-selection, socialization, and
distinctive military values: Attitudes of high school seniors. Armed Forces & Society,
13, 169-187.
Barić, R. (2007). The relationship of coach’s leadership behaviour and his motivational
structure with athletes’ motivational tendencies (Unpublished doctoral dissertation).
University of Ljubljana, Ljubljana, Slovenia.
Bender, G. J. (1967). Political socialization and political change. The Western Political
Quarterly, 20, 390-407.
Berson, Y., & Oreg, S. (2016). The Role of School Principals in Shaping Children’s Values.
Psychological Science. In press.
Berk, K., & Carey, P. (2009). Data analysis with Microsoft Excel: Updated for Office 2007.
Cengage Learning.

PERFORMANCE GOALS SOCIALIZATION 39
Bigot, J., Pichot, N., & Testé, B. (2004). Is there a drop in normative clearsightedness in sixth
grade? Study of internality and normative clearsightedness in fourth to seventh
graders. European Journal of Psychology of Education, 19, 335-347.
Boardley, I. D., & Kavussanu, M. (2010). Effects of goal orientation and perceived value of
toughness on antisocial behavior in soccer: The mediating role of moral
disengagement. Journal of Sport and Exercise Psychology, 32, 176-192.
Browaeys, M.-J., & Price, R. (2008). Understanding cross-cultural management. Harlow,
UK: Pearson Education.
Butler, R. (2007). Teachers' achievement goal orientations and associations with teachers'
help seeking: Examination of a novel approach to teacher motivation. Journal of
Educational Psychology, 99, 241-252.
Cammann, C., Fichman, M., Jenkins, G. D., & Klesh, J. (1983). Michigan organizational
assessment questionnaire. In S. E. Seashore, E. E. Lawler, P. H. Mirvis, & C.
Cammann (Eds.), Assessing organizational change: A guide to methods, measures,
and practices (pp. 71-138). New York: Wiley.
Church, M. A., Elliot, A. J., & Gable, S. L. (2001). Perceptions of classroom environment,
achievement goals, and achievement outcomes. Journal of Educational Psychology,
93, 43-54.
Corker, K. S., Donnellan, M. B., & Bowles, R. P. (2013). The development of achievement
goals throughout college modeling stability and change. Personality and Social
Psychology Bulletin, 39, 1404-1417.
Darnon, B., & Butera, F. (2005). Buts d'accomplissement, stratégies d'étude, et motivation
intrinsèque: présentation d'un domaine de recherche et validation française de l'échelle
d'Elliot et McGregor (2001) [Achievement goals, study strategies, and intrinsic

PERFORMANCE GOALS SOCIALIZATION 40
motivation: Presenting a domain of research and the French validation of Elliot &
McGregor's scale]. L'Année Psychologique, 105, 105-131.
Darnon, C., Dompnier, B., Delmas, F., Pulfrey, C., & Butera, F. (2009). Achievement goal
promotion at university: social desirability and social utility of mastery and
performance goals. Journal of Personality and Social Psychology, 96, 119-134.
Darnon, C., Dompnier, B., & Poortvliet, M. P. (2012). Achievement goals in educational
contexts: A social psychology perspective. Social and Personality Psychology
Compass, 6, 760-771.
Darnon, C., Harackiewicz, J. M., Butera, F., Mugny, G., & Quiamzade, A. (2007).
Performance-approach and performance-avoidance goals: When uncertainty makes a
difference. Personality and Social Psychology Bulletin, 33, 813-827.
Dierdorff, E. C., & Ellington, J. K. (2012). Members Matter in Team Training: Multilevel and
Longitudinal Relationships Between Goal Orientation, Self‐Regulation, and Team
Outcomes. Personnel Psychology, 65, 661-703.
Diseth, Å., & Samdal, O. (2014). Autonomy support and achievement goals as predictors of
perceived school performance and life satisfaction in the transition between lower and
upper secondary school. Social Psychology of Education, 1-23.
Doise, W. (1986). Levels of explanation in social psychology. Cambridge, UK: Cambridge
University Press.
Dompnier, B., Darnon, C., & Butera, F. (2009). Faking the desire to learn: A clarification of
the link between mastery goals and academic achievement. Psychological Science, 20,
939-943.
Dompnier, B., Darnon, C., & Butera, F. (2013). When performance‐approach goals predict
academic achievement and when they do not: A social value approach. British Journal
of Social Psychology, 52, 587-596.

PERFORMANCE GOALS SOCIALIZATION 41
Dompnier, B., Darnon, C., Delmas, F., & Butera, F. (2008). Achievement goals and social
judgment: The performance-approach goals paradox. International Review of Social
Psychology / Revue Internationale de Psychologie Sociale, 21, 247-271.
Dragoni, L. (2005). Understanding the emergence of state goal orientation in organizational
work groups: the role of leadership and multilevel climate perceptions. Journal of
Applied Psychology, 90, 1084-1095.
Dweck, C. S. (1986). Motivational processes affecting learning. American Psychologist, 41,
1040-1048.
Elliot, A. J. (1999). Approach and avoidance motivation and achievement goals. Educational
Psychologist, 34, 169-189.
Elliot, A. J., & Church, M. A. (1997). A hierarchical model of approach and avoidance
achievement motivation. Journal of Personality and Social Psychology, 72, 218-232.
Elliot, A. J., & McGregor, H. A. (2001). A 2*2 achievement goal framework. Journal of
Personality and Social Psychology, 80, 501-519.
Elliot, A. J., McGregor, H. A., & Gable, S. L. (1999). Achievement goals, study strategies,
and exam performance: A mediational analysis. Journal of Educational Psychology,
91, 549-563.
Elliot, A. J., Murayama, K., & Pekrun, R. (2011). A 3 × 2 achievement goal model. Journal of
Educational Psychology, 103, 632.
Elliot, A. J., & Thrash, T. M. (2002). Approach-avoidance motivation in personality:
approach and avoidance temperaments and goals. Journal of Personality and Social
Psychology, 82, 804-818.
Eren, A. (2009). Exploring the relationships among mirror neurons, theory of mind, and
achievement goals: Towards a model of achievement goal contagion in educational
settings. Educational Research Review, 4, 233-247.

PERFORMANCE GOALS SOCIALIZATION 42
Falomir-Pichastor, J. M., Mugny, G., Invernizzi, F., Di Palma, A., & Estrada, M. M. (2007).
Does the campaign against tobacco use necessarily reduce the attractions of smoking
for young people? Identity issues surrounding initiation into tobacco consumption.
Revue Européenne de Psychologie Appliquée / European Review of Applied
Psychology, 57, 257-265.
Franklin, D. A., Porter, C. O., & Swider, B. W. (2013). The interactive effects of team content
goals and leader goal orientation. In Academy of Management Proceedings (Vol.
2013, No. 1, p. 10671). Academy of Management.
Feldman, D. C. (1994). Who's socializing whom? The impact of socializing newcomers on
insiders, work groups, and organizations. Human Resource Management Review, 4,
213-233.
Fidell, L. S., & Tabachnick. B. G. (2003). Preparatory data analysis. In J. A. Schinka & W. F.
Velicer (Eds.), Handbook of psychology (Vol. 2, pp. 115–121). New York: Wiley.
Fryer, J. W., & Elliot, A. J. (2007). Stability and change in achievement goals. Journal of
Educational Psychology, 99, 700-714.
Galinsky, A. D., Magee, J. C., Gruenfeld, D. H., Whitson, J. A., & Liljenquist, K. A. (2008).
Power reduces the press of the situation: implications for creativity, conformity, and
dissonance. Journal of Personality and Social Psychology, 95, 1450-1466.
Gatto, J., Dambrun, M., Kerbrat, C., & De Oliveira, P. (2010). Prejudice in the police: On the
processes underlying the effects of selection and group socialisation. European
Journal of Social Psychology, 40, 252-269.
Grehaigne, J. F., Godbout, P., & Bouthier, D. (1997). Performance assessment in team sports.
Journal of Teaching in Physical Education, 16, 500-516.

PERFORMANCE GOALS SOCIALIZATION 43
Grojean, M. W., Resick, C. J., Dickson, M. W., & Smith, D. B. (2004). Leaders, values, and
organizational climate: Examining leadership strategies for establishing an
organizational climate regarding ethics. Journal of Business Ethics, 55, 223-241.
Guimond, S. (2000). Group socialization and prejudice: The social transmission of intergroup
attitudes and beliefs. European Journal of Social Psychology, 30, 335-354.
Guinote, A. (2007). Power and goal pursuit. Personality and Social Psychology Bulletin, 33,
1076-1087.
Gully, S. M., & Phillips, J. M. (2005). A multilevel application of learning and performance
orientations to individual, group, and organizational outcomes. Research in Personnel
and Human Resources Management, 24, 1-51.
Halvari, H., & Kjormo, O. (1999). A structural model of achievement motives, performance
approach and avoidance goals, and performance among Norwegian Olympic athletes.
Perceptual and Motor Skills, 89, 997-1022.
Harackiewicz, J. M., Barron, K. E., Tauer, J. M., & Elliot, A. J. (2002). Predicting success in
college: A longitudinal study of achievement goals and ability measures as predictors
of interest and performance from freshman year through graduation. Journal of
Educational Psychology, 94, 562-575.
Harackiewicz, J. M., & Linnenbrink, E. A. (2005). Multiple achievement goals and multiple
pathways for learning: The agenda and impact of Paul R. Pintrich. Educational
Psychologist, 40, 75-84.
Hamstra, M. R., Van Yperen, N. W., Wisse, B., & Sassenberg, K. (2013). Transformational
and transactional leadership and followers’ achievement goals. Journal of Business
and Psychology, 3, 413-425.
Hendricks, J. W., & Payne, S. C. (2007). Beyond the Big Five: Leader goal orientation as a
predictor of leadership effectiveness. Human Performance, 20, 317-343.

PERFORMANCE GOALS SOCIALIZATION 44
Hirsch, J. E. (2005). An index to quantify an individual's scientific research output.
Proceedings of the National academy of Sciences of the United States of America, 102,
16569-16572.
Hornsey, M. J. (2008). Social identity theory and self‐categorization theory: A historical
review. Social and Personality Psychology Compass, 2, 204-222.
Jagacinski, C. M., Kumar, S., Boe, J. L., Lam, H., & Miller, S. A. (2010). Changes in
achievement goals and competence perceptions across the college semester.
Motivation and Emotion, 34, 191-204.
Janssen, O. (2000). Job demands, perceptions of effort‐reward fairness and innovative work
behaviour. Journal of Occupational and Organizational Psychology, 73, 287-302.
Janssen, O., & Van Yperen, N. W. (2004). Employees' goal orientations, the quality of leader-
member exchange, and the outcomes of job performance and job satisfaction.
Academy of Management Journal, 47, 368-384.
Judd, C. M., Yzerbyt, V. Y., & Muller, D. (2014). Mediation and moderation. In H. T. Reis &
C. M. Judd (Eds.), Handbook of research methods in social and personality
psychology (2nd edition, pp. 653-676). Cambridge, UK: Cambridge University Press.
Kaplan, A., & Flum, H. (2010). Achievement goal orientations and identity formation styles.
Educational Research Review, 5, 50-67.
Kasser, T., Cohn, S., Kanner, A. D., & Ryan, R. M. (2007). Some costs of American
corporate capitalism: A psychological exploration of value and goal conflicts.
Psychological Inquiry, 18, 1-22.
Kavussanu, M. (2006). Motivational predictors of prosocial and antisocial behaviour in
football. Journal of Sports Sciences, 24, 575-588.
Keltner, D., Gruenfeld, D. H., & Anderson, C. (2003). Power, approach, and inhibition.
Psychological Review, 110, 265-284.

PERFORMANCE GOALS SOCIALIZATION 45
Kohn, A. (1992). No contest: The case against competition (Revised Edition). Boston, MA:
Houghton Mills.
Kumar, S., & Jagacinski, C. M. (2011). Confronting task difficulty in ego involvement:
Change in performance goals. Journal of Educational Psychology, 103, 664-682.
Law, W., Elliot, A. J., & Murayama, K. (2012). Perceived competence moderates the relation
between performance-approach and performance-avoidance goals. Journal of
Educational Psychology, 104, 806-819.
LePine, J. A. (2005). Adaptation of teams in response to unforeseen change: effects of goal
difficulty and team composition in terms of cognitive ability and goal orientation.
Journal of Applied Psychology, 90, 1153-1167.
Maas, C. J., & Hox, J. J. (2005). Sufficient sample sizes for multilevel modeling.
Methodology: European Journal of Research Methods for the Behavioral and Social
Sciences, 1, 86-92.
MacKinnon, D. P., Lockwood, C. M., & Williams, J. (2004). Confidence limits for the
indirect effect: Distribution of the product and resampling methods. Multivariate
Behavioral Research, 39, 99-128.
Maki, J. E., Thorngate, W. B., & McClintock, C. G. (1979). Prediction and perception of
social motives. Journal of Personality and Social Psychology, 37, 203-220.
Martin, R., & Epitropaki, O. (2001). Role of organizational identification on implicit
leadership theories (ILTs), transformational leadership and work attitudes. Group
Processes & Intergroup Relations, 4, 247-262.
McAuliffe, B. J., Jetten, J., Hornsey, M. J., & Hogg, M. A. (2003). Individualist and
collectivist norms: When it's ok to go your own way. European Journal of Social
Psychology, 33, 57-70.

PERFORMANCE GOALS SOCIALIZATION 46
Meece, J. L., Anderman, E. M., & Anderman, L. H. (2006). Classroom goal structure, student
motivation, and academic achievement. Annual Review of Psychology, 57, 487-503.
Meece, J. L., & Miller, S. D. (2001). A longitudinal analysis of elementary school students'
achievement goals in literacy activities. Contemporary Educational Psychology, 26,
454-480.
Michel, J. W., Wallace, D. L., & Rawlings, R. A. (2013). Charismatic leaders: the role of
admiration and system justification. Leadership & Organization Development
Journal, 34, 469-487.
Moreland, R. L, & Levine J. M. (1982). Socialization in small groups: Temporal changes in
individual-group relations. In, L. Berkowitz (Ed.), Advances in experimental social
psychology (Vol. 15, pp. 137–192). New York, NY: Academic Press.
Muis, K. R., & Edwards, O. (2009). Examining the stability of achievement goal orientation.
Contemporary Educational Psychology, 34, 265-277.
Murdock, T. B., & Anderman, E. M. (2006). Motivational perspectives on student cheating:
Toward an integrated model of academic dishonesty. Educational Psychologist, 41,
129-145.
Murayama, K., & Elliot, A. J. (2011). Achievement motivation and memory achievement
goals differentially influence immediate and delayed remember–know recognition
memory. Personality and Social Psychology Bulletin, 37, 1339-1348.
Murayama, K., & Elliot, A. J. (2012a). The competition–performance relation: A meta-
analytic review and test of the opposing processes model of competition and
performance. Psychological Bulletin, 138, 1035-1070.
Murayama, K., & Elliot, A. J. (2012b). Further clarifying the competition-performance
relation: Reply to DW Johnson et al.(2012). Psychological Bulletin, 138, 1079-1084.

PERFORMANCE GOALS SOCIALIZATION 47
Murayama, K., Elliot, A. J., & Yamagata, S. (2011). Separation of performance-approach and
performance-avoidance achievement goals: A broader analysis. Journal of
Educational Psychology, 103, 238-256.
Newcomb, T. M. (1943). Personality and social change. New York: Dryden Press.
Newcomb, T. L., Koenig, K. E., Flacks, R., & Warwick, D. P. (1967). Persistence and
change: Bennington College and its students after 25 years. New York: John Wiley
and Sons.
Papaioannou, A., Bebetsos, E., Theodorakis, Y., Christodoulidis, T., & Kouli, O. (2006).
Causal relationships of sport and exercise involvement with goal orientations,
perceived competence and intrinsic motivation in physical education: A longitudinal
study. Journal of Sports Sciences, 24, 367-382.
Patrick, H., Kaplan, A., & Ryan, A. M. (2011). Positive classroom motivational
environments: Convergence between mastery goal structure and classroom social
climate. Journal of Educational Psychology, 103, 367-382.
Pekrun, R., Elliot, A. J., & Maier, M. A. (2009). Achievement goals and achievement
emotions: Testing a model of their joint relations with academic performance. Journal
of Educational Psychology, 101, 115-135.
Poortvliet, P. M., & Darnon, C. (2010). Toward a more social understanding of achievement
goals: The interpersonal effects of mastery and performance goals. Current Directions
in Psychological Science, 19, 324-328.
Poortvliet, P. M., & Giebels, E. (2012). Self-improvement and cooperation: How exchange
relationships promote mastery-approach driven individuals' job outcomes. European
Journal of Work and Organizational Psychology, 21, 392-425.
Porter, C. O. L. H. (2008). A multilevel, multiconceptualization perspective of goal
orientation in teams. In V. I. Sessa & M. London (Eds.), Work group learning:

PERFORMANCE GOALS SOCIALIZATION 48
Understanding and assessing how groups learn in organizations (pp. 149-173). New
York, NY: Taylor & Francis.
Preacher, K. J., & Selig, J. P. (2012). Advantages of Monte Carlo confidence intervals for
indirect effects. Communication Methods and Measures, 6, 77-98.
Preenen, P. T., Van Vianen, A. E., & De Pater, I. E. (2014). Challenging assignments and
activating mood: The influence of goal orientation. Journal of Applied Social
Psychology, 44, 650-659.
Radel, R., Sarrazin, P., Legrain, P., & Wild, T. C. (2010). Social contagion of motivation
between teacher and student: Analyzing underlying processes. Journal of Educational
Psychology, 102, 577-587.
Retelsdorf, J., & Günther, C. (2011). Achievement goals for teaching and teachers’ reference
norms: Relations with instructional practices. Teaching and Teacher Education, 27,
1111-1119.
Rucker, D. D., Preacher, K. J., Tormala, Z. L., & Petty, R. E. (2011). Mediation analysis in
social psychology: Current practices and new recommendations. Social and
Personality Psychology Compass, 5, 359-371.
Rumberger, R. W. (2001). Why students drop out of high school and what can be done. Paper
prepared for the conference, “Dropouts in America: How Severe is the Problem? What
Do We Know about Intervention and Prevention?” Cambridge, Massachusetts:
Harvard University. Retrieved from: http://civilrightsproject.ucla.edu/research/k-12-
education/school-dropouts/why-students-drop-out-of-school-and-what-can-be-
done/rumberger-why-students-dropout-2001.pdf
Ryan, R. M., Rigby, C. S., & Przybylski, A. (2006). The motivational pull of video games: A
self-determination theory approach. Motivation and Emotion, 30, 344-360.

PERFORMANCE GOALS SOCIALIZATION 49
Sage, L., Kavussanu, M., & Duda, J. (2006). Goal orientations and moral identity as
predictors of prosocial and antisocial functioning in male association football players.
Journal of Sports Sciences, 24, 455-466.
Sarrazin, P., Vallerand, R., Guillet, E., Pelletier, L., & Cury, F. (2002). Motivation and
dropout in female handballers: A 21‐month prospective study. European Journal of
Social Psychology, 32, 395-418.
Schwartz, S. H., Melech, G., Lehmann, A., Burgess, S., Harris, M., & Owens, V. (2001).
Extending the cross-cultural validity of the theory of basic human values with a
different method of measurement. Journal of Cross-Cultural Psychology, 32, 519-542.
Senko, C., & Harackiewicz, J. M. (2005). Regulation of Achievement Goals: The Role of
Competence Feedback. Journal of Educational Psychology, 97, 320-336.
Senko, C., Hulleman, C. S., & Harackiewicz, J. M. (2011). Achievement goal theory at the
crossroads: Old controversies, current challenges, and new directions. Educational
Psychologist, 46, 26-47.
Shim, S. S., Ryan, A. M., & Anderson, C. J. (2008). Achievement goals and achievement
during early adolescence: Examining time-varying predictor and outcome variables in
growth-curve analysis. Journal of Educational Psychology, 100, 655-671.
Skaalvik, E. M., & Skaalvik, S. (2013). Teachers’ perceptions of the school goal structure:
Relations with teachers’ goal orientations, work engagement, and job satisfaction.
International Journal of Educational Research, 62, 199-209.
Slabu, L., & Guinote, A. (2010). Getting what you want: Power increases the accessibility of
active goals. Journal of Experimental Social Psychology, 46, 344-349.
Smith, P. K., & Bargh, J. A. (2008). Nonconscious effects of power on basic approach and
avoidance tendencies. Social Cognition, 26, 1-24.

PERFORMANCE GOALS SOCIALIZATION 50
Sommet, N., Darnon C., & Butera, F. (2015). To confirm or to conform? Performance goals
as a regulator of conflict with more-competent others. Journal of Educational
Psychology, 107, 580-598.
Sommet, N., Darnon, C., Mugny, G., Quiamzade, A., Pulfrey, C., Dompnier, B., & Butera, F.
(2014). Performance goals in conflictual social interactions: Towards the distinction
between two modes of relational conflict regulation. British Journal of Social
Psychology, 53, 134-153.
Steinfeldt, J. A., Foltz, B. D., Mungro, J., Speight, Q. L., Wong, Y. J., & Blumberg, J. (2011).
Masculinity socialization in sports: Influence of college football coaches. Psychology
of Men & Masculinity, 12, 247-259.
Stephens, D. E. (2000). Predictors of likelihood to aggress in youth soccer: An examination of
coed and all-girls teams. Journal of Sport Behavior, 23, 311-325.
Stoeber, J., Stoll, O., Pescheck, E., & Otto, K. (2008). Perfectionism and achievement goals in
athletes: Relations with approach and avoidance orientations in mastery and
performance goals. Psychology of Sport and Exercise, 9, 102-121.
Tanaka, A., Okuno, T., & Yamauchi, H. (2013). Longitudinal tests on the influence of
achievement goals on effort and intrinsic interest in the workplace. Motivation and
Emotion, 37, 457-464.
Treasure, D. C., & Robert, G. C. (2001). Students' perceptions of the motivational climate,
achievement beliefs, and satisfaction in physical education. Research Quarterly for
Exercise and Sport, 72, 165-175.
Tuominen-Soini, H., Salmela-Aro, K., & Niemivirta, M. (2012). Achievement goal
orientations and academic well-being across the transition to upper secondary
education. Learning and Individual Differences, 22, 290-305.

PERFORMANCE GOALS SOCIALIZATION 51
Terry, D. J., & Hogg, M. A. (1996). Group norms and the attitude-behavior relationship: A
role for group identification. Personality and Social Psychology Bulletin, 22, 776-793.
Turner, J. C., Hogg, M. A., Oakes, P. J., Reicher, S. D., & Wetherell, M. S. (1987).
Rediscovering the social group: A self-categorization theory. Basil Blackwell.
Tyler, T. (2006). Psychological perspectives on legitimacy and legitimation. Annual Review
of Psychology, 57, 375–400.
Urdan, T., & Schoenfelder, E. (2006). Classroom effects on student motivation: Goal
structures, social relationships, and competence beliefs. Journal of School Psychology,
44, 331-349.
Valentiner, D. P., Mounts, N. S., Durik, A. M., & Gier-Lonsway, S. L. (2011). Shyness
mindset: Applying mindset theory to the domain of inhibited social behavior.
Personality and Individual Differences, 50, 1174-1179.
VandeWalle, D., Brown, S. P., Cron, W. L., & Slocum Jr, J. W. (1999). The influence of goal
orientation and self-regulation tactics on sales performance: A longitudinal field test.
Journal of Applied Psychology, 84, 249-259.
Van Yperen, N. (2003). The perceived profile of goal orientation within firms: Differences
between employees working for successful and unsuccessful firms employing either
performance-based pay or job-based pay. European Journal of Work and
Organizational Psychology, 12, 229-243.
Wenzel, M. (2004). The social side of sanctions: personal and social norms as moderators of
deterrence. Law and Human Behavior, 28, 547-567.
Willis, G. B., & Guinote, A. (2011). The effects of social power on goal content and goal
striving: A situated perspective. Social and Personality Psychology Compass, 5, 706-
719.

PERFORMANCE GOALS SOCIALIZATION 52
Wolters, C. A. (2004). Advancing achievement goal theory: Using goal structures and goal
orientations to predict students' motivation, cognition, and achievement. Journal of
Educational Psychology, 96, 236-250.
Wolters, C. A., Fan, W., & Daugherty, S. (2010). Teacher-reported goal structures: Assessing
factor structure and invariance. The Journal of Experimental Education, 79, 1-29.

PERFORMANCE GOALS SOCIALIZATION 53
Footnotes
1 Following generations of achievement goals research have additionally differentiated
mastery goals in terms of valence (i.e., mastery-approach vs. mastery-avoidance goals; a 2 x
2 framework, Elliot & McGregor, 2001) and in terms of standard for evaluating self-
competence (i.e., task- vs. self-goals; a 3 x 2 framework, Elliot, Murayama, & Pekrun, 2011).
As in this research we mostly focus on performance goals, we do not get into the details of
these various distinctions.
2 For exploratory purposes, we distinguished performance-approach goals toward out-
group members (i.e., desire to outperform opponents; as described above) from performance-
approach goals (i.e., desire to outperform teammates; 3 items, e.g., “When I play soccer, it is
important for me to play better than the players of my teams”; α = .83, M = 4.60, SD = 1.57).
The former corresponds to performance-approach goals as classically conceptualized in
achievement goals research in sport (see for instance, Sage, Kavussanu and Duda, 2006). The
latter form—to the best of our knowledge—has not been clearly conceptualized in the
literature. Neither coaches’ performance-approach, B = -0.04 [-0.33, 0.25], Z < |1|, p = .806,
not the interaction between coaches’ performance-approach and time, B = -0.01 [-0.05, 0.02],
Z < |1|, p = .546, were significantly different from zero. Thus, this variable was not further
considered in the present manuscript.
3 The fact that the standard deviation of the variable was superior to its mean indicated
a large dispersion of individual responses. Specifically, data showed a highly right-skewed
distribution (sk = 2.99) increasing the likelihood of outlier(s) being present. Using the
interquarile method, with a conservative cut-off of Q1 – 3 * IQR < xi < Q3 + 3 * IQR (where
Q1 is the first quartile, Q3 the third one, and IQR the interquartile range; see Berk & Carey,
2009), we detected six potential influential observations. However, as excluding them did not

PERFORMANCE GOALS SOCIALIZATION 54
change the patterns of results all hypothesized interaction effects remained significant at p
< .01), they were retained for the reported analyses.
4 Thereafter the “, 95% CI” is omitted. All square brackets therefore indicate a 95%
confidence interval.
5 We conducted a series of preliminary diagnostic analysis in order to detect potential
influential observations. DFFITS values—providing a measure of how deleting a particular
observation modifies regression results—were calculated. For one observation, they were
found to be above the cutoff point (i.e., |DFFITS| > 2 * √(k / n), where k is the number of
regressors, and n the number of observations; Fidell & Tabachnick, 2003) for both
performance-approach and -avoidance goals. Respective DFFITS values were of .41 and .43.
In keeping the participant, the interaction effects hypothesized in 1a and 1b remained
significant (ps < .045). In removing it, they became clearer (ps < .026).
6 For mastery goals, the low alpha value results from the low variance in participant
responses (n.b., less than 8% of the items responses were different than 6 or 7; for a similar
problem, see Darnon, Dompnier, Delmas, Pulfrey, & Butera, 2009).
7 Given the exploratory nature of the present study, two additional variables were
measured: (i) Seven items assessed the quality of leader-member exchange (e.g., “My
working relationship with my thesis supervisor is effective”; α = .93, M = 5.63, SD = 1.22;
Janssen & Van Yperen, 2004); (ii) Nine items assessed creativity “How often do you create
new ideas for improvement in your work?”; α = .88, M = 3.68, SD = 0.94; Janssen, 2000).
However, as the interaction effects between time students spent with their supervisors and
thesis supervisors’ performance-approach goals on both of these outcomes were non-
significant, detailed results were neither presented nor discussed.
8 Interactions between the potential achievement goal mediators were taken into
account in order to increase the predictive accuracy of our model. Past research controlled this

PERFORMANCE GOALS SOCIALIZATION 55
kind of achievement goal interactions when using satisfaction- or drop out-related measures
as outcomes (e.g., Janssen & Van Yperen, 2004). However, the moderation effects were not
reported in the main manuscript since the focus was not on the issue of multiple goals (for a
literature review on this matter, see Harackiewicz, & Linnenbrink, 2005). It is worth noting
that analysis revealed an interaction between Ph.D students’ mastery and performance-
approach goals on both satisfaction, B = 0.49 [0.17, 0.80], Z = 3.06, p = .002, and intention to
drop out, B = -0.66 [-0.98, -0.33], Z = -3.97, p < .001. No other interaction effect reached
significance. The details of the results are presented in Supplementary Material (Table S3).
9 In the context of multiple mediators (i.e., here Ph.D students’ achievement goals),
the reduction of total effect—i.e., the total effect (c) minus the direct effect (c’)—has poor
diagnostic value. Indeed, mediator variables can interfere with each other (e.g., one of it can
work as a suppressor variable, Judd, Muller, & Yzerbit, 2014) and, accordingly, Rucker,
Preacher, Tormala and Petty (2011) recommend to “abandon the emphasis on the significance
of c and c’ [in conducting mediation analyses]” (p. 368).
10 Confidence intervals were construed using the Monte Carlo simulation (MC;) rather
than the bias-corrected bootstrap method, as Preacher and Selig (2012) demonstrated that
“until one bootstrap method emerges as best in the multilevel context, MC may be the only
viable method [to assess indirect effect]” (p. 94).
11 Two elements have to be made clear. First, one team had two Clan Officers.
Performance-approach goals of these two leaders were therefore averaged. Second, eight
teams had no Clan Officer. For these teams, we treated their Clan Leader (i.e., the highest
remaining rank) as being the leader. In assessing the (potential) consequences of such a
decision, we entered this variable in our final model (coded “-0.5” for members having a
“Clan Leader” as a leader and “+0.5” for the ones having a “Clan Officer” as a leader). As the
variable neither produced significant effect on team-members’ performance-approach (p

PERFORMANCE GOALS SOCIALIZATION 56
= .427) and -avoidance (p = .806), nor changed the pattern of the expected second-order
interaction, the distinction was not further considered.
12 For the sake of full disclosure, teachers also answered six items extracted from the
Portrait Values Questionnaire (Schwartz et al., 2001); the analysis of these materials is not
reported, as they do not inform the present set of hypotheses.
13 The conclusions of the main analysis are the same when using pupils’ performance
goals at Wave 2 as the outcome variable (while controlling for performance-approach and -
avoidance goals at Wave 1). In doing so, the interaction effect between teachers’
performance-approach goals and pupils’ perceived self-competence on pupils’ performance
goals at Wave 2 is B = 0.02 [0.01, 0.04], Z = 3.19, p < .001, whereas the second-order
interaction between teachers’ performance-approach goals, pupils’ perceived self-
competence, and teacher familiarity on pupils’ performance-avoidance goal at Wave 2 is B =
0.03 [0.01, 0.06], Z = 2.36, p = .018. However, we have decided to keep using the difference
score as the outcome variable because this enabled us to estimate the average change in goal
endorsement.
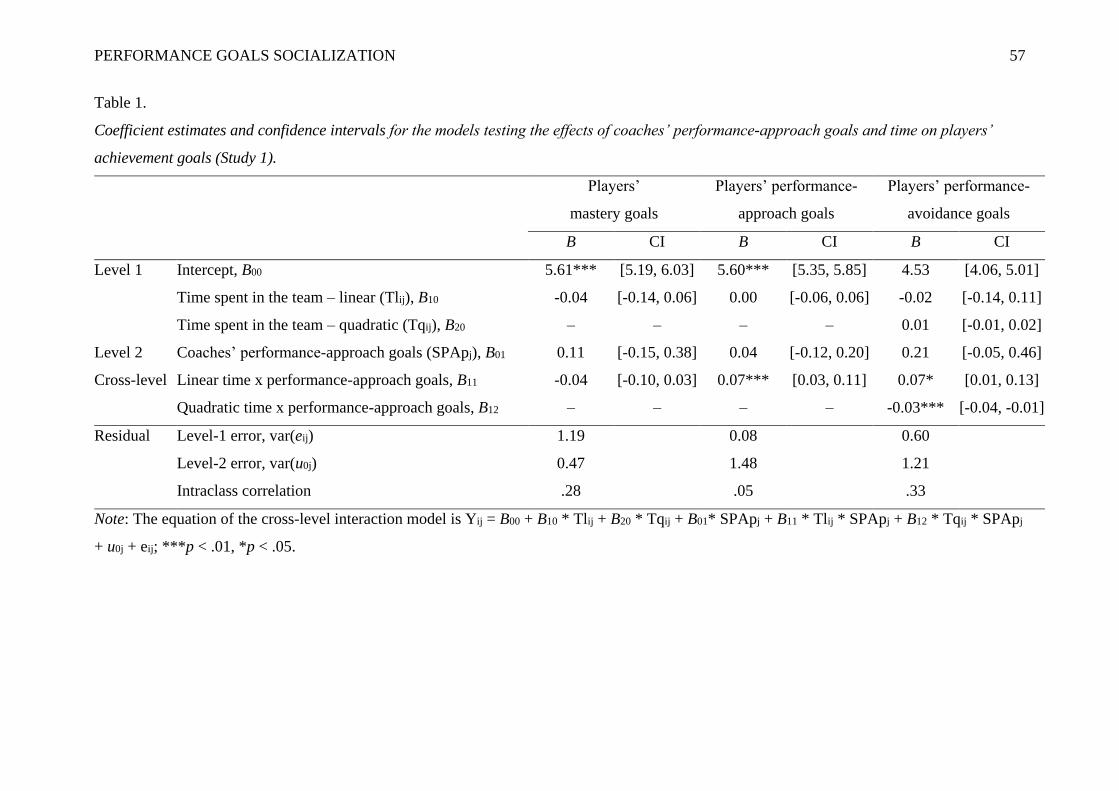
PERFORMANCE GOALS SOCIALIZATION 57
Table 1.
Coefficient estimates and confidence intervals for the models testing the effects of coaches’ performance-approach goals and time on players’
achievement goals (Study 1).
Players’
mastery goals
Players’ performance-
approach goals
Players’ performance-
avoidance goals
B CI B CI B CI
Level 1 Intercept, B00 5.61*** [5.19, 6.03] 5.60*** [5.35, 5.85] 4.53 [4.06, 5.01]
Time spent in the team – linear (Tlij), B10 -0.04 [-0.14, 0.06] 0.00 [-0.06, 0.06] -0.02 [-0.14, 0.11]
Time spent in the team – quadratic (Tqij), B20 – – – – 0.01 [-0.01, 0.02]
Level 2 Coaches’ performance-approach goals (SPApj), B01 0.11 [-0.15, 0.38] 0.04 [-0.12, 0.20] 0.21 [-0.05, 0.46]
Cross-level Linear time x performance-approach goals, B11 -0.04 [-0.10, 0.03] 0.07*** [0.03, 0.11] 0.07* [0.01, 0.13]
Quadratic time x performance-approach goals, B12 – – – – -0.03*** [-0.04, -0.01]
Residual Level-1 error, var(eij) 1.19 0.08 0.60
Level-2 error, var(u0j) 0.47 1.48 1.21
Intraclass correlation .28 .05 .33
Note: The equation of the cross-level interaction model is Yij = B00 + B10 * Tlij + B20 * Tqij + B01* SPApj + B11 * Tlij * SPApj + B12 * Tqij * SPApj
+ u0j + eij; ***p < .01, *p < .05.

PERFORMANCE GOALS SOCIALIZATION 58
Table 2.
Coefficient estimates and confidence intervals for the models testing the effects of thesis supervisors’ performance-approach goals and time on
players’ achievement goals (Study 2).
Students’
mastery goals
Students’ performance-
approach goals
Students’ performance-
avoidance goals
B CI B CI B CI
Level 1 Intercept, B00 6.52*** [6.39, 6.65] 3.41*** [3.05, 3.78] 3.51*** [3.19, 3.83]
Time spent in the group (Tij), B10 0.01 [-0.07, 0.09] -0.05 [-0.29, 0.19] -0.08 [-0.28, 0.11]
University affiliation (Affij), B20 0.11 [-0.16, 0.38] -0.12 [-0.83, 0.60] -0.38 [-1.09, 0.32]
Level 2 Supervisors’ perf.-approach goals (SPApj), B01 0.05 [-0.05, 0.16] -0.28 [-0.62, 0.06] -0.20 [-0.46, 0.06]
Cross-level Linear time x performance-approach goals, B11 -0.01 [-0.06, 0.04] 0.20** [0.03, 0.38] 0.15* [0.04, 0.26]
Residual Residual error, var(eij) 0.24 2.08 1.94
Note: The equation of the maximum likelihood regression model with standard errors adjusted for clustering is Yij = B00 + B10 * Tij + B20 * Affij +
B01* SPApj + B11 * Tlij * SPApj + eij; ***p < .01, **p < .01, *p < .05.

PERFORMANCE GOALS SOCIALIZATION 59
Table 3.
Coefficient estimates and confidence intervals for the models testing the effects of thesis supervisors’ performance-approach goals and time on
drop out and satisfaction, as mediated by students’ achievement goals (Study 2).
Intention to drop out Satisfaction
c1 path b1 paths c1 path b1 paths
B CI B CI B CI B CI
Level 1 Intercept, B00 2.34*** [2.08, 2.61] 2.43*** [2.20, 2,66] 4.79*** [4.52, 5.05] 4.75*** [4.52, 4.98]
Time spent in the group (Tij), B10 0.49*** [0.32, 0.67] 0.54*** [0.39, 0.70] 0.07 [-0.10, 0.24] 0.00 [-0.15, 0.15]
University affiliation (Affij), B20 0.06 [-0.50, 0.61] 0.44† [-0.08, 0.96] 0.30 [-0.26, 0.86] -0.14 [-0.66, 0.38]
Students’ mast.-app. goals (MApij), B30 – – -0.40† [-0.86, 0.07] 0.79*** [0.35, 1.24]
Students’ perf.-app. goals (PApij), B40 – – 0.18* [0.03, 0.34] -0.03 [-0.18, 0.11]
Students’ perf.-av. goals (PAvij), B50 – – 0.03 [-0.13, 0.20] -0.18* [-0.33, -0.02]
Level 2 Supervisors’ perf.-app. goals (SPApj), B01 -0.04 [-0.28, 0.20] 0.02 [-0.19, 0.24] 0.05 [-0.19, 0.29] -0.02 [-0.23, 0.20]
Cross-level Time x perf.-app. goals, B11 0.19** [0.05, 0.33] 0.18** [0.05, 0.31] -0.26*** [-0.40, -0.13] -0.25*** [-0.38, -0.12]
Residual Level-1 error, var(eij) 0.96 0.76 .82 .64
Level-2 error, var(u0j) 0.13 0.06 .22 .13
Intraclass correlation .12 .08 .21 .17
Notes: The equation of the cross-level interaction model is Yij = B00 + B10 * Tij + B20 * Affij + B30 * MApij + B40 * PApij + B50 * PAvij + B01*
SPApj + B11 * Tlij * SPApj + u0j + eij); The interaction effects between Ph.D. goals are not reported; ***p < .001, **p < .01, *p < .05, †p < .1.

PERFORMANCE GOALS SOCIALIZATION 60
Table 4.
Coefficient estimates and confidence intervals for the models testing the effects of leaders’ performance-approach goal, time, and identification
on players’ performance goals (Study 3).
Players’
performance-approach goals
Players’
performance-avoidance goals
B CI B CI
Level 1 Intercept, B00 5.38*** [5.06, 5.70] 4.93*** [4.43, 5.42]
Time spent in the group (Tij), B10 -0.03† [-0.06, 0] 0.04 [-0.02, 0.10]
Identification with the group (Iij), B20 -0.05 [-0.36, 0.26] -0.09 [-0.53, 0.36]
Initial performance (Pij), B30 -0.04† [-0.09, 0] -0.10** [-0.17, -0.04]
Time x identification with the group, B40 -0.03† [-0.06, 0] 0.00 [-0.05, 0.05]
Level 2 Leaders’ performance-approach goals (SPApj), B01 -0.25† [-0.55, 0.05] 0.27 [-0.11, 0.64]
Cross-level Time x leaders’ performance-approach goals, B11 0.00 [-0.04, 0.04] -0.01 [-0.09, 0.06]
Identification x leaders’ perf.-app. goals, B12 0.11 [-0.15, 0.37] 0.28† [-0.02, 0.59]
Time x identification x leaders’ perf.-app. goals, B13 0.05* [0.004, 0.09] 0.06* [0.01, 0.10]
Residual Random slope (Time spent in the group), var(u1j) – 0.00
Level-1 error, var(eij) .39 1.55
Level-2 error, var(u0j) .29 –
Intraclass correlation .43 –
Note: The equation of the cross-level interaction model is Yij = B00 + B10 * Tij + B20 * Iij + B30 * Pij + B40 * Tij * Iij + B01* SPApj + B11 * Tij *
SPApj + B12 * Iji * SPApj + B13 * Tij * Iji * SPApj + u1j * Tij + u0j + eij; ***p < .001, **p < .01, *p < .05, †p < .1.

PERFORMANCE GOALS SOCIALIZATION 61
Table 5.
Coefficient estimates and confidence intervals for the models testing the effects of teacher’s performance-approach goal and pupils’ perceived
self-competence on pupils’ performance goals (Study 4).
Players’
performance-approach goals
Players’
performance-avoidance goals
B CI B CI
Level 1 Intercept, B000 -0.29*** [-0.41, -0.17] -0.13* [-0.24, -0.02]
Perceptions of self-competence (SCijk), B100 -0.03† [-0.05, 0] -0.03* [-0.06, 0.00]
Teacher familiarity (Fijk), B200 0.18*** [0.14, 0.23] -0.04 [-0.18, 0.10]
Self-competence x familiarity, B300 -0.01 [-0.05, 0.03] -0.03 [-0.09, 0.02]
Level 2a Pupils’ performance goals (PGj), B010 – – 0.19*** [0.15, 0.24]
Level 2b Teachers’ performance-approach goals (SPApk), B001 0.02** [0.01, 0.04] 0.01 [-0.03, 0.04]
Cross-level Self-competence x teachers’ goals, B101 – – 0.00 [-0.01, 0.02]
Familiarity x teachers’ goals, B102 – – -0.05 [-0.13, 0.03]
Self-competence x familiarity x teachers’ goals, B103 – – 0.04* [0.01, 0.07]
Residual Random slope (Perceptions of self-competence), var(u1jk) 0.01 0.13
Random slope (Teachers’ perf.-approach goals), var(u2k) 0.05
Level-1 error, var(eijk) 1.13 1.16
Level-2a error, var(u0j) 1.50 1.01
Level-2b error, var(u0k) 0.00 0.00
Level-2a intraclass correlation –
Note: The equation of the cross-level interaction model is Yijk = B000 + B100 * SCijk + B200 * Fijk + B300 * SCijk * Fijk + B010 * PGj + B001 * SPApk +
B101 * SCijk * SPApk + B102 * Fijk * SPApk + B103 * SCijk * Fijk * SPApk + u1jk * SCijk + u2k * SPApk + u0k + u0j + eijk; ***p < .001, **p < .01, *p
< .05, †p < .1.

PERFORMANCE GOALS SOCIALIZATION 62
Figure Captions
Figure 1. Graphical representation of the socialization of performance goals (first
panel from the top; Hypothesis 1a and 1b), consequences (second panel; Hypothesis 2a and
2b), enabling condition (third panel; Hypothesis 3a and 3b), and directional moderator (fourth
panel; Hypothesis 4a and 4b). PAp stands for performance-approach and PAv for
performance-avoidance.
Figure 2. Players’ performance-approach (left panel) and -avoidance (right panel)
goals as a function of coaches’ performance-approach goals and number of years players
spent under the supervision of the coach. Study 1.
Figure 3. Moderation effect of thesis supervisors’ performance-approach and time
Ph.D. spent under their supervision on Ph.D. students’ intention to drop out and satisfaction,
through Ph.D. students’ performance-approach and -avoidance goals. Study 2.
Note. * p < .05, ** p < .01.
Figure 4. Ph.D. students’ intention to drop out from thesis (left panel) and satisfaction
(right panel) as a function of thesis supervisors’ performance-approach goals and number of
years Ph.D. students spent under the supervision of the supervisor. Study 2.
Figure 5. Team-members’ performance-approach (left panel) and -avoidance (right
panel) goals as a function of team-members’ identification with their team when time spent
under the supervision of the coach is high (+1 SD). Study 3.
Figure 6. Pupils’ change in performance-approach (left panel) and -avoidance (right
panel) goals as a function of teachers’ performance-approach goals and pupils’ perception of
self-competence. For the right panel, the interaction concerns the case where teacher was
unknown before school year began. Study 4.

PERFORMANCE GOALS SOCIALIZATION 63
Figure 1.

PERFORMANCE GOALS SOCIALISATION
64
Figure 2.
4
4.5
5
Pla
yer
's p
erfo
rman
ce-a
vo
idan
ce g
oal
s
5
5.5
6
Pla
yer
's p
erfo
rman
ce-a
pp
roac
h g
oal
s
1 0 M
(1.68)
+1 SD (2.16)
Number of years player spent
under the supervision of his/her coach
1 0 M
(1.68)
+1 SD (2.16)
Number of years player spent
under the supervision of his/her coach
Coach’s performance-approach goals
— High (+1 SD) - - - Low (-1 SD)

PERFORMANCE GOALS SOCIALISATION
65
Figure 3.

PERFORMANCE GOALS SOCIALISATION
66
Figure 4.
1
2
3
4
Ph
.D.
stu
den
ts' i
nte
nti
on
to
dro
p o
ut
3
4
5
6
Ph
.D. st
ud
ents
' sat
isfa
ctio
n
M (2.42)
-1 SD (0.93)
+1 SD (2.16)
Number of years Ph.D. student spent
under the supervision of his/her thesis supervisor
1
Number of years Ph.D. student spent
under the supervision of his/her thesis supervisor
M (2.42)
-1 SD (0.93)
+1 SD (2.16)
Supervisor’s performance-approach goals
— High (+1 SD) - - - Low (-1 SD)

PERFORMANCE GOALS SOCIALISATION
67
Figure 5.
+1 SD (6.45)
-1 SD (4.13)
4
5
6
7
Tea
m-m
emb
ers'
per
form
ance
-av
oid
ance
go
als
4
5
6
7
Tea
m-m
emb
ers'
per
form
ance
-ap
pro
ach
go
als
1
Team-leaders’ performance-approach goals
1
Team-leaders’ performance-approach goals
M (5.29)
+1 SD (6.45)
-1 SD (4.13)
M (5.29)
Members’ identification to their teams
— High (+1 SD) - - - Low (-1 SD)

Running head: PERFORMANCE GOALS SOCIALIZATION
68
Figure 6.
-0.5
-0.25
0
Chan
ge
in p
upil
s' p
erfo
rman
ce-a
ppro
ach g
oal
s
Teachers' performance-approach goals
M (2.58)
+1 SD (4.19)
-1 SD (0.97)
-0.5
-0.25
0
0.25
Chan
ge
in p
upil
s' p
erfo
rman
ce-a
void
ance
goal
s
Teachers' performance-approach goals
M (2.58)
+1 SD (4.19)
-1 SD (0.97)
Pupils’ perception of self-competence
— High (+1 SD) - - - Low (-1 SD)

Running head: PERFORMANCE GOALS SOCIALIZATION
69
Supplementary Material for
The Socialization of Performance Goals

Running head: PERFORMANCE GOALS SOCIALIZATION
70
In Study 1 to 4, we relied on Aguinis, Gottfredson and Culpepper’s (2013) multilevel
modeling procedure. For each outcome, we first built an unconditional means model and
calculated the intraclass correlation coefficient (Step #1). Then, we built a random slope
model to determine whether the between-cluster variations of the relevant lower-level
effect(s) needed to be taken into account (Step #2). Finally, we built a cross-level interaction
model from which sets of preliminary analysis were conducted (Step #3). In each study, the
multilevel models were simplified whenever possible in order to avoid overparametrization
and non-convergence issues (e.g., by excluding the random terms which did not improve the
model fit; see Bates, Kliegl, Vasishth, & Baayen, 2015).
1. Study 1. Coaches and Soccer Players
The results of the main models (from the unconditional means model to the final
cross-level interaction model) are reported in Table S1.
1.1. Multilevel Modeling Procedure
First, we built three unconditional means models: One for players’ mastery goals,
another for players’ performance-approach goals, and a last one for players’ performance-
avoidance goals. These models included no predictors and the intercept was allowed to vary
from one supervisor to another. As the distributions of the goal outcomes were slightly to
moderately left-skewed, quasi-maximum likelihood estimation was used (i.e., “sandwich”
estimators; Ruiz, 1994). The Intraclass Correlations Coefficient was ICC = .27 [.16, .43] for
mastery goals (i.e., 27 % of the variance in this goal was due to between-team differences),
ICC = .10 [.03, .28] for performance-approach goals, and ICC = .35 CI [.27, .44].
Second, we built three random intercept models. These models included all the grand-
mean centered predictors except the cross-level interaction. Given the low sample size at level
2 (K = 14), we decided not to take the between-supervisor variations of the effect of time into

Running head: PERFORMANCE GOALS SOCIALIZATION
71
account so as to avoid biases in the estimation (based on the recommendation of Hox, 2002;
see also Maas & Hox, 2005).
Third, we built the three cross-level interaction models. The following three predictors
were included in each model: grand-mean centered coaches’ performance-approach goals,
grand-mean centered time, and the interaction.
1.2. Preliminary Analysis
Three sets of preliminary analysis were conducted. First, grand-mean centered
coaches’ mastery goals as well as their interactions with the predictors were included in the
three models. As neither main nor interaction effect related to coaches’ mastery goals reached
significance, these terms were not further considered. Specifically, the main effects of
coaches’ mastery goals were as follows: on players' mastery goals, B = 0.22, [-0.31, 0.76], Z <
|1|, p = .415, on players' performance-approach goals, B = 0.19, [-0.28, 0.66], Z < |1|, p = .428,
and on player's performance-avoidance goals, B = 0.53, [-0.02, 1.09], Z = 1.89, p = .059. The
interaction effects between coaches’ mastery goals and time were as follows: on players’
mastery goals, B = -0.11, [-0.28, 0.07], Z = -1.20, p = .230, on players’ performance-approach
goals, B = -0.04, [-0.26, 0.19], Z < |1|, p = .757, and on player’s performance-avoidance goals,
B = -0.20, [-0.54, 0.15], Z = -1.12, p = .263.
Second, given the large range of the time variable (min = 0.08, max = 13.3), we aimed
at accounting for potential floor or ceiling effects in achievement goals socialization. Thus,
the quadratic term of time (i.e., squared number of years players spent under the supervision
of their coaches) and its interaction with coaches’ performance-approach goals, were included
in our three models. We observed a significant interaction effect for players’ performance-
avoidance goals (see Table 1 in the main manuscript). Thus, the terms were kept for this
outcome.

Running head: PERFORMANCE GOALS SOCIALIZATION
72
Third, a complete analysis of covariance aimed at determining the need for controlling
additional level-2 (age and seniority of the coaches) and/or level-1 (age and gender of the
players) variables. Coaches’ age was positively associated with players’ mastery and
performance-approach goals (ps ≤ .039). Moreover, players’ age negatively related to all
achievement goals (ps ≤ .024), and male players reported higher performance-approach goals
(p = .018). However, entering theses variables did not change the pattern of our results. As
their inclusion was not theoretically relevant in the present research, the terms were not
further considered (for a comment on the effects of age and gender on achievement goals, see
Bong, 2009, and Hyde & Durik, 2005, respectively).
2. Study 2. Thesis Supervisor and Ph.D. Students
2.1. Replication of Study 1’s Findings
The results of the main models (from the unconditional means model to the final
cross-level interaction model) are reported in Table S2.
2.1.1. Multilevel Modeling Procedure. Again, we first built three unconditional means
models (one per goal outcome). The intraclass correlation coefficient was ICC = .16 [0, .83]
for mastery goals and ICCs ≈ 0 for performance-approach and -avoidance goals. As they were
not significantly different from zero, the random intercept terms were removed from the
models.
Second, we built three random slope-only models. The effect of time was allowed to
vary from one supervisor to another (but not the intercept; see Hox, 2002). Considering the
between-cluster variations of the effect of time did not improve the model fit for any of the
goals, LRs χ(1)² ≈ 0, p ≈ 1.00. The random slope terms were removed from the models and
the use of multilevel modelling was not warranted.
Third, we built three maximum likelihood regression models with standard errors
adjusted for clustering (Rogers, 1993). The following three predictors were included in each

Running head: PERFORMANCE GOALS SOCIALIZATION
73
model: grand-mean centered thesis supervisors’ performance-approach goals, grand-mean
centered time, and the interaction. To account for potential sample effects, we additionally
controlled for university affiliation (coded “-0.5” for “Social Sciences” and “+0.5” for
“Technical Sciences”).
2.1.2. Preliminary Analysis. Two sets of preliminary analysis were conducted. First, as in
Study 1, grand-mean centered thesis supervisors’ mastery goals as well as their interactions
with our predictors of interest were included in the three models. As neither main nor
interaction effect related to thesis supervisors’ mastery goals reached significance, these terms
were not further considered. Specifically, the main effects of thesis supervisors' mastery goals
were as follows: on Ph.D. students' mastery goals, B = 0.13, [-0.19, 0.44], Z < |1|, p = .420, on
Ph.D. students' performance-approach goals, B = 0.28, [-0.53, 1.08], Z < |1|, p = .490, on
Ph.D. students' performance-avoidance goals, B = 0.24, [-0.38, 0.86], Z < |1|, p = .440. The
interaction effects between thesis supervisors’ mastery goals and time were as follows: on
Ph.D. students’ mastery goals, B = -0.03, [-0.23, 0.17], Z < |1|, p = .780, on Ph.D. students’
performance-approach goals, B = -0.05, [-0.59, 0.50], Z < |1|, p = .861, on Ph.D. students’
performance-avoidance goals, B = 0.13, [-0.40, 0.64], Z < |1|, p = .631.
Second, a complete analysis of covariance aimed at determining the need for
controlling additional level-2 (gender of the thesis supervisor) and/or level-1 (gender and age
of the Ph.D. students) variables. The effects of these variables were not found to be significant
and entering them did not change the pattern of our results. The terms were not further
considered.
2.2. Consequences of Performance Goals Socialization.
2.2.1. Multilevel modeling procedure for Ph.D. students’ intention to drop out of thesis.
First, we built an unconditional means model. The intraclass correlation coefficient was ICC
= .15 [.02, .66]. Second, we built a random intercept and random slope model. Considering

Running head: PERFORMANCE GOALS SOCIALIZATION
74
the between-cluster variations of the effect of time did not improve the model, LRs χ(1)² < 1,
p = 0.804. The random slope term was removed from the model. Third, we built a cross-level
interaction model including the same four predictors as before. Fourth, we built another cross-
level interaction model adding all grand-mean centered students’ achievement goals and their
interactions. The results are reported in full in the third to sixth columns of Table S3.
2.2.1. Multilevel modeling procedure for Ph.D. students’ satisfaction. First, we built an
unconditional means model. The intraclass correlation coefficient was ICC = .28 [.08, .64].
Second, we built a random intercept and random slope model. Considering the between-
cluster variations of the effect of time did not improve the model, LRs χ(1)² < 1, p = .678. The
random slope term was removed from the model. Third, we built a cross-level interaction
model including the same four predictors as before. Fourth, we built another cross-level
interaction model adding all grand-mean centered students’ achievement goals and their
interactions. The results are reported in full in the final four columns of Table S3.
3. Study 3. Video Game Team Leaders and Players
The results of the main models (from the unconditional means model to the final
cross-level interaction model) are reported in Table S4.
3.1. Multilevel Modeling Procedure
Again, we first built two unconditional means models (one per performance goal
outcome). The intraclass correlation coefficients was ICC = .16 [.01, .82] for performance-
approach goals and ICC = .05 [0, .98] for performance-avoidance goals. As the intraclass
correlation coefficient was significantly different from zero for performance-approach goals
but not for performance-avoidance goals, the random intercept was only kept for the former
outcome.
Second, we built a random slope and random intercept model for players’ performance-
approach goals and a random slope-only model for players’ performance-avoidance goals.

Running head: PERFORMANCE GOALS SOCIALIZATION
75
Considering the between-cluster variations of the effect of time did not improve the model fit
for performance-approach goals, LRs χ(1)² < 1, p = .719, but did marginally improve the
model fit for performance-avoidance goals, LRs χ(1)² = 3.36, p = .067. Thus, the random
slope term was only kept for the latter outcome.
Third, we built the two cross-level interaction models. As in Study 2, standard errors
were adjusted for clustering for performance-avoidance goals. The following eight predictors
were included in each model: grand-mean centered leaders’ performance-approach goals,
grand-mean centered time, grand-mean centered members’ identification, and their
interactions.
3.2. Preliminary Analysis
As in Studies 1 and 2, a complete analysis of covariance aimed at determining the
need for controlling additional level-2 (age of the leader) and/or level-1 (age and performance
of the player) variables. We observed a significant effect of performance for both
performance-approach and -avoidance goals (see Table 4 in the main manuscript). Thus, the
terms were kept for both outcomes.
3.3. Alternative Representation of the Hypothesized Three-Way Interactions
Figure S1 presents the three-way interactions between leaders’ performance-approach
goals, time, and members’ identification on team-members’ performance-approach (left
panel) and performance-avoidance goal (right panel), using 3-D surface charts.
4. Study 4. Schoolteachers and Pupils
The results of the three models (from the unconditional means model to the final
cross-level interaction model) are reported in Table S5.
4.1. Multilevel Modeling Procedure
As compared to Studies 1 to 3, the structure of the data of Study 4 was more complex.
It consisted of i level-1 (i.e., within-pupil) discipline observations (i.e., performance goals and

Running head: PERFORMANCE GOALS SOCIALIZATION
76
perceived self-competence in Mathematics, French, History, etc.; N = 2060 observations),
nested in two non-hierarchical clusters: (i) level-2a units, consisting of j pupils (i.e., each
discipline-specific observation relates to a specific pupil; K2a = 496 pupils), and (ii) level-2b
units, consisting of k teachers (i.e., each discipline-specific observation relates to a specific
teacher; K2b = 24 teachers). The units are said to be cross-classified to the extent that level-1
units in a given cluster are not sub-classified by the further factor (Rabe-Hesketh & Skrondal,
2012). Additionally, pupils were nested in level-3 units, consisting of l classes (i.e., each pupil
belonged to a specific class; L = 25 classes; for a graphical representations of such a cross-
classified data structure, see Figure S2).
First, we built two unconditional means models: One for change in pupils’
performance-approach and another for change in pupils’ performance-approach and
performance-avoidance goals. For each model, the intercept was allowed to vary between
pupils (level 2a), teachers (level 2b) and classes (level 2c). At level 2a, the intraclass
correlation coefficient was ICC2a = .51 [.47, .55] for performance-approach goals (i.e., 51 %
of the variance in this goal was due to between-pupil differences) and ICC2a = .40 CI
[.36, .54] for performance-avoidance goals. Thus, the level-2a random intercept terms were
kept for both model. At level 2b, the intraclass correlation coefficients were ICCs2b ≈ 0 for
performance-approach and -avoidance goals. However, one should keep in mind that we
expected a cross-level interaction effect between a level-1 variable (pupils’ self-competence
in a given discipline) and a level-2b variable (teachers’ performance-approach goals). As
stated by Rabe-Hesketh and Skrondal (2012), in cross-classified models, “the residual error eij
comprises both the interaction between [observations] and [teacher] and any other effects
specific to [observations] i in [teacher] j” (p. 436). Although the intraclass correlation
coefficients were not significantly different from zero, the level-2b random intercept terms
were kept for both model. At level 3, the intraclass correlation coefficients were ICCs3 ≈ 0 for

Running head: PERFORMANCE GOALS SOCIALIZATION
77
performance-approach and -avoidance goals. Thus, the level-3 random intercept terms were
removed from both model.
Second, we built two series of random slope and random intercept models.
Considering the between-pupil variations of the effect of perceived self-competence improved
the model fit for change in pupils’ performance-approach goals, LR χ(1)² = 11.54, p < .001,
and for change in pupils’ performance-avoidance goals, LR χ(1)² = 18.09, p < .001. The
random slope terms were kept for both models. However, considering the between-pupil
variations of the effect of teacher’s performance-approach improved the model fit for change
in pupils’ performance-approach goals, LR χ(1)² = 27.68, p < .001, but not for change in
pupils’ performance-avoidance goals, LR χ(1)² < 1, p ≈ 1.00. Thus, the random slope term
was only kept for the former model.
Third, we built the two cross-level interaction models. The following three predictors
were included in each model: grand-mean centered teachers’ performance-approach goals,
grand-mean centered pupils’ perceived self-competence, and the interaction. As this study
was devoted to disentangling the effects on subordinates’ performance-approach goals from
the ones on performance-avoidance goals, we additionally controlled for pupils’ performance-
avoidance goals when the outcome was their performance-approach goals, and vice versa.
4.2. Preliminary Analysis
As in Studies 1 to 3, a complete analysis of covariance aimed at determining the need
for controlling additional level-2b (age, seniority, and gender of the teachers), level-2a (grade
level, age and gender of the pupils), and/or level-1 (discipline and the fact that the pupil did
know his/her teacher in a given discipline before the school year) variables. We observed a
significant effect of teacher familiarity on pupils’ change in performance-avoidance (see
Table 5 in the main manuscript). Thus, the term was kept for this outcome.

Running head: PERFORMANCE GOALS SOCIALIZATION
78
References
Bates, D., Kliegl, R., Vasishth, S., & Baayen, H. (2015). Parsimonious mixed models.
arXiv:1506.04967.
Bong, M. (2009). Age-related differences in achievement goal differentiation. Journal of
Educational Psychology, 101, 879-896.
Hox, J. J. (2002). Multilevel analysis: Techniques and applications. Mahwah, NJ: Erlbaum.
Hyde, J. S., & Durik, A. M. (2005). Gender, competence, and motivation. In A. J. Elliot & C.
S. Dweck (Eds.), Handbook of competence and motivation (pp. 375–391). New York,
NY: The Guilford Press.
Maas, C. J., & Hox, J. J. (2004). The influence of violations of assumptions on multilevel
parameter estimates and their standard errors. Computational Statistics & Data
Analysis, 46, 427-440.
Rabe-Hesketh, S., & Skrondal, A. (2012a). Multilevel and longitudinal modeling using Stata,
Volume I: Continuous Responses (3rd ed.). College Station, TX: Stata Press.
Rogers, W. H. (1993). Regression standard errors in clustered samples. Stata Technical
Bulletin, 13, 19–23.

Running head: PERFORMANCE GOALS SOCIALIZATION
79
Table S1.
Coefficient estimates for the models testing the effects of coaches’ performance-approach goals and time on players’ achievement goals (Study
1).
Players’
mastery goals
Players’ performance-
approach goals
Players’ performance-
avoidance goals
UM RI CLI UM RI CLI UM RI CLI
Level 1 Intercept, B00 5.62*** 5.63*** 5.61** 5.57*** 5.57*** 5.60 4.52*** 4.53*** 4.53***
Time spent in the team – linear (Tlij), B10 – -0.05 -0.04 – 0.02 0.004 – -0.03 -0.02
Time spent in the team – quadratic (Tqij), B20 – – – – – – – -0.003 -0.01
Level 2 Coaches’ performance-approach goals (SPApj), B01 – 0.11 0.11 – 0.04 0.04 – 0.12 0.21
Cross-level
interactions
Linear time x performance-approach goals, B11 – – -0.04 – – 0.07*** – – 0.07*
Quadratic time x performance-approach goals, B12 – – – – – – – – -0.03***
Residual Level-1 error, var(eij) 1.22 1.22 1.19 0.17 0.17 0.08 0.70 0.64 0.60
Level-2 error, var(u0j) 0.45 0.40 0.47 1.48 1.47 1.48 1.28 1.27 1.21
Intraclass correlation, ρ .27 .24 .28 .10 .10 .05 .35 .33 .33
Note: UM stands for Unconditional Means model (i.e., Yij = B00 + u0j + eij), RI for Random Intercept model (i.e., Yij = B00 + B10 * Tlij + B20 * Tqij
+ B01* SPApj + u0j + eij), and CLI for Cross-Level Interaction model (i.e., Yij = B00 + B10 * Tlij + B20 * Tqij + B01* SPApj + B11 * Tlij * SPApj +
B12 * Tqij * SPApj + u0j + eij) ; ***p < .001, *p < .05.

Running head: PERFORMANCE GOALS SOCIALIZATION
80
Table S2.
Coefficient estimates for the models testing the effects of thesis supervisors’ performance-approach goals and time on Ph.D. students’
achievement goals (Study 2).
Students’
mastery goals
Students’ performance-
approach goals
Students’ performance-
avoidance goals
UM RSO MLR UM RSO MLR UM RSO MLR
Level 1 Intercept, B00 6.52*** 6.52*** 6.52*** 3.34*** 3.36*** 3.41*** 3.46*** 3.47*** 3.51***
Time spent in the group (Tij), B10 – 0.01 0.01
– 0.00 -0.05
– -0.05
-0.08
University affiliation (Affij), B20 – 0.10 0.11 – 0.08 -0.12 – -0.24 -0.38
Level 2 Supervisors’ perf.-approach goals (SPApj), B01 – 0.05 0.05 – -0.16 -0.28 – -0.11 -0.20
Cross-level Time x performance-approach goals, B11 – – -0.01 – – 0.20** – – 0.15*
Residual Level-1 error, var(eij) 0.22 0.24 0.24 2.24 2.21 2.08 2.05 2.01 1.94
Level-2 error, var(u0j) 0.03 – – 0.00 – – 0.00 – –
Random slope (Time spent in the group), var(u1j) – 0.00 – – – – – – –
Intraclass correlation 0.14 – – 0.00 – – 0.00 – –
Note: UM stands for Unconditional Means model (i.e., Yij = B00 + u0j + eij), RSO for Random Slope-Only model (i.e., Yij = B00 + B10 * Tij + B20 *
Affij + B01* SPApj + u1j * Tij + eij), and MLR for Maximum Likelihood Regression model with standard errors adjusted for clustering (i.e., Yij =
B00 + B10 * Tij + B20 * Affij + B01* SPApj + B11 * Tlij * SPApj + eij) ; ***p < .001, **p < .01, *p < .05.

Running head: PERFORMANCE GOALS SOCIALIZATION
81
Table S3.
Coefficient estimates for models testing the effects of thesis supervisors’ performance-approach goals and time on intention to drop out and
satisfaction, as mediated by students’ achievement goals (Study 2).
Intention to drop out
(c1 and b1 paths)
Satisfaction
(c2 and b2 paths)
UM RIRS CLI 1 CLI 2 UM RIRS CLI 1 CLI 2
Level 1 Intercept, B00 2.30*** 2.30*** 2.34*** 2.43 4.83*** 4.84*** 4.79*** 4.75***
Time spent in the group (Tij), B10 – 0.54*** 0.49*** 0.54*** – 0.01 0.07 0.00
University affiliation (Affij), B20 – 0.24 0.06 0.44† – 0.04 0.30 -0.14
Ph.D. students’ mast.-app. goals (SMApij), B30 – – – -0.40† – – – 0.79***
Ph.D. students’ perf.-app. goals (SPApij), B40 – – – 0.18* – – – -0.03
Ph.D. students’ perf.-av. goals (SPAvij), B50 – – – 0.03 – – – -0.18*
Ph.D. students’ mast.-app. x perf-.app., B60 – – – -0.66*** – – – 0.49**
Ph.D. students’ mast.-app. x perf-.av., B70 – – – -0.19 – – – 0.22
Ph.D. students’ perf-.app. x perf-.av., B80 – – – 0.03 – – – -0.07
Ph.D. students’ mast.-app. x perf-.app. x perf-.av., B90 – – – -0.17 – – – 0.16
Level 2 Supervisors’ perf.-app. goals (SPApj), B01 – 0.05 -0.04 0.02 – -0.07 0.05 -0.02
Cross-level Time x perf.-app. goals, B11 – – 0.19** 0.18** – -- -0.26*** -0.25***
Residual Random slope (Time spent in the group), var(u1j) – 0.01 – – – 0.02 –
Level-1 error, var(eij) 1.55 1.03 0.96 0.76 0.92 0.86 0.82 .64
Level-2 error, var(u0j) 0.29 0.14 0.13 0.06 0.35 0.35 0.22 .13
Intraclass correlation .16 .12 .12 .08 .27 .29 .21 .17
Notes: UM stands for Unconditional Means model (i.e., Yij = B00 + u0j + eij), RIRS for Random Slope and Random Intercept model (i.e., Yij = B00
+ B10 * Tij + B20 * Affij + B01* SPApj + u1j * Tij + u0j + eij), and CLI for Cross-Level Interaction model (i.e., Yij = B00 + B10 * Tij + B20 * Affij +
B30 * SMApij + B40 * SPApij + B50 * SPAvij + B60 * SMApij * SPApij + B70 * SMApij * SPAvij + B80 * SPAvij * SPApij + B90 * SMApij * SPApij *
SPAvij + B01* SPApj + B11 * Tlij * SPApj + u0j + eij); ***p < .001, **p < .01, *p < .05, †p < .1.

Running head: PERFORMANCE GOALS SOCIALIZATION
82
Table S4
Coefficient estimates for the models testing the effects of team-leaders’ performance-approach goals, time, and identification on players’
performance goals (Study 3).
Players’ performance-approach goals Players’ performance-avoidance goals
UM RIRS CLI UM RSO CLI
Level 1 Intercept, B00 5.26*** 5.32*** 5.38*** 4.74*** 4.90*** 4.93***
Time spent in the group (Tij), B10 – -0.03† -0.03† – 0.02 0.04
Identification with the group (Iij), B20 – -0.10 -0.05 – -0.26 -0.09
Initial performance (Pij), B30 – -0.03 -0.04† – -0.10* -0.10**
Time x identification with the group, B40 – -0.04* -0.03† – -0.01 0.00
Level 2 Leaders’ performance-approach goals (SPApj), B01 – -0.20 -0.25† – 0.39† 0.27
Cross-level Time x leaders’ performance-approach goals, B11 – – 0.00 – – -0.01
Identification x leaders’ perf.-app. goals, B13 – – 0.11 – – 0.28†
Time x identification x leaders’ perf.-app. goals, B14 – – 0.05* – – 0.06*
Residual Random slope (Time spent in the group), var(u1j) – 0.00 – – 0.01 0.004
Level-1 error, var(eij) 0.83 0.49 0.39 2.60 1.48 1.55
Level-2 error, var(u0j) 0.16 0.19 0.29 0.13 – –
Intraclass correlation .16 .28 .43 .05 – –
Notes: UM stands for Unconditional Means model (i.e., Yij = B00 + u0j + eij), RIRS for Random Intercept and Random Slope model (i.e., Yij = B00
+ B10 * Tij + B20 * Iij + B30 * Pij + B40 * Tij * Iij + B01* SPApj + u1j * Tij + u0j + eij), RSO for Random Slope-Only model (i.e., Yij = B00 + B10 * Tij +
B20 * Iij + B30 * Pij + B40 * Tij * Iij + B01* SPApj + u1j * Tij + eij), and CLI for Cross-Level Interaction model (i.e., Yij = B00 + B10 * Tij + B20 * Iij +
B30 * Pij + B40 * Tij * Iij + B01* SPApj + B11 * Tij * SPApj + B12 * Iji * SPApj + B13 * Tij * Iji * SPApj + u1j * Tij + u0j + eij); ***p < .001, **p < .01,
*p < .05, †p < .1.

Running head: PERFORMANCE GOALS SOCIALIZATION
83
Table S5.
Coefficient estimates for the models of the procedure testing the effects of teachers’ performance-approach goal and pupils’ perceived self-
competence on pupils’ performance goals (Study 4).
Pupils’ performance-approach goals Pupils’ performance-avoidance goals
UM RIRS CLI UM RIRS CLI
Level 1 Intercept, B0000 -0.31*** -0.28*** -0.29*** -0.18*** -0.12* -0.13*
Perceptions of self-competence (SCijkl), B1000 – -0.03† -0.03† – -0.04* -0.03*
Teacher familiarity (Fijkl), B2000 – – -- – -0.02 -0.04
Self-competence x familiarity, B3000 – – -- – -0.04 -0.03
Level 2a Pupils’ performance goals (PGjl), B0100 – 0.18*** 0.18*** – 0.19*** 0.19***
Level 2b Teachers’ performance-approach goals (SPApkl), B0010 – 0.001 -0.01 – 0.01 0.01
Cross-level Self-competence x teachers’ goals, B1010 – – 0.02** – – 0.001
Familiarity x teachers’ goals, B1020 – – -- – – -0.05
Self-competence x Familiarity x teachers’ goals, B1030 – – -- – – 0.04*
Residual Random slope (Perceptions of self-competence), var(u1jkl) – 0.01 0.01 – 0.02 0.13
Random slope (Teachers’ perf.-approach goals), var(u2kl) – 0.05 0.05 – 0.00 –
Level-1 error, var (eijkl) 1.41 1.13 1.13 1.53 1.35 1.16
Level-2a error, var (u0jl) 1.49 1.51 1.50 1.03 1.01 1.01
Level-2b error, var (u0kl) 0.001 0.000 0.000 0.002 0.001 0.000
Level-3 error, var (u0l) 0.000 – – 0.000 – –
Level-2a intraclass correlation .51 .57 .57 .40 .43 .46
Notes: UM stands for Unconditional Means model (i.e., Yijkl = B0000 + u0jl + u0kl + u0l + eijkl), RIRS for Random Intercept and Random Slope
model (i.e., Yijkl = B0000 + B1000 * SCijkl + B2000 * Fijkl + B3000 * SCijkl * Fijkl + B0100 * PGjl + B0010 * SPApkl + u1jkl * SCijkl + u2kl * SPApkl + u0kl +
u0jl + eijkl), and CLI for Cross-Level Interaction model (i.e., Yijkl = B0000 + B1000 * SCijkl + B2000 * Fijkl + B3000 * SCijkl * Fijkl + B0100 * PGjl + B0010 *
SPApkl + B1010 * SCijkl * SPApkl + B1020 * Fijkl * SPApkl + B1030 * SCijkl * Fijkl * SPApkl + u1jkl * SCijkl + u2kl * SPApkl + u0kl + u0jl + eijkl); ***p
< .001, **p < .01, *p < .05, † p < .1.

Running head: PERFORMANCE GOALS SOCIALIZATION
84
Figure S1. Team-members’ performance-approach (left panel) and -avoidance (right panel) goals as a function of team-members’ identification
with their team (legend), team-leaders’ performance-approach goals (x axis), and time spent under the supervision of the leader (z axis). For each
panel, the condition under which leader’s performance-approach goals and team-members’ performance-based goals are posited to be associated
is identified by a double-arrow (i.e., elevated time and high identification). Study 3.

Running head: PERFORMANCE GOALS SOCIALIZATION
85
!
Pupils identification
number
Discipline Teachers
identification number
Class identification number
1 Ma 1 1
1 Fr 2 1
1 Eng 3 1
1 … … 1
2 Ma 1 1
2 Fr 2 1
2 Eng ? 1
2 … … 1
3 Ma ? 2
3 Fr 2 2
3 Eng 3 2
3 … … 2
4 Ma ? ?
4 Fr ? ?
4 Eng ? ?
4 … ? ?

Running head: PERFORMANCE GOALS SOCIALIZATION
86
Figure S2. An example of the organization of the data matrix of Study 4 for three pupils (upper panel; the data are fictitious), as well as a
graphical representation of its cross-classified structure (lower panel). “Ma” stands for Mathematics, “Fr” for French, “Eng” for English; “…”
indicated that there were six disciplines overall.
Level 1.
“discipline-level” Fr Ma Eng … Fr Ma Eng … Fr Ma Eng …
Level 2a.
“pupils-level” 1 2 3
Level 2b.
“teacher-level” 1 2 3
Level 3.
“class-level” 1 2