the simulation of fluid dynamics inside the continuous
TRANSCRIPT

The Simulation of Fluid Dynamics inside the Continuous Wave Mud Pulser Generator with Four-hole Rotary Valve
Qin-Feng DI1,2, He ZHANG1,2, Ze-Zhong JIN1,2, Feng CHEN1,2, Wen-Chang WANG1,2,a, Hai-Tao SONG1,2
1Shanghai Institute of Applied Mathematics and Mechanics, Shanghai University, Shanghai 200072, China;
2Shanghai Key Laboratory of Mechanics in Energy Engineering, Shanghai 200072, China
Keywords: Simulation; Fluid Dynamics; Continuous wave mud pulse generator; Four-hole rotary
valve; Rotor torque; Rotorconsumed power.
Abstract. The continuous wave pulse generator with rotary valve is an advanced and key equipment
in high-rate measurement while drilling (MWD) and logging while drilling (LWD) telemetry
systems. It generates an encoded mud pressure wave signal to transmit real-time information from
down-hole to surface. For the sake of the transmission distance of the signal and the intensity of the
signal, an optimized condition for the generator should be clarified, i.e. maximizing mud-pulse
pressure while simultaneously minimizing the power consumed by the rotor. In this study, the CFD
method was utilized to analyse the velocity and pressure field inside a four-hole rotary valve under
different working conditions, and the effect of four key parameters, the mud flow, the rotational speed
of the rotor, the axial gap between stator and rotor and the radial gap between rotor and housing, was
studied on the performance of the generator. The results showed that the amplitude of the mud
pressure and the power consumed by the rotor increased if the flow rate increased and decreased with
the increase of the magnitude of the axial gap and the radial gap. Once the axial gap or the radial gap
was reduced, a negative pressure zone raised which is adjacent to the region behind the rotor, thus
hindered the flow. When the axial gap was reduced by 50%, the amplitude of the mud pressure and
the power consumed by the rotor were raised by78.8% and 73.2% respectively. Similarly, as the radial
gap was reduced by 50%, the amplitude of the mud pressure was increased by 67.1% and the power
consumed by the rotor was increased by 107.7%.The rotational speed of the rotor remarkably affected
the power consumed by the rotor and the period of the generated signal as well. However, it indicated
no significant influence on the amplitude of the mud pressure. The findings are helpful in
understanding the mechanism of continuous wave signal generators with rotary valve and the effects
of key factors on its dynamic performance.
Introduction
In recent years, the measurement while drilling (MWD) or the logging while drilling (LWD)
technologies play an important role in drilling deviation wells, including directional, horizontal and
ERD wells et al. [1], and a down hole telemetry data transmission system is the key tool to transmit
the real-time measurement data of the information of oil and gas layer, geological parameters and
wellbore trajectory parameters from down hole to the surface [2]. Recently, the real time vibration
data transmitted by MWD have been paid more attentions to the control of down hole vibration of
drill string and the research on the vibration mechanism, which is studied with numerical simulation
method by a lot of people [3-6].
There are two kinds of down hole telemetry data transmission technologies, i.e. wired and wireless
mode [7]. Wired transmission mode mainly transmits the data through cable, optical cable and drill
string vibration, while the mediums for wireless transmission mode are commonly electromagnetic
waves, sound waves and mud pulse. Currently, the mud pulse signal transmission is the most practical
and reliable method for wireless transmission mode [8]. According to the pressure signal generating
30
Advances in Engineering Research (AER), volume 1053rd Annual International Conference on Mechanics and Mechanical Engineering (MME 2016)
Copyright © 2017, the Authors. Published by Atlantis Press. This is an open access article under the CC BY-NC license (http://creativecommons.org/licenses/by-nc/4.0/).

mechanism, mud pulse signal transmission tools can be divided into three kinds: negative pulse signal
generator, positive pulse signal generator and continuous wave signal generator. Negative pulse
signal generator has been gradually phased out for contamination, low signal rate, large energy
consumption and so on. Now, the positive pulse signal generator is a widely used transmission tool
due to stabile signal, simple down hole instrument structure, easy operation and maintenance,
although it has a lower transmission rate. The continuous wave signal generator can transmit the down
hole measured data continuously and with the highest rate in all three kinds of mud pulse signal
transmission tools [9]. However, its development is not mature enough for wide application because
of its hardest theory, complex structure, sophisticated manufacturing processes and high requirements
for mud quality. Now, there are only Schlumberger, Advanced Products & Systems (APS) and Baker
Hughes Company, which successfully developed their mud pulse generator and applied them to the
well drilling [9-15]. Schlumberger Company has a commercial product Power-PulserTM, which has a
transmission frequency of 24Hz, and a data transmission rates of 6 to 16 bits per second [11]. APS
designed an oscillating rotary continuous wave generator with shear valve whose rotor is driven by a
brushless DC motor, and it could deliver valid pulse signal effectively in an ultra-deep hole of 7992
meters [12-14]. Baker Hughes Drilling Fluids launched aXcelerate PLUSTM, a high-speed data
continuous wave transmission system with oscillatory shear valve structure, in 2005 [15].
Currently, some theoretical, experimental and computational fluid dynamics (CFD) studies for the
continuous wave pulse generator with rotary valve had been carried out. Mud pulse technology was
initially implemented in the mid-1960s by Arps J.J et al. who presented details of the first
implementation as well as a commendable review of the state of the art in wellbore logging [16]. The
first mechanical mud pulse system was marketed in 1964 by Teledrift for transmitting directional
information [17]. In the paper of Patton et al. (1977) [18], they described the development and field
tests of a prototype system equipped 15 channels to transmit information and one channel for frame
synchronization. A logging-while-drilling telemetry system, using a digitally encoded, phase-
modulated, continuous-pressure-wave signal in the mud inside the drill string, was tested
successfully. In addition to transmission capability, the tests provided information to confirm the
signal attenuation and depth-range theory. A completely aerodynamic solution to the stable-closed
problem was developed and reported by Chin (2004) [19]. In his design, the rotor was located
downstream of the stator, and rotor lobes were outwardly tapered in the downstream direction and
had under lap relative to the upstream stator lobes. Three companies mentioned above, i.e.
Schlumberger, APS and Baker Hughes, designed their products successfully and used them in drilling
widely. For the purpose of technical protection, these companies applied for many patents [9-15, 20-
22] and did not publicly publish details of the product research. Then the transmission mechanism
and the related fluid dynamics had not yet been known to the world, and many scholars have put their
attention on it in order to solve the problems encountered in the use of products. In Liu’s study (2007)
[23], a multiphase flow formula was proposed to calculate the mud-pulse velocity and a method is
also put forward to examine the dynamic-transmission behaviour of the mud pressure pulse or wave,
with the purpose of improving the existing mud-pulse measurement and control systems. Wang et al.
(2011, 2012) [24, 25] established a 3-D mud pulse generator structural model to simulate its flow
field by CFD methods. The influence of structural parameters, such as the rotor blade shape, leaf
number and leaf thickness, on the properties of the mud pulse was considered. Jia et al. (2010, 2012)
[26, 27] deduced the curve equation of orifice shape based on the pressure-flow relationship. The
rotor shape of rotary valve generator was designed according to this equation, and a 3-D flow field
simulation analyses of different axial gap between stator and rotor had been made to study its
influence on the pressure wave signal intensity. The simulation results show that the generator could
product a simple harmonic pressure pulse signal. In general, these researches had provided help for
the design of the continuous wave mud pulse generator with rotary valve, but had not took into
account all the key factors which affect the performance of generator. Moreover, there is few visual
display of the fluid field inside the generator in the CFD-based results. Especially, few studies took a
comprehensive consideration of the pressure signal intensity and the rotor power consumption.
In this paper, a 3D model of continuous signal generator with four-hole rotary valve was
31
Advances in Engineering Research (AER), volume 105

established, and the effects of four key factors, i.e. the mud flow, the rotational speed of the rotor, the
axial clearance between stator and rotor, the radial clearance between rotor and housing, on the signal
intensity and the rotor torque were studied with the software of FLUENT.
Calculation Model
The Geometric Model of the Continuous Wave Signal Generator with Rotary Valve
The working mechanism of the continuous wave signal generator with rotary valve, belongs to a
complicated fluid dynamics problem. In this paper, a four-hole rotary valve model was established to
study the dynamic flow features inside it. A schematic view of the geometric model for the signal
generator equipment is shown in Fig.1. According to its working principle and working conditions,
four models, i.e. Model A-1 to Model A-4, were established to examine the effect of four important
parameters, including inlet flow, rotor speed, radial gap and axial gap, on the fluid dynamics inside
the models. The key geometry parameters are shown in Table 1 and the working conditions are listed
in Table 2. It should be noted that the other three models were built based on Model A-1.
Fig.1. The schematic view of the calculation model
Table 1. The major geometry parameters of models
Model Number Axial Gap(mm) Radial Gap(mm)
A-1 1.52
3.287 A-2 1.14
A-3 0.76
A-4 1.52 1.640
Meshing
There are two parts in the fluid region, one is non-rotating flow computational domain, and the
other is rotating flow computational domain. An interface between these two parts is set to
exchange the fluid information of them.
Table 2. The working conditions of each model
MN
WC A-1 A-2 A-3 A-4
Rotor Speed (r/min) 60 180 360 60 60 60
Inlet Flow(LPM)
535
2675 2675 2675 2675 2675
1070
1605
2140
2675
Note: LPM means liters per minute, 1LPM =0.001 m3/min = 0.000167 m3/s; MN means Model
Number; WC means working conditions.
32
Advances in Engineering Research (AER), volume 105

Turbulence Model
According to the flow characteristics of simulated target, the realizable model is chosen as the
turbulence model in this paper. The modelled transport equations for k and ε in the realizable model
in [28, 29] are:
( )( ) i tk b M k
i j k j
kuk kG G Y S
t x x x
(1)
and
. 2
1 2 1 3
i tb
i j j
uC E C C C C S
t x x x kk v
. (2)
where
1
21 2max 0.43, , 1.9, 2
5ij ji
kC C E E
1
1, 1.44, 1.2, 1.0
2
jiij k
j i
uuE C
x x
kG represents the generation of turbulence kinetic energy due to the mean velocity gradients, bG is
the generation of turbulence kinetic energy due to buoyancy, MY represents the contribution of the
fluctuating dilatation in compressible turbulence to the overall dissipation rate. 1C and 1C are
constants. and k are the turbulent Prandtl numbers for k and ε, respectively. kS and S are user-
defined source terms. is density, is the dynamic viscosity coefficient; is the coefficient of
kinematic viscosity, E is the average strain rate; t is the eddy viscosity. t can be computed with
Eq.(3)
2
t
kC
(3)
The difference between the realizable k-ε model and the standard and RNG k-ε models is that C
is no longer a constant. It is computed from
(4)
where
Ω Ω~ ~
*ij ijij ijU = E E +
(5)
and
_~
ij ijij ijk k ij ijk kΩ =Ω - 2e Ω =Ω - e w
where
ijΩ is the mean rate-of-rotation tensor viewed in a moving reference frame with the angular
velocity k . The model constants 0A and sA are given by
0 4.0, 6 cossA A (6)
where
33
Advances in Engineering Research (AER), volume 105

1
3/2
1 1cos 6 , ,
3 ( ) 2
ij jk kj jiij
ij ij j i
E E E uuW W E
E E x x
(7)
It can be seen that C is a function of the mean strain, rotation rates, the angular velocity of the
rotation system, and the turbulence fields ( k and ). C in Eq.(3) can be showed to recover the
standard value of 0.09 for an inertial sub layer in an equilibrium boundary layer. As illustrated above,
Eq.(1)~Eq.(7) can be seen in reference [28] and [29].
The Properties of Computational Domain and the Boundary Conditions
In our study, water is taken into account and its density is 1000 kg/m3. The inlet is set to speed
boundary condition, and the outlet is set to pressure boundary condition. For the near-wall region,
these models use the standard wall function method for processing [30].
Simulation Results
All simulations start from closed state of the flow channel. A monitoring point is placed in the cavity,
and put in the front of the rotor (as shown in Fig.1), so as to detect the changes of cavity pressure over
time. A case of model A-1 is studied to demonstrate the reliability of simulation results and to explain
the mechanism of continuous wave signal pulse generator. In this case, rotational speed is set to 60
r/min and the entry flow rate is 2675LPM. Based on this condition, the pressure changes over time in
cavity for model A-1are shown in Fig.2.
(a) Open State (b) Pressure of monitoring point over time (c) Closed State
Fig.2. Pressure signal over time
It should be noted that the meaning of numbers in the legend of following figures. For example,
A-1 represents the model A-1, the followed three digits (060,180,360) represents the speed
conditions, i.e. 060 represents 60 r/min. The last five digits (0535, 1070, 1605, 2140, 2675) stand for
flow rates, i.e. 2675 represents 2675 LPM.
Pressure inside the Cavity
The simulated pressure inside the cavity is showed in Fig.2 and the distribution of pressure in the
computational domain is described with different colours. The results show that the pressure in the
front cavity of fluid domain is evenly distributed, so the pressure in the monitoring point could be
regarded as the pressure signal generated by the continuous signal generator with rotary valve.
As shown in Fig.2 (b), the pressure signal intensity is of a high value when the flow passage is
closed, and then turns to low level if the flow passage is opened. The pressure at monitoring point is
cyclically fluctuated in one cycle of 0.25s, i.e. the flow passage is opened and closed respectively
four times in one second in the given condition where four-holes valve structure and a rotation speed
of 60 r/min were taken into account. The width of peak is significantly narrower than that of valley,
therefore, the entire curve does not meet the traditional waveform of sine or cosine curves.
34
Advances in Engineering Research (AER), volume 105

The Fluid Torque Acting on the Rotor and the Rotor Consumed Power
The total moment vector about a specified center B, as shown in Fig.3 [31], is computed by
summing the cross products of the pressure and the viscous force vectors for each face with the
radius vector, which is the vector from the specified moment center B to the force origin C.
p=B BC BC vM r F r F
(8)
where B represents the specified moment center, C represents the force origin, BCr is the radius
vector, pF is the pressure force vector, vF is the viscous force vector, BM is the total moment vector
about moment center B.
The torque acting on the rotor by fluid follows:
BT n M (9)
where n represents the unit vector direction of rotor rotation,T is rotor torque.
The rotor consumed power can be described by the dot product of torque and rotation speed,
MP T
(10)
where is rotation speed.
Fig.3. Moment about a specified moment center [31]
According to the principle of the interaction force, the moment generated by the action of fluid on
the rotor is equal to the torque required to rotate the rotor (as shown in Fig.4 (a)).The rotor consumed
power can be calculated by Eq. (10) and is shown in Fig.4 (b).
Fig. 4(a). Variation of torque with time Fig. 4(b). Variation of rotor consumed power with time
From Fig.4,it can be found that the torque acting on the rotor has the same fluctuation cycle with
that of pressure, and its value is increased rapidly when the passage is fully opened, or at the moment
when the rotor begins to close the flow channels. This can be explained that more torque on rotor is
needed to occlude the flow channels than to fully open it. The biggest torque is about 4.25N•mand
the maximum rotor power is 26.0 W. Moreover, the torque has greater volatility because the whole
fluid region has been in turbulence state and many vortexes existed behind the rotor, which can be
seen in Fig.5.
0.00 0.25 0.50 0.75 1.00 1.25
-4.00
-3.00
-2.00
-1.00
0.00
1.00
2.00
3.00
Torq
ue(
N·m)
Time(s)
A-1-060-2675
0.00 0.25 0.50
0.00
5.00
10.00
15.00
20.00
25.00
30.00
26.0 W A-1-060-2675
Pow
er(W
)
Time (s)
35
Advances in Engineering Research (AER), volume 105

Fig. 5. Instantaneous streamlines inside the generator
The Effect of Key Factors on the Working Performance of Generator
The amplitude of the pressure signal and the rotor consumed power are two important factors to
evaluate the working performance of the generator. The first factor is related to whether the
information can be effectively sent from hole bottom to surface. A better performance could be
obtained when a large pressure fluctuation amplitude appears. Another is about energy consumption
of rotor, and it will be better if the energy consumption is of a smaller value. So it was found that
these two factors should be taken into account simultaneously. Hereinafter, the effect of four key
parameters (inlet flow, rotor speed, radial gap and axial gap) on the working performance, will be
analyzed as an example.
The Effect of Flow Rate on the Performance of the Generator
Firstly, five working conditions are chosen to study the effect of flow rate on generator performance
based on model A-1.The rotor speed is set to 60r/min and five inlet flow rates of 535 LPM, 1070
LPM, 1605 LPM, 2140 LPM and 2675 LPM are set respectively. The corresponding variation of
pressure versus time is showed in Fig.6, and the variation of torque and rotor consumed power versus
time are showed in Fig.7.
Fig.6. Variation of pressure with time under different flow rate
The greater the flow rate is, the higher the pressure value is. At the same time, the corresponding
amplitudes of pressure fluctuation will also increase if the flow rate increases. The change of flow
rate does not affect the number of peaks, which is determined by the four holes structure.
Fig. 7(a). Variation of torque with time under different flow rate
0.00 0.25 0.50 0.75 1.00 1.25
1.00
2.00
3.00
4.00
Pre
ssur
e (M
Pa)
Time (s)
A-1-060-0535
A-1-060-1070
A-1-060-1605
A-1-060-2140
A-1-060-2675
0.00 0.25 0.50 0.75 1.00 1.25
-4.00
-2.00
0.00
2.00
4.00
Torq
ue (N
·m)
Time (s)
A-1-060-0535
A-1-060-1070
A-1-060-1605
A-1-060-2140
A-1-060-2675
36
Advances in Engineering Research (AER), volume 105
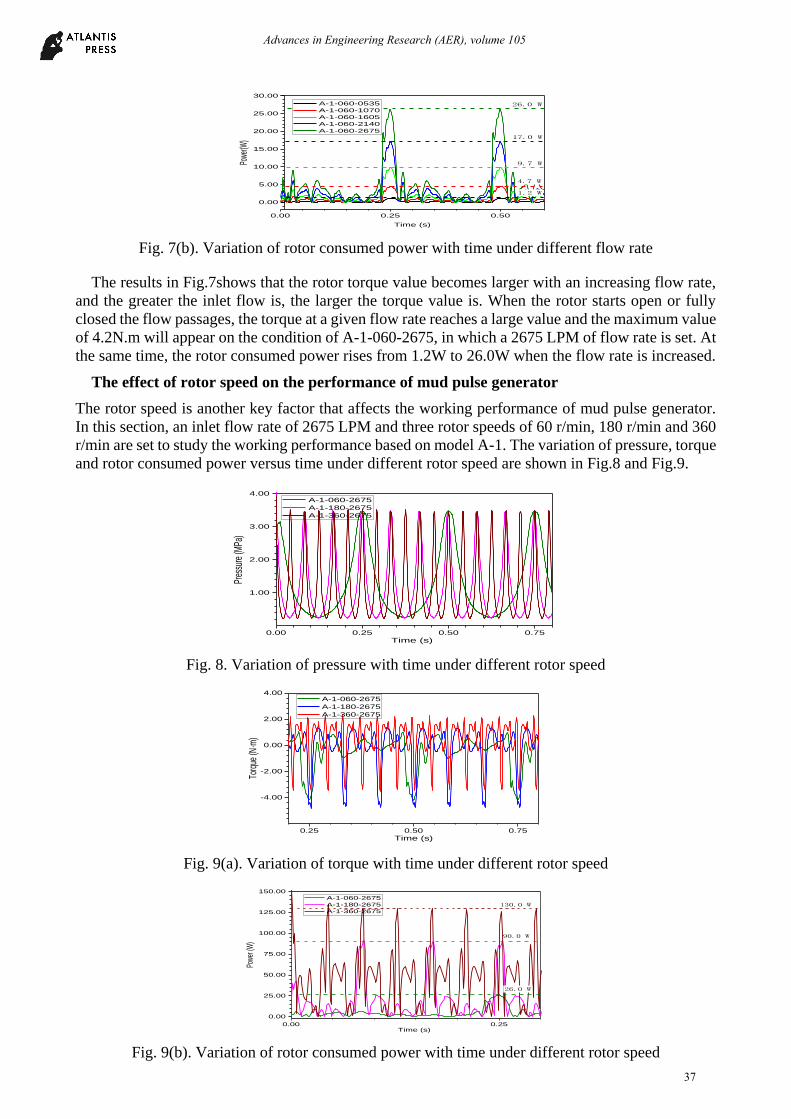
Fig. 7(b). Variation of rotor consumed power with time under different flow rate
The results in Fig.7shows that the rotor torque value becomes larger with an increasing flow rate,
and the greater the inlet flow is, the larger the torque value is. When the rotor starts open or fully
closed the flow passages, the torque at a given flow rate reaches a large value and the maximum value
of 4.2N.m will appear on the condition of A-1-060-2675, in which a 2675 LPM of flow rate is set. At
the same time, the rotor consumed power rises from 1.2W to 26.0W when the flow rate is increased.
The effect of rotor speed on the performance of mud pulse generator
The rotor speed is another key factor that affects the working performance of mud pulse generator.
In this section, an inlet flow rate of 2675 LPM and three rotor speeds of 60 r/min, 180 r/min and 360
r/min are set to study the working performance based on model A-1. The variation of pressure, torque
and rotor consumed power versus time under different rotor speed are shown in Fig.8 and Fig.9.
0.00 0.25 0.50 0.75
1.00
2.00
3.00
4.00
Pres
sure
(MPa
)
Time (s)
A-1-060-2675
A-1-180-2675
A-1-360-2675
Fig. 8. Variation of pressure with time under different rotor speed
0.25 0.50 0.75
-4.00
-2.00
0.00
2.00
4.00
Torq
ue (N
·m)
Time (s)
A-1-060-2675
A-1-180-2675
A-1-360-2675
Fig. 9(a). Variation of torque with time under different rotor speed
0.00 0.25
0.00
25.00
50.00
75.00
100.00
125.00
150.00
26.0 W
90.0 W
A-1-060-2675
A-1-180-2675
A-1-360-2675
Powe
r (W
)
Time (s)
130.0 W
Fig. 9(b). Variation of rotor consumed power with time under different rotor speed
0.00 0.25 0.50
0.00
5.00
10.00
15.00
20.00
25.00
30.00
1.2 W
4.7 W
9.7 W
17.0 W
26.0 W A-1-060-0535
A-1-060-1070
A-1-060-1605
A-1-060-2140
A-1-060-2675
Powe
r(W)
Time (s)
37
Advances in Engineering Research (AER), volume 105
As shown in Fig. 8, when the rotor speed increases, the pressure signal shows a dramatic change
for wave period while it has a little change for fluctuation amplitude. The periods of pressure signal
are 1/4s, 1/12s and 1/24s, which correspond to the rotor speed 60r/min, 180r/min and 360r/min
respectively. The width of peak is narrower than that of trough in each curve.
The results in Fig.9indicatethat the torque increases with rotational speed, but the range of the
torque fluctuation is just slightly enlarged. The waveform of torque curve changes gentler. Same as
the pressure, the period of the torque fluctuation is also reduced with the increase of the rotor speed.
Especially, the rotor speed has a significant influence on the consumed power of rotor. The consumed
power will increase by3.5 times when the rotor speed increasesby2 times, and the rotor consumed
power increases by 4 times when the rotor speed increases by5 times.
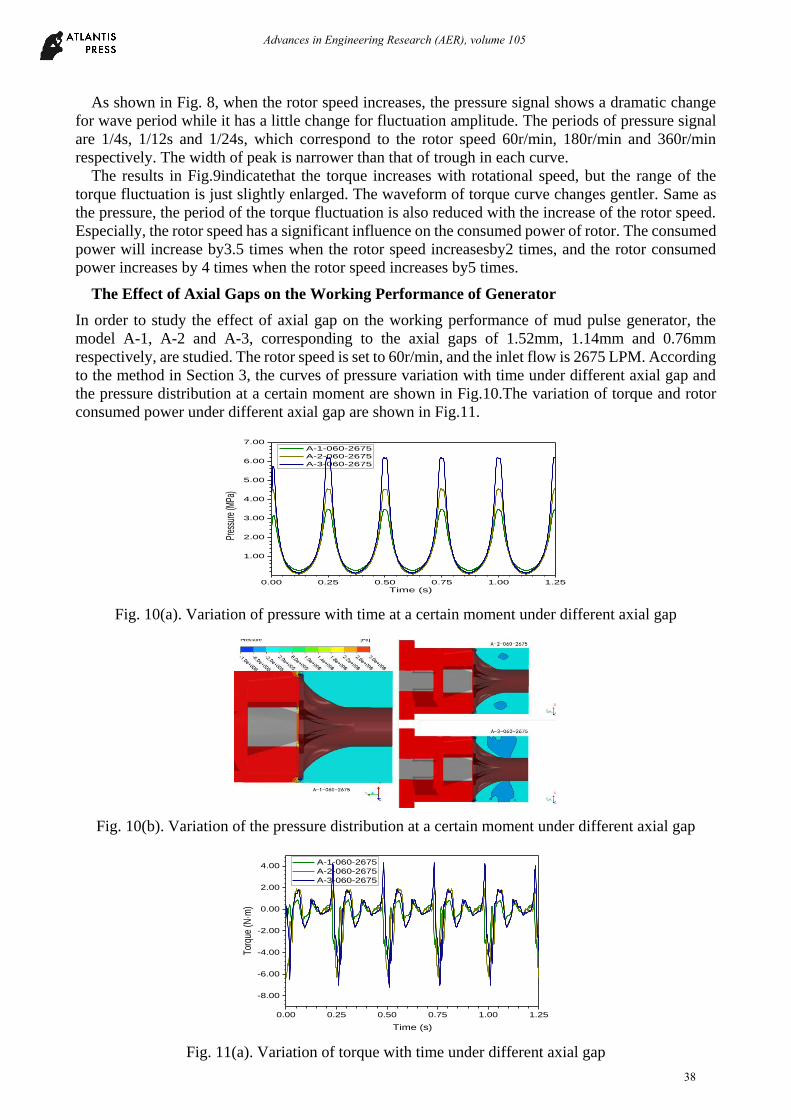
The Effect of Axial Gaps on the Working Performance of Generator
In order to study the effect of axial gap on the working performance of mud pulse generator, the
model A-1, A-2 and A-3, corresponding to the axial gaps of 1.52mm, 1.14mm and 0.76mm
respectively, are studied. The rotor speed is set to 60r/min, and the inlet flow is 2675 LPM. According
to the method in Section 3, the curves of pressure variation with time under different axial gap and
the pressure distribution at a certain moment are shown in Fig.10.The variation of torque and rotor
consumed power under different axial gap are shown in Fig.11.
0.00 0.25 0.50 0.75 1.00 1.25
1.00
2.00
3.00
4.00
5.00
6.00
7.00 A-1-060-2675
A-2-060-2675
A-3-060-2675
Pre
ssur
e (M
Pa)
Time (s)
Fig. 10(a). Variation of pressure with time at a certain moment under different axial gap
Fig. 10(b). Variation of the pressure distribution at a certain moment under different axial gap
0.00 0.25 0.50 0.75 1.00 1.25
-8.00
-6.00
-4.00
-2.00
0.00
2.00
4.00
Torq
ue (N
·m)
Time (s)
A-1-060-2675
A-2-060-2675
A-3-060-2675
Fig. 11(a). Variation of torque with time under different axial gap
38
Advances in Engineering Research (AER), volume 105
0.00 0.25 0.50
0.00
25.00
50.00
26.0 W
39.1 W
A-1-060-2675
A-2-060-2675
A-3-060-2675
Powe
r (W
)Time (s)
45.0 W
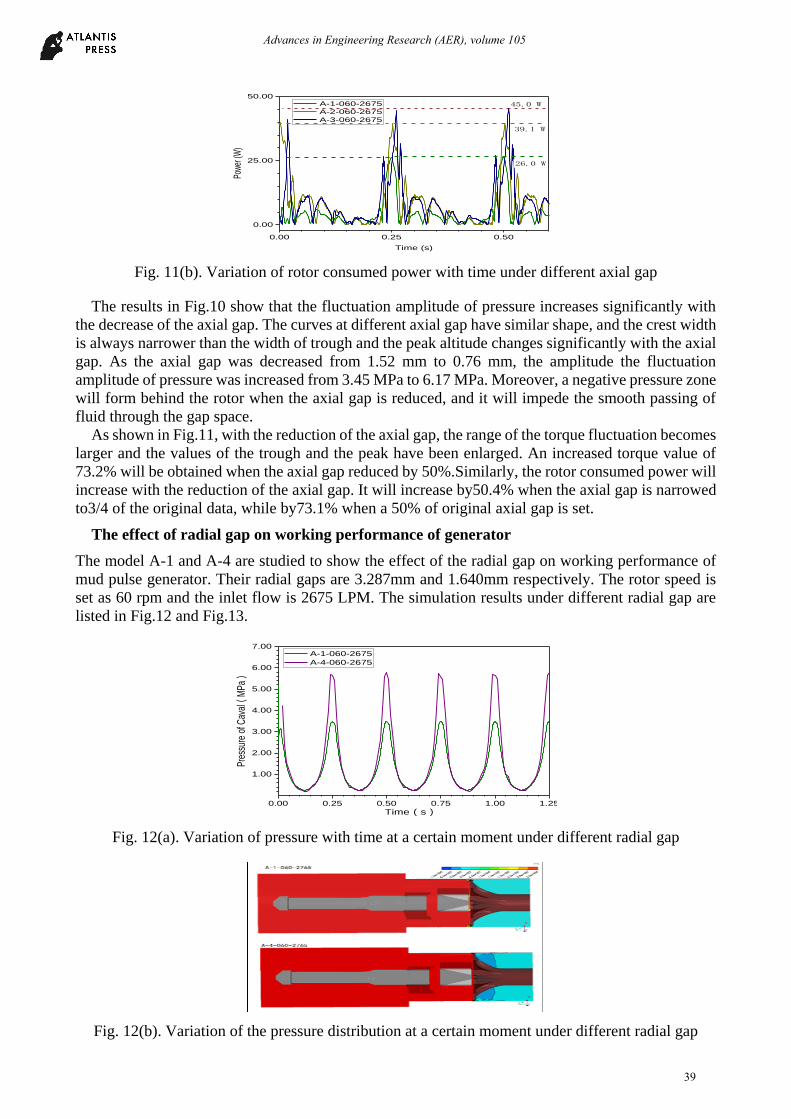
Fig. 11(b). Variation of rotor consumed power with time under different axial gap
The results in Fig.10 show that the fluctuation amplitude of pressure increases significantly with
the decrease of the axial gap. The curves at different axial gap have similar shape, and the crest width
is always narrower than the width of trough and the peak altitude changes significantly with the axial
gap. As the axial gap was decreased from 1.52 mm to 0.76 mm, the amplitude the fluctuation
amplitude of pressure was increased from 3.45 MPa to 6.17 MPa. Moreover, a negative pressure zone
will form behind the rotor when the axial gap is reduced, and it will impede the smooth passing of
fluid through the gap space.
As shown in Fig.11, with the reduction of the axial gap, the range of the torque fluctuation becomes
larger and the values of the trough and the peak have been enlarged. An increased torque value of
73.2% will be obtained when the axial gap reduced by 50%.Similarly, the rotor consumed power will
increase with the reduction of the axial gap. It will increase by50.4% when the axial gap is narrowed
to3/4 of the original data, while by73.1% when a 50% of original axial gap is set.
The effect of radial gap on working performance of generator
The model A-1 and A-4 are studied to show the effect of the radial gap on working performance of
mud pulse generator. Their radial gaps are 3.287mm and 1.640mm respectively. The rotor speed is
set as 60 rpm and the inlet flow is 2675 LPM. The simulation results under different radial gap are
listed in Fig.12 and Fig.13.
0.00 0.25 0.50 0.75 1.00 1.25
1.00
2.00
3.00
4.00
5.00
6.00
7.00
Pre
ssur
e of
Cav
al(
MP
a)
Time(s)
A-1-060-2675
A-4-060-2675
Fig. 12(a). Variation of pressure with time at a certain moment under different radial gap
Fig. 12(b). Variation of the pressure distribution at a certain moment under different radial gap
39
Advances in Engineering Research (AER), volume 105
0.00 0.25 0.50 0.75 1.00 1.25
-10.00
-8.00
-6.00
-4.00
-2.00
0.00
2.00
4.00
6.00
8.00
10.00
Torq
ue (N
·m)
Time (s)
A-1-060-2675
A-4-060-2675
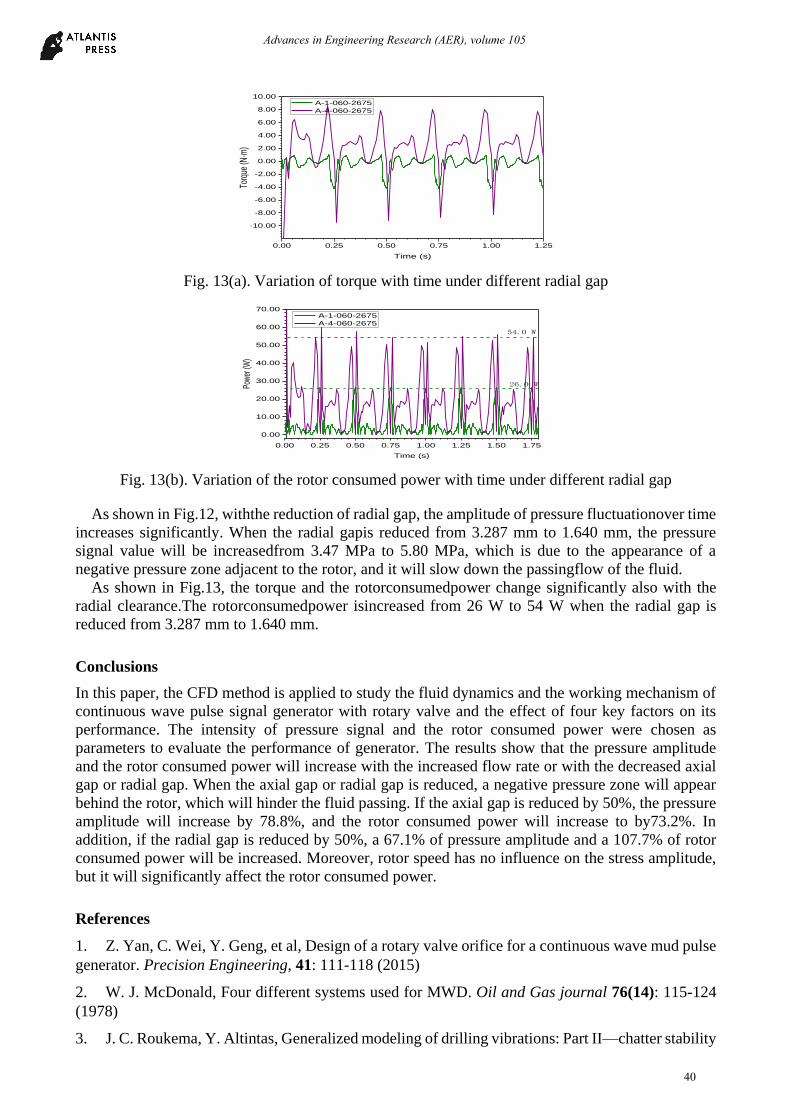
Fig. 13(a). Variation of torque with time under different radial gap
0.00 0.25 0.50 0.75 1.00 1.25 1.50 1.75
0.00
10.00
20.00
30.00
40.00
50.00
60.00
70.00
26.0 W
54.0 W
A-1-060-2675
A-4-060-2675
Pow
er (W
)
Time (s)
Fig. 13(b). Variation of the rotor consumed power with time under different radial gap
As shown in Fig.12, withthe reduction of radial gap, the amplitude of pressure fluctuationover time
increases significantly. When the radial gapis reduced from 3.287 mm to 1.640 mm, the pressure
signal value will be increasedfrom 3.47 MPa to 5.80 MPa, which is due to the appearance of a
negative pressure zone adjacent to the rotor, and it will slow down the passingflow of the fluid.
As shown in Fig.13, the torque and the rotorconsumedpower change significantly also with the
radial clearance.The rotorconsumedpower isincreased from 26 W to 54 W when the radial gap is
reduced from 3.287 mm to 1.640 mm.
Conclusions
In this paper, the CFD method is applied to study the fluid dynamics and the working mechanism of
continuous wave pulse signal generator with rotary valve and the effect of four key factors on its
performance. The intensity of pressure signal and the rotor consumed power were chosen as
parameters to evaluate the performance of generator. The results show that the pressure amplitude
and the rotor consumed power will increase with the increased flow rate or with the decreased axial
gap or radial gap. When the axial gap or radial gap is reduced, a negative pressure zone will appear
behind the rotor, which will hinder the fluid passing. If the axial gap is reduced by 50%, the pressure
amplitude will increase by 78.8%, and the rotor consumed power will increase to by73.2%. In
addition, if the radial gap is reduced by 50%, a 67.1% of pressure amplitude and a 107.7% of rotor
consumed power will be increased. Moreover, rotor speed has no influence on the stress amplitude,
but it will significantly affect the rotor consumed power.
References
1. Z. Yan, C. Wei, Y. Geng, et al, Design of a rotary valve orifice for a continuous wave mud pulse
generator. Precision Engineering, 41: 111-118 (2015)
2. W. J. McDonald, Four different systems used for MWD. Oil and Gas journal 76(14): 115-124
(1978)
3. J. C. Roukema, Y. Altintas, Generalized modeling of drilling vibrations: Part II—chatter stability
40
Advances in Engineering Research (AER), volume 105
in frequency domain. International Journal of Machine Tools & Manufacture 47:1474–1485 (2007)
4. J. C. Roukema, Y. Altintas, Time domain simulation of torsional–axial vibrations in drilling.
International Journal of Machine Tools & Manufacture 46: 2073–2085 (2006)
5. J. C. Roukema, Y. Altintas, Generalized modeling of drilling vibrations. Part I: Time domain
model of drilling kinematics, dynamics and hole formation. International Journal of Machine Tools
& Manufacture 47: 1455–1473 (2007)
6. Y. A. Khulief, F. A. Al-Sulaiman, S. Bashmal, Vibration analysis of drillstrings with self-excited
stick–slip oscillations. Journal of Sound & Vibration 299 (3): 540-558 (2007).
7. J. J. Arps, Continuous logging while drilling: a practical reality. Society of Petroleum Engineers,
Annual Fall Meeting, New Orleans, La. (1963)
8. S. P. Monroe, Applying digital data-encoding techniques to mud pulse telemetry. Petroleum
Computer Conference, Denver, Colorado (1990)
9. K. A. Moriarty, Pressure pulse generator for measurement-while-drilling systems which
produces high signal strength and exhibits high resistance to jamming. US6219301B1 [P/OL] (2001).
10. E. Lavrut, A. Kante, P. Rellinger, et al, Pressure pulse generator for downhole tool: US, US
6970398 B2 [P] (2005)
11. E. Lavrut, A. Kante, P. Rellinger, et al, Pressure pulse generator for downhole tool, US6970398
[P/OL] ( 2005)
12. W. E. Turner, D. P. Biglin, Method and apparatus for transmitting information to the surface
from a drill string down hole in a well, US6714138 [P/OL]( 2004)
13. P. U. G Nther, J. R. Kropp, Opto-electrical module for optical signals from at least two optical
data channels for arranging on a main circuit board of a component assembly and opto-electrical
component assembly, US7347634 [P/OL] (2008)
14. D. E. Burgess, Rotary pulser and method for transmitting information to the surface from a drill
string down hole in a well, WO2013142754 [P/OL] (2013)
15. D. Hahn, V. Peters, C. Rouatbi, et al. Oscillating shear valve for mud pulse telemetry and
associated methods of use, US6975244 [P/OL] (2005).
16. J.J. Arps, J.L. Arps, The subsurface telemetry problem-A practical solution. Journal of
Petroleum Technology 16(5): 487-493 (1964)
17. R. F. Spinner, F. A. Stone, Mud pulse logging while drilling system design, development, and
demonstration. International Association of Drilling Contractors Drilling Technical Conference,
Houston (1978)
18. B. J. Patton, W. Gravley, J. K. Godbey, et al, Development and successful testing of a
continuous-wave, logging-while-drilling telemetry system. Journal of Petroleum Technology 29(10):
1215-1221 (1977)
19. W. C. Chin, MWD siren pulser fluid mechanics. Petrophysics 45(4): 363–379 (2004)
20. W C Chin, J. A. Trevino, Pressure pulse generator, US4785300A [P/OL] (1988).
21. W. LOGAN, J. C. LOGAN, Measurement while drilling fluid pressure pulse generator, US
20150247403 [P/OL] (2015)
22. D. Malone, Sinusoidal pressure pulse generator for measurement while drilling tool, US4847815
[P/OL] (1989)
23. X. S. Liu, B. Li, Y. Q. Yue, Transmission behavior of mud-pressure pulse along well bore.
41
Advances in Engineering Research (AER), volume 105

Journal of Hydrodynamics, Ser B 19(2): 236-240 (2007)
24. Z. Wang, J. Xiao, Z Jian, The rotor parameter study of rotary valve mud pulser base on CFD.
Modern Manufacturing Technology and Equipment 205(6): 3-5 (2001)
25. Z. Wang, J. Xiao, Z Jian, Waterpower specialty study of the rotor on rotary valve mud pulse. Oil
Field Equipment 41(3): 1-3 (2012)
26. J.Peng, F. Jun, L. Lin, Drilling continuous wave generator rotary valve design and signal
characteristics analysis. China Petroleum Machinery 38(2): 9-12 (2010)
27. J.Peng, F. Jun, L. Lin, Optimization design of rotary valve of continuous wave generator based
on correlation coefficient. Oil Field Equipment 41(7): 37-42 (2012)
28. 28. ANSYS_INC, Realizable k-ε Model. ANSYS Release 15, Fluent Documentation (Fluent
Theory Guide): 4.3.3.
29. T. H. Shih, W. W. Liou, A. Shabbir, et al, A new k-ϵ eddy viscosity model for high reynolds
number turbulent flows. Computers & Fluids 24(3): 227–238 (1995)
30. B. E. Launder, D. Spalding, The numerical computation of turbulent flows. Computer methods
in applied mechanics and engineering 3(2): 269-289 (1974)
31. ANSYS_INC, Computing forces, moments, and the center of pressure. ANSYS Release 15,
Fluent Documentation (Fluent Theory Guide): 22.22.21.
42
Advances in Engineering Research (AER), volume 105