the seven secrets of distribution november 2010 daniel enskat head of global consulting
TRANSCRIPT

The Seven Secrets of Distribution
November 2010
Daniel Enskat
Head of Global Consulting
2
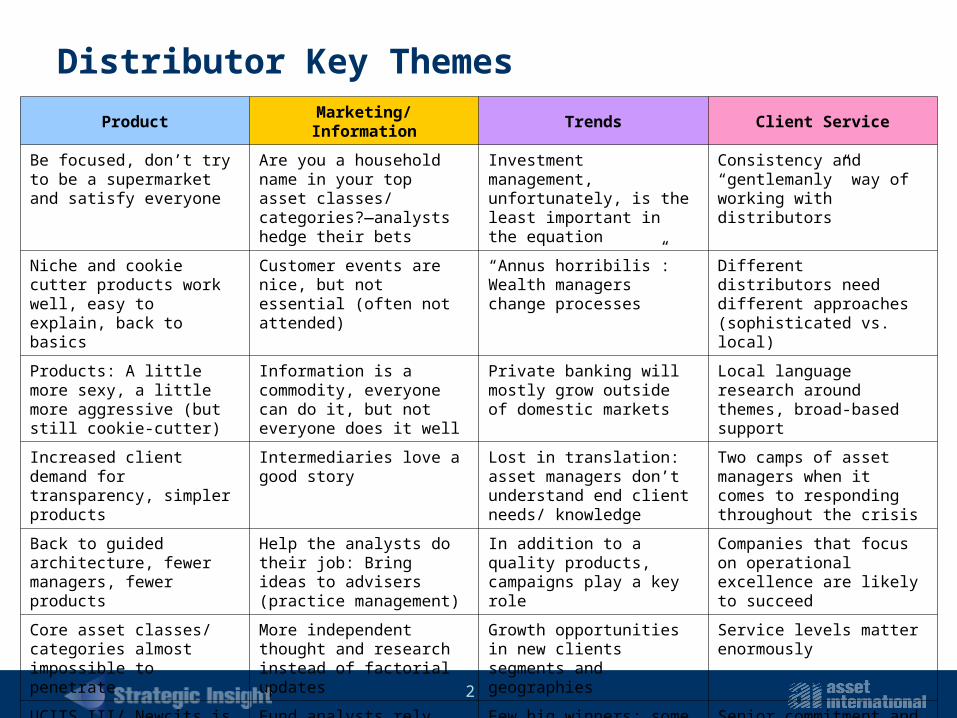
Distributor Key ThemesProduct Marketing/ Information Trends Client Service
Be focused, don’t try to be a supermarket and satisfy everyone
Are you a household name in your top asset classes/ categories?—analysts hedge their bets
Investment management, unfortunately, is the least important in the equation
Consistency and “gentlemanly” way of working with distributors
Niche and cookie cutter products work well, easy to explain, back to basics
Customer events are nice, but not essential (often not attended)
“Annus horribilis”: Wealth managers change processes
Different distributors need different approaches (sophisticated vs. local)
Products: A little more sexy, a little more aggressive (but still cookie-cutter)
Information is a commodity, everyone can do it, but not everyone does it well
Private banking will mostly grow outside of domestic markets
Local language research around themes, broad-based support
Increased client demand for transparency, simpler products
Intermediaries love a good story
Lost in translation: asset managers don’t understand end client needs/ knowledge
Two camps of asset managers when it comes to responding throughout the crisis
Back to guided architecture, fewer managers, fewer products
Help the analysts do their job: Bring ideas to advisers (practice management)
In addition to a quality products, campaigns play a key role
Companies that focus on operational excellence are likely to succeed
Core asset classes/ categories almost impossible to penetrate
More independent thought and research instead of factorial updates
Growth opportunities in new clients segments and geographies
Service levels matter enormously
UCITS III/ Newcits is a hot topic, but limited cash flows (for now); naïve approach of hedge funds
Fund analysts rely more on industry aggregators and local sites
Few big winners; some firms blacklisted for the next few years
Senior commitment and communication

3
-200
0
200
400
600
800
1,000
Asia Europe US
Other
Bond
Mixed
Equity
-200
0
200
400
600
800
1,000
Asia Europe US
Source: Strategic Insight Simfund GL, MF
-200
0
200
400
600
800
1,000
1,200
1,400
1,600
Asia Europe US
Source: Strategic Insight Simfund GL, MF
Global Mutual Fund Flows by Region, Asset Class
In US$ Billion
BondMixedEquity
Other
Source: Strategic Insight Simfund GL, MF
5-Year (2005-2009) 2005-2008 2009-1H’2010

4
Distribution Channels by Market
*Please note: insurance companies are not yet authorized to sell mutual funds in China, and currently there are no IFAs available to Chinese retail investors. Source: Strategic Insight estimates, Asian Industry Associations
0%
20%
40%
60%
80%
100%
Japan China* Korea India Hong Kong Taiwan Singapore
Bank Securities Firm Insurance IFAs Direct
*Please note: Insurance companies are not authorized to sell mutual funds in China, and currently there are no IFAs available to Chinese retail investors. Source: Strategic Insight estimates, Asian Industry Associations
Distribution Channel Breakout in Asia by MarketDistribution Channels – Asia

5
Distribution Channels by Market
Distribution Channels – Europe
0%
20%
40%
60%
80%
100%
Italy France UK Germany Spain Switzerland Nordics
Retail bank Private bank IFA Direct Fund of funds Insurance Other*
* For the Nordics, this category mainly encompasses pensions/ investment wrappersSource: Strategic Insight estimates, European Industry Associations
Distribution Channel Breakout in Europe by Market

6
Global Distribution Opportunity Matrix

7
Highest Cash Flow Non-US Long-term Funds YTD 8-10 In US$ Billion
Net Flows
Portfolio Category YTD 2009 2008 2007 Templeton Global Bond Bond Global 13.9 5.2 -0.1 3.2
Carmignac Patrimoine Mixed Balanced Flex 10.9 14.2 3.3 -0.2
PIMCO GIS Total Return Bd Bond USD 8.3 5.3 -0.4 0.1
Nomura Global High Yield Bond F(Envmt Crny) Bond High Yield 8.0 Pictet-Emerging Local Currency Debt Bond Emg Mkts 6.2 1.2 -0.6 0.7
Templeton Global Total Return Bond Global 6.1 1.4 -0.2 1.9
AllianceBernstein-Global High Yield Bond High Yield 4.6 4.8 -2.1 1.6
DaiwaSB Short Term AU Bond OP Bond Asia Pacific 4.1 2.1 1.0 -0.4
Fidelity US REIT Fund Real Estate 4.1 0.7 0.0 0.0
Carmignac Securite Bond Europe 4.0 3.7 0.1 0.2
Standard Life Inv Glo Abs Ret Strategies Absolute Return 4.0 1.8 1.7
Daiwa Brazil Bond Open Bond Emg Mkts 3.6 3.6 0.0
MitsubishiUFJ Emerging Country Bond F Bond Emg Mkts 3.4 1.9
SMAM SMBC Nikko New World Bond F(BRL) Bond Emg Mkts 2.9 3.0
AXA IM FIIS US Short Duration High Yield Bond High Yield 2.9 0.3 0.0 0.5
Julius Baer BF Absolute Return Absolute Return 2.8 1.4 -1.8 1.3
PIMCO GIS Global Inv Grd Crdt Bond Global 2.7 2.8 1.1 0.1 Templeton Asian Growth Equity Asia Pacific 2.7 2.0 -2.1 1.8
Fidelity Funds - US High Yield Bond High Yield 2.6 1.2 -0.2 -0.1
Fonditalia Core 1 Mixed Conservative 2.5 1.1 0.1
Total above 81.9 59.4 -0.6 11.1
*Combines various currency linked versions of the fund
Note: excludes internal fund of funds, with exception of Japan
Source: Strategic Insight Simfund GL
Top Selling Non-US Long-Term Funds
Net Flows Historically, Ranked by YTD August 2010 (In US$ Billion)
Source: Strategic Insight Simfund GL

8
Fund SelectionUnits
More Power
Fund Selection Units Post-Crisis
MoreComplexity
MoreConcentration

9
0%
20%
40%
60%
2005 2006 2007 2008 2009 2010 2011 2012 2013 2014 2015
0%
20%
40%
60%
Asia
Europe + UCITS to Non-European Investors
US
Source: Strategic Insight Simfund GL
Middle EastLatin-America
Europe
0%
20%
40%
60%
2005 2006 2007 2008 2009 2010 2011 2012 2013 2014 2015
0%
20%
40%
60%
Asia
Europe + UCITS to Non-European Investors
US
Source: Strategic Insight Simfund GL
Middle EastLatin-America
Europe
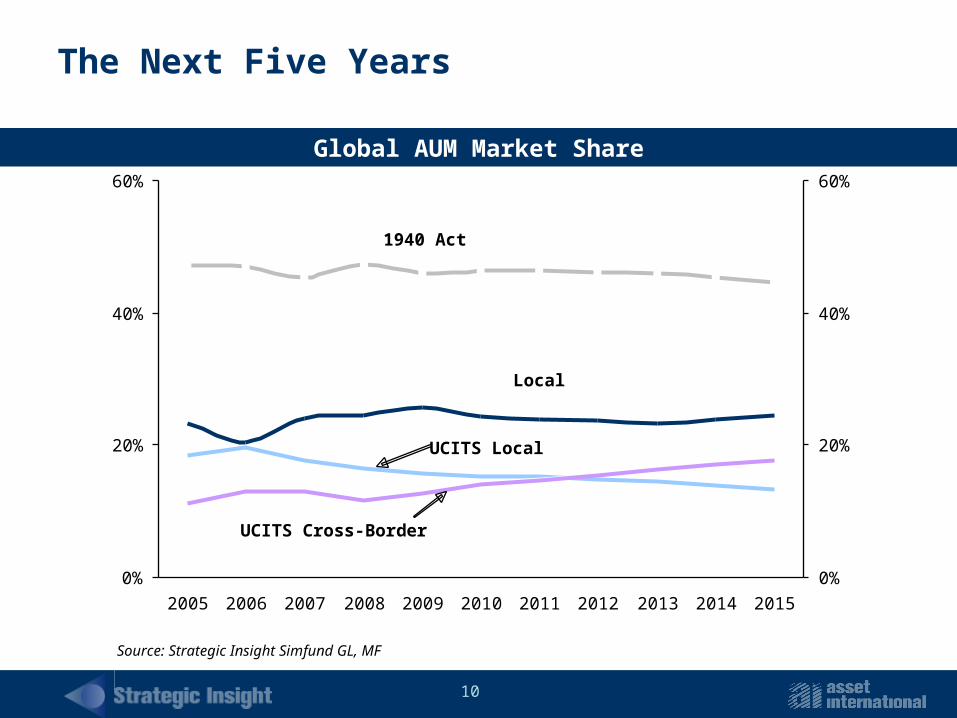
The Next Five Years
Global AUM Market Share
10
0%
20%
40%
60%
2005 2006 2007 2008 2009 2010 2011 2012 2013 2014 2015
0%
20%
40%
60%
Local
1940 Act
Source: Strategic Insight Simfund GL, MF
UCITS Cross-Border
UCITS Local
The Next Five Years
Global AUM Market Share

11
Challenges and Investment Dichotomies
• Turn speculators into investors• Pensions• Cumbersome sales processes• Emerging Markets• Head office centricity• Brand, staff, language • The long-term view• Local market perception
• US vs. global• Developed vs. Emerging• Local vs. Offshore• Investment Themes vs.
Solutions• Active vs. Passive• Relative vs. Absolute Returns• Fee-based vs. Commission-
based• Traditional vs. Alternative
Industry Key Challenges Investment Dichotomies

12
Strategic Insight
www.StrategicInsightGlobal.comwww.Sionline.com
www.SimFundFiling.com
Contact the Strategic Insight Global team:+1.212.217.6885 [email protected]