the second wave of global liquidity: why are firms acting
TRANSCRIPT

Graduate Institute of International and Development Studies
International Economics Department
Working Paper Series
Working Paper No. HEIDWP21-2015
The second wave of global liquidity: Why are firms acting like
financial intermediaries?
Julian Caballero
Inter-American Development Bank
Ugo Panizza
The Graduate Institute, Geneva and CEPR
Andrew Powell
Inter-American Development Bank
Chemin Eugene-Rigot 2P.O. Box 136
CH - 1211 Geneva 21Switzerland
c�The Authors. All rights reserved. Working Papers describe research in progress by the author(s) and are published toelicit comments and to further debate. No part of this paper may be reproduced without the permission of the authors.

The second wave of global liquidity:Why are firms acting like financial intermediaries?
Julian CaballeroInter-American Development Bank
Ugo PanizzaThe Graduate Institute, Geneva
and CEPR
Andrew PowellInter-American Development Bank
October 2015∗
AbstractRecent work suggests that non-financial firms have acted like financial intermedi-aries particularly in emerging economies. We corroborate these findings but thenask why? Our results indicate evidence for carry-trade activities but focused incountries with higher levels of capital controls, particular controls on inflows. Wefind little evidence for such activities given other potential motives. We posit thatthis phenomenon is due more to the reaction to low global interest rates and strongcapital inflows than to incomplete markets or the retreat of global banks due toimpaired balance-sheets or tighter regulations.
Keywords: Corporate finance, bond issuance, currency mismatches, carry-trade,capital controlsJEL Codes: E51, F30, F33
∗Caballero: Research Department, Inter-American Development Bank, 1300 New York Ave NW,Washington DC. Email: [email protected]. Panizza: Department of International Economics, TheGraduate Institute of International and Development Studies, Maison de la Paix, Case Postale 136CH1211 Genève 21. Email: [email protected]. Powell (corresponding author): ResearchDepartment, Inter-American Development Bank, 1300 New York Ave NW, Washington DC. Email: [email protected]. We would like to thank Jorge Carrera, Claudio Raddatz, Dave Seerattan and parti-cipants at the IDB’s Network of Central Banks and Finance Ministries of Latin America (Lima, October2015), and seminars at FGV Sao Paulo, University of St. Gallen, and IDB for comments. We would alsolike to thank Jaime Ramírez and Daniela Sánchez for excellent research assistance. The views expressedare strictly only those of the authors and do not necessarily reflect the views of the Inter-AmericanDevelopment Bank, its Board of Directors or the countries they represent.
1

1 Introduction
The recent fall in international bank lending and the rise of dollar-denominated inter-national bond issuances, particularly from non-financial corporations based in emergingeconomies, has been labelled “the second phase of global liquidity” (Shin 2013). Since2010 international bond issuances by non-financial corporates based in emerging econom-ies has nearly doubled, reaching $400 billion by the end of 2014 (Acharya et al. 2015, seealso Turner 2013, and IMF 2015).What did firms do with the proceeds of these bond issues? Bruno and Shin (2015)
show that bond issuance has not been used solely for real investment but also to increasecash holdings or other liquid assets. Powell (2014) documents a positive correlation amongUS dollar issuances of Latin American corporations, corporate deposits in LAC financialsystems, and domestic credit. This behavior is consistent with the idea that, by acting asfinancial intermediaries, non-financial firms have replaced banks as the conduit throughwhich international financial conditions a§ect domestic liquidity and credit growth inemerging economies.In this paper we ask why non-financial firms have taken on this role. We suggest that
non-financial firms are more likely to act like financial intermediaries in countries withtighter capital controls because non-financial corporates have a comparative advantage inarbitraging capital controls or other regulations that have prevented banks from pursuingwhat appear to be profitable opportunities.Low interest rates in advanced economies fueled the fear in emerging economies that
strong capital inflows, including carry trade type activities, would led to credit boomsand currency appreciation. Some emerging economies responded to this situation withtighter regulations on capital movements. However, non-financial firms may have ways ofescaping such controls as they can issue bonds in o§shore financial centers and then bringthe proceeds of that issuance into the home country via an inter-company loan (which inthe balance of payments is normally counted as FDI) and may thus elude capital controlsor taxes levied on portfolio flows (see McCauley, Upper, and Villar, 2013).We test if the presence of capital controls increases the likelihood that non-financial
corporations act like financial intermediaries by using data covering 766 non-financialfirms located in 18 emerging market countries. We show that these corporations are morelikely to hold the resources obtained from foreign currency bond issuances in liquid assetswhen potential returns from carry trade are high and there are capital account restrictionson inflows. We conjecture that in countries with no or few capital controls, banks remainthe main conduit for transmitting global financial conditions to domestic markets but inthose countries that have adopted tighter capital controls (especially controls on inflows)this role is at least to some degree being played by corporates.Our paper is related to several strands of the literature spanning financial depth and
corporate financial structure, the role of international banks, and the credit cycle andsystemic macroeconomic financial risks. A useful starting point is the corporate financeliterature that discusses a “pecking order” for firm financing. This implies that a firm
2

would normally use internal sources to finance projects or operations and only seek outsidefunds when those are exhausted (Myers 2004). An implication is that, unlike financialintermediaries, non-financial corporations’ liabilities and liquid financial assets shouldbe negatively correlated (Shin and Zhao 2013). While this is the case for US firms, inemerging economies there is instead a positive correlation between debt and liquid assets(Shin and Zhao 2013).Bruno and Shin (2014) is perhaps the paper which is closest to ours. This paper
also considers the rise in issuance of non-financial corporates and, in analyzing the de-terminants of issuance, finds evidence in favour of carry trade activities. Our data andmethodology in identifying carry trade activities are somewhat di§erent but still we cor-roborate their findings in this regard. More importantly, we highlight the importance ofcapital controls and conclude that carry trade activities by non-financial firms are con-sistent with the presence of regulatory arbitrage. We also test for alternative hypothesesfocusing on the retreat of global banks or credit market imperfections but find no evidencein these directions.A related strand of literature focuses on recent trends in international credit flows.
Turner (2013) highlights the shift from bank financing to bond financing, particularly foremerging economies. Chung et al. (2014) document the importance of this trend in termsof overall global liquidity and discuss the potential ramifications for financial stability.Powell (2014) considers the case of four large Latin American economies (Brazil, Chile,Colombia and Mexico) and documents a strong increase in issuance from non-financialfirms, particularly in US dollars.1 Evidence is presented of an increase in local currencydenominated domestic credit (which appears to be financed by corporate deposits) and adeterioration of firms’ balance sheets due to a combination of rising dollar amortizationschedule and falling earnings ratios. In our paper, we move beyond cross-country cor-relations and use firm-level data to document when and why non-financial firms act asfinancial intermediaries.Our paper also relates to the literature on the links between o§shore bond issuances
and capital controls Shin (2013) and McCauley, Upper, and Villar (2013) document therecent increase in issuance of Brazilians and Chinese non-financial firms through subsidi-aries in o§shore financial centres and suggest that issuances through foreign subsidiariesmay enable firms to evade capital controls or taxes on certain inflows. Powell (2014)considers this issue in the case of Latin America and shows that while in the case ofBrazil issuance on a nationality basis exceeds issuance on a residency basis the oppositeis true for Chile. As Chile does not have capital controls while Brazil does, this di§erenceprovides prima facia evidence for the potential importance of such controls. In this paper,we test this hypothesis and find that capital controls do indeed increase financial firms’incentives to act as financial intermediaries.Finally, our paper relates to the recent literature attempting to explain relatively
high corporate cash holdings in the US. Bates et al. (2009) for example argue that
1Rodrigues-Bastos, Kamil, and Sutton (2015) show that this pattern also holds for a larger sample ofLatin American economies
3
precautionary motives may play an important role in order to justify high US firms’ cash-to-assets ratios. As corporates in emerging economies are operating in an environment ofincomplete financial markets, their actions may well be di§erent to those of corporatesin advanced economies. For example, large corporates may have better access to capitalmarkets than smaller firms that they have relationships with, such as suppliers. Hence,they might borrow more to be able to pass the proceeds on in the form of direct loansto these firms exploiting the business relationships. In this manner, larger firms mayattempt to complete financial markets in environments where financial depth is limited(Petersen and Rajan 1997, Demirgüç-Kunt and Maksimovic 2001, and Fisman and Love2003, Levine 2004).This line of argument suggests that there might be a link between the financial struc-
ture of large corporates in emerging economies and financial depth. In countries with lowlevels of financial depth, we may expect to see larger corporates borrowing more to beable to correct such market failures in financial markets. We test whether the incentivesof non-financial firms to act as financial intermediaries depend on credit market imper-fections (as proxied by financial depth or creditors’ rights) and do not find any evidencesupporting this hypothesis.Another literature focusses on the role of international banks. International banks
expanded during the 1990’s and early 2000’s through increased direct lending to clients inother countries, through establishing branches and subsidiaries in host nations, and hencecollecting deposits and lending, and through the purchase of securities and structuredproducts issued by foreign entities.2 However, the global financial crisis severely hit banks’balance sheets provoking a reduction in leverage and a retreat from international activitiessuch that banks focused more on core assets and provoked a fundamental rethink ofregulation. Garcia-Luna and Van Rixtel (2014) provide a description of the retreat ofglobal banks and discuss motivations including impaired balance sheets and regulatorydevelopments. Karam et al. (2014) consider changes in country ratings and their impactson bank funding.If the rise of corporates as financial intermediaries is related to the retreat of global
banks then we would expect to see a relation with risk. In other words if banks retreatedmore quickly from countries with lower ratings then perhaps it is in those countries wherecorporates are now acting more like financial intermediaries. We test this propositionand we also test directly if corporates are behaving like financial intermediaries whereinternational bank claims have fallen the most, but find no evidence supporting thesehypotheses.
2On the expansion and role of foreign banks in emerging economies see for example Goldberg (2002),Martinez-Peria, Powell and Vladkova (2005), and Galindo, Micco and Powell (2005).
4

2 Data
We collected annual data for the period 2000-2014 on firms’ balances sheets and bondissuances from two di§erent sources. We focus on a sample composed of the fifty largestlisted non-financial and non-foreign owned firms in each of eighteen emerging markets.The baseline analysis includes a total of 766 firms.3 Bond issuance by our sample of firmswas on a rising trend before the global financial crisis hit, it contracted in 2008 and thenboomed over 2009-2013 (Figure 1).We obtained annual data on firms’ liquid financial assets and other balance sheet
variables from the Thomson-Reuters Worldscope database and sourced data on bondissuances from Dealogic’s DCM database.4 Table A2 lists the eighteen markets and givesdetails of the sample in each. As detailed in the table the sample accounts for over90% of the market capitalization in most markets. Note that we are not interested in arepresentative sample of firms but rather in large firms that are active in capital marketsand that have good access to finance and hence may contemplate a variety of di§erenttypes of market transactions. Our interest is precisely in understanding the behavior ofthese large firms. We also feel that the large listed firms are likely to have better qualitydata as their accounts are prepared in a professional manner and audited and studied byoutside analysts.Given di§erent spellings and abbreviations of firm names in each dataset, the data
from Worldscope and Dealogic were merged manually, making sure that we were able toeither find a match in the issuance data for each listed firm in our sample or that we couldassign zero issuance with confidence —because the firm did not have any issuance reportedin Dealogic. We matched the two datasets using the names and nationalities of the firmsincluded in the two databases. In a few cases we were unable to identify a clear matchbased solely on the information contained in the two datasets, so we searched the web fordi§erent spellings and abbreviations and were able to match all firms in this way.As we built our dataset of bond issuance at the parent level, our measure of bond
issuance for each firm includes all bonds issued under the name of the firm itself and all3We have less than 50 firms in countries where there are less than 50 listed domestically owned non-
financial corporations.4We downloaded data for all firms listed in the eighteen emerging markets of interest. The universe of
firms was identified using Worldscope’s constituent lists for all country exchanges in a given country (e.g.,firms listed in Sao Paulo or Rio de Janeiro were assigned Brazil as nationality). The largest firms wereidentified based on market capitalization as of end of 2014. We then used Thomson Reuters’ businessclassification to exclude firms classified as Financials. We used data fromWorldscope on foreign ownershipof shares to identify firms with foreign majority ownership. Firms with no foreign ownership reported orwith less than 50% of foreign ownership were classified as domestic. After excluding non-financial firmsand foreign firms we are left with 803 firms in the eighteen countries of interest; although only 766 firmshave data on sales, leverage and other required variables. In some countries, there are less than fiftynon-financial, non-foreign firms; yet, in all cases, with the exception of South Korea, the coverage bymarket capitalization is above 80%. We also use a set of country-level data to describe potential returnsfrom carry trade and capital controls, we describe these when we use them and provide a detailed list ofsources in Table A1.
5

bonds issued through a subsidiary in any part of the world. In our analysis we give equalweight to bonds issued through a subsidiary, perhaps in an o§shore financial centre, andbonds issued directly by the parent. The parent’s nationality of operations reported inDealogic was used to assign a particular firm to a particular country.5 We constructedmeasures of bond issuance based on the currency of denomination of the bond and furtherdecomposed foreign currency issuance between hard currencies (USD, EUR, GBP, JPY,and CHF) and other currencies. Issuance in hard currencies (FXB) is our key variable ofinterest.We complemented the firm-level and bond-level data with country-level data on capital
controls, spreads, carry trade profitability, credit ratings, financial depth, creditors’ rightsand external liabilities. These data and their sources are described in Table A1.
3 Bond issuance and holdings of liquid financial as-sets
We start by testing whether non-financial corporations based in emerging markets keepthe proceedings of foreign currency bond issuances in cash or other liquid financial assets.We use a specification similar to that in Bruno and Shin (2015). Specifically, we estimatethe following model:
ln
(Ci,c,tSA
i,c,t
)= FXBi,c,t
(β + δfSP c,t
)+Xi,c,tΓ+ αi + θc,t + "i,c,t (1)
The dependent variables is the log of liquid financial assets scaled by sales of firm i,in country c, in year t. The explanatory variables are firm-level foreign currency bondissuances (FXB), the demeaned spread (fSP ) between either the local currency depositrate or the money market rate (we choose the highest of the two) in country c andborrowing costs in the US for either the sovereign of country c or BAA-rated corporations(we use the lowest of the two), a set of time-variant firm-specific controls (the matrix Xi,c,t
includes the log of debt over sales, log sales, and leverage), a set of firm fixed e§ects (αi),and a set of country-year fixed e§ects (θc,t). Among other things the country-year fixede§ects fully absorbs the main e§ect of fSP .As we employ the demeaned spread (fSP c,t = SPc,t − SP ), in the set-up of Equation
(1) β captures the marginal e§ect of bond issuances on holdings of liquid financial assetswhen SPc,t = SP (if we had used SPc,t instead of fSP c,t, β would have captured themarginal e§ect of bond issuances on holdings of liquid financial assets when SPc,t = 0),
5Dealogic’s DCM database reports issuances at the tranche level. We computed a measure of annualissuance in local and foreign currency by parent after downloading all issuances reported in the worldfor the period 2000-2014. We then collapsed the data using the parent listed in Dealogic. We assigncurrencies to nationalities based on the currency in use as of end-of-2014. We include in the measure oflocal currency issuance of bonds indexed and non-indexed to inflation.
6

and δ captures how spreads a§ect the marginal e§ect of bond issuances on holdings ofliquid financial assets.6
We use three di§erent measures of foreign currency bond issuances: the log of thedollar value of such issuances; the log of the ratio of foreign currency issuances to sales(this is our baseline); and a dummy variable that takes a value of one if firm i issued aforeign currency bond in year t.7
When we use our baseline specification (i.e., when FXB is based on the log of theratio between bond issuances and sales), we are estimating an elasticity and β capturesthe percentage change in the liquid financial assets to sales ratio brought about by a onepercent increase in the bond issuance to sale ratio when the spread is at its mean value.The parameter δ, instead, measures by how much a one percentage point increase in thespread a§ects the elasticity of liquid financial assets to bond issuances.When we estimate equation (1) without the interactive term (i.e., when we set δ = 0),
we find that foreign bond issuances are always positively correlated with holdings ofliquid financial assets (Table 2, columns 1, 4, and 7). Therefore, our results, with anindependently constructed dataset, corroborate Bruno and Shin’s (2015) finding that inemerging markets non-financial corporations keep a substantial fraction of foreign currencybond proceeds as cash or other liquid financial assets. The point estimate of column 1suggests that a ten percent increase in bond issuances is associated with an eight percentincrease in holdings of liquid financial assets.When we allow for the correlation between bond issuances and holdings of liquid
financial assets to vary with the spread between borrowing costs in the US and return onlocal currency denominated liquid assets, we find that δ is always positive (which is primafacie evidence for carry trade activities), but never statistically significant (columns 2, 5,and 8 of Table 2). The e§ect, however, is qualitatively large because the point estimatessuggest that at the mean one standard deviation increase in spread (4.5 percentage point)would increase the elasticity of holdings of liquid financial assets to bond issuance from0.8 to 1.2.We also interact foreign bond issuances with a dummy variable that takes a value of
one when our spread indicator is below the sample median (LS) and a dummy variablethat takes value of one when the spread is above the sample median (HS). Columns 3, 6,and 9 of Table 2 show that the coe¢cient of FXB×HS is always positive and statisticallysignificant and that the coe¢cient of FXB × LS is never statistically significant. Thisfinding is consistent with the result in Bruno and Shin (2015) that, in emerging marketcountries, bond issuances are significantly correlated with holdings of liquid financial assetswhen a carry trade indicator is above the median and are not significantly correlated withholdings of liquid financial assets when the carry trade indicator is below the median. The
6Alternatively, δ measures how bond issuances a§ect the marginal e§ect of spreads on holding of liquidfinancial assets. Formally, δ = @(@ln(C/SA)@FXB )/@SP = @(@ln(C/SA)@SP )/@FXB. Note that the marginal e§ectof spreads on holding of liquid financial assets is absorbed by the country-year fixed e§ects.
7When we take logs, we add one to total bond issuances to retain firm-years with zero issuances.Bruno and Shin (2015) use the same strategy.
7

e§ect is also quantitatively important. In column 3, the elasticity of holdings of liquidfinancial assets to bond issuance in the high spread regime is twice the elasticity in thelow spread regime.8
So far, we have established that emerging market firms that issue in foreign currencytend to hold more liquid financial assets and that the relationship between bond issuancesand holdings of liquid financial assets is increasing in the spread between local depositrates and the cost of borrowing in the US. We also showed that the e§ect of spreads isquantitatively large but not statistically significant. In the next section we will explorepotential heterogeneity in this relationship. Before doing so, we check if there is somethingspecial about foreign currency bonds or whether non-financial corporations always keep afraction of bond issuances in cash or other liquid financial assets, no matter whether theyare issuing in domestic or in foreign currency.The first two columns of Table 3 estimate the models of the first two columns of Table
2, but substitute foreign currency bond issuances with domestic currency bond issuances.We find that domestic bond issuances are never significantly correlated with holdings ofliquid financial assets. In the last three columns of the table we jointly control for domesticand foreign bond issuances (we use the same definitions of foreign bond issuances of Table2), we find that foreign bond issuances are always significantly correlated with holdings ofliquid financial assets and that domestic issuances are never significantly correlated withholdings of liquid financial assets. The coe¢cients of FXB are also essentially identical towhat we found in Table 2.
4 Carry trade opportunities and capital controls
Over the period of analysis (2000-2014) there have been significant changes in capitalaccount openness among emerging countries in di§erent directions. Post 2000 there wasa general move towards more openness but after the global financial crisis many countriestightened capital controls (see Figure 2 which uses data from Chinn and Ito 2006 andFernández et al. 2015). Data from Fernández et al. (2015) show that 16 out of the 18emerging economies studied in this paper introduced at least one tightening measure tocapital account transactions over 2008-2013 (a larger sample of 41 emerging economiesshows that nearly 80% of countries introduced at least one tightening measure). Figure3 illustrates the distribution of capital account openness across countries in 2007 and in2013. Each plot shows a solid box covering the interquartile range of the capital controlsmeasure, from the lower quartile to the upper quartile and the median. These graphs showa shift in the distribution towards greater capital controls comparing these two years.When capital account transactions are heavily regulated, it may be di¢cult or expens-
ive for banks to pursue carry trade activities. However, it may be harder to regulate thetransactions of non-financial corporations that can use current account transactions or
8However, the two coe¢cients are not significantly di§erent from each other. A fact consistent withour results that δ is not statistically significant.
8

inter-company loans (that are normally considered as FDI) to transfer financial resourcesacross countries. In such a setting, non-financial firms may become the channel throughwhich capital inflows take place. If this is the case, we should find that the presenceof capital controls amplifies the correlation between foreign bond issuances and holdingsof liquid financial assets when there are large di§erences between domestic and foreigninterest rates.We test if the incentives of non-financial corporation to act akin to a financial in-
termediary are stronger in the presence of capital controls by estimating the followingmodel:
ln
(Ci,c,tSA
i,c,t
)= FXBi,c,t
(β + δfSP c,t + ηKc,t + φ
(fSP c,tKc,t
))+ (2)
+Xi,c,tΓ+ αi + θc,t + "i,c,t
where K is a continuous measure of capital account openness that ranges between 0(closed capital account) and 1 (open capital account) and the remaining variables are thesame as in Equation (1). Our parameter of interest is φ. A positive value of φ wouldsuggest that non-financial corporations are more likely to exploit interest rate di§erentialswhen the capital account is open. A negative value of φ, instead, would be consistentwith Shin and Zhao (2013) and Chung et al.’s (2015) hypothesis that firms use withincompany loans to elude capital controls (the returns of eluding capital controls are higherbecause banks, which in general face lower transaction costs, cannot arbitrage interestrate di§erentials).Before estimating the model with the triple interaction, we check whether interacting
foreign bond issuances with capital account openness alters the results of Table 2. Incolumns 1, 3, and 5 of Table 4 we set φ = 0 and show that once we control for capitalaccount openness, the main e§ect of FXB is no longer significant and the interactione§ects are not statistically significant.When we allow for the triple interaction, however, our results change dramatically
(columns 2, 4, and 6 of Table 4). The parameter δ is always positive and statisticallysignificant, indicating that in countries with a closed capital account (i.e., when K = 0),the likelihood that the proceeds of foreign currency bond issuances are kept in cash orother liquid financial assets is increasing in the spread between the local deposit rate andforeign currency borrowing costs (a behavior consistent with the presence of carry tradeactivities). The e§ect is also quantitatively large. The point estimates of column 2 suggestthat when the spread is at its mean value and the capital account is fully closed a onepercent increase in bond issuances is associated with a 0.3 percent increase in holdingsof liquid financial assets. A one percentage point increase of the spread, however, wouldincrease the elasticity of holdings of liquid financial assets to 0.8.We also find that φ is always negative, statistically significant and with point estimates
close to −δ (in fact, we cannot reject the hypothesis that δ+ φ = 0; we report the test at
9

the bottom of Table 4). This finding is consistent with the hypothesis that non-financialcorporations do not engage in carry trade activities when they operate in countries withan open capital account (K = 1).9
Panel A of Figure 4 plots how the sensitivity of the relationship between foreign bondissuances and holdings of liquid financial assets to the spread varies with capital accountopenness (the figure is based on model of column 2, Table 4). We find that @( @Cash
@FXB)/@SP
is positive and statistically significant when K < 0.5 (the mean value in our sample is0.51 and the median 0.44), the derivative is positive but not statistically significant when0.5 < K < 0.7, and becomes negative (but never statistically significant) when K > 0.7.In Table 4, we measured capital account openness using the updated version of the
Chinn and Ito (2006) aggregate index. This data source does not contain separate indic-ators for controls on inflows as opposed to controls on outflows. It is, however, plausiblethat controls on inflows are more relevant for non-financial firms that are trying to eludecapital controls to exploit carry trade opportunities. To test this hypothesis, we use theFernández et al. (2015) database on capital controls which does contain separate measuresfor controls on outflows and on inflows.Table 5 reports the results using our baseline measure of FXB (the results are robust to
using the other definitions). In the first column of Table 5, we estimate the same model ofcolumn 2, Table 4 by replacing the Chinn and Ito index with the overall measure (inflowsand outflows) of capital account openness of Fernández et al. (2015).10 The results aresimilar to those of Table 4 (Panel B of Figure 3, plots the results), but the coe¢cientsare not as precisely estimated as when we use the Chinn and Ito index (δ and φ arestatistically significant at the ten percent confidence level while they were significant atthe one percent confidence level in Table 4).Next, we use the Fernández et al. (2015) measures of openness to inflows (KI, Column
2) and outflows (KO, column 3). We find that the regression that uses controls on inflowsyields results which are similar to those obtained for the overall index, but the coe¢cientare more precisely estimated (they are statistically significant at the 5 percent confidencelevel). The regression that uses controls on outflows, instead, yields results that arequalitatively similar to the regression that uses the overall index but with statisticallyinsignificant coe¢cients for δ and φ.The fact that openness to inflows and openness to outflows yield di§erent results is
particularly telling as the two components of the index are highly correlated (the correl-ation coe¢cient is 85% and a regression of KI over KO yields a coe¢cient of 0.7, with at-statistics of 70 and an R-squared of 0.7). If we include both components in a horseraceregression, we still find that openness to inflows decreases the sensitivity of holdings of
9In Table 4, we follow Shin and Zhao (2013) and scale our variables by sales. Our results are robustto following Bruno and Shin (2015) and scaling our variables by assets (see columns 1-3 of Table A3 inthe Appendix)10Note that the original Fernández et al. (2015) index gives higher values for countries with a closed
capital account. We rescaled the index such that 1 means open capital account and 0 closed capitalaccount.
10

liquid financial assets to spreads but openness to outflows does not (column 4). In fact,the two bottom panels of Figure 4 suggest that the e§ect of openness to outflows goes inthe opposite direction. Panel C plots the coe¢cient for openness to inflows. We find theusual negative relationship of Panels A and B, but the curve is steeper, and the point atwhich the coe¢cient becomes insignificant is higher than in the regressions that use totalopenness. Panel D, instead, shows that openness to outflows is positively correlated withour measure of carry trade activity, but the coe¢cient is never statistically significant.To probe further, we regress the inflow and outflows measures on the overall index of
capital controls and use the errors of this regression as measures of controls on inflowsand outflows that are orthogonal to overall capital controls (again, we rescale these twomeasures to range between 0 and 1, with 1 indicating maximum openness). In column 5 ofTable 5, we control for both overall capital account openness and for openness to inflowsthat is orthogonal to overall openness (KIR), we find that what matters is openness toinflows. In column 6, we repeat the experiment but now we include openness to outflows(KOR). We find that the e§ect goes in the opposite direction, indicating that opennessto outflows actually amplifies carry trade activities (this finding is consistent with whatwe showed in panel D of Figure 4).Our results are consistent with the idea that firms are unlikely to engage in carry trade
activities if they have doubts on their ability to repatriate profits. It may also mean thatcontrols on outflows are more tightly enforced (or enforceable) than controls on inflows.Next, we substitute our spread variable with a measure of potential carry trade returns.
We use the Bloomberg Carry Return Index (CTI). CTI is a proxy of the carry-to-riskratio obtained by summing the returns from interest rate di§erentials and exchange ratemovements. CTI is often interpreted as an ex-ante measure of the attractiveness of carrytrade.Table 6 shows that high carry trade returns increase the correlation between foreign
bond issuances and holdings of liquid financial assets in country-years with a closed capitalaccount but have no e§ect on the elasticity of holdings of liquid financial assets in country-years with an open capital account (column 1). We also find that the result holds foropenness to inflows (column 2), but does not hold for openness to outflows (column 3)and that the result is robust to running a horserace which includes both openness toinflows and to outflows (column 4).
5 Alternative explanations: incomplete capital mar-kets and the retreat of banks
The presence of capital controls is just one of several potential explanations for non-financial firms to act as financial intermediaries. Non-financial corporations may alsobe playing this role because emerging countries have under-developed capital markets orbecause international banks have retreated. We posit that financial depth and creditorrights are reasonable proxies for the lack of complete financial markets and that banks
11

su§ering from either impaired balance sheets or increased regulation are likely to retreatmore from countries with lower credit ratings on long term foreign currency bonds.11
Hence we test for these alternative views by estimating equation (2) replacing capitalaccount openness with a measure of creditor rights, a measure of financial depth, and twoindicators for the retreat of global banks, country ratings (risk) and international bankclaims.In column 1 of Table 7, we use the index of creditors’ rights compiled by the Doing
Business report. We rescale the variable to range between 0 and 1 (1 meaning strongercreditor rights).12 We find that creditor rights do not a§ect the correlation betweenforeign bond issuance and holdings of liquid financial assets of non-financial corporations(Column 1). Next, we use a standard measure of financial depth (credit to the privatesector as a percent of GDP) as a proxy of financial development.13 We find that financialdepth does not a§ect the correlation between foreign bond issuances and holdings ofliquid financial assets (Column 2). Finally, in columns 3 and 4 we run two horseraceregressions that include financial development (creditors’ rights in column 3 and financialdepth in column 4) and capital account openness (we use controls on inflows, but theresults are robust to using overall capital account openness). We find that the e§ect ofcapital account openness is robust to controlling for financial depth, while the coe¢cientshave similar magnitude but are not statistically significant when we control for creditors’rights (column 3).In Table 8 we look at the role of sovereign risk using both Standard and Poor’s and
Moody’s credit ratings (again, we rescale the index to range between 0 and 1). Column 1of Table 8 uses S&P ratings and shows that credit ratings are not statistically significantin our model. Column 2 includes both credit ratings and capital controls and shows thatour baseline results are robust to controlling for credit ratings interactions. Columns 3and 4 repeat the experiment with Moody’s rating and find identical results.We also test whether our results are driven more directly by changes in the behavior
of global banks. Specifically, we augment our model with a variable (which we call BIS)which measures the change in a country’s liabilities vis-à-vis BIS reporting banks dividedby GDP. We try di§erent measures of liabilities employing the BIS locational bankingstatistics, namely: (i) total liabilities; (ii) liabilities of non-banks; (iii) total loans; (iv)
11Powell and Martinez (2008) in particular argue that ratings are actually fairly easy to model asrating agencies give considerable information as to what factors drive their ratings and hence suggest thatratings may be considered a convenient summary of those macroeconomic fundamentals and judgementsregarding political and other less quantifiable risks. Cavallo et al (2013) within an errors in measurementtype methodology show that sovereign ratings do add value in the sense that market variables are foundto respond on average to changes in ratings. These results indicate that ratings may indeed be consideredon average as at least a useful summary of fundamentals that drive more market measures of countryrisk.12As Doing Business data for creditors’ rights start in 2005, we use 2005 values for the 2000-2004
period. The results are robust to dropping the 2000-2004 period.13As cash deposits of corporations that borrow abroad may have an impact on the provision of domestic
credit, we set FD to be equal to credit to the private sector in the year 2000.
12

loans of the non-bank sector. We find that none of the BIS variables are statisticallysignificant in our regressions and that there are no qualitative changes in our baselineresults (Table 9).
6 Further robustness checks
We further check if our results are robust to a series of alternatives specifications andsubsamples. First, we split our sample into three di§erent regions: Latin America (6countries, 261 firms and 2,940 observations), Asia (5 countries, 237 firms and 2,512 ob-servations), and Europe (5 countries, 174 firms and 1,726 observations).14
Table 9 shows that our results are robust in all sub-regions, but that they are weakerin Europe. This might be due to the fact that in our regressions we use USD borrowingrates, but for European emerging markets the relevant currency is likely to be the Euro.Moreover, three of the countries included in the European subsample (Czech Republic,Hungary, and Poland) are part of the European Union and this may provoke di§erenceswith other emerging markets.To check whether our results are driven by influential observations, we estimate our
benchmark regression by dropping one country at a time. Table A4 reports the resultsfor the FXB × SP × KI coe¢cient. It shows that the coe¢cient is always negative(ranging between -0.01 and -0.03) and statistically significant. We also run a set of placeboregressions (we run 500 regressions that randomly allocate capital controls across country-periods) and find that the average placebo coe¢cient is centred at zero and that only 5percent of the placebo regressions (4.7 percent to be precise) are statistically significantat the 5 percent confidence level. This is exactly what one would expect to find if thecoe¢cient is not statistically significant.Next, we split the sample in two sub-periods: 2007-2014 and 2000-2006 and find that
the results for inflows hold for both sub-periods, but the results for overall capital accountopenness only hold for 2000-06 (Table A5).One possible issue with the carry trade interpretation of our results is that, rather
than engaging in carry trade activities, non-financial corporations hold the proceedings ofbond issuances in liquid financial assets because it takes some time between the moment inwhich they borrow and the moment in which they need the funds to finance an investmentproject (of course, it is not obvious why this lag should depend on the spread or why thisresult should only hold for foreign bond issuances). To check if our results are driven bythis possibility, we look at holdings of liquid financial assets one year after bond issuances.We start by showing that our results are robust to regressing holdings of liquid financial
assets at time t on all controls at time t−1. The first two columns of Table A6 estimate themodel of columns 1-2 of Table 5 but with lagged explanatory variables and find resultswhich are essentially identical to those of Table 5. The last two columns of Table A6
14We exclude South Africa and Israel which do not belong to any of the geographical regions of Table7.
13
measure all explanatory variables at time t with the exception of bond issuances whichare measure at time t− 1. Again, the results are robust to this specification.It is possible that countries introduce capital controls exactly to limit the type of carry
trade activities that we describe in this paper. If this were the case, our estimates wouldbe upward biased. While the use of country-year fixed e§ects should allay most concernsof reverse causality, we also use two strategies to assess whether our results are robust tocontrolling for the endogeneity of capital controls.First, we restrict our sample to 10 years of data and estimate our model for the period
2004-14 by using the level of capital controls in 2003. If changes in capital controls werea reaction to the massive inflows that followed the global financial crisis, using their 2004values should address any endogeneity concern. The first two columns of Table 11 showthat our results are robust to this specification.Second, we use the results of Table 5 which show that, while controls on inflows are
highly correlated with controls on outflows, controls on outflows do not matter whenour regressions include controls on inflows. Therefore, we instrument controls on inflowswith control on outflows (specifically we instrument FXB ×KI and FXB ×KI × SPwith FXB ×KO and FXB ×KO × SP ). Column 3 of Table 11 shows that in the IVregression the triple interaction coe¢cient has the right sign but it is no longer statisticallysignificant. This may be due to the loss of e¢ciency of the IV estimator. In fact, if welimit our sample to Asia and Latin America (the regions for which our results are stronger,see Table 10), the results are also statistically significant in the IV regression (Column 4Table 11).
7 Conclusions
This paper adds to the growing literature considering the increase in issuance of non-financial firms, particularly in dollars and especially from emerging economies. Thereare several potential implications of this phenomenon which is seen as central to thecharacteristics of the second phase of global liquidity. However, in order to draw the rightconclusions and to assess potential risks it is important to understand firms’ motives andheterogeneous behaviors.We first corroborate two results already found in the literature; namely that firms are
issuing and some are clearly not using the proceeds solely for real investment but also tomaintain liquid financial assets and that they appear to be doing so when the conditionsfor pursuing carry trade activities are more attractive. This suggests, as others before ushave also indicated, that these firms are behaving like financial intermediaries.However, non-financial firms may be behaving like financial intermediaries for various
motives. A benign view would be that they are attempting to correct market failures andhence serving a role in trying to complete incomplete financial markets. However, whenwe attempt to test such a view considering how such behavior varies with financial depth,or by creditor rights, we do not find any statistically significant results. Alternatively,non-financial firms may be taking the place of global banks that have been retreating due
14

to impaired balance sheets or increased regulatory pressure. If this were the case then wewould expect some relation to risk and hence we attempt to find a pattern using sovereigncredit ratings which are commonly used by banks and by bank regulators to proxy risk,but again we find no statistically significant results. Under this view, we would also expectto find a relation with the change in cross-border banking liabilities but again we find nosignificant relationship.A third view is that as a response to low global interest rates and quantitative easing
in advanced economies, several emerging economies have imposed or tightened capitalcontrols and that non-financial firms have mechanisms that are not available to banks toevade such controls. We argued that controls on inflows would be particularly relevant inthis case. We find strong statistical evidence in favour of the view that non-financial firmsare acting like financial intermediaries in countries with relatively high capital controls,particularly where there are controls on capital inflows.We leave an in-depth discussion of the policy implications of these results for future
work (see Acharya et al. 2015 and IMF 2015). Su¢ce to summarize here however thatwhile our results do not back the view that non-financial firms are attempting to completeincomplete markets nor take on a role left by global banks retreating, they do suggestthat firms are attempting to gain from carry trade type activities where capital controls,particularly controls on inflows, are prevalent. In turn this suggests that any evaluationof the e¢cacy of capital controls should take into account the possibility that they maybe evaded through such means. Indeed to the extent that non-financial firms may issueabroad and are able to deposit the funds in the local financial system, evading any cap-ital controls in place, then arguably macro-prudential policies applied on local financialsystems may be more e§ective tools to limit capital inflows and reduce the risks of creditbooms. In countries where non-financial firms are behaving in this fashion then it may ap-pear that corporates are highly liquid and hence may be expected to have the resources torepay those external liabilities. However, if the profitability of the carry trade diminishesand firms decide to withdraw their liquidity en mass then this might provoke problems forthe domestic financial system. Moreover, the information on whether firms have hedgedcurrency risks remains very partial.Foreign currency bond issuance in countries with open capital accounts has also been
strong but in these cases our results indicate firms have been not been building financialreserves and hence it has been more for real investment. In those countries the risksmay then be di§erent, such firms may not be so liquid and risks may relate more to theunderlying profitability of the investments. As commodity prices have plummeted andcurrencies depreciated the risks created by such swings in relative prices may bring largeprofits or losses; such risks should also then be carefully monitored.
15

References
[1] Acharya, V, S G Cecchetti, J De Gregorio, S Kalemli-Ozcan, P R Lane and U Panizza(2015), “Corporate debt in emerging economies: A threat to financial stability?”,Committee for International Policy Reform, Brookings Institution, Washington DC.
[2] Afonso, A., P. Gomes and P. Rother. (2007). “What ‘Hides’ behind Sovereign DebtRatings?” Working Paper 711. Frankfurt, Germany: European Central Bank.
[3] Bates, T. W., K. M. Kahle, and R. M. Stulz (2009). Why do us firms hold so muchmore cash than they used to? The Journal of Finance 64 (5), 1985–2021.
[4] Bruno, V. and Shin, H. S. (2015) “Global dollar credit and carry trades: a firm-levelanalysis” mimeo American University, May 2015.
[5] Caballero, R., and Krishnamurthy, A. (2003), “Excessive Dollar Debt: FinancialDevelopment and Underinsurance,” Journal of Finance, Vol. 58, pp. 967—893.
[6] Cavallo, E., A. Powell and R. Rigobon (2013) "Do Credit Rating Agencies AddValue? Evidence From The Sovereign Rating Business," International Journal ofFinance & Economics, John Wiley & Sons, Ltd., vol. 18(3), pages 240-265, 07.
[7] Chinn, M D and H Ito (2006), “What Matters for Financial Development? CapitalControls, Institutions, and Interactions”, Journal of Development Economics, 81(1):163-192.
[8] Chung,K., J.E. Lee, E. Loukoianova, H.Park and H.S. Shin (2014) “Global Liquiditythrough the Lens of Monetary Aggregates” IMF working paper, 14/9, January (2014)
[9] Claessens, S. and N. van Horen (2012), “Foreign Banks: Trends, Impact and FinancialStability”, International Monetary Fund Working Paper 12/10.
[10] De Haas, R. and N. van Horen (2011), “Running for the Exit: International Banksand Crisis Transmission”, DNBWorking Paper, No. 279.
[11] Demirgüç-Kunt, A. and V. Maksimovic, (2001). “Firms as financial intermediaries:Evidence from trade credit data”. World Bank mimeo.
[12] Dittmar, A., J. Mahrt-Smith, and H. Servaes (2003). International corporate gov-ernance and corporate cash holdings. Journal of Financial and Quantitative analysis38 (1), 111–134.
[13] Fernández, A, M W Klein, A Rebucci, M Schindler and M Uribe (2015), “CapitalControls Measures: A New Dataset” NBER Working Paper no. 20,970.
[14] Fisman, R.J. and I. Love. (2003). “Trade credit, financial intermediary development,and industry growth”. Journal of Finance 58, 353—374.
16

[15] Galindo, A., A Micco and A Powell (2005) “Loyal lenders or fickle financiers: foreignbanks in Latin America” IDB working paper, no 529, Dec. 2005.
[16] Garcia-Luna, P. and A. Van Rixtel (2014) “International interbank activity in re-treat” BIS Quarterly Review, March 2014.
[17] Goldberg, L. (2002), “When is U.S. Bank Lending to Emerging Markets Volat-ile?,” published in Preventing Currency Crises in Emerging Markets Volume Au-thor/Editor: S. Edwards and J. A. Frankel, editors Volume Publisher: University ofChicago Press, January 2002
[18] Gonzalez-Miranda, M., (2012), “Nonfinancial Firms in Latin America: A Source ofVolatility?” IMF Working Paper 12/279, Washington DC.
[19] International Monetary Fund (2015), “Corporate Leverage in Emerging Markets — AConcern?,” Chapter 3 in Global Financial Stability Report, Washington, DC.
[20] Karam, P., O. Merrouche, M. Souissi and R. Turk (2014) “The Transmission of Li-quidity Shocks: The Role of Internal Capital Markets and Bank Funding Strategies”IMF working paper 14/207, November 2014.
[21] Levine, R., (2005) “Finance and Growth: Theory and Evidence” in the Handbook ofEconomic Growth Volume 1A, Eds. Philippe Aghion and Steven Durlauf, Elsevier.
[22] Martinez-Peria, S., A. Powell and I. Vladkova (2005) “Banking on Foreigners: TheBehavior of International Bank Lending to Latin America, 1985-2000" IMF Sta§Papers, 2005, Volume 52, Number 3, December.
[23] McCauley, R., C. Upper and A. Villar (2013) “Emerging market debt securitiesissuance in o§shore centres” in the BIS Quarterly Review, September 2013
[24] Petersen, M.A. and Rajan, R.G. (1997). “Trade credit: Some theories and evidence”.Review of Financial Studies 10, 661—692.
[25] Powell, A. (2014), “Global Recovery and Monetary Normalization: Escaping aChronicle Foretold?” 2014 Latin American and Caribbean Macroeconomic Report,Chapter 4. Inter-American Development Bank, Washington DC.
[26] Powell, A. (2015) “The Labyrinth: How Can Latin America and the CaribbeanNavigate the Global Economy” 2015 Latin American and Caribbean MacroeconomicReport, Inter-American Development Bank, Washington DC.
[27] Powell, A. and J. F. Martinez (2008) “On Emerging Economy Sovereign Spreads andRatings” IDB Working Paper, no. 629 January 2008.
[28] Rajan, R. and L. Zingales, L. (1995), “What Do We Know About Capital Structure?Some Evidence from International Data,” Journal of Finance, Vol. 5, pp.1421—60.
17

[29] Rodrigues-Bastos, F., H. Kamil, and B. Sutton, (2015), “Corporate Financing Trendsand Balance Sheet Risks in Latin America: Taking Stock of “The Bon(d)anza,” IMFWorking Paper 15/10, Washington DC.
[30] Shin, H.S. and L. Zhao (2013) “Firms as Surrogate Intermediaries: Evidence fromEmerging Economies” mimeo Princeton University.
[31] Turner, P. (2013) “The global long-term interest rate, financial risks and policychoices in EMEs”, paper for the Inter-American Development Bank Meeting of ChiefEconomists of Central Banks and Finance Ministries, Washington DC, October 2013
18

Table 1: Summary StatisticsN. Obs Mean Std. Dev. Min Max
Full sampleTotal Bond Issuances 8248 117.09 693.32 0 15332Local Curr. Bond Issuances 8248 71.88 497.02 0 14820For. Curr. Bond Issuances 8248 45.21 369.38 0 11000Total Assets 8248 5393.02 17298.59 3.87 408462Total Debt 8248 1485.29 4521.64 0 112168
Firm-years with issuances (13% of obs.)Total Bond Issuances 1041 927.69 1749.01 0.07 15332Total Assets 1041 18890.86 38251.78 46.49 408462Total Debt 1041 5769.81 9928.07 12.15 112168
Firm-years with local curr. issuances (10% of obs.)Local Currency Bond Issuances 854 694.19 1398.51 0.07 14820Total Assets 854 18649.13 38824.31 46.49 408462Total Debt 854 5754.07 9702.23 12.15 94793
Firm-years with foreign curr. issuances (5% of obs.)Foreign Currency Bond Issuances 392 951.24 1419.07 1.5 11000Total Assets 392 35144.74 56808.21 454.11 408462Total Debt 392 10476.81 14239.93 21.4 112168
Macro-level variables (270 country-years)Spread 8248 1.56 4.51 -2 13Carry trade index 5730 2.1 1.39 0.67 6.79Cap. Acc. Op. Chinn and Ito 8248 0.51 0.29 0 1Cap. Acc. Op. Fern. et al. (overall) 8248 0.5 0.28 0 1Cap. Acc. Op. Fern. et al (inflows) 8248 0.44 0.27 0 1Cap. Acc. Op. Fern. et al (outflows) 8248 0.56 0.32 0 1
19

Table2:Foreign
CurrencyBondIssuancesandHoldingsofLiquidFinancialAssets
Thistablereportsasetoffirm-levelregressionsinwhichthedependentvariableisthelogoftheratioholdingsofliquidfinancial
assetsandsales,andtheexplanatoryvariablesarethreedefinitionofforeigncurrencybondissuances(FXB),thedemeaned
spreadbetweenlocaldepositrateandborrowingcostsintheUS(SP),adummyvariablethattakesavalueofoneifSP
isabove
thesamplemedian(HS),adummyvariablethattakesavalueofoneifSP
isbelowthesamplemedian(LS),thelogoftotaldebt
oversales,thelogoftotalsales,andleverage.Allregressionscontrolforfirmfixede§ectsandcountry-yearfixede§ects.
(1)
(2)
(3)
(4)
(5)
(6)
(7)
(8)
(9)
FXB
0.791**
0.851**
0.015*
0.015*
0.110**
0.114**
(0.399)
(0.353)
(0.009)
(0.009)
(0.0504)
(0.0504)
FXB×SP
0.0912
0.002
0.0107
(0.0692)
(0.002)
(0.00988)
FXB×HS
1.231***
0.023*
0.164**
(0.322)
(0.012)
(0.066)
FXB×LS
0.617
0.011
0.085
(0.487)
(0.010)
(0.062)
ln(debt/sales)
-0.019
-0.019
-0.019
-0.019
-0.019
-0.019
-0.019
-0.019
-0.019
(0.012)
(0.019)
(0.020)
(0.020)
(0.020)
(0.020)
(0.020)
(0.020)
(0.020)
ln(sales)
-0.285***
-0.285***
-0.285***
-0.285***
-0.285***
-0.285***
-0.285***
-0.285***
-0.286***
(0.054)
(0.054)
(0.054)
(0.0535)
(0.054)
(0.054)
(0.054)
(0.054)
(0.054)
Leverage
-644.6
-642.1
-645.5
-648.7
-642.9
-647.8
-650.8
-645.8
-650.4
(459.9)
(461.2)
(460.4)
(460.8)
(461.8)
(461.2)
(460.8)
(461.9)
(461.3)
N.Obs.
8,243
7,881
8,243
8,243
7,881
8,243
8,243
7,881
8,243
N.offirms
766
749
766
766
749
766
766
749
766
FirmFE
Yes
Yes
Yes
Yes
Yes
Yes
Yes
Yes
Yes
Ctr-YrFE
Yes
Yes
Yes
Yes
Yes
Yes
Yes
Yes
Yes
PvaluetestHS-LS=0
0.26
0.41
0.34
FXBis
ln(1+FXB/Sales)
ln(1+FXB)
Dummy
Robuststandarderrorsclusteredatthefirmlevelinparenthesis.
***p<0.01,**p<0.05,*p<0.1
20

Table 3: Domestic versus Foreign Currency BondsThis table reports a set of firm-level regressions in which the dependent variable is the log ofthe ratio between holdings of liquid financial assets and sales, and the explanatory variables aredomestic currency bond issuances (DCB), three definition of foreign currency bond issuances(FXB), the demeaned spread between local deposit rate and borrowing costs in the US (SP),the log of total debt over sales, the log of total sales, and leverage. All regressions control forfirm fixed e§ects and country-year fixed e§ects.
(1) (2) (3) (4) (5)DCB 0.001 0.004 0.001 0.001 0.0004
(0.006) (0.007) (0.006) (0.006) (0.006)DCB×SP 0.003
(0.002)FXB 0.790** 0.015* 0.110**
(0.399) (0.008) (0.0504)ln(debt/sales) -0.019 -0.019 -0.019 -0.019 -0.019
(0.020) (0.020) (0.020) (0.020) (0.020)ln(sales) -0.283*** -0.284*** -0.285*** -0.285*** -0.285***
(0.053) (0.053) (0.054) (0.054) (0.054)Leverage -648.4 -660.3 -645.9 -649.4 -651.3
(460.5) (460.7) (459.7) (460.6) (460.7)N. Obs. 8,243 8,243 8,243 8,243 8,243N. of firms 766 749 766 766 766Firm FE Yes Yes Yes Yes YesCtr-Yr FE Yes Yes Yes Yes YesDCB is ln(1+DCB/Sales)FXB is ln(1+FXB/Sales) ln(1+FXB) Dummy
Robust standard errors clustered at the firm level in parenthesis.*** p<0.01, ** p<0.05, * p<0.1
21

Table 4: The Role of Capital Account OpennessThis table reports a set of firm-level regressions in which the dependent variable is the log ofthe ratio between holdings of liquid financial assets and sales, and the explanatory variables arethree definition of foreign currency bond issuances (FXB), the demeaned spread between localdeposit rate and borrowing costs in the US (SP), the Chinn and Ito index of capital accountopenness (K). All regressions control for the log of total debt over sales, the log of total sales,leverage, firm fixed e§ects, and country-year fixed e§ects.
(1) (2) (3) (4) (5) (6)FXB -0.213 0.334 0.0231 0.027 0.122 0.078
(0.667) (0.655) (0.019) (0.017) (0.111) (0.115)FXB×SP 0.097 0.514*** 0.002 0.009** 0.010 0.045**
(0.070) (0.156) (0.002) (0.004) (0.010) (0.022)FXB×K 2.260 1.089 -0.015 -0.026 -0.047 0.026
(1.160) (1.086) (0.037) (0.033) (0.205) (0.213)FXB×SP×K -0.817*** -0.015** -0.076*
(0.282) (0.007) (0.041)N. Obs. 7,881 7,881 7,881 7,881 7,881 7,881N. of firms 749 749 749 749 749 749Firm FE Yes Yes Yes Yes Yes YesCtr-Yr FE Yes Yes Yes Yes Yes Yesδ + φ -0.303 -0.006 -0.031p-value 0.12 0.17 0.22FXB is ln(1+FXB/Sales) ln(1+FXB) Dummy
Robust standard errors clustered at the firm level in parenthesis.*** p<0.01, ** p<0.05, * p<0.1
22

Table 5: Di§erent types of Capital ControlsThis table reports a set of firm-level regressions in which the dependent variable is the log ofthe ratio between holdings of liquid financial assets and sales, and the explanatory variables areforeign currency bond issuances (FXB, defined as ln(1+issuances/sales)), the demeaned spreadbetween local deposit rate and borrowing costs in the US (SP), the Fernández et al. index ofcapital account openness (K), the Fernández et al. index of capital account openness to inflows(KI), the Fernández et al. index of capital account openness to outflows (KO), the residuals ofa regression of KI over K (KIR), and the residuals of a regression of KO over K (KOR). Allregressions control for the log of total debt over sales, the log of total sales, leverage, firm fixede§ects and country-year fixed e§ects.
(1) (2) (3) (4) (5) (6)FXB 0.332** 0.138 0.384*** 0.0059 -0.604* 0.962**
(0.151) (0.167) (0.145) (0.196) (0.360) (0.410)FXB×SP 0.067* 0.083** 0.052 0.103*** 0.255*** -0.128
(0.034) (0.033) (0.039) (0.036) (0.081) (0.126)FXB×K -0.409 -0.061 -0.076
(0.267) (0.387) (0.391)FXB×SP×K -0.101* -0.049 -0.055
(0.052) (0.087) (0.088)FXB×KI 0.006 0.977**
(0.285) (0.457)FXB×SP×KI -0.111** -0.276***
(0.048) (0.099)FXB×KO -0.583** -0.849**
(0.278) (0.416)FXB×SP×KO -0.094 0.174
(0.074) (0.135)FXB×KIR 1.551**
(0.664)FXB×SP×KIR -0.390**
(0.192)FXB×KOR -1.566**
(0.672)FXB×SP×KOR 0.379*
(0.193)N. Obs 8,241 8,241 8,241 8,241 8,241 8,241N. Firms 766 766 766 766 766 766Firm FE Yes Yes Yes Yes Yes YesCountry-Yr FE Yes Yes Yes Yes Yes Yes
Robust standard errors clustered at the firm level in parenthesis.*** p<0.01, ** p<0.05, * p<0.1
23

Table 6: Carry trade index instead of spreadThis table reports a set of firm-level regressions in which the dependent variable is the log ofthe ratio between holdings of liquid financial assets and sales, and the explanatory variablesare foreign currency bond issuances (FXB, defined as ln(1+ issuances/sales)), the demeanedvalue of the Bloomberg index of carry trade return (CTI), the Fernández et al. index of capitalaccount openness (K), the Fernández et al. index of capital account openness to inflows (KI), theFernández et al. index of capital account openness to outflows (KO). All regressions control forthe log of total debt over sales, the log of total sales, leverage, firm fixed e§ects and country-yearfixed e§ects.
(1) (2) (3) (4)FXB -0.250 0.548 0.173 0.617
(0.613) (0.548) (0.373) (0.516)FXB×CTI 1.173** 1.103** -0.0818 0.978**
(0.589) (0.457) (0.308) (0.481)FXB×K 1.749
(1.092)FXB×CTI×K -3.402***
(1.290)FXB×KI 0.535 -0.641
(1.124) (1.230)FXB×CTI×KI -2.756** -2.673***
(1.083) (0.852)FXB×KO 1.941*** 1.719*
(0.720) (0.946)FXB×CTI×KO -0.290 0.576
(1.139) (1.773)N. Obs. 5,587 5,587 5,587 5,587N. of Firms 523 523 523 523Firm FE Yes Yes Yes YesCountry-year FE Yes Yes Yes Yes
Robust standard errors clustered at the firm level in parenthesis.*** p<0.01, ** p<0.05, * p<0.1
24

Table 7: The role of Creditors’ rights and Financial DepthThis table reports a set of firm-level regressions in which the dependent variable is the log ofthe ratio between holdings of liquid financial assets and sales, and the explanatory variables areforeign currency bond issuances (FXB, defined as ln(1+issuances/sales)), the demeaned spreadbetween local deposit rate and borrowing costs in the US (SP), The doing business index ofcreditor rights (CR, the index rescaled to range between 0 and 1, with 1 indicating strongercreditors’ rights), a measure of financial depth (FD is credit to the private sector over GDPin the year 2000), the Fernández et al. index of capital account openness to inflows (KI). Allregressions control for the log of total debt over sales, the log of total sales, leverage, firm fixede§ects and country-year fixed e§ects.
(1) (2) (3) (4)FXB 0.230 0.622 0.420 0.646
(2.034) (0.824) (2.046) (0.932)FXB×SP 0.409 0.123 0.834 0.668**
(0.543) (0.282) (0.569) (0.310)FXB×CR 0.170 0.049
(0.432) (0.528)FXB×CR×SP -0.040 -0.027
(0.129) (0.130)FXB×FD -0.089 0.308
(0.679) (0.710)FXB×FD×SP 0.008 0.039
(0.216) (0.225)FXB×KI 0.276 1.005
(2.411) (1.125)FXB×KI×SP -1.034 -0.786***
(0.608) (0.202)N. Obs. 5,831 6,621 5,831 6,621N. of Firms 648 622 648 622Firm FE Yes Yes Yes YesCountry-year FE Yes Yes Yes Yes
Robust standard errors clustered at the firm level in parenthesis.*** p<0.01, ** p<0.05, * p<0.1
25

Table 8: Sovereign RiskThis table reports a set of firm-level regressions in which the dependent variable is the log ofthe ratio between holdings of liquid financial assets and sales, and the explanatory variablesare foreign currency bond issuances (FXB, defined as ln(1+ issuances/sales)), the demeanedspread between local deposit rate and borrowing costs in the US (SP), numerical credit rating(RATING, the index is rescaled to range between 0 and 1, with 1 indicating AAA), the Fernándezet al. index of capital account openness to inflows (KI). All regressions control for the log oftotal debt over sales, the log of total sales, leverage, firm fixed e§ects and country-year fixede§ects.
(1) (2) (3) (4)FXB -0.478 -0.199 -0.056 0.522
(1.120) (1.289) (1.145) (1.457)FXB×SP 0.371 0.901*** 0.373* 1.067***
(0.246) (0.309) (0.207) (0.335)FXB×RATING 2.438 1.378 1.726 0.437
(2.063) (2.239) (2.032) (2.397)FXB×RATING×SP -0.564 -0.743 -0.590 -0.964*
(0.560) (0.534) (0.484) (0.515)FXB×KI 0.576 0.247
(0.878) (0.906)FXB×KI×SP -0.705*** -0.797***
(0.194) (0.241)N. Obs. 7,622 7,622 7,310 7,310N. of Firms 716 716 716 716Firm FE Yes Yes Yes YesCountry year FE Yes Yes Yes YesRATING is S&P Moody’s
Robust standard errors clustered at the firm level in parenthesis.*** p<0.01, ** p<0.05, * p<0.1
26
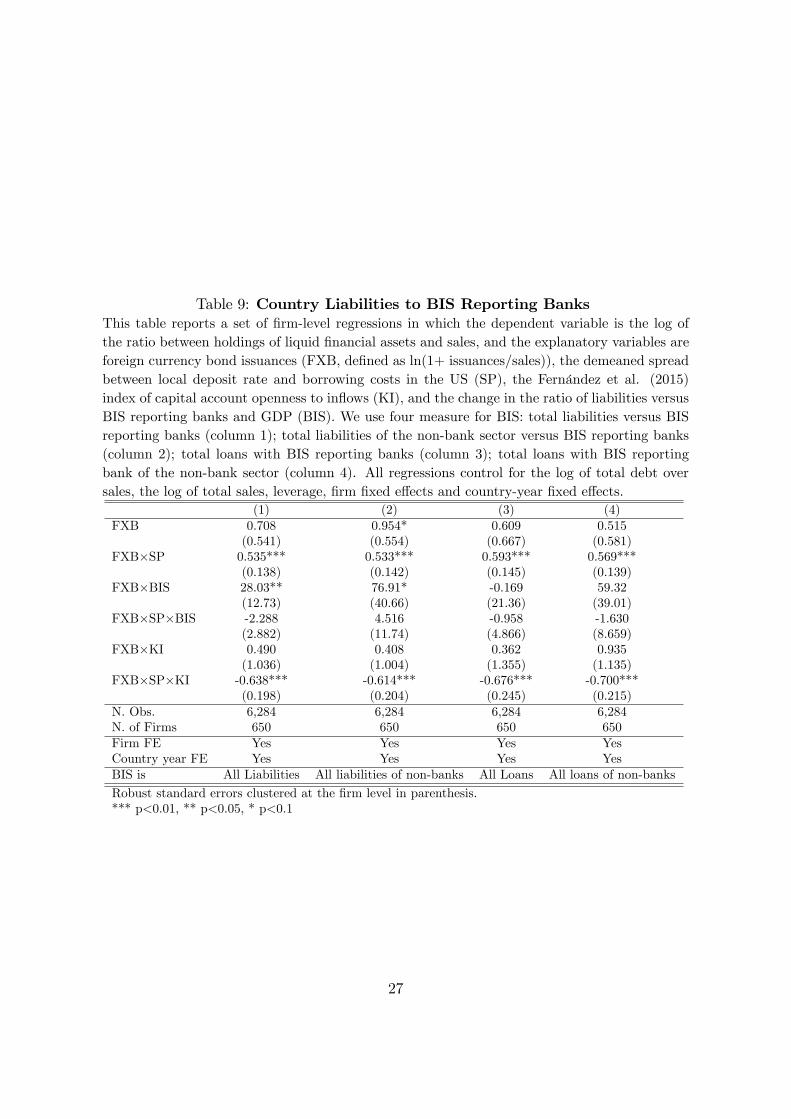
Table 9: Country Liabilities to BIS Reporting BanksThis table reports a set of firm-level regressions in which the dependent variable is the log ofthe ratio between holdings of liquid financial assets and sales, and the explanatory variables areforeign currency bond issuances (FXB, defined as ln(1+ issuances/sales)), the demeaned spreadbetween local deposit rate and borrowing costs in the US (SP), the Fernández et al. (2015)index of capital account openness to inflows (KI), and the change in the ratio of liabilities versusBIS reporting banks and GDP (BIS). We use four measure for BIS: total liabilities versus BISreporting banks (column 1); total liabilities of the non-bank sector versus BIS reporting banks(column 2); total loans with BIS reporting banks (column 3); total loans with BIS reportingbank of the non-bank sector (column 4). All regressions control for the log of total debt oversales, the log of total sales, leverage, firm fixed e§ects and country-year fixed e§ects.
(1) (2) (3) (4)FXB 0.708 0.954* 0.609 0.515
(0.541) (0.554) (0.667) (0.581)FXB×SP 0.535*** 0.533*** 0.593*** 0.569***
(0.138) (0.142) (0.145) (0.139)FXB×BIS 28.03** 76.91* -0.169 59.32
(12.73) (40.66) (21.36) (39.01)FXB×SP×BIS -2.288 4.516 -0.958 -1.630
(2.882) (11.74) (4.866) (8.659)FXB×KI 0.490 0.408 0.362 0.935
(1.036) (1.004) (1.355) (1.135)FXB×SP×KI -0.638*** -0.614*** -0.676*** -0.700***
(0.198) (0.204) (0.245) (0.215)N. Obs. 6,284 6,284 6,284 6,284N. of Firms 650 650 650 650Firm FE Yes Yes Yes YesCountry year FE Yes Yes Yes YesBIS is All Liabilities All liabilities of non-banks All Loans All loans of non-banks
Robust standard errors clustered at the firm level in parenthesis.*** p<0.01, ** p<0.05, * p<0.1
27

Table 10: Di§erent RegionsThis table reports a set of firm-level regressions in which the dependent variable is the log ofthe ratio between holdings of liquid financial assets and sales, and the explanatory variables areforeign currency bond issuances (FXB, defined as ln(1+bond issuances/sales)), the demeanedspread between local deposit rate and borrowing costs in the US (SP), the Fernández et al.index of capital account to inflows (KI). All regressions control for the log of total debt oversales, the log of total sales, leverage, firm fixed e§ects and country-year fixed e§ects. Column 1focuses on Latin America, Column 2 on Asia and Column 3 on Emerging Europe.
(1) (2) (3)FXB -0.061** 0.010*** 0.044
(0.027) (0.028) (0.068)FXB×SP 0.023*** 0.0120** 0.021
(0.004) (0.008) (0.015)FXB×KI 0.138*** -0.133** -0.019
(0.047) (0.064) (0.113)FXB×SP×KI -0.031*** -0.026* -0.056**
(0.007) (0.016) (0.028)N. Obs. 2,940 2,512 1,726N. of Firms 261 237 174Firm FE Yes Yes YesCountry year FE Yes Yes YesRegion LAC ASIA EUROPE
Robust standard errors clustered at the firm levelin parenthesis. *** p<0.01, ** p<0.05, * p<0.1
28

Table 11: EndogeneityThis table reports a set of firm-level regressions in which the dependent variable is the log ofthe ratio between holdings of liquid financial assets and sales, and the explanatory variablesare foreign currency bond issuances (FXB, defined as ln(1+ issuances/sales)), the demeanedspread between local deposit rate and borrowing costs in the US (SP), the Fernández et al.index of capital account openness (K) in 2003 (column 1), the Fernández et al. index of capitalaccount openness to inflows (K) in 2003 (column 2), the time varying Fernández et al. index ofcapital account openness to inflows (K) instrumented with openness to outflows. All regressionscontrol for the log of total debt over sales, the log of total sales, leverage, firm fixed e§ects andcountry-year fixed e§ects.
(1) (2) (3) (4)FXB -0.099 0.046 0.556 0.469
(0.583) (0.616) (0.854) (0.800)FXB×SP 0.420** 0.497** 0.261* 0.384**
(0.198) (0.197) (0.137) (0.196)FXB×K 0.342 0.206 -1.239 -0.835
(1.218) (1.093) (1.860) (1.836)FXB×K×SPR -0.732** -0.693*** -0.471 -0.670**
(0.342) (0.238) (0.360) (0.320)Observations 6,685 6,685 6,851 4,531Number of firms 750 750 735 474Firm FE Yes Yes Yes YesCountry-year FE Yes Yes Yes YesCapital account openness K2003 KI2003 KIt KItCountry-year FE Yes Yes Yes YesEstimation OLS OLS IV IVInstrument KOt KOtEstimation period 2003-13 2003-13 2000-13 2000-13Sample All Countries All Countries All Countries Asia and Latin America
Robust standard errors clustered at the firm level in parenthesis.*** p<0.01, ** p<0.05, * p<0.1
29

Figure 1: Domestic and Foreign Currency Bond Issuances.
050
100
150
Billio
n U
SD
2000
2001
2002
2003
2004
2005
2006
2007
2008
2009
2010
2011
2012
2013
Loc. Curr. For. Curr.
30

Figure 2: Evolution of Capital Account Openness. This figure plots the evolution ofdi§erent indexes of capital account openness for the sample of countries included in theregressions of this paper. In all graphs the solid line plots the median value of the indexand the dashed lines plot the top and bottom 20th percentile of the index. Panel A usesthe Chinn and Ito Index, Panel B the aggregate index of Fernandez et al., Panel C theFernandez et al. index of openness to inflows, and Panel D the Fernandez et al. index ofopenness to outflows.
.2.4
.6.8
1
2000 2002 2004 2006 2008 2010 2012 2014Year
A. Chinn & Ito Index
.2.4
.6.8
1
2000 2002 2004 2006 2008 2010 2012 2014Year
B. Fernandez et al. Index
.2.4
.6.8
1
2000 2002 2004 2006 2008 2010 2012 2014Year
C. Inflows Index
0.2
.4.6
.81
2000 2002 2004 2006 2008 2010 2012 2014Year
D. Outflows Index
Inde
x of
Ope
n C
ap. A
cc.
31
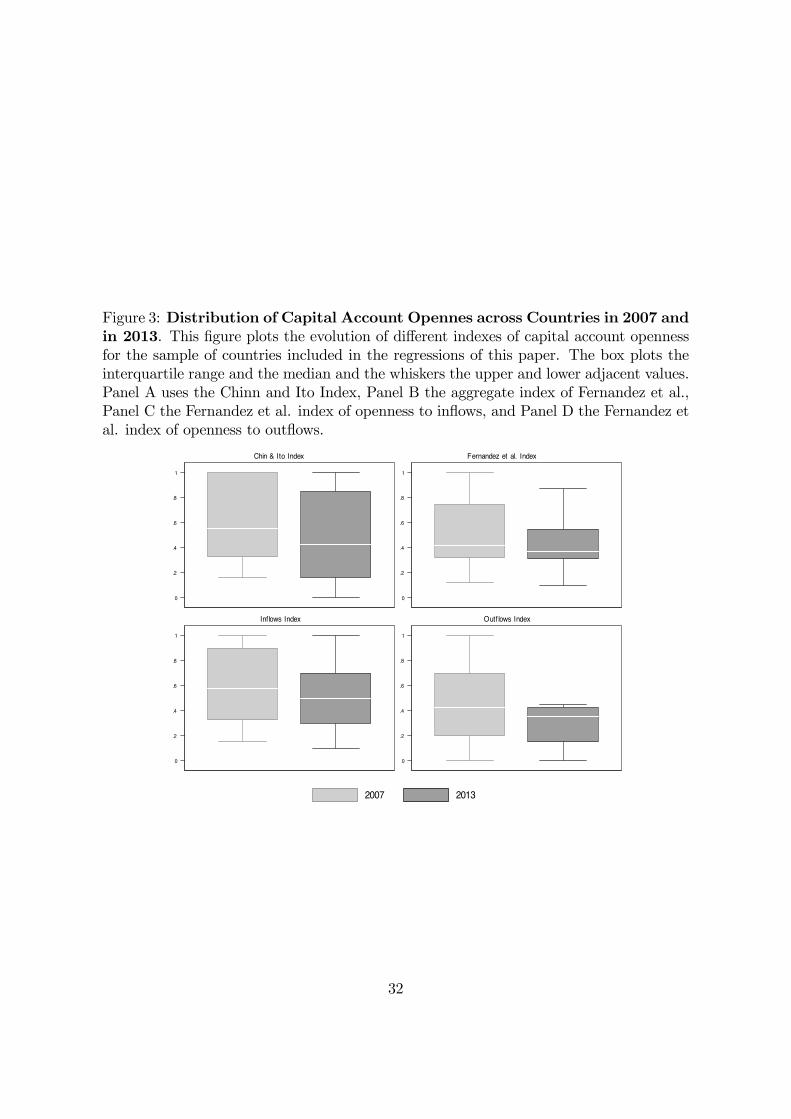
Figure 3: Distribution of Capital Account Opennes across Countries in 2007 andin 2013. This figure plots the evolution of di§erent indexes of capital account opennessfor the sample of countries included in the regressions of this paper. The box plots theinterquartile range and the median and the whiskers the upper and lower adjacent values.Panel A uses the Chinn and Ito Index, Panel B the aggregate index of Fernandez et al.,Panel C the Fernandez et al. index of openness to inflows, and Panel D the Fernandez etal. index of openness to outflows.
0
.2
.4
.6
.8
1
Chin & Ito Index
0
.2
.4
.6
.8
1
Fernandez et al. Index
0
.2
.4
.6
.8
1
Inflows Index
0
.2
.4
.6
.8
1
Outf lows Index
2007 2013
32

Figure 4: Marginal E§ect. This figure plots how the sensitivity of the relationshipbetween foreign bond issuances and holding of liquid financial assets to our spread variablevaries with capital account openness. The solid line plots the main e§ect and the dashedlines are 95 percent confidence intervals. Panel A is uses the model of column 2, Table4; Panel B uses the model of column 1, Table 5; and panels C and D use the model ofcolumn 4, Table 5.
-.50
.51
d(dC
ash/
dBon
d)/d
SP
0 .1 .2 .3 .4 .5 .6 .7 .8 .9 1Cap. Acc. Openn.
A. Chinn and Ito
-.1-.0
50
.05
.1.1
5d(
dCas
h/dB
ond)
/dS
P
0 .1 .2 .3 .4 .5 .6 .7 .8 .9 1Cap. Acc. Openn.
B. Fernandez et al.
-.2-.1
0.1
.2.3
d(dC
ash/
dBon
d)/d
SP
0 .1 .2 .3 .4 .5 .6 .7 .8 .9 1Cap. Acc. Openn.
C. Inf lows
-.2-.1
0.1
.2.3
d(dC
ash/
dBon
d)/d
SP
0 .1 .2 .3 .4 .5 .6 .7 .8 .9 1Cap. Acc. Openn.
D. Outf lows
33

Appendix
Table A1: Data Description and SourcesVariable Description and Sourcesln(C/SA) Logarithm of liquid financial assets over sales for firm i, country c, year t. Source: Worldscope.ln(debt/sales) Logarithm of debt over sales for firm i, country c, year t. Source: Worldscope.ln(sales) Logarithm of sales for firm i, country c, year t (sales are in millions or USD). Source: Worldscope.Leverage Debt over assets for firm i, country c, year t. Source: Worldscope.FXB Total foreign currency bond issuance for firm i, country c, year t (millions USD). Source: Own
calculations based on bond-level Dealogic dataDCB Total domestic currency bond issuance for firm i, country c, year t (millions USD). Source: Own
calculations based on bond-level Dealogic dataSP Spread between local interest rate and the cost of foreign borrowing. In most cases, the local interest
rate is proxied by the deposit rate. However, if the local money market rate is higher than the localdeposit rate we use the local money market rate. The cost of foreign borrowing is normally proxiedby the sovereign yield in USD. However, if the US interest rate on BAA rated bonds is lower thanthe sovereign yield, we use the BAA yield. Source: Local deposit rate is from the World Bank’sWorld Development Indicators. The BAA yield is from the FRED database and sovereign yields arefrom BloombergS is measured in percentage points. We rescale the spread so that its mean value is zero. Countryc, year t. Source:
CTI Carry trade index. This is an ex ante measure of the attractiveness of carry trades. It is computedby adding the returns from interest rate di§erentials to the returns obtained in the foreign exchangespot market (i.e., it adds the spot return to the interest earned from the long currency position andsubtracts the interest owed from the short currency position). Country c, year t. Source: Bloomberg.
K Overall index of capital account openness. The index ranges between 0 (closed capital account) and1 (open capital account). Country c, year t. Source: Chinn and Ito (2006) and Fernández et al.(2015).
KI Index of capital account openness to inflows. The index ranges between 0 (closed capital account)and 1 (open capital account). Country c, year t. Source: Fernández et al. (2015).
KO Index of capital account openness to outflows. The index ranges between 0 (closed capital account)and 1 (open capital account). Country c, year t. Source: Fernández et al. (2015).
FD Index of financial depth (credit to the private sector over GDP). We rescaled the index to havemean=0. Country c, year t. Source: World Development Indicators
CR Index of creditors’ rights. We rescaled the index to have mean=0. Country c, year t. Source: WorldBank’s Doing Business
Rating Numerical code of sovereign credit rating. We followed the common practice of assigning scoresfrom 1 to 21 to the rating categories (21 being the highest quality rating of AAA) and rescaled theresulting index to range between 0 and 1 (Afonso 2007, see Powell and Martinez 2008 and Cavalloet al. 2013) for a discussion of using a numerical, cardinal scale for ratings versus other techniques.Country c, year t. Source: S&P and Moody’s
BIS Four definitions: Total liabilities versus BIS reporting banks; Total non-bank liabilities versus BISreporting banks; total loans with BIS reporting banks; total loans of BIS reporting banks to thenon-bank sector. Country c, year t. Source: BIS Statistics.
34

Table A2: Details Regarding the Sample of Firms Employed in the RegressionAnalysisThis table reports the composition of the sample of firms used in the analysis. The sampleincludes firms from the 18 emerging economies listed in the table. The analysis is restrictedto the largest fifty non-financial, non-foreign listed firms in each country. After the eliminationprocess described in Footnote 2, we are left with a total of 766 firms in the eighteen countriesof interest and with available data for the analysis (the total number of firms after eliminatingfinancials and foreign firms is 803 firms). The table reports the number of firms in each countryand also the market capitalization of the final sample relative to the total market capitalizationof the subsample of non-financial, non-foreign firms. The table also reports the number of firmsin the final sample that report at least one bond issued during the period of analysis (2000-14)
All firms in sample Share of market capitalization Number of issuersArgentina 47 1.00 8Brazil 49 0.80 25Chile 46 0.93 17Colombia 26 1.00 6Czech Republic 6 1.00 1Hungary 22 1.00 1Indonesia 47 0.81 12Israel 45 0.89 4Malaysia 45 0.82 24Mexico 43 0.97 23Peru 50 1.00 8Philippines 48 0.96 13Poland 48 0.88 6Russia 48 0.96 19South Africa 49 0.89 13South Korea 50 0.67 24Thailand 47 0.82 23Turkey 50 0.88 3Total 766 0.31 230
35

Table A3: Bruno and Shin regressionThis table reports a set of firm-level regressions in which the dependent variable is the log of theratio between the change in holdings of liquid financial assets and assets at time t-1, and theexplanatory variables are foreign currency bond issuances scaled by assets at time t-1 (BFX), thedemeaned spread between local deposit rate and borrowing costs in the US (SP), two definitionof capital account openness (the Chinn and Ito index in column 3 and the Fernandez et al. indexof openness to inflows in column 4), the log of total assets, the log of other source of financeover total assets (ln(OTH)). All regressions control for firm fixed e§ects and country-year fixede§ects.
(1) (2) (3) (4)BFX 0.112* 0.126* 0.191 0.162
(0.0679) (0.068) (0.128) (0.131)BFX×SP 0.0215 0.107** 0.106**
(0.018) (0.044) (0.045)BFX×K -0.163
(0.215)BFX×K×SP -0.167**
(0.079)BFX×KI -0.0555
(0.228)BFX×K×SP -0.127**
(0.061)ln(TA) -0.039*** -0.039*** -0.039*** -0.039***
(0.011) (0.011) (0.011) (0.011)Ln(OTH) 0.269*** 0.269*** 0.269*** 0.269***
(0.0896) (0.0896) (0.0896) (0.090)N. Obs. 7,929 7,579 7,579 7,579N. of Firms 763 763 763 763Firm FE Yes Yes Yes YesCountry year FE Yes Yes Yes Yes
Robust standard errors clustered at the firm level in parenthesis.*** p<0.01, ** p<0.05, * p<0.1
36
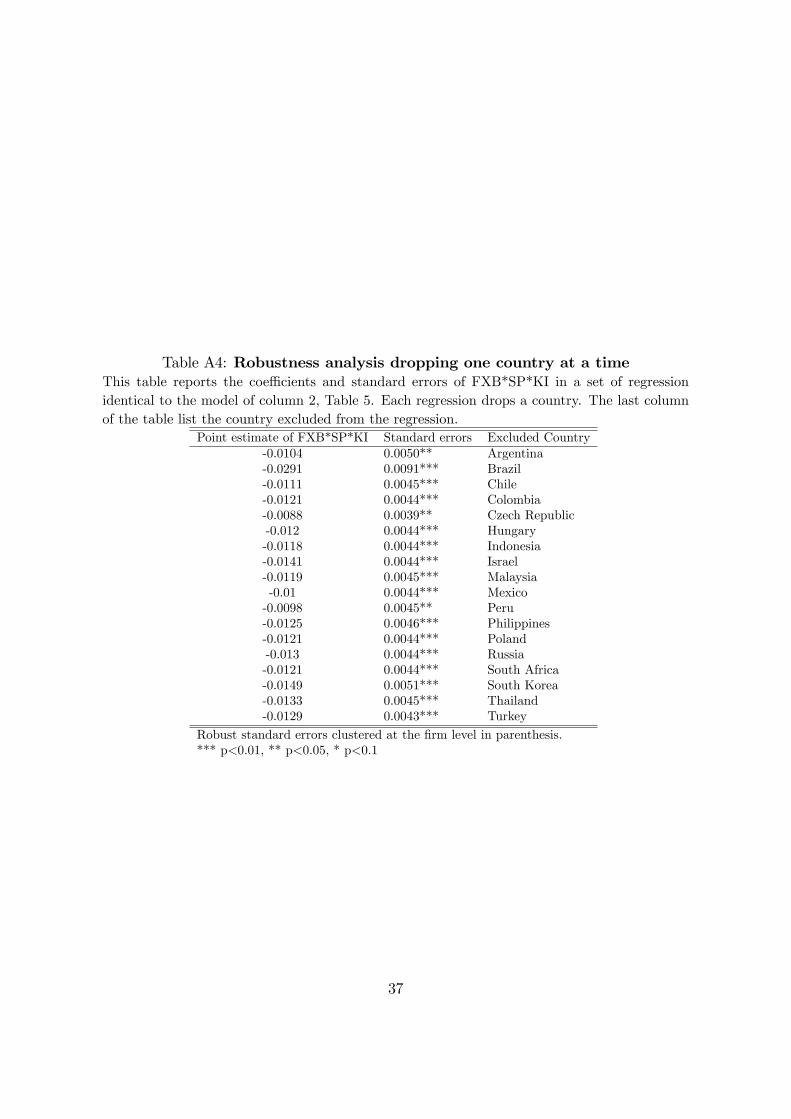
Table A4: Robustness analysis dropping one country at a timeThis table reports the coe¢cients and standard errors of FXB*SP*KI in a set of regressionidentical to the model of column 2, Table 5. Each regression drops a country. The last columnof the table list the country excluded from the regression.
Point estimate of FXB*SP*KI Standard errors Excluded Country-0.0104 0.0050** Argentina-0.0291 0.0091*** Brazil-0.0111 0.0045*** Chile-0.0121 0.0044*** Colombia-0.0088 0.0039** Czech Republic-0.012 0.0044*** Hungary-0.0118 0.0044*** Indonesia-0.0141 0.0044*** Israel-0.0119 0.0045*** Malaysia-0.01 0.0044*** Mexico-0.0098 0.0045** Peru-0.0125 0.0046*** Philippines-0.0121 0.0044*** Poland-0.013 0.0044*** Russia-0.0121 0.0044*** South Africa-0.0149 0.0051*** South Korea-0.0133 0.0045*** Thailand-0.0129 0.0043*** Turkey
Robust standard errors clustered at the firm level in parenthesis.*** p<0.01, ** p<0.05, * p<0.1
37

Table A5: Di§erent PeriodsThis table reports a set of firm-level regressions in which the dependent variable is the log ofthe ratio between holdings of liquid financial assets and sales, and the explanatory variables areforeign currency bond issuances (FXB, defined as ln(1+ issuances/sales)), the demeaned spreadbetween local deposit rate and borrowing costs in the US (SP), the Fernández et al. index ofcapital account openness (K), the Fernández et al. index of capital account openness to inflows(KI). All regressions control for the log of total debt over sales, the log of total sales, leverage,firm fixed e§ects, and country-year fixed e§ects. Columns 1 and 2 focus on the 2007-2014 periodand columns 3 and 4 on the 2000-2006 period.
(1) (2) (3) (4)FXB 0.026 0.018 0.032 0.026
(0.017) (0.017) (0.021) (0.022)FXB×SP 0.008* 0.011*** 0.008* 0.008*
(0.004) (0.004) (0.004) (0.004)FXB×K -0.011 -0.027
(0.038) (0.037)FXB×SP×K -0.013 -0.015**
(0.010) (0.007)FXB×KI 0.003 -0.01
(0.032) (0.037)FXB×SP×KI -0.017** -0.012**
(0.007) (0.006)N. Obs. 5,109 5,109 3,132 3,132N. of Firms 756 756 570 570Firm FE Yes Yes Yes YesCountry year FE Yes Yes Yes YesPeriod 2007-2014 2007-2014 2000-2006 2000-2006
Robust standard errors clustered at the firm level in parenthesis.*** p<0.01, ** p<0.05, * p<0.1
38

Table A6: E§ect at Time t+1This table reports a set of firm-level regressions in which the dependent variable is the log ofthe ratio between holdings of liquid financial assets and sales, and the explanatory variables areforeign currency bond issuances (FXB, defined as ln(1+issuances/sales)), the demeaned spreadbetween local deposit rate and borrowing costs in the US (SP), the Fernández et al. index ofcapital account openness (K), the Fernández et al. index of capital account openness to inflows(KI), the log of total debt over sales, the log of total sales, and leverage. All regressions controlfor firm fixed e§ects and country-year fixed e§ects. In columns 1 and 2, all the explanatoryvariables are lagged, in columns 3 and 4 only FXB is lagged.
(1) (2) (3) (4)FXB -0.087 -0.354 0.149 -0.135
(0.451) (0.481) (0.429) (0.471)FXB×SP 0.385*** 0.428*** 0.367*** 0.377***
(0.137) (0.153) (0.129) (0.136)FXB×K 0.309 -0.190
(0.998) (1.002)FXB×K×SP -0.705*** -0.769***
(0.253) (0.244)FXB×KI 0.701 0.422
(0.899) (0.957)FXB×K×SPI -0.617*** -0.654***
(0.205) (0.206)N. Obs. 7,435 7,435 7,454 7,454N. of Firms 745 745 753 753Firm FE Yes Yes Yes YesCountry year FE Yes Yes Yes YesLags All controls are lagged Only FXB is laggedRobust standard errors clustered at the firm level in parenthesis.*** p<0.01, ** p<0.05, * p<0.1
39