the scottish health survey - university of stirling et al... · the scottish health survey ......
TRANSCRIPT

The Scottish Health Survey Topic Report | Mental Health and Wellbeing
A Official Statistics Publication for Scotland

1
Authors Authors - Michael Wilson1, Craig Kellock2, Daniel Adams2, Julie Landsberg2 1 Economic and Social Research Council intern, based within Scottish Government 2 Scottish Government

2
Contents List of tables and figures ............................................................................................................. 4
Abbreviations used in the report ............................................................................................... 6
Authors’ acknowledgements ...................................................................................................... 7
Summary of results ...................................................................................................................... 8
1. Introduction .......................................................................................................................... 11
1.1 Policy context ............................................................................................................... 11
1.2 Aims of the report ........................................................................................................ 11
1.3 Scottish Health Survey background ........................................................................ 11
1.4 Measurement of Mental Health and Wellbeing ....................................................... 12
1.4.1 The Warwick-Edinburgh Mental Wellbeing Scale (WEMWBS) .................... 12
1.4.2 Component Questions of WEMWBS ................................................................ 13
1.4.3 The General Health Questionnaire (GHQ12) ................................................... 13
1.4.4 Component questions of GHQ12 ...................................................................... 14
1.4.5 Limitations in measures ..................................................................................... 14
1.5 Literature review .......................................................................................................... 15
2. Methodology......................................................................................................................... 18
2.1 Descriptive analysis .................................................................................................... 18
2.1.1 Age-standardisation ............................................................................................ 18
2.2 Logistic regression ..................................................................................................... 18
2.2.1 Selection of most significant factors ............................................................... 19
2.2.2 Binary outcome measures ................................................................................. 19
2.2.3 Interpretation ........................................................................................................ 19
2.2.4 Missing data .......................................................................................................... 20
3. WEMWBS and GHQ12 ........................................................................................................ 23
3.1 Trends in WEMWBS mean scores since 2008 ....................................................... 23
3.2 Trends in GHQ12 score since 2003 .......................................................................... 23
3.3 Relationship between WEMWBS and GHQ12 ........................................................ 23
4. Demographic factors .......................................................................................................... 28
4.1 Factors associated with low mental wellbeing ...................................................... 28
4.1.1 Age and Gender.................................................................................................... 28
4.1.2 Marital status ........................................................................................................ 30
4.1.3 Scottish Index of Multiple Deprivation (SIMD)................................................ 33
4.1.4 Equivalised household income ......................................................................... 35
4.1.5 Urban/ rural classification .................................................................................. 36
3
4.1.6 Economic activity................................................................................................. 38
4.1.7 Parental socio-economic classification........................................................... 40
4.1.8 Household tenure................................................................................................. 41
4.1.9 Household type .................................................................................................... 41
4.1.10 Highest educational qualification ..................................................................... 42
4.1.11 Unpaid care ........................................................................................................... 43
4.1.12 Perception of local crime .................................................................................... 45
5. Behaviours and Health conditions................................................................................... 47
5.1 Factors associated with low mental wellbeing ...................................................... 47
5.1.1 Physical activity ................................................................................................... 47
5.1.2 Alcohol consumption .......................................................................................... 50
5.1.3 Smoking ................................................................................................................. 53
5.1.4 Fruit and Vegetable Consumption .................................................................... 55
5.1.5 Obesity ................................................................................................................... 56
5.1.6 Eating together ..................................................................................................... 58
5.1.7 Doctor-diagnosed health conditions ................................................................ 58
6. Logistic regression tables ................................................................................................. 62
6.1 WEMWBS ...................................................................................................................... 62
6.2 GHQ12 ............................................................................................................................ 65
7. References ............................................................................................................................ 69

4
List of tables and figures Table 3A WEMWBS component question mean scores, by GHQ12 mental health status, 2012/2013 Table 4A Socio-demographic factors, 2012/2013 Table 4B GHQ component ‘Been losing confidence in self’: results of logistic regression analysis indicating a low score, by age group and sex, 2012/2013 Table 4C WEMWBS statement ‘Been feeling love’: results of logistic regression
analysis indicating a low score, by marital status and sex, 2012/2013 Table 4D GHQ component ‘Been losing confidence in self’: results of logistic
regression analysis indicating a low score, by marital status and sex, 2012/2013 Table 5A Health-related factors, 2012/2013 Table 5B Physical activity guidelines: description of categories Table 5C WEMWBS statement ‘I’ve had energy to spare’: results of logistic
regression analysis indicating a low score, by physical activity level and sex, 2012/2013 Table 5D BMI categories and definitions Table 6A Estimated odds ratios for below average WEMWBS, by sex, 2012/2013 Table 6B Estimated odds ratios for GHQ12 scores of four or higher, by sex,
2012/2013 Figure 1A Sample structure of 2012, 2013 and 2012/2013 combined datasets Figure 3A Relationship between WEMWBS and GHQ12 scores, 2012/2013 Figure 3B Distribution of WEMWBS scores, 2012/2013 Figure 4A WEMWBS mean scores, by age group and sex, 2012/2013 Figure 4B Proportion of adults with GHQ12 scores of four or higher, by age group
and sex, 2012/2013 Figure 4C WEMWBS mean scores, by marital status (not age-standardised),
2012/2013 Figure 4D Proportion of adults with GHQ12 scores of four or higher, by marital
status (not age-standardised), 2012/2013 Figure 4E WEMWBS mean scores, by SIMD quintile, 2012/2013 Figure 4F Proportion of adults with GHQ12 scores of four or higher, by SIMD quintile, 2012/2013 Figure 4G WEMWBS mean scores, by equivalised household income quintile, 2012/2013 Figure 4H Proportion of adults with GHQ12 scores of four or higher, by equivalised household income quintile and sex, 2012/2013 Figure 4I WEMWBS mean scores, by urban rural classification, 2012/2013 Figure 4J Proportion of adults with GHQ12 scores of four or higher, by urban-
rural classification, 2012/2013 Figure 4K WEMWBS mean scores, by economic activity category (not age-
standardised), 2012/2013

5
Figure 4L Proportion of adults with GHQ12 scores of four or higher, by economic activity category (not age-standardised), 2012/2013 Figure 4M WEMWBS mean scores, by parental socio-economic classification, 2012/2013 Figure 4N WEMWBS mean scores, by household type (not age-standardised), 2012/2013 Figure 4O Proportion of adults with GHQ12 scores of four or higher, by household type (not age-standardised), 2012/2013 Figure 4P WEMWBS mean scores, by sex and hours of unpaid care, 2012/2013 Figure 4Q Proportion of adults with GHQ12 scores of four or higher, by sex and
hours of unpaid care, 2012/2013 Figure 5A WEMWBS mean scores, by physical activity level, 2012/2013 Figure 5B Proportion of adults with GHQ12 scores of four or higher, by physical
activity level, 2012/2013 Figure 5C WEMWBS mean scores, by drinking classification (based on units) and
sex, 2012/2013 Figure 5D Proportion of adults with GHQ12 scores of four or higher, by drinking
classification (based on units) and sex, 2012/2013 Figure 5E WEMWBS mean scores, by smoking status and sex, 2012/2013 Figure 5F Proportion of adults with GHQ12 scores of four or higher, by smoking status and sex, 2012/2013 Figure 5G WEMWBS mean scores, by BMI classification and sex, 2012/2013 Figure 5H WEMWBS mean scores, by doctor-diagnosed condition (not age-
standardised), 2012/2013
6
Abbreviations used in the report GHQ12 12 item General Health Questionnaire WEMWBS Warwick-Edinburgh Mental Wellbeing Scale SHeS Scottish Health Survey NS-SEC National Statistics – Socio-economic Classification BMI Body Mass Index NICE National Institute for Clinical Excellence WHO World Health Organisation CL Confidence Limits OR Odds Ratio CVD COPD
Cardiovascular disease Chronic obstructive pulmonary disease

7
Authors’ acknowledgements
Our first thank you is to the 9,709 men and women in Scotland who gave up their time voluntarily to take part in the surveys in 2012 and 2013 analysed here. We are also grateful to the interviewers who conducted the surveys for the dedication and professionalism they applied to their work. Thanks also to Michael Davidson, Alastair Greig, Jamie Robertson and Clare Leadbetter at the Scottish Government for their support in developing and reviewing the regression methods used in the report. Responsibility for all analyses and conclusions lies with the authors of the report. Michael Wilson, Craig Kellock, Daniel Adams and Julie Landsberg.
8
Summary of results
This report explores factors associated with mental wellbeing and mental health among adults in Scotland using data from the Scottish Health Survey (SHeS). Analyses are based on survey years 2012 to 2013 and include participants aged 16 years and older. The factors included in the analyses include socio-demographic, health behaviours and conditions. Results are presented for:
The mean score on the WEMWBS scale in 2012/2013 was 50.3 for men and 49.6 for women. Mental wellbeing is significantly associated with age, with mean scores high in the youngest adult age groups (50.1 and 50.2 for ages 16-24 and 25-34 respectively), dropping among adults aged 45-54 (48.9), rising to a peak between ages 65 and 74 (51.1), and then dropping off again among the oldest group (ages 75+, mean score 49.5). One in eight (13%) men have GHQ12 scores of four or higher, indicating the presence of a possible psychiatric disorder, compared to 18% of women. A lower proportion of men across all age groups displayed signs of a possible psychiatric disorder. GHQ12 and WEMWBS show a moderate negative correlation. The median WEMWBS score declines as GHQ12 score increases, most rapidly nearest the two extremes on the GHQ12 scale. Chapters 4 and 5 present an analysis of factors significantly associated with low mental wellbeing among adults, indicated by WEMWBS scores, and an analysis of factors associated with adults who display signs of the presence of a possible psychiatric disorder, indicated by scores of four or higher on the GHQ12 scale. Logistic regression of 2012/2013 SHeS data provides a robust analysis examining the factors associated with these mental health and wellbeing outcomes across the adult population. By controlling for various independent factors simultaneously, the association of each factor with mental health and wellbeing can be established. A benefit of these analyses is being able to disentangle confounding factors. For example, this allows us to test whether lower levels of wellbeing observed among people who provide 35 hours or more unpaid care per week is due to the age profile of this subgroup. Other results, standardised by age, show the proportion of adults with a GHQ12 score of four or higher, and the mean WEMWBS score of each population subgroup. It is important to note that the factors examined in the multivariate models in this report are likely to have bi-directional relationships with low mental health and wellbeing. Therefore, while many of these findings support other research which shows a relationship between demographic or health-related factors and mental
The Warwick-Edinburgh Mental Wellbeing Scale (WEMWBS) – used to measure mental wellbeing
The General Health Questionnaire (GHQ) – used to identify individuals showing signs of the presence of a possible psychiatric disorder.

9
wellbeing, the associations identified in this analysis show correlations between variables, as opposed to indicating causality. Furthermore, the results are limited to those factors which are reported in SHeS. The factor most strongly associated with low mental health and wellbeing, under both measures, is economic activity, in particular the group of adults who are permanently unable to work. Although these results may partially reflect the effect of unemployment on mental wellbeing, as cited by other research, the results may be confounded by those who are unable to take up work as a result of poor mental health. However, these associations are still useful to identify population subgroups at greatest risk of poor mental wellbeing. Many of the health-related factors for which the results indicate an association with poor mental wellbeing – for example, smoking and alcohol dependence – are socio-demographically patterned whereby prevalence is generally higher in lower socio-economic groups (for example, the most deprived areas or lower income households). Therefore, although area deprivation (SIMD) is shown not to be a significant predictor of GHQ12 scores of four or higher after controlling for other factors, it is still true that prevalence of some of those most significant risk factors for low mental wellbeing is highest in those areas. Physical inactivity, smoking and possible dependence on alcohol are all significantly associated with low WEMWBS scores and GHQ12 scores of four or higher, after controlling for other factors. For both measures, physical inactivity and possible dependence on alcohol were the strongest behavioural predictors. Adults who provide unpaid care for 35 or more hours per week are more likely to have a low WEMWBS score, and a GHQ12 score of four or higher, after controlling for other factors. These results were stronger among women than men. In particular, female carers who provide 35 hours or more support per week were significantly more likely to respond negatively when asked if they have ‘been feeling relaxed’. A number of socio-demographic factors are significant predictors of poor mental wellbeing – for example, age, household income and marital status. While area deprivation was a significant predictor for WEMWBS, it was one of the weakest of those selected factors and not significant for GHQ12.

Chapter 1Introduction

11
1. Introduction 1.1 Policy context
The improvement of mental wellbeing is a national indicator in the Scottish Government’s National Performance Framework. In support of this, the ‘Mental Health Strategy: 2012-2015’ sets out the Scottish Government’s priorities with regard to improving mental health services, promoting mental wellbeing, preventing mental illness and ensuring that individuals and communities can maintain and improve their own health. The Strategy describes 36 commitments it will adhere to in achieving these priorities. A key element in the Strategy is enabling people to become more involved and active in their own health and wellbeing. The evidence base for people taking a leading role in managing their own illness over time and the wider benefits to them that this approach offers is well established. The Strategy focuses on things people and communities can do for themselves which are particularly valuable given the additional benefits that people derive from taking control of their own health and wellbeing. Examples of this approach include the Living Life Guided Self Help Service operated by NHS 24, the Steps for Stress resources managed by NHS Health Scotland, and Ginsberg - a web-based tool launched by the Scottish Government to help people manage their wellbeing in relation to other aspects of their lives. Ginsberg allows people to see patterns that are developing, to draw links between what they are doing with their time and how they are feeling, and to see the changes they can make to improve their wellbeing. SHeS is the data source for 28 of NHS Health Scotland’s 54 national mental health indicators for adultsa, intended to allow national monitoring of adult mental health and covering outcomes and risk factors for poor mental health. 1.2 Aims of the report The primary aim of this report is to investigate the factors that are significantly associated with poor mental health and wellbeing among adults of 16 years of age and older in Scotland. The report examines how mental wellbeing varies by socio-demographic, behavioural and health condition factors based on Scottish Health Survey (SHeS) data and using the measures described in section 1.4. Other measures of mental health and wellbeing covered by the survey, such as anxiety, depression and life satisfaction, are not analysed in this report. 1.3 Scottish Health Survey background
The Scottish Health Survey was established in 1995 to provide data on the health of the population living in private households. The survey was repeated in 1998 and a See http://www.healthscotland.com/documents/2349.aspx for more information
12
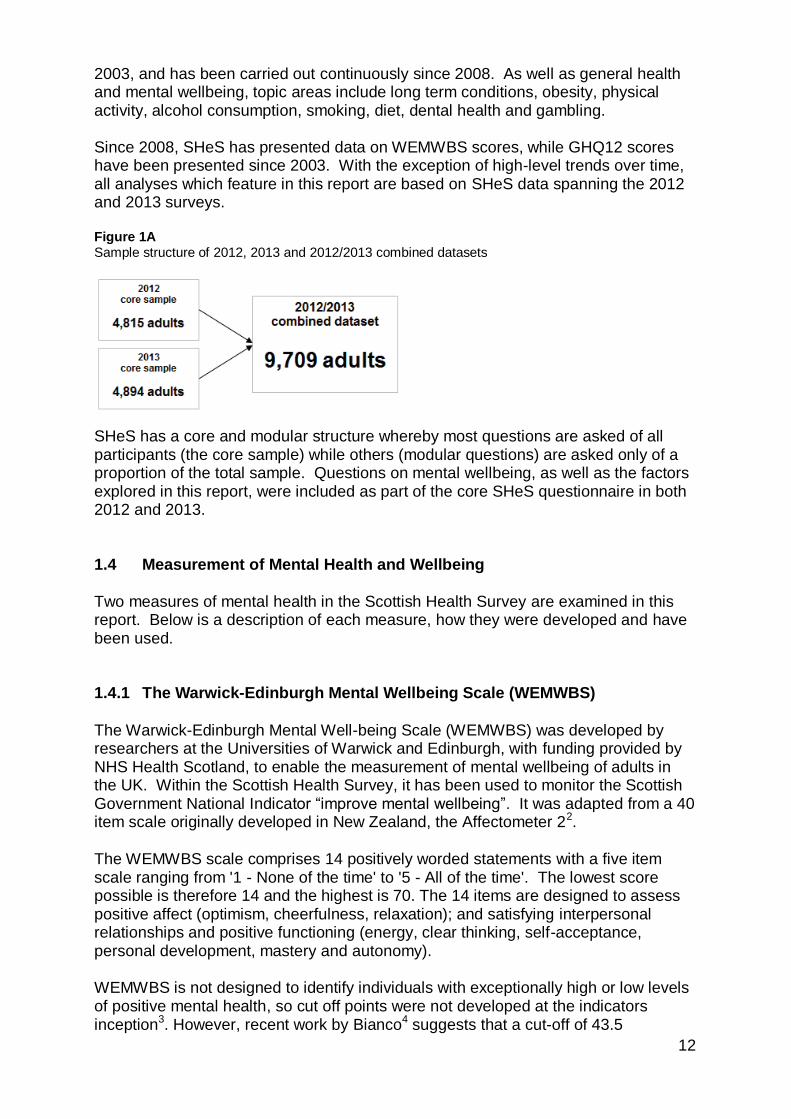
2003, and has been carried out continuously since 2008. As well as general health and mental wellbeing, topic areas include long term conditions, obesity, physical activity, alcohol consumption, smoking, diet, dental health and gambling. Since 2008, SHeS has presented data on WEMWBS scores, while GHQ12 scores have been presented since 2003. With the exception of high-level trends over time, all analyses which feature in this report are based on SHeS data spanning the 2012 and 2013 surveys. Figure 1A Sample structure of 2012, 2013 and 2012/2013 combined datasets
SHeS has a core and modular structure whereby most questions are asked of all participants (the core sample) while others (modular questions) are asked only of a proportion of the total sample. Questions on mental wellbeing, as well as the factors explored in this report, were included as part of the core SHeS questionnaire in both 2012 and 2013. 1.4 Measurement of Mental Health and Wellbeing Two measures of mental health in the Scottish Health Survey are examined in this report. Below is a description of each measure, how they were developed and have been used. 1.4.1 The Warwick-Edinburgh Mental Wellbeing Scale (WEMWBS)
The Warwick-Edinburgh Mental Well-being Scale (WEMWBS) was developed by researchers at the Universities of Warwick and Edinburgh, with funding provided by NHS Health Scotland, to enable the measurement of mental wellbeing of adults in the UK. Within the Scottish Health Survey, it has been used to monitor the Scottish Government National Indicator “improve mental wellbeing”. It was adapted from a 40 item scale originally developed in New Zealand, the Affectometer 22.
The WEMWBS scale comprises 14 positively worded statements with a five item scale ranging from '1 - None of the time' to '5 - All of the time'. The lowest score possible is therefore 14 and the highest is 70. The 14 items are designed to assess positive affect (optimism, cheerfulness, relaxation); and satisfying interpersonal relationships and positive functioning (energy, clear thinking, self-acceptance, personal development, mastery and autonomy).
WEMWBS is not designed to identify individuals with exceptionally high or low levels of positive mental health, so cut off points were not developed at the indicators inception3. However, recent work by Bianco4 suggests that a cut-off of 43.5

13
performed well in screening depressive symptomatology and may be an accurate tool for the assessment of symptoms of depressive disorders. The Scottish Health Survey 2011 annual report applied a cut off of one standard deviation less than the mean. Scores below this threshold indicate respondents with below average mental well-being. For the same reasons, and to allow comparison, the same methodology has been used in this topic report - a cut-off of 42 has therefore been applied.
1.4.2 Component Questions of WEMWBS
The fourteen positively worded statements that make up the WEMWBS scale are listed below. All of the component questions have a five item scale ranging from '1 - None of the time' to '5 - All of the time', so the summed WEMWBS scale ranges from 14 to 70 with higher scores indicating better mental wellbeing. Respondents are asked to pick the score that best describes their experience over the last two weeks for each question.
Been feeling optimistic about the future
Been feeling useful
Been feeling relaxed
Been feeling interested in other people
I’ve had energy to spare
Been dealing with problems well
Been thinking clearly
Been feeling good about myself
Been feeling close to other people
Been feeling confident
Been able to make up own mind about things
Been feeling love
Been interested in new things
Been feeling cheerful 1.4.3 The General Health Questionnaire (GHQ12) The General Health Questionnaire is a scale designed to detect possible psychiatric morbidity in the general population, which has been validated in the UK and worldwide5. Within the Scottish Health Survey, it was administered to participants aged 13 and above. The questionnaire contains 12 questions about the informant's general level of happiness, depression, anxiety and sleep disturbance over the past four weeks, arranged so that no reverse scoring is required. The scoring takes the form of a four point Likert scale with response options ‘less than usual’ (score 0), ‘no more than usual’ (1), rather more than usual’ (2) or ‘much more than usual’ (3) (or in the opposite order to avoid the need for reverse scoring). To identify psychiatric morbidity these scores are converted into binary scores, with 0 or 1 set to zero and 2 or 3 set to 1. The scores for the summed variable then range from zero to 12, with higher scores indicating greater likelihood of possible psychiatric morbidity. With this new variable, a cut-off score can be selected to signify the possible presence of psychiatric

14
morbidity. Although there is considerable variety in literature on the choice of the most appropriate score to use as the cut-off,6–9 a figure of four has been used for this report, in line with previous Scottish Government reports and examples from literature10–13. 1.4.4 Component questions of GHQ12
There are twelve component questions in GHQ12, six positively and six negatively worded. Each question has a four item scale arranged so that no reverse scoring is required and respondents are asked to pick the score that best reflects their experiences over the last four weeks for each question.
Able to concentrate
Lost sleep over worry
Felt playing useful part in things
Felt capable of making decisions
Felt constantly under strain
Felt couldn’t overcome difficulties
Able to enjoy day-to-day activities
Been able to face problems
Been feeling unhappy and depressed
Been losing confidence in self
Been thinking of self as worthless
Been feeling reasonably happy
1.4.5 Limitations in measures
WEMWBS has shown good reliability in terms of internal consistency and stability at a population level3,14 and has proved to be a psychometrically strong population measure of mental wellbeing.15 Although the measure was not designed as a screening tool for the assessment of depressive symptoms via a cut-off score, a score of 43.5 has been shown to be an appropriate discriminating point. As in previous reports, the methodology applied here defines low WEMWBS scores as one standard deviation below the population mean or lower. This is equivalent to scores of 41 or lower, and has been used to identify respondents at risk of low mental wellbeing. GHQ12 has been found to be ‘uniformly good’ in identifying anxiety and mood disorder cases among adults in clinical settings5 and its ability to estimate the prevalence of such disorders appears reasonable16,17 However, some doubt has been raised as to the validity of GHQ12 as a screening tool for non-specific psychiatric morbidity. In particular, response bias in the negatively worded component questions is thought to lead to measurement error.18 The selection of the most appropriate cut-off point in GHQ12 is subject to some discussion, but, for consistency with other reports, a cut-off of four has been applied in this analysis. Although WEMWBS and GHQ12 are designed to be analysed as aggregate measures, some selected findings for component questions are described in this report where they stand out and are statistically significant.

15
1.5 Literature review A review of the literature has been carried out to identify factors associated with problem and positive mental health. Mental disorders increase the risk for physical health conditions and contribute to unintentional and intentional injury, while conversely many health conditions increase the risk for mental disorders, and co-morbidity complicates help-seeking, diagnosis and treatment, and influences prognosis19. The NHS Health Scotland report ‘Scotland’s Mental Health: Adults 2012’20 provides a comprehensive list of indicators and contextual factors associated with mental health. Some of the factors for which data is available in the Scottish Health Survey are examined in more detail below. Socio-demographic factors
The socio-demographic factors of age, gender, marital status, education levels and income have consistently been identified as having an association with levels of depression21,22 and psychiatric disorders23. A study on minor psychiatric morbidity across the UK has found that women have a significantly higher GHQ12 score, and thus poorer mental health, than men11. In Northern Ireland, having housing worries is a predictor of increased risk of anxiety and depression24 and, in Australia, research suggests a link between housing affordability, tenure type and mental health25,26. Being a single parent is associated with increased risk of poor mental health27,28. Another socio-demographic factor linked with increased levels of common mental illness is the actual29 and perceived30 level of neighbourhood crime. Occupational class and household income are both positively associated with mental health31–33. Mental disorders occur more frequently in deprived urban areas34 and in a disadvantaged area of Berlin psychological stress was associated with a younger age, being female and living alone35. In Sweden, living alone and economic insecurity both showed strong association with anxiety and depression36. Deprivation is associated with a higher prevalence of depression and anxiety among people with multi-morbidity in Scotland37. The effect of unemployment on mental health has been extensively examined both in terms of the immediate impact38,39 and the longer-term mental health scarring effects of multiple exposure to unemployment during the life course40. Among those in work, several psychosocial factors within the work environment have been shown to impact on well-being and psychological distress41,42. Within the rural population of the UK, the farming community exhibit higher GHQ12 scores, and thus poorer mental health, than the non-farming community43. However, the general rural population have a lower risk of depression compared to their urban counterparts44. Mental health disorders such as depression are higher among informal caregivers than the general adult population but the degree of any association varies with both the number of caregiver burdens and the behavioural or health problems among the care recipients45–48.

16
Lifestyle factors and health behaviours
People with mental health problems are much more likely to develop poor physical health when compared to the general population49. Mental disorders such as depression have been inversely associated with physical exercise50–53 and the causal link is considered bi-directional54,55. Recent evidence suggests that unhealthy diets are risk factors for some mental disorders, particularly depression and dementia56,57. In particular, fruit and vegetable intake has been shown to have a strong inverse association with mood and anxiety disorders58. Frequent family meals have been shown to have a positive impact on mental health, particularly among children and adolescents59–61. Most of these studies have only considered the mental wellbeing of children, whereas this report examines associations between family meals and mental wellbeing in adults. Alcohol use disorders are recognised and classified as mental disorders62. Excessive alcohol consumption is associated with an increased prevalence of depression63,64 and psychological distress65. The literature suggests it is the highest levels of alcohol consumption that are associated with poor results across various measures, including mental wellbeing66. A meta-analysis of research looking at the association between smoking and depression noted a two-fold increased risk of depression among smokers relative to those who have never smoked or formerly smoked 67.
Health conditions
Some mental health problems such as depression, bipolar disorder and anxiety are associated with obesity68 although the direction of causality is uncertain. In addition, gender and age each alter the association between obesity and mental health problems with overweight men having better mental health69 and young women the reverse.70,71 In addition, it is likely that the association between mental health and obesity (as measured by the Body Mass Index) may vary by type of mental health problem72. Social involvement with community groups and resources has been shown to support mental well-being among people with long-term conditions73. A retrospective study has shown that self-reported general health is a significant predictor of clinical outcomes including cancer, coronary heart disease and psychiatric hospitalisation among Scottish adults74. However, the same study found self-reported mental health was a predictor only of psychiatric hospitalisations. Long-standing illnesses, disability and adverse life events are associated with increased anxiety and depression in the Northern Ireland population24.

Chapter 2 Methodology

18
2. Methodology
Data for the two-year 2012/2013 period has been used for all descriptive and regression analyses in this report. The increased sample size in using the 2012/2013 data compared to single year datasets allows for more robust analyses of results to be presented. 2.1 Descriptive analysis Chapters 4 and 5 include results for the WEMWBS and GHQ indicators by various characteristics. For each factor, the mean WEMWBS score is reported alongside the proportion of adults scoring four or higher on GHQ12 (indicating the presence of a possible psychiatric disorder). Data in these chapters are generally presented for all adults. Where there are significant differences by sex, these are shown in the results. 2.1.1 Age-standardisation For each topic in the descriptive results sections, data have been age-standardised, unless otherwise stated. This ensures that comparisons between population subgroups are made on a like-for-like basis. The socio-economic, behaviour and health condition characteristics described in the results sections each have a distinct age distribution. For example, the group of people who meet the physical activity guideline have a younger age profile than those who are not physically active. Age-standardisation enables these population subgroups to be compared, after adjusting for the effects of different age profiles. This ensures that any differences detected in mental health and wellbeing are not simply due to differences by age. In some cases, it was not appropriate to age-standardise results, for example when population sub-groups in some age bands were too small. 2.2 Logistic regression
The literature review has identified a range of socio-demographic, behavioural and health state factors associated with poor mental health and wellbeing. To explore these factors, multivariate logistic regression models were run for binary versions of each outcome measure using a reduced set of the most significant factors for each measure, as described below. The literature suggests gender specific associations with mental health for many of the factors, so the regression models were run separately for men and women. In addition, multivariate logistic regression models were also created with the outcome or dependent variable being each of the components that make up WEMWBS and GHQ12. Due to time constraints, the same reduced sets of factors described above were used in models for the component questions under each measure. Although this is a limitation of the analysis, this has identified some
19
components with results significantly different to the other components that make up each mental health measure, or which show considerable difference by gender. 2.2.1 Selection of most significant factors This section describes how the significance of factors associated with measures of mental health and wellbeing, as identified in the literature review, was tested to derive reduced sets of significant variables to be included in final multivariate logistic regression models. The methodology of variable selection used for this report is similar to that used in previous Scottish Health Survey reports.75 Forward selection successively adds variables that are significantly associated with the outcome measure at the 5%/95% level. Under backward selection, the least significant independent variables are removed until the remaining variables are statistically significant. A combination of forwards and backwards selection methods was used to produce a set of significant variables for the binary WEMWBS and GHQ measures, with variations in variables selected for each measure. A potential problem with such automatic methods is that modelling can become separated from subject matter expertise. In this case, only factors identified in the literature as associated with mental health and wellbeing have been retained prior to the automatic variable selection processes. Furthermore, where bivariate analysis showed that a variable was not significantly associated with the outcome, it was not included in the corresponding regression model. Following the variable selection procedure, collinearity checks were performed on the selected independent variables, and redundant variables then removed from final models. 2.2.2 Binary outcome measures Logistic regression models typically require the dependent or outcome variable to be a binary (two category) measure. In the case of WEMWBS, a score of less than one standard deviation below the mean has been used as a cut-off to define a low score. By this methodology, a respondent with a score of 41 or lower is classified as having a low mental wellbeing score. WEMWBS scores can range from 14 to 70. A binary WEMWBS variable has therefore been coded such that any score between 14 and 41 is set to 1, and all other higher scores are set to zero. A score of four or more on the GHQ12 measure has been selected as the most appropriate for identifying respondents with a possible psychiatric disorder. A binary measure was derived by setting a score of four or more to 1, and a score of 3 or less to zero. 2.2.3 Interpretation Multivariate logistic regression estimates the independent effect of factors, while adjusting for other factors simultaneously, on the binary outcome derived from each

20
measure of mental health and wellbeing. The value of multivariate analyses like these is being able to disentangle confounding effects, for example being able to test whether the low levels of mental wellbeing among a particular subgroup (such as carers) is explained by other demographic factors (such as the corresponding age profile). Multivariate regression models were run on the reduced set of the most significant variables, for each binary mental health measure, on all adults of 16 years and over and then run separately for men and women. The odds ratios of having a low WEMWBS score, or scoring four or more on GHQ12, compared to a reference group for each variable are shown in Tables 6A and 6B. In these analyses, the odds of a reference group (shown in the table with a value of 1) are compared with that of the other categories for each of the individual factors. In Table 6A, for example, an odds ratio greater than one indicates that the category in question had higher odds of scoring 1 on the dependent variable, in this case a low WEMWBS score. An odds ratio less than 1 means lower odds of having a low WEMWBS score, compared to the reference group. Odds ratios whose confidence limits span the value 1 are not significantly different to the reference category. By simultaneously controlling for a number of factors, the independent effect each factor has on the variable of interest can be established. Multivariate logistic regression models on each of the component questions that make up WEMWBS and GHQ12 were also run, again separately by sex. The component questions for GHQ12 have previously been mapped to binary variables, allowing the same interpretation as described above to be used to test for association with independent factors. However, the component questions for the WEMWBS scale retain the five point scale (varying from 1=’none of the time’ through to 5=’all of the time’), so ordinal logistic regression has been carried out with each component question as the dependent variable. The same independent variables used for the regression models on the aggregate measures were applied to separate models by sex. It is important to note that the odds ratios shown in ordinal logistic regression models in this report are interpreted differently than binary logistic regression. Ordinal logistic odds ratios are interpreted as the association between the independent variable and being in a lower level of the dependent variable. In the case of the WEMWBS components, an odds ratio greater than one indicates that the category in question has higher odds of scoring a lower score on the component question than the reference category, whereas an odds ratio less than one means they had lower odds of scoring lower on the component question. 2.2.4 Missing data
The way missing data is handled can have a profound effect on the results of regression analyses. Given the number of variables included, it was important that records which may include missing data for any one of the variables were still included in the analysis. In line with previous Scottish Health Survey reports, variables with a small number of missing values have values imputed to the category containing the largest number of

21
cases. For variables with a large number of missing values, a separate missing value category was created and included in the analysis.76 Alternative imputation methods were considered to be too complex to be implemented, given the generally low volume of missing data for most variables.
Chapter 3 WEMWBS and GHQ12
23
3. WEMWBS and GHQ12
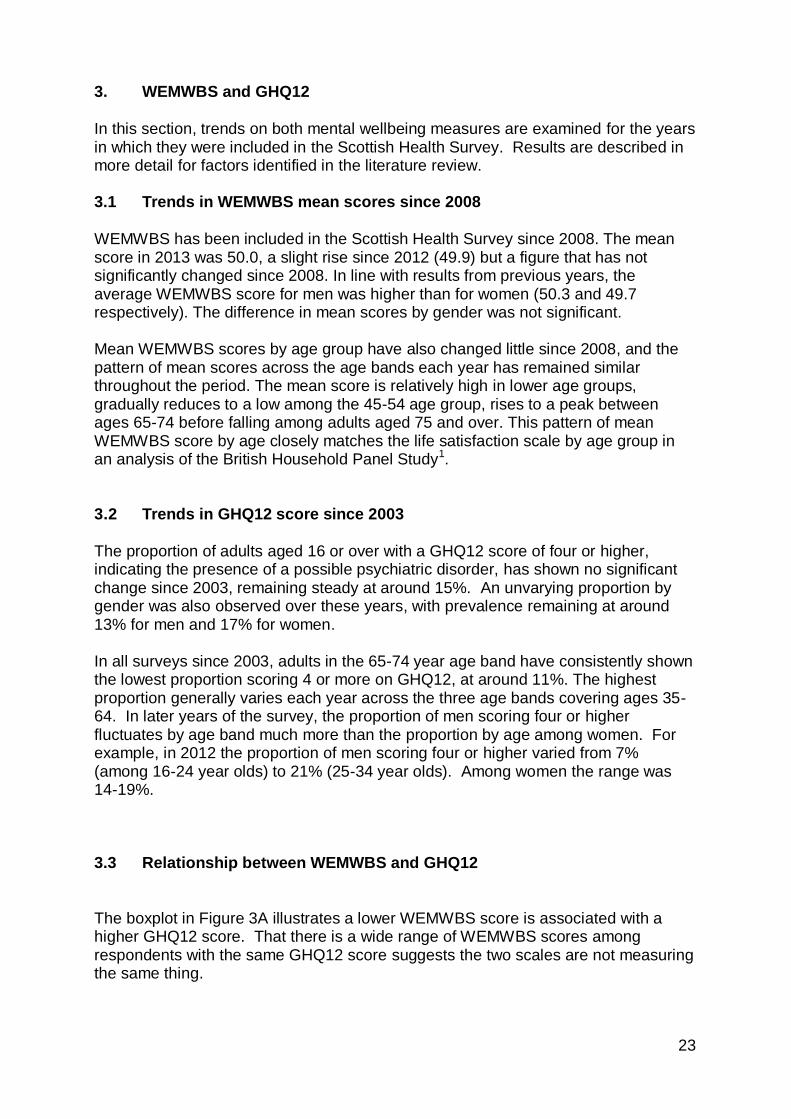
In this section, trends on both mental wellbeing measures are examined for the years in which they were included in the Scottish Health Survey. Results are described in more detail for factors identified in the literature review. 3.1 Trends in WEMWBS mean scores since 2008
WEMWBS has been included in the Scottish Health Survey since 2008. The mean score in 2013 was 50.0, a slight rise since 2012 (49.9) but a figure that has not significantly changed since 2008. In line with results from previous years, the average WEMWBS score for men was higher than for women (50.3 and 49.7 respectively). The difference in mean scores by gender was not significant. Mean WEMWBS scores by age group have also changed little since 2008, and the pattern of mean scores across the age bands each year has remained similar throughout the period. The mean score is relatively high in lower age groups, gradually reduces to a low among the 45-54 age group, rises to a peak between ages 65-74 before falling among adults aged 75 and over. This pattern of mean WEMWBS score by age closely matches the life satisfaction scale by age group in an analysis of the British Household Panel Study1. 3.2 Trends in GHQ12 score since 2003 The proportion of adults aged 16 or over with a GHQ12 score of four or higher, indicating the presence of a possible psychiatric disorder, has shown no significant change since 2003, remaining steady at around 15%. An unvarying proportion by gender was also observed over these years, with prevalence remaining at around 13% for men and 17% for women. In all surveys since 2003, adults in the 65-74 year age band have consistently shown the lowest proportion scoring 4 or more on GHQ12, at around 11%. The highest proportion generally varies each year across the three age bands covering ages 35-64. In later years of the survey, the proportion of men scoring four or higher fluctuates by age band much more than the proportion by age among women. For example, in 2012 the proportion of men scoring four or higher varied from 7% (among 16-24 year olds) to 21% (25-34 year olds). Among women the range was 14-19%. 3.3 Relationship between WEMWBS and GHQ12
The boxplot in Figure 3A illustrates a lower WEMWBS score is associated with a higher GHQ12 score. That there is a wide range of WEMWBS scores among respondents with the same GHQ12 score suggests the two scales are not measuring the same thing.

24
In Figure 3A, each of the twelve vertical boxplot diagrams show (from lowest to highest on the vertical WEMWBS axis):
the lowest WEMWBS score for anyone in that group (i.e. with the corresponding GHQ12 score shown)
the lower quartile: the WEMWBS score below which are 25% of adults in each group (i.e. with the corresponding GHQ12 score shown)
the median: the WEMWBS score below which are 50% of adults in each group (i.e. with the corresponding GHQ12 score shown)
the upper quartile: the WEMWBS score below which are 75% of adults in each group (i.e. with the corresponding GHQ12 score shown)
the highest WEMWBS score for anyone in that group (i.e. with the corresponding GHQ12 score shown)
The aggregate scores for GHQ12 and WEMWBS show a moderate negative correlation (Pearson r=0.51). The median WEMWBS score declines as GHQ12 score increases, most rapidly nearest the two extremes on the GHQ12 scale. The ‘middle 50%’ (i.e. between the lower and upper quartiles) with each GHQ12 score follow a similar pattern. However, there remains a relatively wide range of WEMWBS scores across most GHQ12 scores, including some clear outliers reporting the maximum or minimum possible WEMWBS score.
Figure 3A Relationship between WEMWBS and GHQ12 scores, 2012/2013
Each of the 14 component questions in the WEMWBS scale are scored on a five point Likert scale ranging from 1 (‘none of the time’) to 5 (‘all of the time’). As each of the items relate to positive facets (feeling optimistic, confident, etc.), higher scores are indicative of positive mental wellbeing. All of these items, and the aggregate WEMWBS score, show statistically significant higher mean scores among those who
10
20
30
40
50
60
70
-1 0 1 2 3 4 5 6 7 8 9 10 11 12
WE
MW
BS
sc
ore
GHQ12 score
25
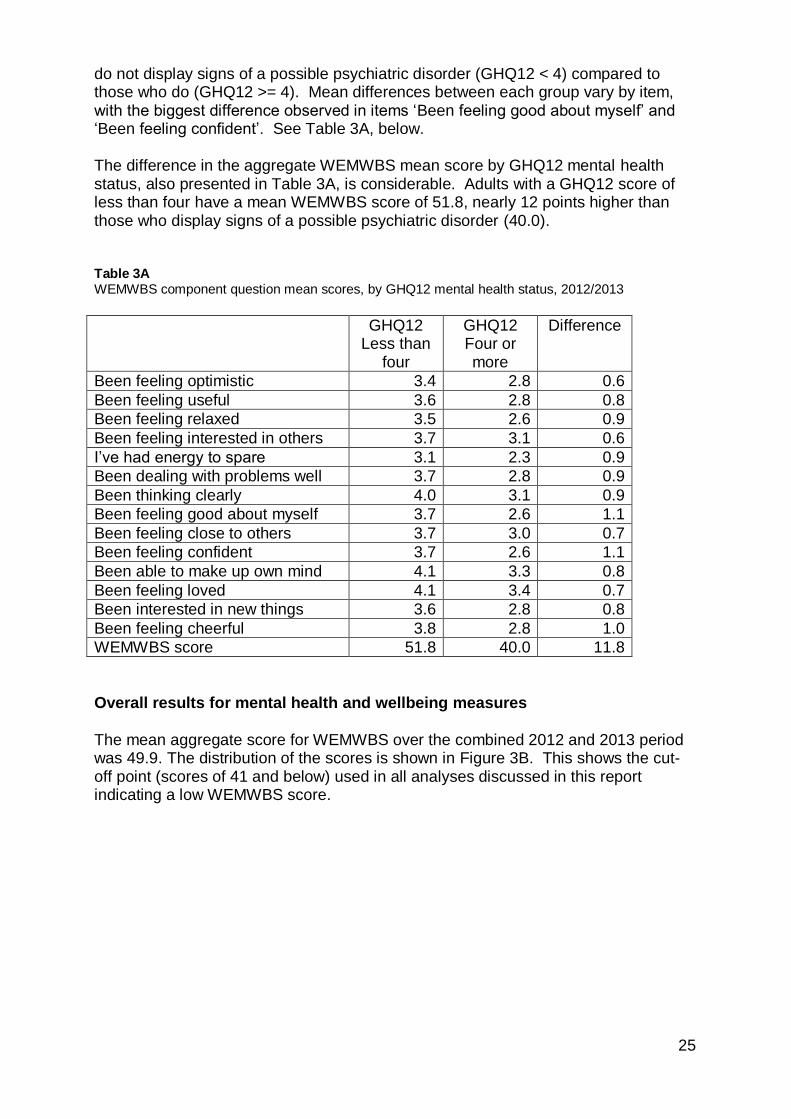
do not display signs of a possible psychiatric disorder (GHQ12 < 4) compared to those who do (GHQ12 >= 4). Mean differences between each group vary by item, with the biggest difference observed in items ‘Been feeling good about myself’ and ‘Been feeling confident’. See Table 3A, below. The difference in the aggregate WEMWBS mean score by GHQ12 mental health status, also presented in Table 3A, is considerable. Adults with a GHQ12 score of less than four have a mean WEMWBS score of 51.8, nearly 12 points higher than those who display signs of a possible psychiatric disorder (40.0). Table 3A WEMWBS component question mean scores, by GHQ12 mental health status, 2012/2013
GHQ12 Less than
four
GHQ12 Four or more
Difference
Been feeling optimistic 3.4 2.8 0.6
Been feeling useful 3.6 2.8 0.8
Been feeling relaxed 3.5 2.6 0.9
Been feeling interested in others 3.7 3.1 0.6
I’ve had energy to spare 3.1 2.3 0.9
Been dealing with problems well 3.7 2.8 0.9
Been thinking clearly 4.0 3.1 0.9
Been feeling good about myself 3.7 2.6 1.1
Been feeling close to others 3.7 3.0 0.7
Been feeling confident 3.7 2.6 1.1
Been able to make up own mind 4.1 3.3 0.8
Been feeling loved 4.1 3.4 0.7
Been interested in new things 3.6 2.8 0.8
Been feeling cheerful 3.8 2.8 1.0
WEMWBS score 51.8 40.0 11.8
Overall results for mental health and wellbeing measures The mean aggregate score for WEMWBS over the combined 2012 and 2013 period was 49.9. The distribution of the scores is shown in Figure 3B. This shows the cut-off point (scores of 41 and below) used in all analyses discussed in this report indicating a low WEMWBS score.

26
Figure 3B Distribution of WEMWBS scores, 2012/2013
The distribution of scores on the GHQ12 is highly skewed. More than 60% of respondents score zero. In 2012/2013, 15% of respondents aged 16 or over scored four or higher on GHQ12, indicating the presence of a possible psychiatric disorder.
0
100
200
300
400
500
600
14 21 28 35 42 49 56 63 70
Fre
qu
en
cy
WEMWBS score
'Low' WEMWBS scores to the left of the dotted line

Chapter 4 Demographic factors

28
4. Demographic factors
4.1 Factors associated with low mental wellbeing
This section includes analysis of WEMWBS and GHQ12 scores for demographic factors identified in the literature review. Factors which are associated with below average WEMWBS scores or GHQ12 scores of four or higher are shown in Table 4A. These variables were selected for inclusion in the regression analyses in this chapter. Table 4A Socio-demographic factors, 2012/2013
WEMWBS GHQ12
Age Y Y
Marital status Y Y
Area deprivation Y
Economic activity Y Y
Parental socio-economic classification Y
Equivalised household income Y Y
Unpaid caring Y Y
4.1.1 Age and Gender
There are minor differences between men and women in relation to both WEMWBS and GHQ12 scores. In 2012/2013, the mean WEMWBS score for men was 50.3, while for women it was 49.6. Although data from two years of survey data cannot be used to describe changes within age cohorts, the pattern of WEMWBS scores by age group closely matches the life satisfaction scale in an analysis of the British Household Panel Study1. Mean scores are high in the youngest adult age groups (50.1 and 50.2 for ages 16-24 and 25-34 respectively), then drop among adults aged 45-54 (48.9), rise to a peak between ages 65 and 74 (51.1), then drop off again among the oldest group (ages 75+, mean score 49.5). Mean WEMWBS scores were higher among men than women across all age groups.
Figure 4A

29
Figure 4A WEMWBS mean scores, by age group and sex, 2012/2013
Fewer men than women show signs of a possible psychiatric disorder, with 13% of men having GHQ12 scores of four or higher, compared to 18% of women. These findings are consistent with previous SHeS results examining the association between gender and mental health indicators. A lower proportion of men across all groups displayed signs of a possible psychiatric disorder on the GHQ12 measure.
Figure 4B
Figure 4B Proportion of adults with GHQ12 scores of four or higher, by age group and sex, 2012/2013

30
In adults aged 16-24, WEMWBS scores are significantly higher among men than women (mean scores of 51.5 and 48.8 respectively). Men in this age group were also less likely to show signs of the presence of a possible psychiatric disorder, based on General Health Questionnaire responses. After controlling for the effect of other demographic and health-related factors, age remains a significant predictor of mental health in both the WEMWBS and GHQ12 logistic regression models. Men in the older age groups (all groups from ages 55+) are significantly less likely to show signs of a possible psychiatric disorder compared to 16-24 year olds. For example, comparing those aged 75+ with the 16-24 group, the odds ratio for signs of a possible psychiatric disorder is 0.36 (CL 0.14, 0.92). Results by age for women are not significant after controlling for other factors.
Table 6B
The same pattern is not evident for below average mental wellbeing (although again results for women are not statistically significant). Men in the age groups from 55+ are not significantly more likely to have a low WEMWBS score compared to adults aged 16-24. However, men aged 25-54 are shown to be more likely to have lower mental wellbeing compared to the 16-24 group. For example, comparing men aged 45-54 with those who are 16-24, the odds ratio for low mental wellbeing is 2.13 (CL 1.20, 3.76).
Table 6A
4.1.2 Marital status
Scores on the WEMWBS scale are lowest among adults whose relationship status is ‘separated’, with a mean of 45.8. People who are married (51.2) or living as married (50.4) have the highest mean scores. Scores within each marital status category do not vary significantly by gender.
Figure 4C Figure 4C WEMWBS mean scores, by marital status (not age-standardised), 2012/2013

31
A greater proportion of singles (20%) and separated couples (28%) exhibit signs of the presence of a possible psychiatric disorder, compared to people who are married (12%) or living as married (15%).
Figure 4D
Figure 4D Proportion of adults with GHQ12 scores of four or higher, by marital status (not age-standardised), 2012/2013
Marital status is a significant factor in the logistic regression model designed to predict below average WEMWBS scores after controlling for other factors. Women who are separated, divorced, widowed or single are all more likely to have a low WEMWBS score, compared to women whose marital status is married/civil partnership (odds ratios of 2.19, 1.94, 1.71 and 1.85 respectively). For men, results indicating low mental wellbeing are strongest among the separated and widowed groups (odds ratios 3.62 and 2.21 respectively) but also marginally significant among singles (odds ratio 1.48; CL 1.01, 2.17) compared to the reference group.
Table 6A Adults who are not married are significantly less likely to respond positively to the WEMWBS statement, ‘been feeling love’. Results are significant for women in all non-married marital status categories, including ‘living as married’, and for men in all categories except ‘living as married’
Table 4C

32
Table 4C WEMWBS statement ‘Been feeling love’: results of logistic regression analysis indicating a low score, by marital status and sex, 2012/2013
Odds ratio
95% confidence limits
Men Living as married vs Married/civil partnership 1.00 0.79 1.26
Single vs Married/civil partnership 3.63 2.92 4.51
Separated vs Married/civil partnership 5.45 3.32 8.95
Divorced/dissolved civil partnership vs Married/civil partnership 3.68 2.68 5.04
Widowed/surviving civil partner vs Married/civil partnership 2.28 1.59 3.25
Odds ratio
95% confidence limits
Women Living as married vs Married/civil partnership 1.36 1.11 1.66
Single vs Married/civil partnership 2.86 2.33 3.51
Separated vs Married/civil partnership 3.21 2.15 4.80
Divorced/dissolved civil partnership vs Married/civil partnership 2.49 1.99 3.12
Widowed/surviving civil partner vs Married/civil partnership 1.99 1.60 2.48
Single (OR 1.73; CL 1.27, 2.38), separated (OR 1.81; CL 1.07, 3.06), widowed (OR 1.94, CL 1.39, 2.71) or divorced (OR 1.57; CL 1.15, 2.13) women are also more likely than those who are married or in a civil partnership to show signs of the presence of a psychiatric disorder, based on responses to the GHQ12 questionnaire, after controlling for other factors. The equivalent results for men are only statistically significant among the group who are separated (OR 2.15; CL 1.14, 4.02).
Table 6B
Men who are living as married (OR 0.53; CL 0.32, 0.87) are less likely than married men to say they have been losing self-confidence. The opposite is true among women who are living as married, with women in each of the non-married groups more likely to say they have been losing self-confidence.
Table 4D

33
Table 4D GHQ component ‘Been losing confidence in self’: results of logistic regression analysis indicating a low score, by marital status and sex, 2012/2013
Odds ratio
95% confidence limits
Men Living as married vs Married/civil partnership 0.53 0.32 0.87
Single vs Married/civil partnership 1.06 0.74 1.54
Separated vs Married/civil partnership 1.83 0.93 3.59
Divorced/dissolved civil partnership vs Married/civil partnership 1.00 0.56 1.81
Widowed/surviving civil partner vs Married/civil partnership 1.12 0.63 1.99
Odds ratio
95% confidence limits
Women Living as married vs Married/civil partnership 1.47 1.06 2.04
Single vs Married/civil partnership 1.47 1.07 2.01
Separated vs Married/civil partnership 1.91 1.12 3.25
Divorced/dissolved civil partnership vs Married/civil partnership 1.61 1.18 2.20
Widowed/surviving civil partner vs Married/civil partnership 1.92 1.38 2.66
4.1.3 Scottish Index of Multiple Deprivation (SIMD)
In the 20% least deprived areas in Scotland, the mean WEMWBS score among adults (16+) is 51.8. In the most deprived areas, the mean score is 47.2. Scores decline approximately linearly with increasing deprivation, but with a sharper decline between the second (49.3) and most deprived (47.2) quintiles.
Figure 4E

34
Figure 4E WEMWBS mean scores, by SIMD quintile, 2012/2013
A similar relationship is observed between increasing deprivation and the proportion of GHQ12 scores of four or higher, indicating the presence of a possible psychiatric disorder. The proportion of adults who score four or higher increases with area deprivation. As with WEMWBS, the increase is sharpest between the second (16%) and most deprived (23%) quintiles. The proportion of adults ranges from 12% of those in the least deprived areas to 23% (20% of men; 25% of women) in the most deprived areas.
Figure 4F Figure 4F Proportion of adults with GHQ12 scores of four or higher, by SIMD quintile, 2012/2013
However, once all other factors, such as economic activity, are taken into account, area deprivation is not a significant predictor for GHQ12 scores of four or higher. After controlling for all other factors, the odds of those adults in the 15% most deprived areas having a low mental wellbeing score are not significantly lower than those in other areas.
Table 6A

35
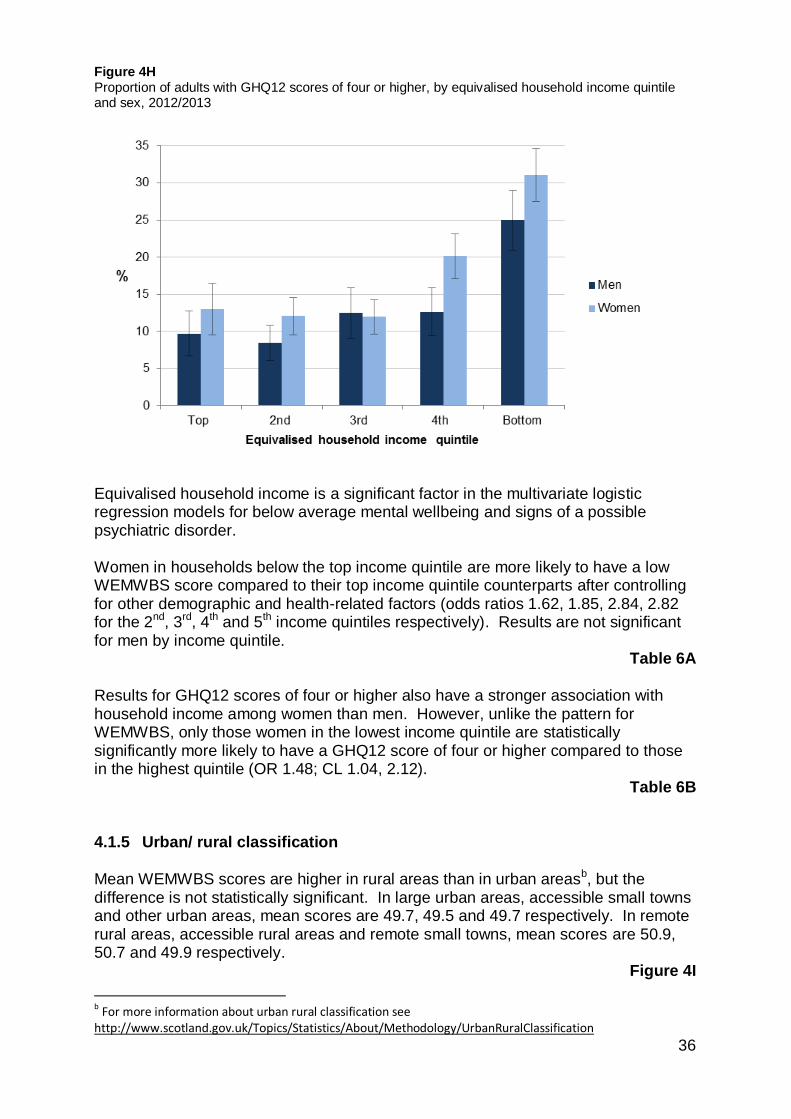
Many of the health-related factors for which the results indicate an association with poor mental wellbeing – for example, smoking and alcohol dependence – are socio-demographically patterned whereby prevalence is generally higher in the most deprived areas. Therefore, although area deprivation is shown not to be a significant predictor after controlling for other factors, prevalence of some of the most significant risk factors for low mental wellbeing remains highest in deprived areas. 4.1.4 Equivalised household income A reference person (or their partner) for each household involved in SHeS was asked to state their own (and their partner’s) aggregate gross income, and were then asked to estimate the total household income including that of any other persons in the household. Equivalised income adjusts to take account of the number of persons in the household. Households are then ranked by equivalised income, allowing quintiles to be defined. All individuals in each household were allocated to the equivalised household income quintile to which their household had been allocated. WEMWBS scores by equivalised household income quintiles follow a similar pattern to the distribution by deprivation quintile. Among those in the highest income quintile, the mean WEMWBS score in 2012/2013 was 51.7, while in the lowest income quintile the mean score was 46.3. Scores did not vary significantly by sex.
Figure 4G Figure 4G WEMWBS mean scores, by equivalised household income quintile, 2012/2013
In the top three income quintiles, there is little difference in the proportion of men and women scoring four or more on the GHQ12 scale (8%-12%). However, the proportion increases sharply in the two lowest income quintiles, with 25% of men and 31% of women scoring at least four on the GHQ12 scale in the lowest quintile.
Figure 4H
36
Figure 4H Proportion of adults with GHQ12 scores of four or higher, by equivalised household income quintile and sex, 2012/2013
Equivalised household income is a significant factor in the multivariate logistic regression models for below average mental wellbeing and signs of a possible psychiatric disorder. Women in households below the top income quintile are more likely to have a low WEMWBS score compared to their top income quintile counterparts after controlling for other demographic and health-related factors (odds ratios 1.62, 1.85, 2.84, 2.82 for the 2nd, 3rd, 4th and 5th income quintiles respectively). Results are not significant for men by income quintile.
Table 6A
Results for GHQ12 scores of four or higher also have a stronger association with household income among women than men. However, unlike the pattern for WEMWBS, only those women in the lowest income quintile are statistically significantly more likely to have a GHQ12 score of four or higher compared to those in the highest quintile (OR 1.48; CL 1.04, 2.12).
Table 6B 4.1.5 Urban/ rural classification
Mean WEMWBS scores are higher in rural areas than in urban areasb, but the difference is not statistically significant. In large urban areas, accessible small towns and other urban areas, mean scores are 49.7, 49.5 and 49.7 respectively. In remote rural areas, accessible rural areas and remote small towns, mean scores are 50.9, 50.7 and 49.9 respectively.
Figure 4I
b For more information about urban rural classification see
http://www.scotland.gov.uk/Topics/Statistics/About/Methodology/UrbanRuralClassification

37
Figure 4I WEMWBS mean scores, by urban-rural classification, 2012/2013
However, there is more variation by urban-rural classification in the proportion of adults scoring four or higher in the GHQ12 measure, indicating the presence of a possible psychiatric disorder, including 17% of those in large urban areas compared to 10% of those in remote rural areas.
Figure 4J
Although these figures are standardised by age to ensure comparability, urban-rural classification does not remain a significant effect once other factors are taken into account in regression analyses. Figure 4J Proportion of adults with GHQ12 scores of four or higher, by urban-rural classification, 2012/2013

38
4.1.6 Economic activity Adults who are permanently unable to work score considerably lower (39.6) on the WEMWBS scale compared to those who are in employment or government training (51.1), full-time education (50.6) or are retired (50.6).
Figure 4K
Due to the considerable differences in the age distribution within each group, for example with very few individuals retired below the age of 40, it is not possible to robustly age-standardise these results, so differences observed in mean scores could in part reflect different age profiles. However, economic activity does remain a statistically significant factor after controlling for other independent variables. Figure 4K WEMWBS mean scores, by economic activity category (not age-standardised), 2012/2013
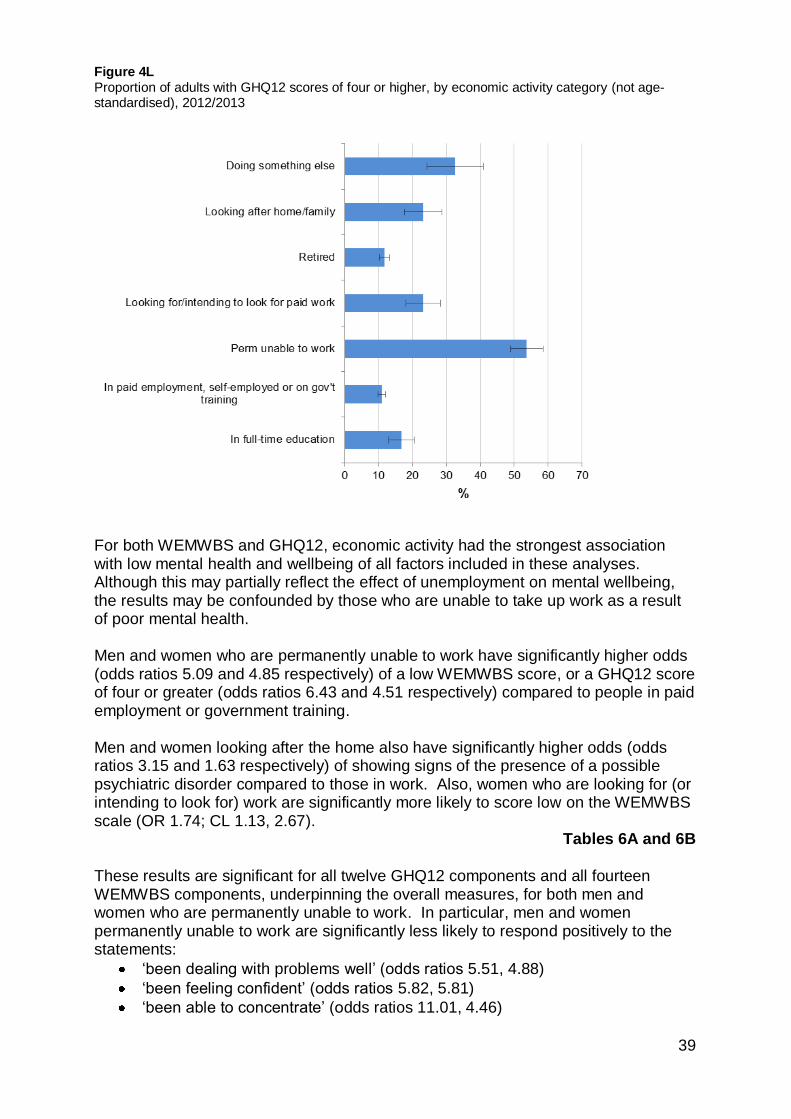
More than half (54%) of adults who are permanently unable to work or looking for work exhibit signs of a possible psychiatric disorder, considerably higher than the proportion among those who are in work (11%), retired (12%) or in full-time education (17%).
Figure 4L
39
Figure 4L Proportion of adults with GHQ12 scores of four or higher, by economic activity category (not age-standardised), 2012/2013
For both WEMWBS and GHQ12, economic activity had the strongest association with low mental health and wellbeing of all factors included in these analyses. Although this may partially reflect the effect of unemployment on mental wellbeing, the results may be confounded by those who are unable to take up work as a result of poor mental health. Men and women who are permanently unable to work have significantly higher odds (odds ratios 5.09 and 4.85 respectively) of a low WEMWBS score, or a GHQ12 score of four or greater (odds ratios 6.43 and 4.51 respectively) compared to people in paid employment or government training. Men and women looking after the home also have significantly higher odds (odds ratios 3.15 and 1.63 respectively) of showing signs of the presence of a possible psychiatric disorder compared to those in work. Also, women who are looking for (or intending to look for) work are significantly more likely to score low on the WEMWBS scale (OR 1.74; CL 1.13, 2.67).
Tables 6A and 6B
These results are significant for all twelve GHQ12 components and all fourteen WEMWBS components, underpinning the overall measures, for both men and women who are permanently unable to work. In particular, men and women permanently unable to work are significantly less likely to respond positively to the statements:
‘been dealing with problems well’ (odds ratios 5.51, 4.88)
‘been feeling confident’ (odds ratios 5.82, 5.81)
‘been able to concentrate’ (odds ratios 11.01, 4.46)

40
‘felt playing a useful part in things’ (odds ratios 8.80, 5.59)
‘felt capable of making decisions’ (odds ratios 6.59, 5.67)
‘been able to face problems’ (odds ratios 7.31, 5.22)
‘been losing confidence in self’ (odds ratios 7.23, 4.78)
‘been thinking of self as worthless’ (odds ratios 9.91, 7.17). 4.1.7 Parental socio-economic classification
Data on socio-economic classification is gathered in the Scottish Health Survey using the National Statistics Socio-Economic Classification (NS-SEC). It is based on occupation, accepted internationally and used widely in the research community. Analysis is possible using the survey respondent’s own classification, their (highest) parental classification and the classification for a reference person in the household.
Mean WEMWBS scores are lower among adults whose highest parental socio-economic classification was semi-routine (49.0) or lower supervisory (49.0), compared to managerial and professional (50.9), intermediate (50.9) or small employers / own account (50.6) classifications.
Figure 4M Similarly, relatively high proportions in these groups (18% and 17% respectively) exhibit signs of the presence of a possible psychiatric disorder, compared to those in other groups (15%, 12% and 13% respectively). Figure 4M WEMWBS mean scores, by parental socio-economic classification, 2012/2013
After taking account of other factors, men whose highest parental socio-economic classification was semi-routine are significantly more likely to have a GHQ12 score of four or higher, compared to those in managerial and professional positions (OR 0.66; CL 0.47, 0.92). Respondents’ own socio-economic classification is not a significant predictor for either mental health outcome after controlling for other factors including parental classification and other related demographic characteristics which were more strongly correlated with each measure.
Table 6B

41
4.1.8 Household tenure The housing tenure question in the Scottish Health Survey asks if the respondent is currently buying their home with a mortgage/loan, owns it outright, rents it or lives rent free. Due to the different age distribution within tenure grouping, it is not possible to reliably age-standardise these results in the manner used for most other topics in this report, so it is possible that differences observed could in part reflect different age profiles by household tenure. Renters have a mean WEMWBS score of 47.8, considerably lower than among those who are buying with a mortgage or loan (50.8) or own their home outright (51.2). A higher proportion of renters (23%) have a GHQ12 score of four or higher, compared to those buying with a mortgage (13%) or owning their home outright (11%). However, controlling for the impacts of all of the other factors discussed in this report, including related demographic factors, home ownership is not a significant predictor for low mental wellbeing scores or the presence of a possible psychiatric disorder. 4.1.9 Household type Mean WEMWBS scores fluctuate considerably by household type, from a high of 51.3 among ‘2 adult households (no children), one or both of whom are aged 60+’, to 46.4 for single adult (aged 16-59) households with no children. The mean for this latter group is considerably lower than all other household types (ranging from 48.9 to 51.3). Results for each household type do not vary significantly by gender.
Figure 4N
Figure 4N WEMWBS mean scores, by household type (not age-standardised), 2012/2013

42
In single adult (aged 16-59) households, 27% display signs of the presence of a possible psychiatric disorder, while, for adults in all other household types, the proportion varied between 11% and 17%.
Figure 4O
Figure 4O Proportion of adults with GHQ12 scores of four or higher, by household type (not age-standardised), 2012/2013
Despite these results, household type is not a significant predictor of low mental wellbeing or the presence of a possible psychiatric disorder after controlling for other explanatory factors, including strongly related demographic factors such as marital status and whether household members regularly eat meals together. 4.1.10 Highest educational qualification
Mean WEMWBS scores increase with increasing highest educational qualification, from 46.4 among respondents with no formal educational qualification, up to 51.9 among those with a degree or higher. Similarly, the proportion of adults exhibiting signs of a possible psychiatric disorder steadily decreases with increasing educational qualifications, from 24% with no formal education to below 12% with a degree or higher. Although highest educational qualification is strongly correlated with below average mental wellbeing scores, it is also associated with other explanatory factors which have a stronger association with mental wellbeing. Therefore, following tests for variable collinearity, this was not included in final logistic regression models.

43
4.1.11 Unpaid care Background Participants are asked if they look after or give any regular help or support to family members, friends, neighbours or others because of a long-term physical condition, mental ill-health or disability; or problems related to old age. This does not include caring activity done as part of paid employment. Those who do provide unpaid care are then asked how many hours per week they typically provide care. Results in this section are disaggregated by hours of care, but do not include further information gathered in the survey on support to carers, impact on employment or length of time providing care. In 2012/2013, 17% of adults (15% of men; 19% of women) reported providing unpaid care. Most carers provide less than 35 hours of care per week (30% provide up to 4 hours of care; 45% between 3 and 34 hours; 18% for 35 hours or more and 7% varied levels of care). Caring prevalence is higher in the middle-upper age groups, with 22% of men and 32% of women aged 55-64; 19% of men and 27% of women aged 45-54; and 19% of men and women aged 65-74 providing unpaid care . This compares to 9% of men and 11% of women aged 16-34, and 12% of men and 9% of women aged 75+. Results below are age-standardised to take account of the age profile of unpaid carers. Results Mental wellbeing scores are lower among adults who do provide unpaid care, with lower overall WEMWBS scores as hours of care provided increases. Among carers who provide support for more than 35 hours per week, WEMWBS scores (46.4) are considerably lower than among non-carers (49.9). However, carers who provide a small amount of care, in particular those who provide up to 4 hours per week, show a higher mean WEMWBS score (51.5) than non-carers, indicating a higher level of mental wellbeing. The mean score among adults who provide between 5 and 34 hours of care per week was 50.4.
Figure 4P

44
Figure 4P WEMWBS mean scores, by sex and hours of unpaid care, 2012/2013
Carers who provide more than 35 hours per week (35%) are significantly more likely to exhibit signs of the presence of a possible psychiatric disorder than non-carers (15%), carers who provide 0-4 hours (10%) or carers who provide 5-34 hours (17%) of care per week. The difference in the proportion exhibiting signs of the presence of a possible psychiatric disorder, comparing carers providing up to 4 hours per week compared to non-carers, is also statistically significant.
Figure 4Q
Figure 4Q Proportion of adults with GHQ12 scores of four or higher, by sex and hours of unpaid care, 2012/2013
Unpaid caring is a significant predictor of low mental wellbeing and the presence of possible psychiatric disorders after controlling for other related factors described in this report, with results generally stronger among women. Specifically, women who carry out 35 or more hours of unpaid care are more likely to have a low WEMWBS score compared to those who do not provide any unpaid care (OR 2.43; CL 1.56,

45
3.76). Although the same results are not significant for male carers, in GHQ12, men (OR 2.16; CL 1.29, 3.62) and women (OR 2.76, CL 1.80, 4.25) in an unpaid caring role for more than 35 hours per week have greater odds, compared to non-carers, of having a score of four or higher, indicating the presence of a possible psychiatric disorder. GHQ12 results are also marginally significant among women in a caring role for 5-34 hours per week (OR 1.40; CL 1.01, 1.95).
Tables 6A and 6B Furthermore, women who provide 35 hours or care or more per week are significantly more likely (OR 2.72; CL 1.94, 3.84) to respond negatively when asked if they have ‘been feeling relaxed’. Although results are significant for nine of the fourteen WEMWBS component questions among women, results for ‘feeling relaxed’ stand out as most notably significant. 4.1.12 Perception of local crime The perception of local crime is identified in literature as a factor associated with mental health. Respondents were asked how much they thought local crime had changed in the last two years. This is included as a core survey question in each of the Scottish Government population surveys, including SHeS, to align with the Scottish Crime and Justice Survey. Results suggest adults who perceive that their local crime is now a lot more than it was two years ago have a lower mean WEMWBS score (45.5) - i.e. have lower mental wellbeing - than those who think it about the same (50.2), a little more (49.5) or a little less (49.2). Furthermore, of those who think there is a lot more local crime now compared to two years ago there is a markedly increased proportion (32%) exhibiting the presence of a possible psychiatric disorder compared to those who think it has risen a little more (18%) or is about the same (14%).

Chapter 5 Behaviours and Health conditions

47
5. Behaviours and Health conditions
5.1 Factors associated with low mental wellbeing
This section includes analysis of WEMWBS and GHQ12 scores for factors relating to health behaviours and conditions. Factors which are associated with below average WEMWBS scores or GHQ12 scores of four or greater are shown in Table 5A. These factors were selected for inclusion in the regression analyses presented in this chapter. Table 5A Health-related factors, 2012/2013
WEMWBS GHQ12
Physical activity Y Y
Alcohol use Y Y
Smoking Y Y
Fruit and vegetable consumption Y
COPD (doctor-diagnosed) Y
5.1.1 Physical activity
Background Physical activity has many well documented health benefits, including associations with improved mental wellbeing as explored in the literature review. Amongst other Scottish Government policy initiatives, the National Performance Framework (NPF) includes a national indicator to increase activity levels among adultsc, monitored using SHeS data. Physical activity guidelinesd state that adults should engage in at least 150 minutes of moderate activity a week (alternatively, 75 minutes of vigorous activity spread across the week also meets the recommendations)e.
The Scottish Health Survey asks about four main types of physical activity: home-based activities, walking, sport and exercise and activity at work, covering (for each) information on the time spent being physically active, intensity and the frequency with which the activity was undertaken. For information on how this is translated into a measure of whether or not the physical activity guideline was met, see the 2013 main reportf. Table 5B shows how activity levels have been categorised for this analysis.
c http://www.scotland.gov.uk/About/Performance/scotPerforms/indicator
d Start Active, Stay Active – A report on physical activity for health from the four home countries’ Chief Medical Officers. (web
only). UK Department of Health, July 2011. <https://www.gov.uk/government/publications/start-active-stay-active-a-report-on-
physical-activity-from-the-four-home-countries-chief-medical-officers> e Adults weekly physical activity levels can be divided into four categories: very low activity (under 30 minutes of moderate
exercise or under 15 minutes of vigorous); low activity (30<60 mins moderate/15<37.5 mins vigorous); some activity (60>150
mins moderate/30<75 mins vigorous); and meets recommendations (>150 mins moderate/>75 mins vigorous) per week. See the 2013 SHeS report for more information. f http://www.scotland.gov.uk/Publications/2014/12/9982

48
Table 5B Physical activity guidelines: description of categories
Physical activity category Physical activity per week: description
Meets guideline 150 minutes per week of moderate activity, 75 minutes of vigorous activity, or an equivalent combination of moderate and vigorous activity
Some activity 60-149 minutes of moderate activity, 30-74 minutes of vigorous activity, or an equivalent combination of moderate and vigorous activity
Low activity 30-59 minutes of moderate activity, 15-29 minutes of vigorous activity, or an equivalent combination of moderate and vigorous activity
Very low activity Less than 30 minutes of moderate activity, less than 15 minutes of vigorous activity, or less than an equivalent combination of these
In 2012/2013, 63% of adults (62% in 2012, 64% in 2013) were physically active at the recommended level. The proportion of men meeting the guideline (69%) was significantly greater than the proportion among women (58%). Activity levels are generally higher among the younger age groups, with 77% of those aged 16-24 active at the recommended level, declining steadily to 69% between ages 45 and 54, before tailing off more sharply to just over half (52%) of adults aged 65-74 and a quarter (26%) aged 75+ meeting recommendations. Results Higher WEMWBS scores were associated with those adults who met the recommended physical activity guideline. Age-standardised scores in this group (mean score 51.4) were significantly higher than in all others, while scores in the ‘very low activity’ category (46.0) were significantly lower than in others (48.5 and 49.6 for those in the ‘low’ and ‘some’ activity groups).
Figure 5A Figure 5A WEMWBS mean scores, by physical activity level, 2012/2013

49
Of adults who attain very low levels of physical activity, three in ten (30%) exhibited signs of a possible psychiatric disorder. This figure was significantly greater than the proportion among those who attained higher activity levels, in particular those who met physical activity recommendations, of whom 11% exhibited signs of a possible psychiatric disorder.
Figure 5B
Figure 5B Proportion of adults with GHQ12 scores of four or higher, by physical activity level, 2012/2013
Physical activity levels are also significantly associated with mental wellbeing measures in the logistic regression analyses, indicating that it is a significant predictor of mental wellbeing after controlling for the other independent factors described in these results. In WEMWBS, men (OR 2.20; CL 1.59, 3.04) and women (OR 2.47; CL 1.97, 3.11) attaining very low activity levels are significantly more likely to have a low score compared to those meeting recommended levels. Similarly, in the model for GHQ12 scores of greater than four, men (OR 2.00; CL 1.43, 2.78) and women (OR 1.86; CL 1.50, 2.31) with very low activity levels are more likely to exhibit signs of a possible psychiatric disorder than those meeting recommended levels. While these results support the hypothesis that a lack of physical exercise is associated with poor mental health, as noted in the literature review the effect may be bi-directional.
Tables 6A and 6B
Comparison of the mean scores for each of the components that make up the overall WEMWBS score shows significant differences extend across all fourteen components. Those who meet the recommendations consistently score higher than those who do not, with the difference most noticeable in the component question on ‘energy levels’ (i.e. those meeting the recommendations typically have more ‘energy to spare’). Men and women who meet the guideline are significantly less likely to score negatively for this component compared to those in any of the other activity categories.
Table 5C

50
Table 5C WEMWBS statement ‘I’ve had energy to spare’: results of logistic regression analysis indicating a low score, by physical activity level and sex, 2012/2013
Physical activity level
Odds ratio
95% confidence limits
Men Some activity vs Meets recommendations 1.42 1.11 1.83
Low activity vs Meets recommendations 2.08 1.44 3.01
Very low activity vs Meets recommendations 2.88 2.33 3.55
Physical activity level
Odds ratio
95% confidence limits
Women Some activity vs Meets recommendations 1.51 1.28 1.80
Low activity vs Meets recommendations 1.74 1.35 2.23
Very low activity vs Meets recommendations 2.81 2.37 3.35
5.1.2 Alcohol consumption
Background Sensible drinking guidelines in the UK recommend that women should not regularly drink more than 2-3 units of alcohol, and men should not regularly drink more than 3-4 units, per day. The Scottish Government recommends that everyone should aim to have at least two alcohol free days per week. It is also recommended that, over the course of a week, women and men should not consume more than 14 and 21 units respectively. Three aspects of alcohol consumption are covered by the Scottish Health Survey: weekly consumption, consumption on the heaviest drinking day in the last week, and alcohol use disorder identification, including signs of alcohol dependence. This report focuses on two measures of alcohol consumption: (i) weekly consumption, and (ii) the Alcohol Use Disorders Identification Test (AUDIT)g. For drinking levels derived from unit consumption, respondents have been classified into ‘non-drinkers’, ‘moderate’ and ‘hazardous/harmful’ drinkers, based on self-reported consumption. Full details on the methods used to derive weekly units from the SHeS questionnaire are described in the 2013 report. The term ‘harmful drinking’ is used to describe those who are drinking at a level which is already causing physical, social or psychological harm. People whose drinking is not currently causing clear evidence of harm, but which may cause harm in the future, are described as ‘hazardous’ drinkers. In terms of unitsh, men who consume over 21 and up to 50 units per week and women who consume over 14 and
g For more information on AUDIT see http://whqlibdoc.who.int/hq/2001/who_msd_msb_01.6a.pdf
h See the 2013 SHeS report (alcohol chapter) for more information.

51
up to 35 units are described as ‘hazardous’ drinkers. Those who consume above 50 units (for men) or 35 units (for women) per week are described as drinking at ‘harmful’ levels. In 2012/2013, 16% of adults (12% of men and 19% of women) were non-drinkers, 64% (64% of men, 65% of women) were moderate drinkers, while the remaining 20% (23% of men, 17% of women) drank at hazardous or harmful levels. Around one in five adults aged 16-74 are hazardous/harmful drinkers. Prevalence is highest in the 55-64 (23%) and 45-54 (22%) age groups. Only 8% of adults aged 75+ are hazardous or harmful drinkers. AUDIT was mainly designed to identify high-risk alcohol behaviour, or alcohol dependency, but can also be used to categorise low or medium risk groups. Results here focus on two categories - ‘no dependency on alcohol’ (AUDIT scores 0-19) and ‘possible alcohol dependence’ (AUDIT scores of 20 or higher). Results WEMWBS scores among non-drinkers (47.6) were significantly lower than among drinkers. However, there was no significant difference in WEMWBS scores between moderate (50.3) and hazardous/harmful drinkers (50.6).
Figure 5C
Figure 5C WEMWBS mean scores, by drinking classification and sex, 2012/2013
A significantly higher proportion of non-drinkers (27%) exhibited signs of a possible psychiatric disorder compared to moderate (13%) or hazardous/harmful (13%) drinkers
Figure 5D
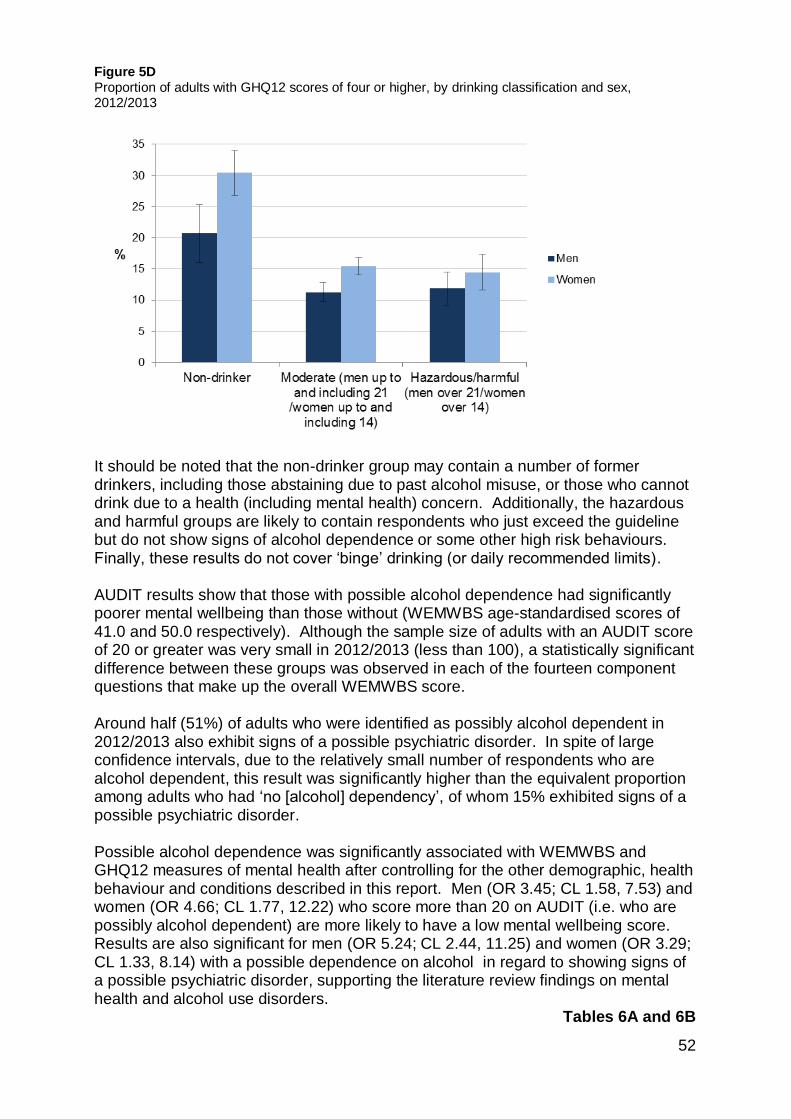
52
Figure 5D Proportion of adults with GHQ12 scores of four or higher, by drinking classification and sex, 2012/2013
It should be noted that the non-drinker group may contain a number of former drinkers, including those abstaining due to past alcohol misuse, or those who cannot drink due to a health (including mental health) concern. Additionally, the hazardous and harmful groups are likely to contain respondents who just exceed the guideline but do not show signs of alcohol dependence or some other high risk behaviours. Finally, these results do not cover ‘binge’ drinking (or daily recommended limits). AUDIT results show that those with possible alcohol dependence had significantly poorer mental wellbeing than those without (WEMWBS age-standardised scores of 41.0 and 50.0 respectively). Although the sample size of adults with an AUDIT score of 20 or greater was very small in 2012/2013 (less than 100), a statistically significant difference between these groups was observed in each of the fourteen component questions that make up the overall WEMWBS score. Around half (51%) of adults who were identified as possibly alcohol dependent in 2012/2013 also exhibit signs of a possible psychiatric disorder. In spite of large confidence intervals, due to the relatively small number of respondents who are alcohol dependent, this result was significantly higher than the equivalent proportion among adults who had ‘no [alcohol] dependency’, of whom 15% exhibited signs of a possible psychiatric disorder. Possible alcohol dependence was significantly associated with WEMWBS and GHQ12 measures of mental health after controlling for the other demographic, health behaviour and conditions described in this report. Men (OR 3.45; CL 1.58, 7.53) and women (OR 4.66; CL 1.77, 12.22) who score more than 20 on AUDIT (i.e. who are possibly alcohol dependent) are more likely to have a low mental wellbeing score. Results are also significant for men (OR 5.24; CL 2.44, 11.25) and women (OR 3.29; CL 1.33, 8.14) with a possible dependence on alcohol in regard to showing signs of a possible psychiatric disorder, supporting the literature review findings on mental health and alcohol use disorders.
Tables 6A and 6B

53
Men and women with possible alcohol dependence are both particularly likely to respond negatively to the statements, ‘been thinking clearly’ (odds ratios 4.49 and 5.37 respectively), ‘been feeling unhappy and depressed’ (odds ratios 5.71, 3.78), and ‘been thinking of self as worthless’ (odds ratios 7.26, 4.21). 5.1.3 Smoking Background The Scottish Health Survey covers various aspect of smoking behaviour, from current smoking status, past smoking behaviour, frequency of smoking, exposure to second hand smoke and attempts (and desire) to give up smoking. This section presents results by current smoking status, with results shown separately for current smokers, ex-smokers and those who have never smoked. Information about cigarette smoking was collected from adults aged 16 and 17 in a self-completion questionnaire, which offers privacy to answer without disclosing their smoking behaviour in front of other household members who may be present during the interview. Respondents aged 18 and 19 answered the questions either in the main interview or in the self-completion booklet, at the interviewer’s discretion, and adults aged 20 and over were all asked these questions as part of the main interview. In 2012/2013, 23% of adults reported that they currently smoked cigarettes (25% in 2012; 21% in 2013) while 28% were ex-smokers and the remaining 49% said they had never been a smoker.
Results Current smokers have significantly lower WEMWBS scores than both ex-smokers and those who have never smoked (means of 47.5, 50.1 and 51.0 respectively). Although results were similar for ex-smokers and those who have never smoked, this difference was also statistically significant.
Figure 5E

54
Figure 5E WEMWBS mean scores, by smoking status and sex, 2012/2013
Among current smokers, the proportion exhibiting signs of a possible psychiatric disorder (23%) is significantly higher than the equivalent proportions amongst those who are ex-smokers (16%) or have never smoked (12%). The difference between the latter groups is also statistically significant.
Figure 5F
As these results are age-standardised, this is not simply a reflection of the different age profile of smokers, ex-smokers and non-smokers. Indeed, smoking is a significant predictor for low mental wellbeing and signs of a psychiatric disorder after controlling for each of the other factors described in this section. Female non-smokers have significantly lower odds (OR 0.72; CL 0.56, 0.92) of a low WEMWBS score, while non-smokers in both sexes are less likely to exhibit signs of a possible psychiatric disorder compared to smokers (men: OR 0.68; CL 0.49, 0.94; women: OR 0.78, CL 0.62, 0.97).
Tables 6A and 6B

55
Figure 5F Proportion of adults with GHQ12 scores of four or higher, by smoking status and sex, 2012/2013
5.1.4 Fruit and Vegetable Consumption Background The most widely recognised diet guidance is the World Health Organisation (WHO) ‘five a day’ advice for adults to consume at least five varied portions of fruit and vegetables per day. To determine the total number of portions consumed in the 24 hours preceding the interview, the survey includes questions about consumption of: fresh, frozen or canned vegetables; salads; pulses; vegetables in composites; fresh, frozen or canned fruit; dried fruit; and fruit in composites. For details on how the survey uses this to provide information against the five-a-day guideline, including visual aids to assist with interpretation of portion sizes, see the 2013 main reporti. In 2012/2013, one in five (21%) adults met the five-a-day guideline, including 21% of men and 22% of women, while 11% of men and 8% of women reported eating no fruit or vegetables at all the day prior to their Scottish Health Survey interview. Results Respondents who meet this recommendation exhibit considerably higher WEMWBS scores (51.6; 51.8 for men and 51.3 for women) than those who eat less than the recommended number of portions (49.9; 50.4 and 49.5 respectively) or none at all (46.3; 47.2 and 45.1 respectively). The difference in WEMWBS scores between men and women is widest amongst those who eat no fruit or vegetables, and appears to reduce as the number of portions consumed increases.
i http://www.scotland.gov.uk/Publications/2014/12/9982

56
Adults who ate no fruit or vegetables in the day prior to interview were more likely to exhibit signs of the presence of a possible psychiatric disorder (21%), compared to those who eat some (15%) or those who met the recommended daily intake (14%). One in four (26%) women who ate no fruit or vegetables have a GHQ12 score of four or higher, considerably higher than the proportion among men (16%). Fruit and vegetable consumption is a significant predictor of mental health and wellbeing after controlling for other factors. Women who eat some fruit and vegetables are significantly less likely (OR 1.85; CL 1.36, 2.50) to have a below average WEMWBS score than those who do not eat any fruit or vegetables. The gap between those who eat some and those who meet the guideline is not statistically significant; nor are the results for men.
Table 6A 5.1.5 Obesity
Background Scottish Health Survey participants’ height and weight measurements are taken during their interview. Details of the protocols used for collecting height and weight are included in the Scottish Health Survey 2013 report. Body Mass Index (BMI), defined as weight (kg)/height (m2), is a widely accepted measure that allows for differences in weight due to height, and is the main obesity measure in survey. It should be noted that BMI has some limitations (WHO, 2000). For example, it makes no distinction between body fat and muscular mass. Nor does it take account of the distribution of fat throughout the body (i.e. body shape, or waist circumference). Although waist circumference data is also collected in the survey, for the purposes of this report mental wellbeing has only been examined together with weight classifications based on BMI. The weight groups used in this report are presented in Table 5D. Table 5D BMI categories and definitions
BMI Definition
Less than 18.5 Underweight
18.5 to less than 25 Healthy weight
25 to less than 30 Overweight
30 to less than 40 Obese
40+ Morbidly obese
In 2012/2013, a third of adults (34%) were in the healthy weight range. Around two thirds (64%) of adults were overweight, including 25% who were obese and 2% who were morbidly obese. More men (68%) than women (61%) are overweight including obese categories. However, more women than men are obese (or morbidly obese) – 28% overall compared to 26%.

57
Results
Among men, WEMWBS scores fluctuate as BMI increases, between 47.5 (underweight) and 50.7 (overweight). The mean score for those in the healthy weight range is 50.4. For women, the highest WEMWBS score is observed in the healthy weight group (50.3), although this is not significantly higher than the mean in the overweight group (50.0). There is then a reduction as BMI (by grouping) increases, to 48.5 in the obese and 48.0 in the morbidly obese groups. As with men, the lowest WEMWBS mean score is among women with an underweight BMI (46.2) – significantly lower than for all other BMI groups despite a low sample size.
Figure 5G Figure 5G WEMWBS mean scores, by BMI classification and sex, 2012/2013
Among women, from the healthy weight range and upwards, the proportion who exhibit signs of a possible psychiatric disorder increases with increasing BMI (by grouping) – with 16% of those in the healthy and overweight ranges, 20% of those who are obese and 22% of those who are morbidly obese scoring four or higher on the GHQ12 scale. Among the underweight group, 30% of women score four or higher on GHQ12, but this is not a statistically significant increase on the other BMI groups due to the relatively small sample size in this range. For men, the pattern is less clear, with a similarly high (27%) but statistically insignificant proportion in the underweight group exhibiting signs of a possible psychiatric disorder. Men who are overweight are least likely to have a GHQ12 score of four or higher (10%) but the proportion does not vary significantly among any of the BMI groups.

58
It is worth noting that obesity was not identified as a significant factor in multivariate analyses – for WEMWBS or GHQ12 – after controlling for other socio-economic and health-related factors. 5.1.6 Eating together
Scottish Health Survey participants, except those who live in one-person households, are asked how many times household members in the last week ate a main meal together, excluding breakfastj. In 2012/2013, four in ten (39%) reported eating together seven times per week, with a further 26% eating together more frequently still. Around one in eight either ate together one or two times per week (12%), three or four times (12%), or five or six times (13%) per week, while 8% reported never eating meals together. The mean score on the WEMWBS scale among adults who never eat meals together (48.0) is considerably lower than among those who eat together three or more times in a week. There is a gradual reduction in the mean score as the number of weekly meals increases to above three or four (51.9). Those eating together five or six times have a mean score of 51.1, dropping to 50.8 and 50.2 among those who eat together seven times per week, or more frequently, respectively. One quarter (26%) of adults who never eat together display signs of the presence of a possible psychiatric disorder, considerably higher than the proportion among those who eat together three or four times per week (9%). As the number of meals taken together increases above three or four, this proportion steadily increases to 14% among those who eat together more than seven times per week, which remains lower than among those who never eat together (26%). Although eating together in the household is strongly correlated with positive scores in WEMWBS and GHQ12, this was not included in final multivariate logistic regression models after testing for collinearity with other variables. Eating together was shown to be highly associated with marital status, which was included. However, the positive impact on mental wellbeing, particularly among children and adolescents, of regularly eating meals together as a family, has been highlighted in the literature review in this report. These results provide some evidence that eating meals together may be a significant factor in mental wellbeing among adults.
5.1.7 Doctor-diagnosed health conditions
Survey participants were asked whether they had suffered from any of the following CVD and respiratory-related conditions: angina, heart attack, stroke, heart murmur, irregular heart rhythm, 'other heart trouble', diabetes, asthma and COPD, including whether any of these conditions were ever diagnosed by a doctor. Such doctor-diagnoses have been used in this report to identify adults who have specific conditions. Type 1 and type 2 diabetes are not separately identified.
j Note that adults who ‘eat together’ in these statistics include those living in single adult (such as single parent) households

59
Doctor-diagnosed conditions are categorised and analysed in the following groups in this report:
High blood pressure
Diabetes
Angina, heart attack or stroke
Asthma
COPD In 2012/2013, 23% of adults had high blood pressure, 6% had diabetes and 8% had angina, a heart attack or stroke diagnosed by a doctor. Prevalence of each of these conditions increased with age. Prevalence of high blood pressure ranged from 2% of adults aged 16-24, increasing steadily to 21% of adults aged 45-54 and then increasing more sharply to half (48%) aged 65-74 and 57% among those aged 75+. Diabetes prevalence steadily increases from 1% of those in the youngest adult age groups (16-24, 25-34) to 7% of those aged 55-64 before rising to 13% of those aged 65-74 and 15 of those aged 75+. The number of survey participants aged 16-34 who had doctor-diagnosed angina, a heart attack or stroke was close to zero. Prevalence then increased to 2% of those aged 35-44 and 4% of those aged 45-64 before rising more sharply in the 55-64 (12%), 65-74 (20%) and 75+ (34%) age groups. Around 16% of adults reported having asthma diagnosed, with prevalence highest in the 16-24 age group (24%) and decreasing steadily as age increases (to a low of 10% in the 75+ group). Doctor-diagnosed COPD prevalence in 2012/2013 was 4%. Less than 1% of 16-34 year olds reported this condition, rising to 2% and 3% in 35-44 and 45-54 age groups respectively. Prevalence then increases again to 7% in the 55-64 age group, 8% in the 65-74 group and 10% in the 75+ group. Results Mean WEMWBS scores vary considerably between adults with and without the doctor-diagnosed conditions outlined above. In each case, the mean score was significantly lower among those who had been diagnosed with one (or more) of these conditions compared to those who had not. Among adults who had been diagnosed with high blood pressure, the mean WEMWBS score in 2012/2013 was 48.8, significantly lower than the mean (50.3) for those who did not report this diagnosis. For diabetes, the equivalent figures were 47.6 and 50.1; and for angina, heart attack or stroke they were 47.1 and 50.2. Those reporting an asthma diagnosis scored 48.9, compared to 50.2 for those who did not, while equivalent figures for those with a COPD diagnosis were 45.3 and 50.1 respectively.
Figure 5H
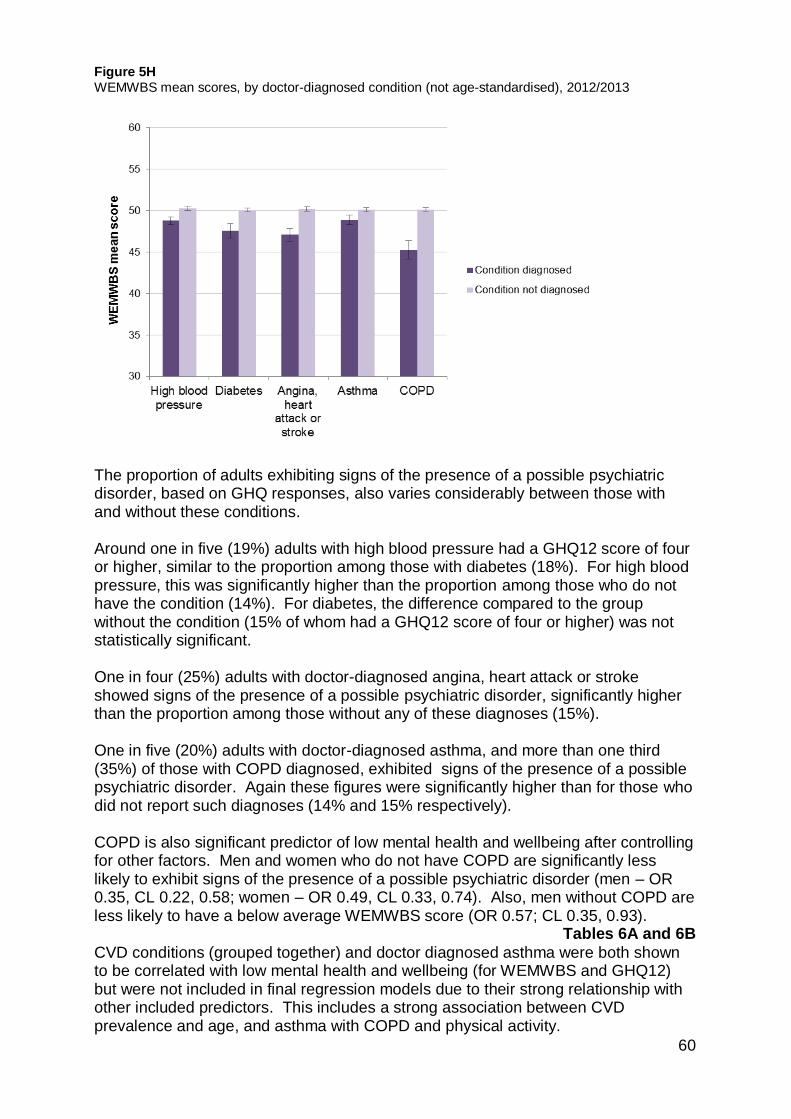
60
Figure 5H WEMWBS mean scores, by doctor-diagnosed condition (not age-standardised), 2012/2013
The proportion of adults exhibiting signs of the presence of a possible psychiatric disorder, based on GHQ responses, also varies considerably between those with and without these conditions. Around one in five (19%) adults with high blood pressure had a GHQ12 score of four or higher, similar to the proportion among those with diabetes (18%). For high blood pressure, this was significantly higher than the proportion among those who do not have the condition (14%). For diabetes, the difference compared to the group without the condition (15% of whom had a GHQ12 score of four or higher) was not statistically significant. One in four (25%) adults with doctor-diagnosed angina, heart attack or stroke showed signs of the presence of a possible psychiatric disorder, significantly higher than the proportion among those without any of these diagnoses (15%). One in five (20%) adults with doctor-diagnosed asthma, and more than one third (35%) of those with COPD diagnosed, exhibited signs of the presence of a possible psychiatric disorder. Again these figures were significantly higher than for those who did not report such diagnoses (14% and 15% respectively). COPD is also significant predictor of low mental health and wellbeing after controlling for other factors. Men and women who do not have COPD are significantly less likely to exhibit signs of the presence of a possible psychiatric disorder (men – OR 0.35, CL 0.22, 0.58; women – OR 0.49, CL 0.33, 0.74). Also, men without COPD are less likely to have a below average WEMWBS score (OR 0.57; CL 0.35, 0.93).
Tables 6A and 6B
CVD conditions (grouped together) and doctor diagnosed asthma were both shown to be correlated with low mental health and wellbeing (for WEMWBS and GHQ12) but were not included in final regression models due to their strong relationship with other included predictors. This includes a strong association between CVD prevalence and age, and asthma with COPD and physical activity.

Chapter 6 Logistic regression tables

62
6. Logistic regression tables
6.1 WEMWBS
Table 6A Estimated odds ratios for below average WEMWBS, by sex, 2012/2013
Males
Females
Independent Variable Odds
ratio Odds ratio Basek 95% CL Basek 95% CL
Age 0.0004 0.2405 16-24 591 1.00 574 1.00 25-34 vs 16-24 660 1.99 1.10 3.58 715 1.13 0.73 1.76 35-44 vs 16-24 691 1.89 1.07 3.32 765 1.24 0.79 1.92 45-54 vs 16-24 801 2.13 1.20 3.76 855 1.35 0.84 2.16 55-64 vs 16-24 661 1.15 0.60 2.17 711 0.87 0.50 1.50 65-74 vs 16-24 488 0.98 0.46 2.10 554 0.85 0.45 1.64 75+ vs 16-24 281 1.53 0.66 3.55 433 0.75 0.38 1.51 Marital status <0.0001 <0.0001 Married/ civil partnership 2,116 1.00 2,117 1.00 Living as married vs Married/civil partnership 534 0.72 0.46 1.13 534 1.27 0.88 1.83 Single vs Married/civil partnership 1,111 1.48 1.01 2.17 998 1.85 1.32 2.59 Separated vs Married/civil partnership 81 3.62 2.04 6.43 108 2.19 1.30 3.72 Divorced/dissolved civil partnership vs Married/civil partnership 173 1.11 0.68 1.83 363 1.94 1.40 2.70 Widowed/surviving civil partner vs Married/civil partnership 158 2.21 1.44 3.40 487 1.71 1.19 2.44 Economic activity <0.0001 <0.0001 In paid employment, self-employed or on gov't training 2,459 1.00 2,308 1.00 Perm unable to work vs In paid employment, self-employed or on gov't training 241 5.09 3.22 8.04 237 4.85 3.22 7.31 Looking for/intending to look for paid work vs In paid employment, self-employed or on gov't training 208 1.73 1.04 2.88 176 1.95 1.25 3.04 Retired vs In paid 784 1.09 0.66 1.82 1,125 0.85 0.55 1.32
k Weighted

63
employment, self-employed or on gov't training Looking after home / doing something else vs In paid employment, self-employed or on gov't training 111 2.00 1.02 3.91 387 1.44 1.02 2.03 In full-time education vs In paid employment, self-employed or on gov't training 369 1.16 0.64 2.10 373 0.94 0.56 1.58 Equivalised income quintile 0.3471 <0.0001 Top quintile 899 1.00 826 1.00 2nd quintile vs top quintile 862 1.06 0.69 1.62 784 1.62 1.05 2.49 3rd quintile vs top quintile 660 1.27 0.81 1.99 746 1.85 1.20 2.87 4th quintile vs top quintile 623 1.30 0.85 1.99 806 2.84 1.89 4.26 Bottom quintile vs top quintile 572 1.45 0.93 2.27 760 2.82 1.85 4.31 SIMD 0.2127 0.0677 Not in 15% most deprived areas 3,665 1.00 3,938 1.00 In 15% most deprived areas vs Not in 15% most deprived areas 508 1.24 0.88 1.75 669 1.27 0.98 1.63 Unpaid care provision 0.5808 0.0014 Does not provide unpaid care 3,546 1.00 3,702 1.00 Up to 4 hours a week vs Does not provide unpaid care 200 0.77 0.44 1.36 253 0.77 0.47 1.26 5 - 34 hours a week vs Does not provide unpaid care 262 1.07 0.62 1.84 425 1.13 0.81 1.58 35 or more hours a week vs Does not provide unpaid care 113 1.35 0.79 2.32 173 2.43 1.56 3.76 Physical activity <0.0001 <0.0001 Meets guideline 2,930 1.00 2,719 1.00 Some activity vs Meets guideline 363 1.40 0.93 2.10 631 1.74 1.28 2.36 Low activity vs Meets guideline 147 1.79 1.03 3.12 232 1.55 0.98 2.44 Very low activity vs Meets guideline 733 2.20 1.59 3.04 1,026 2.47 1.97 3.11

64
Fruit and vegetable consumption 0.2416 0.0002 Less than 5 portions 2,865 1.00 3,227 1.00 None vs Less than 5 portions 438 1.26 0.88 1.80 373 1.85 1.36 2.50 5 portions or more vs Less than 5 portions 870 0.88 0.64 1.20 1,006 0.95 0.73 1.22 Smoking 0.1071 0.0308 Current cigarette smoker 973 1.00 997 1.00 Ex-smoker vs Current cigarette smoker 1,230 0.86 0.62 1.19 1,301 0.85 0.67 1.09 Never smoked vs Current cigarette smoker 1,970 0.72 0.53 0.98 2,309 0.72 0.56 0.92 Alcohol use 0.0078 0.0018 No dependence on alcohol 4,005 1.00 4,437 1.00 Possible alcohol dependence vs No dependence on alcohol 69 3.45 1.58 7.53 31 4.66 1.77 12.22 COPD (doctor-diagnosed) 0.0254 0.4309 Yes 139 1.00 185 1.00 No v Yes 4,034 0.57 0.35 0.93 4,422 0.85 0.56 1.28

65
6.2 GHQ12
Table 6B Estimated odds ratios for GHQ12 scores of four or higher, by sex, 2012/2013
Males
Females
Independent Variable
Odds ratio
95% Odds
ratio
95%
Basel Confidence
Limits Basel Confidence
Limits
Age 0.0011
0.1205
16-24 589 1.00 567 1.00 25-34 vs 16-24 663 1.43 0.82 2.51 718 1.00 0.66 1.53 35-44 vs 16-24 695 0.81 0.44 1.47 765 0.81 0.53 1.24 45-54 vs 16-24 803 0.74 0.41 1.34 851 0.96 0.60 1.53 55-64 vs 16-24 657 0.50 0.25 0.99 713 0.67 0.39 1.15 65-74 vs 16-24 486 0.35 0.16 0.75 548 0.78 0.42 1.47 75+ vs 16-24 285 0.36 0.14 0.92 437 0.53 0.27 1.06
Economic activity <0.0001 <0.0001 In paid employment, self-employed or on gov't training 2,456 1.00 2,303 1.00 Perm unable to work vs In paid employment, self-employed or on gov't training 249 6.43 4.10 10.08 236 4.51 3.18 6.39 Looking for/intending to look for paid work vs In paid employment, self-employed or on gov't training 211 1.43 0.85 2.40 177 1.74 1.13 2.67 Retired vs In paid employment, self-employed or on gov't training 786 1.28 0.76 2.14 1,126 0.86 0.56 1.31 Looking after home / doing something else vs In paid employment, self-employed or on gov't training 111 3.15 1.64 6.06 392 1.63 1.17 2.26 In full-time education vs In paid employment, self-employed or on gov't training 365 1.24 0.70 2.20 365 1.56 0.99 2.46 Marital status 0.0453
<0.0001
Married/ civil partnership 2,115 1.00 2,111 1.00 Living as married vs 532 0.79 0.49 1.28 536 1.33 0.95 1.87
l Weighted

66
Married/civil partnership Single vs Married/civil partnership 1,115 1.06 0.73 1.54 993 1.73 1.27 2.38 Separated vs Married/civil partnership 82 2.15 1.14 4.02 107 1.81 1.07 3.06 Divorced/dissolved civil partnership vs Married/civil partnership 177 1.53 0.91 2.58 365 1.57 1.15 2.13 Widowed/surviving civil partner vs Married/civil partnership 157 1.36 0.80 2.33 487 1.94 1.39 2.71 Equivalised income 0.7646
0.0017
Top quintile 892 1.00 825 1.00 2nd quintile vs top quintile 856 0.84 0.53 1.33 793 1.04 0.73 1.47 3rd quintile vs top quintile 656 0.98 0.60 1.61 743 0.74 0.52 1.06 4th quintile vs top quintile 632 0.85 0.51 1.41 795 1.15 0.82 1.61 Bottom quintile vs top quintile 580 1.13 0.68 1.89 754 1.48 1.04 2.12 Parental socio-economic classification 0.1208 0.0032 Managerial and professional 1,196 1.00 1,308 1.00 Intermediate vs Managerial and professional 344 0.73 0.43 1.21 422 0.72 0.50 1.02 Small employers / own account vs Managerial and professional 355 0.70 0.44 1.14 404 0.98 0.67 1.42 Lower supervisory / technical vs Managerial and professional 495 0.93 0.62 1.40 546 1.02 0.75 1.38 Semi-routine vs Managerial and professional 1,139 0.66 0.47 0.92 1,327 1.08 0.85 1.37 Unpaid care provision 0.0515 <0.0001 Does not provide unpaid care 3,550 1.00 3,690 1.00 Up to 4 hours a week vs Does not provide unpaid care 198 0.94 0.51 1.73 252 0.76 0.48 1.22 5 - 34 hours a week vs Does not provide unpaid care 265 1.20 0.76 1.91 427 1.40 1.01 1.95 35 or more hours a week vs Does not provide unpaid care 112 2.16 1.29 3.62 177 2.76 1.80 4.25

67
Smoking 0.0534 0.0514 Current cigarette smoker 986 1.00 988 1.00 Ex-smoker vs Current cigarette smoker 1,227 0.88 0.62 1.23 1,302 0.95 0.74 1.20 Never smoked vs Current cigarette smoker 1,965 0.68 0.49 0.94 2,309 0.78 0.62 0.97 Physical activity 0.0002 <0.0001 Meets guideline 2,928 1.00 2,713 1.00 Some activity vs Meets guideline 363 0.87 0.55 1.37 626 1.19 0.89 1.60 Low activity vs Meets guideline 147 0.88 0.46 1.66 237 1.36 0.92 2.02 Very low activity vs Meets guideline 741 2.00 1.43 2.78 1,023 1.86 1.50 2.31 Alcohol use 0.0001 0.0054 No dependence on alcohol 4,012 1.00 4,439 1.00 Possible alcohol dependence vs No dependence on alcohol 69 5.24 2.44 11.25 32 3.29 1.33 8.14 COPD (doctor-diagnosed) <0.0001 0.0006 Yes 141 1.00 184 1.00
No v Yes 4,037 0.35 0.22 0.58 4,416 0.49 0.33 0.74

Chapter 7 References

69
7. References
1. Baird BM, Lucas RE, Donnellan MB. Life Satisfaction Across the Lifespan: Findings from Two Nationally Representative Panel Studies. Soc Indic Res. 2010;99(2):183-203. doi:10.1007/s11205-010-9584-9.
2. Kammann R, Flett R. Sourcebook for Measuring Wellbeing with Affectometer 2. Dunedin: Why Not Foundation; 1983.
3. Stewart-Brown S, Janmohamed K. Warwick-Edinburgh Mental Well-Being Scale (WEMWBS) User Guide Version 1. Warwick & Edinburgh: University of Warwick & NHS Health Scotland; 2008.
4. Bianco D. Performance of the Warwick-Edinburgh Mental Wellbeing Scale (WEMWBS) as a screening tool for depression in UK and Italy. 2012. Available at: http://www2.warwick.ac.uk/fac/med/research/platform/wemwbs/development/papers/donatella_bianco-thesis.pdf.
5. Goldberg DP, Gater R, Sartorius N, et al. The validity of two versions of the GHQ in the WHO study of mental illness in general health care. Psychol Med. 1997;27(1):191-197.
6. Hoeymans N, Garssen AA, Westert GP, Verhaak PFM. Measuring mental health of the Dutch population: a comparison of the GHQ-12 and the MHI-5. Health Qual Life Outcomes. 2004;2:23. doi:10.1186/1477-7525-2-23.
7. Guthrie E, Black D, Bagalkote H, Shaw C, Campbell M, Creed F. Psychological stress and burnout in medical students: a five-year prospective longitudinal study. J R Soc Med. 1998;91(5):237-243.
8. Moffat KJ, McConnachie A, Ross S, Morrison JM. First year medical student stress and coping in a problem-based learning medical curriculum. Med Educ. 2004;38(5):482-491. doi:10.1046/j.1365-2929.2004.01814.x.
9. Shaw A, McMunn A, Field J. The Scottish Health Survey 1998.; 2000.
10. James D, Yates J, Ferguson E. Can the 12-item General Health Questionnaire be used to identify medical students who might “struggle” on the medical course? A prospective study on two cohorts. Bmc Med Educ. 2013;13:48. doi:10.1186/1472-6920-13-48.
11. Murphy H, Lloyd K. Gender as a risk factor in minor psychiatric morbidity in the United Kingdom. Internet J Epidemiol. 2008;6(2). Available at: http://ispub.com/IJE/6/2/8960.
12. Miller R, Devine P, Schubotz D. Secondary Analysis of the 1997 and 2001 Northern Ireland Health and Social Wellbeing Surveys. Belfast; 2003.

70
13. Payne S. Social Exclusion and Mental Health – Review of Literature and Existing Surveys.; 2011.
14. Tennant R, Hiller L, Fishwick R, et al. The Warwick-Edinburgh mental well-being scale (WEMWBS): development and UK validation. Health Qual Life Outcomes. 2007;5:63. doi:10.1186/1477-7525-5-63.
15. Clarke A, Friede T, Putz R, et al. Warwick-Edinburgh Mental Well-being Scale (WEMWBS): Validated for teenage school students in England and Scotland. A mixed methods assessment. BMC Public Health. 2011;11:487. doi:10.1186/1471-2458-11-487.
16. Bijl R V, van Zessen G, Ravelli A, de Rijk C, Langendoen Y. The Netherlands Mental Health Survey and Incidence Study (NEMESIS): objectives and design. Soc Psychiatry Psychiatr Epidemiol. 1998;33(12):581-586. doi:10.1007/s001270050097.
17. Mann RE, Cheung JTW, Ialomiteanu A, et al. Estimating prevalence of anxiety and mood disorder in survey data using the GHQ12: Exploration of threshold values. Eur J Psychiatry. 2011;25(2):81-91.
18. Hankins M. The reliability of the twelve-item General Health Questionnaire (GHQ-12) under realistic assumptions. BMC Public Health. 2008;8:355. doi:10.1186/1471-2458-8-355.
19. Prince M, Patel V, Saxena S, et al. No health without mental health. Lancet. 2007;370(9590):859-77. doi:10.1016/S0140-6736(07)61238-0.
20. NHS Health Scotland. Scotland’s Mental Health: Adults 2012. Edinburgh: NHS Health Scotland; 2012.
21. Akhtar-Danesh N, Landeen J. Relation between depression and sociodemographic factors. Int J Ment Health Syst. 2007;1(1):4. doi:10.1186/1752-4458-1-4.
22. McManus S, Meltzer H, Brugha T, Bebbington P, Jenkins R. Adult Psychiatric Morbidity in England , 2007 Results of a Household Survey.; 2009.
23. Lewis G, Bebbington P, Brugha T, et al. Socio-economic status, standard of living, and neurotic disorder. Int Rev Psychiatry. 2003;15(1-2):91-6. doi:10.1080/0954026021000045994.
24. Mahedy L, Todaro-Luck F, Bunting B, Murphy S, Kirby K. Risk factors for psychological distress in Northern Ireland. Int J Soc Psychiatry. 2013;59(7):646-54. doi:10.1177/0020764012450993.
25. Baker E, Mason K, Bentley R, Mallett S. Exploring the bi-directional relationship between health and housing in Australia. Urban Policy Res. 2014;32(1):71-84. doi:7.10.1080/08111146.2013.831759.

71
26. Mason KE, Baker E, Blakely T, Bentley RJ. Housing affordability and mental health: Does the relationship differ for renters and home purchasers? Soc Sci Med. 2013;94:91-97. doi:10.1016/j.socscimed.2013.06.023.
27. Collings S, Jenkin G, Carter K, Signal L. Gender differences in the mental health of single parents: New Zealand evidence from a household panel survey. Soc Psychiatry Psychiatr Epidemiol. 2014;49(5):811-21. doi:10.1007/s00127-013-0796-6.
28. Rousou E, Kouta C, Middleton N, Karanikola M. Single mothers’ self-assessment of health: a systematic exploration of the literature. Int Nurs Rev. 2013;60(4):425-34. doi:10.1111/inr.12044.
29. Cornaglia F, Feldman NE, Leigh A. Crime and Mental Well- Being. J Hum Resour. 2013;49(March 2013).
30. Polling C, Khondoker M, Hatch SL, Hotopf M. Influence of perceived and actual neighbourhood disorder on common mental illness. Soc Psychiatry Psychiatr Epidemiol. 2014;49(6):889-901. doi:10.1007/s00127-013-0813-9.
31. Cheng H, Furnham A. The Associations Between Parental Socio-Economic Conditions, Childhood Intelligence, Adult Personality Traits, Social Status and Mental Well-Being. Soc Indic Res. 2013;117(2):653-664. doi:10.1007/s11205-013-0364-1.
32. Pulkki-Råback L, Ahola K, Elovainio M, et al. Socio-economic position and mental disorders in a working-age Finnish population: the health 2000 study. Eur J Public Health. 2012;22(3):327-32. doi:10.1093/eurpub/ckr127.
33. Curl A, Kearns A. Financial Stress and Mental Wellbeing in an Age of Austerity : Evidence from the GoWell Surveys 2006-2011.; 2013:1-72.
34. Reijneveld S a, Schene a H. Higher prevalence of mental disorders in socioeconomically deprived urban areas in The Netherlands: community or personal disadvantage? J Epidemiol Community Health. 1998;52(1):2-7. Available at: http://www.pubmedcentral.nih.gov/articlerender.fcgi?artid=1756606&tool=pmcentrez&rendertype=abstract.
35. Mundt A, Kliewe T, Yayla S, et al. Social characteristics of psychological distress in disadvantaged areas of Berlin. Int J Soc Psychiatry. 2014;60(1):75-82. doi:10.1177/0020764012464017.
36. Siddiqui F, Lindblad U, Bennet L. Physical inactivity is strongly associated with anxiety and depression in Iraqi immigrants to Sweden: a cross-sectional study. BMC Public Health. 2014;14:502. doi:10.1186/1471-2458-14-502.
37. McLean G, Gunn J, Wyke S, et al. The influence of socioeconomic deprivation on multimorbidity at different ages: a cross-sectional study. Br J Gen Pract. 2014;64(624):E440-E447.

72
38. Paul KI, Moser K. Unemployment impairs mental health: Meta-analyses. J Vocat Behav. 2009;74(3):264-282. doi:10.1016/j.jvb.2009.01.001.
39. Schmitz H. Why are the unemployed in worse health? The causal effect of unemployment on health. Labour Econ. 2011;18(1):71-78. doi:10.1016/j.labeco.2010.08.005.
40. Strandh M, Winefield A, Nilsson K, Hammarström A. Unemployment and mental health scarring during the life course. Eur J Public Health. 2014;24(3):440-5. doi:10.1093/eurpub/cku005.
41. Stansfeld S, Candy B. Psychosocial work environment and mental health—a meta-analytic review. Scand J Work Environ Health. 2006;32(6):443-462. doi:10.5271/sjweh.1050.
42. Wilhelm K, Kovess V, Rios-Seidel C, Finch A. Work and mental health. Soc Psychiatry Psychiatr Epidemiol. 2004;39(11):866-73. doi:10.1007/s00127-004-0869-7.
43. Hounsome B, Edwards RT, Hounsome N, Edwards-Jones G. Psychological Morbidity of Farmers and Non-farming Population: Results from a UK Survey. Community Ment Health J. 2012;48(4):503-510. doi:10.1007/s10597-011-9415-8.
44. Romans S, Cohen M, Forte T. Rates of depression and anxiety in urban and rural Canada. Soc Psychiatry Psychiatr Epidemiol. 2011;46(7):567-75. doi:10.1007/s00127-010-0222-2.
45. Honda A, Abe Y, Aoyagi K, Honda S. Caregiver burden mediates between caregiver’s mental health condition and elder's behavioral problems among Japanese family caregivers. Aging Ment Health. 2014;18(2):248-54. doi:10.1080/13607863.2013.827625.
46. Figueiredo D, Gabriel R, Jácome C, Cruz J, Marques A. Caring for relatives with chronic obstructive pulmonary disease: how does the disease severity impact on family carers? Aging Ment Health. 2014;18(3):385-93. doi:10.1080/13607863.2013.837146.
47. Goren A, Gilloteau I, Lees M, DaCosta Dibonaventura M. Quantifying the burden of informal caregiving for patients with cancer in Europe. Support Care Cancer. 2014;22(6):1637-46. doi:10.1007/s00520-014-2122-6.
48. Ask H, Langballe EM, Holmen J, Selbæk G, Saltvedt I, Tambs K. Mental health and wellbeing in spouses of persons with dementia: the Nord-Trøndelag Health Study. BMC Public Health. 2014;14:413. doi:10.1186/1471-2458-14-413.
49. Stanley S, Laugharne J. The Impact of Lifestyle Factors on the Physical Health of People with a Mental Illness: a Brief Review. Int J Behav Med. 2014;21(2):275-281. doi:10.1007/s12529-013-9298-x.
50. Kangasniemi A, Lappalainen R, Kankaanpää A, Tammelin T. Mindfulness skills, psychological flexibility, and psychological symptoms among physically
73
less active and active adults. Ment Health Phys Act. 2014;7(3):121-127. doi:10.1016/j.mhpa.2014.06.005.
51. Galper DI, Trivedi MH, Barlow CE, Dunn AL, Kampert JB. Inverse Association between Physical Inactivity and Mental Health in Men and Women. Med Sci Sport Exerc. 2006;38(1):173-178. doi:10.1249/01.mss.0000180883.32116.28.
52. Lucas M, Mekary R, Pan A, et al. Relation between clinical depression risk and physical activity and time spent watching television in older women: a 10-year prospective follow-up study. Am J Epidemiol. 2011;174(9):1017-27. doi:10.1093/aje/kwr218.
53. Dunn AL, Trivedi MH, O’Neal HA. Physical activity dose-response effects on outcomes of depression and anxiety. Med Sci Sport Exerc. 2001;33:587-597.
54. Roshanaei-Moghaddam B, Katon WJ, Russo J. The longitudinal effects of depression on physical activity. Gen Hosp Psychiatry. 2009;31(4):306-15. doi:10.1016/j.genhosppsych.2009.04.002.
55. Teychenne M, Ball K, Salmon J. Physical activity and likelihood of depression in adults: a review. Prev Med (Baltim). 2008;46(5):397-411. doi:10.1016/j.ypmed.2008.01.009.
56. Jacka FN, Sacks G, Berk M, Allender S. Food policies for physical and mental health. BMC Psychiatry. 2014;14:132. doi:10.1186/1471-244X-14-132.
57. Akbaraly T, Brunner E, Ferrie J, Marmot M, Kivimaki M, Singh-Manoux A. Dietary pattern and depressive symptoms in middle age. Br J Psychiatry. 2009;195:408-413. doi:10.1192/bjp.bp.108.058925.
58. McMartin SE, Jacka FN, Colman I. The association between fruit and vegetable consumption and mental health disorders: evidence from five waves of a national survey of Canadians. Prev Med (Baltim). 2013;56(3-4):225-30. doi:10.1016/j.ypmed.2012.12.016.
59. Utter J, Denny S, Robinson E, Fleming T, Ameratunga S, Grant S. Family meals and the well-being of adolescents. J Paediatr Child Health. 2013;49(11):906-11. doi:10.1111/jpc.12428.
60. Musick K, Meier A. Assessing Causality and Persistence in Associations Between Family Dinners and Adolescent Well-Being. J Marriage Fam. 2012;74(3):476-493. doi:10.1111/j.1741-3737.2012.00973.x.
61. McFall SL, Garrington C (Eds). Understanding Society : Early Findings from the First Wave of the UK ’ S Household Longitudinal Study. Colchester: ISER; 2011.
62. WHO. Mental Health: Facing the Challenges, Building Solutions.; 2005.
63. Rancans E, Vrublevska J, Snikere S, Koroleva I, Trapencieris M. The point prevalence of depression and associated sociodemographic correlates in the

74
general population of Latvia. J Affect Disord. 2014;156:104-10. doi:10.1016/j.jad.2013.11.022.
64. Bellos S, Skapinakis P, Rai D, et al. Cross-cultural patterns of the association between varying levels of alcohol consumption and the common mental disorders of depression and anxiety: secondary analysis of the WHO Collaborative Study on Psychological Problems in General Health Care. Drug Alcohol Depend. 2013;133(3):825-31. doi:10.1016/j.drugalcdep.2013.08.030.
65. Mathiesen EF, Nome S, Eisemann M, Richter J. Drinking patterns, psychological distress and quality of life in a Norwegian general population-based sample. Qual Life Res. 2012;21(9):1527-36. doi:10.1007/s11136-011-0080-8.
66. Saarni SI, Joutsenniemi K, Koskinen S, et al. Alcohol consumption, abstaining, health utility, and quality of life--a general population survey in Finland. Alcohol Alcohol. 2008;43(3):376-86. doi:10.1093/alcalc/agn003.
67. Luger TM, Suls J, Vander Weg MW. How robust is the association between smoking and depression in adults? A meta-analysis using linear mixed-effects models. Addict Behav. 2014;39(10):1418-1429. doi:10.1016/j.addbeh.2014.05.011.
68. Simon GE, Korff M Von, Saunders K, Migliorette DL. Association between obesity and psychiatric disorders in the US adult population. Arch Gen Psychiatry. 2006;63(7):824-830.
69. Ul-Haq Z, Smith DJ, Nicholl BI, et al. Gender differences in the association between adiposity and probable major depression: a cross-sectional study of 140,564 UK Biobank participants. BMC Psychiatry. 2014;14:153. doi:10.1186/1471-244X-14-153.
70. Ul-Haq Z, Mackay DF, Fenwick E, Pell JP. Association between body mass index and mental health among Scottish adult population: a cross-sectional study of 37272 participants. Psychol Med. 2013:1-10. doi:10.1017/S0033291713002833.
71. Magallares A, Pais-Ribeiro JL. Mental Health and Obesity: A Meta-Analysis. Appl Res Qual Life. 2014;9(2):295-308. doi:10.1007/s11482-013-9226-x.
72. Hu H-Y, Wu C-Y, Chou Y-J, Huang N. Body mass index and mental health problems in general adults: disparity in gender and socioeconomic status. J Psychosom Res. 2012;72(5):393-8. doi:10.1016/j.jpsychores.2012.01.007.
73. Reeves D, Blickem C, Vassilev I, et al. The contribution of social networks to the health and self-management of patients with long-term conditions: a longitudinal study. PLoS One. 2014;9(6):e98340. doi:10.1371/journal.pone.0098340.
74. Ul-Haq Z, Mackay DF, Pell JP. Association between Self-Reported General and Mental Health and Adverse Outcomes: A Retrospective Cohort Study of

75
19 625 Scottish Adults. PLoS One. 2014;9(4):e93857-e93857. doi:10.1371/journal.pone.0093857.
75. Keenan K, Grant I, Ramsey J. The Scottish Health Survey 2010 Topic Report Obesity. Edinburgh: The Scottish Government; 2011.
76. Corbett J, Day J, Davidson M, Doig M, Hampson A, Roth M. The Scottish Health Survey 2012: Technical Report. Edinburgh; 2013.

76
AN OFFICIAL STATISTICS PUBLICATION FOR SCOTLAND Official and National Statistics are produced to high professional standards set out in the Code of Practice for Official Statistics. Both undergo regular quality assurance reviews to ensure that they meet customer needs and are produced free from any political interference. Correspondence and enquiries
For enquiries about this publication please contact: Craig Kellock Health Analytical Services Division DG Health and Social Care Telephone: 0131 244 2589 e-mail: [email protected] For general enquiries about Scottish Government statistics please contact: Office of the Chief Statistician, Telephone: 0131 244 0442, e-mail: [email protected]
How to access background or source data
The data collected for this statistical bulletin:
☐ are available in more detail through Scottish Neighbourhood Statistics
☒ are available via the UK Data Service
☒ may be made available on request, subject to consideration of legal and ethical
factors. Please contact [email protected] for further information.
☐ cannot be made available by Scottish Government for further analysis as Scottish
Government is not the data controller.
Complaints and suggestions
If you are not satisfied with our service or have any comments or suggestions, please write to the Chief Statistician, 3WR, St Andrews House, Edinburgh, EH1 3DG, Telephone: (0131) 244 0302, e-mail [email protected]. If you would like to be consulted about statistical collections or receive notification of publications, please register your interest at www.scotland.gov.uk/scotstat Details of forthcoming publications can be found at www.scotland.gov.uk/statistics ISBN 978-1-78544-075-5 Crown Copyright
You may use or re-use this information (not including logos) free of charge in any format or medium, under the terms of the Open Government Licence. See: www.nationalarchives.gov.uk/doc/open-government-licence/

w w w . s c o t l a n d . g o v . u k
© Crown copyright 2015
This publication is licensed under the terms of the Open Government Licence v3.0 except where otherwise stated. To view this licence, visit nationalarchives.gov.uk/doc/open-government-licence/version/3 or write to the Information Policy Team, The National Archives, Kew, London TW9 4DU, or email: [email protected].
Where we have identified any third party copyright information you will need to obtain permission from the copyright holders concerned.
This publication is available at www.scotland.gov.uk
Any enquiries regarding this publication should be sent to us at The Scottish GovernmentSt Andrew’s HouseEdinburghEH1 3DG
ISBN: 978-1-78544-075-5 (web only)
Published by The Scottish Government, January 2015
Produced for The Scottish Government by APS Group Scotland, 21 Tennant Street, Edinburgh EH6 5NAPPDAS42904 (01/15)