the scientific method - birdville isd / · pdf filethe scientific method exploring...
TRANSCRIPT
The Scientific Method Exploring Experimental Design
Unit Overview
OBJECTIVE Students will identify and apply the steps of the scientific method.
LEVEL All
NATIONAL STANDARDS UCP.1, UCP.2, UCP.3, A.1, A.2, G.2
CONNECTIONS TO AP All AP Science courses contain a laboratory component where the scientific method will be used.
TIME FRAME Two 45 minute class periods
MATERIALS
Come Fly With Us student pages Scientific Method Practice 1 student pages Penny Lab student pages Scientific Method Practice 2 student pages
TE
AC
HE
R
PA
GE
S
Suggested Teaching Procedure
Day 1
1. Present notes on the steps of the scientific method as you see fit. Although this part is teacher directed, ideally the steps should be presented as more of a discussion. Some questions to ask during your discussion include:
“What is the variable that the experimenter changes?” “What makes a valid experiment?” “Why is it important to have detailed procedures?” “Why is the control such an important part of the experiment?”
2. After students take notes, pass out the student activity pages for Come Fly With Us.
3. Students should read the directions and perform the prescribed tasks in the procedure, applying there scientific method knowledge. Students should complete and turn in Come Fly with Us before leaving.
4. Distribute Scientific Method Practice 1, and have students read and answer the questions for homework. Students are to return the completed questions the following class period.
Day 2
1. After collecting the students’ papers, review the correct answers with the class.
2. Pass out the student activity pages for the Penny Lab. Students should read the instructions and perform the lab during class.
3. After completing the lab, students should turn in a laboratory report before the end of the period.
4. Assign Scientific Method Practice 2 as homework. Students should return the completed assignment the following class period.
Day 3
1. After collecting the students’ papers, review the correct answers with the class.
TE
AC
HE
R
PA
GE
S
TEACHER NOTES Modern scientific inquiry or science (from scientia, Latin for knowledge) is generally attributed to the historical contributions of Galileo Galilei and Roger Bacon. However, some historians believe that their practices were inspired by earlier Islamic tradition. In spite of the rich human tradition of scientific inquiry, today there is no single or universal method of performing science. According to the National Science Teachers Association, science is “characterized by the systematic gathering of information through various forms of direct and indirect observations and the testing of this information by methods including, but not limited to, experimentation.” Although this definition is helpful in explaining the process of science, it does not specify a list of experimental steps that one should logically progress through to perform an experiment. (An experiment can be defined as an organized series of steps used to test a probable solution to a problem, commonly called a hypothesis.) Despite the absence of a standard scientific method, there is a generally agreed upon model that describes how science operates.
Steps of the Scientific Method
1. State the problem: What is the problem? This is typically stated in a question format. EXAMPLE: Will taking one aspirin per day for 60 days decrease blood pressure in
females ages 12-14?
2. Research the problem: The researcher will typically gather information on the problem. They may read accounts and journals on the subject, or be involved in communications with other scientists.
EXAMPLE: Some people relate stories to doctors that they feel relief from high blood pressure after taking one aspirin per day. The idea is not scientific if it is untested or if one person reports this (called anecdotal evidence).
3. Form a probable solution, or hypothesis, to your problem: Make an educated guess as to what will solve the problem. Ideally this should be written in an if-then format.
EXAMPLE: If a female aged 12-14 takes one aspirin per day for 60 days, then her blood pressure will decrease.
4. Test your hypothesis: Do an experiment. EXAMPLE: Test 100 females, ages 12-14, to see if taking one aspirin a day for 60 days
lowers blood pressure in those females.
Independent Variable (I.V.): The variable you change, on purpose, in the experiment. To help students remember it, suggest the phrase “I change it” emphasizing the Independent variable.
EXAMPLE: In this described experiment, taking an aspirin or not would be the independent variable. This is what the experimenter changes between his groups in the experiment.
TE
AC
HE
R
PA
GE
S
Dependent Variable (D.V.): The response to the I.V. EXAMPLE: The blood pressure of the individuals in the experiment, which may change from the administration of aspirin.
Control: The group, or experimental subject, which does not receive the I.V.
EXAMPLE: The group of females that does not get the dose of aspirin.
Constants: Conditions that remain the same in the experiment. EXAMPLE: In this scenario some probable constants would include: only females were used, only females around the same age, the same dosage of aspirin was given to all the individuals in the experimental group for the same defined time interval—60 days, the same brand of aspirin was given, the same type of diet was ideally given to the members of both groups as well as the same activity level prescribed.
5. Recording and analyzing the data: What sort of results did you get? Data is typically organized into data tables. The data is then graphed for ease of understanding and visual appeal.
EXAMPLE: Out of 100 females, ages 12-14 yrs., 76 had lower blood pressure readings after taking one aspirin per day for 60 days.
6. Stating a conclusion: What does all the data mean? Is your hypothesis supported? EXAMPLE: The data shows that taking one aspirin per day for 60 days decreases
blood pressure in 76% of the tested females ages 12-14 compared to a decrease in blood pressure in 11% of the control group. Therefore, the original hypothesis has been supported, that taking one aspirin per day can decrease blood pressure.
7. Repeating the work: Arguably, the most important part of scientific inquiry! When an experiment can be repeated and the same results obtained by different experimenters, that experiment is validated.
Included in this unit is a hands-on lab entitled Come Fly with Us. This activity makes a great first day activity to get kids warmed up to the scientific method. They will examine what happens to the spin direction of a paper helicopter when they fold the blades in different directions. Students construct a paper helicopter to test their hypothesis on how the helicopter will fly upon folding the blades in different directions. The lab is well designed for pointing out the steps of the scientific method.
Another student-centered activity which has been included is the Penny Lab. Although it was initially designed for middle school use, this activity can be modified for use at any level to reinforce the steps of the scientific method. Students are given the simple task of determining the number of drops that can fit on the “Lincoln” side of a penny. As the lab is designed, the students quickly learn that even the most simple of experiments can contain many hidden variables that decrease the validity of the experiment.
TE
AC
HE
R
PA
GE
S

The Scientific Method Exploring Experimental Design
Come Fly With Us
OBJECTIVE Students will practice applying the steps of the scientific method to a problem.
LEVEL All levels
NATIONAL STANDARDS UCP.1, UCP.2, UCP.3, A.1, A.2, G.2
CONNECTIONS TO AP Using the scientific method by acquiring data through experimentation and design of experiments are all fundamental skills needed for the AP Science courses.
TIME FRAME 45 minutes
MATERIALS (For a class of 28)
TEACHER NOTES Come Fly With Us is an effective way for students to experimentally test a variable in a simple activity. This activity is designed to be the first activity that students complete after learning the steps of the scientific method. The students can apply their learning in a meaningful way.
Students cut out and fold a paper helicopter according to the instructions provided. After constructing the simple helicopter, students are instructed to fold the blades of the helicopter in opposing directions.
28 copies of the helicopter model (provided in the student pages)
14 pairs of scissors
28 pens or pencils
TE
AC
HE
R
PA
GE
S
Students generate a hypothesis as to how they think changing the direction of the fold of the wings will affect the direction of spin. The students then test their hypothesis and fly the helicopter. The students will discover that folding the blade one way will produce a clockwise spin of the helicopter. Folding the blades in the opposite direction will produce a counterclockwise spin of the helicopter. The students should solidify their understanding that by manipulating the independent variable (direction of fold) the dependent variable (spin direction) responds.
The students must also take into consideration the constants in their experiment: holding the helicopter at the same initial height, maintaining a stable wind environment, no other external forces acting on the helicopter, and holding the helicopter at the T each time. The concept of a control group is best illustrated in the second half of Come Fly With Us. A fictitious student, Bonita, believes that adding mass (paper clips) will stabilize her paper helicopter and increase the flight time. The independent variable is the presence or absence of the added mass. The control group, by definition, does not receive the independent variable. Therefore, the control in Bonita’s experiment is a paper helicopter with no paper clips added. The students can typically clearly envision the idea of a control. Further discussion of a control should address the necessity of a control to validate that changes seen in the experimental group can be attributed to the independent variable. An extension of this lab could be to have the students actually try testing the extra weight and seeing how it affects the flight time.
Explanation of the Helicopter Spin
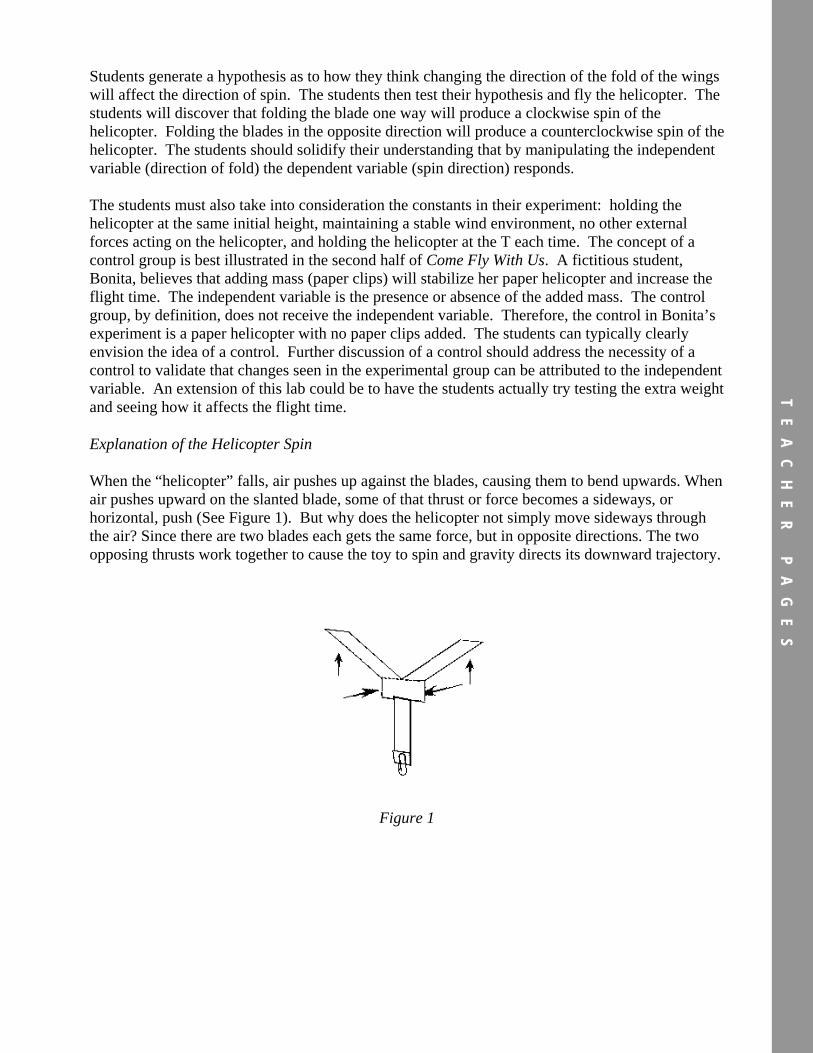
When the “helicopter” falls, air pushes up against the blades, causing them to bend upwards. When air pushes upward on the slanted blade, some of that thrust or force becomes a sideways, or horizontal, push (See Figure 1). But why does the helicopter not simply move sideways through the air? Since there are two blades each gets the same force, but in opposite directions. The two opposing thrusts work together to cause the toy to spin and gravity directs its downward trajectory.
Figure 1
TE
AC
HE
R
PA
GE
S

POSSIBLE ANSWERS TO THE CONCLUSION QUESTIONS
1. In the helicopter experiment, what was the independent variable? The independent variable was folding the blades in different directions, with the black
circle up and the white square down, or with the black circle down and the white square up.
2. What was the dependent variable? The dependent variable is the direction of spin, clockwise or counterclockwise.
3. List three things you should try to keep constant each time you try this experiment. There are many correct answers for this question. Possible answers include:
o holding the helicopter in the same place (on the body versus the wing) o holding it at the same height o making sure there is no cross breeze each time o using the same helicopter o adding no extra force when letting it go each time
4. What is the problem question in Bonita’s experiment? Will adding paper clips for mass stabilize the helicopter and make it stay in the air longer?
5. What is Bonita’s hypothesis? If additional paperclips are added to the helicopter, then the helicopter will be stabilized
resulting in a longer flight time.
6. What is her independent variable? Bonita’s independent variable is the addition of paper clips (weight) to the helicopter.
7. What is her dependent variable? Bonita’s dependent variable is the amount of time the helicopter stays in the air.
TE
AC
HE
R
PA
GE
S
TE
AC
HE
R
PA
GE
S
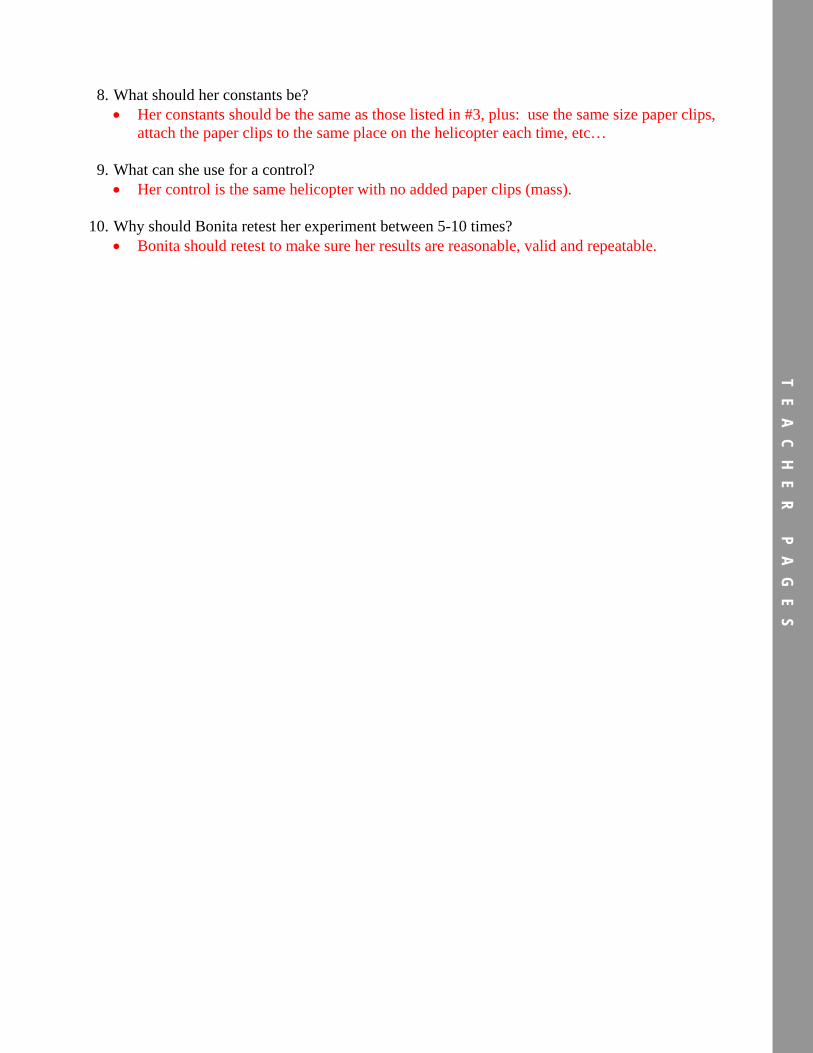
8. What should her constants be? Her constants should be the same as those listed in #3, plus: use the same size paper clips,
attach the paper clips to the same place on the helicopter each time, etc…
9. What can she use for a control? Her control is the same helicopter with no added paper clips (mass).
10. Why should Bonita retest her experiment between 5-10 times? Bonita should retest to make sure her results are reasonable, valid and repeatable.
TE
AC
HE
R
PA
GE
S
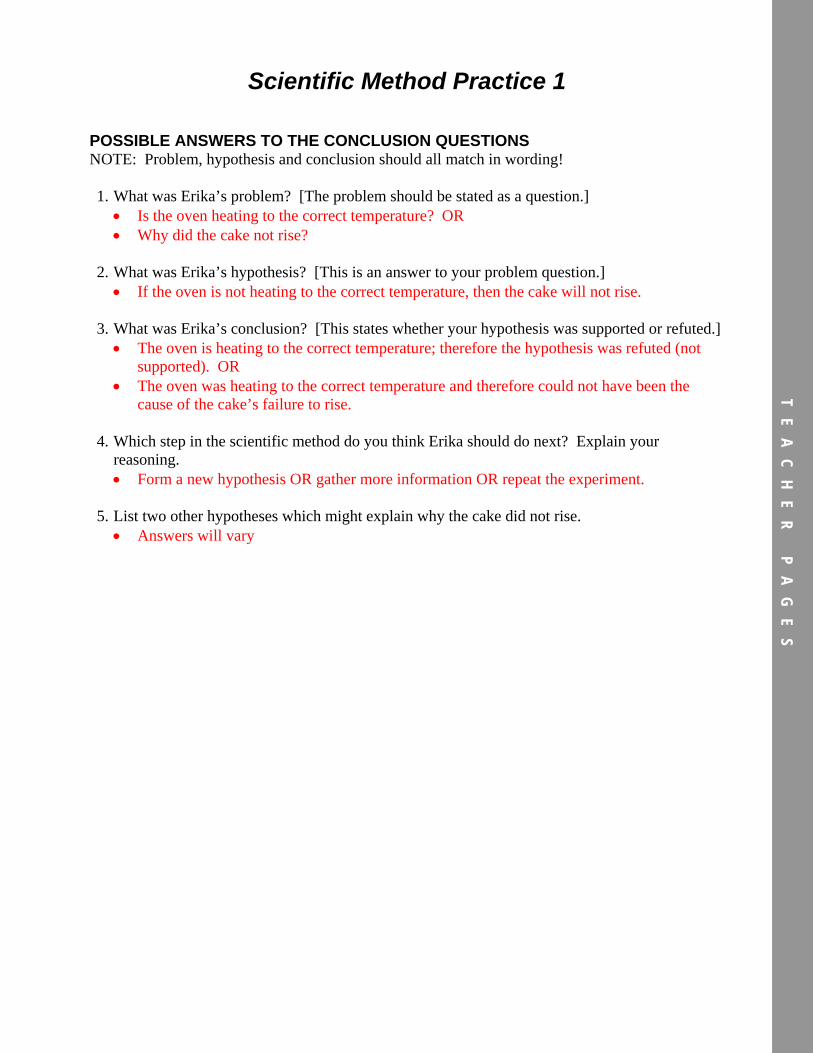
Scientific Method Practice 1
POSSIBLE ANSWERS TO THE CONCLUSION QUESTIONS NOTE: Problem, hypothesis and conclusion should all match in wording!
1. What was Erika’s problem? [The problem should be stated as a question.] Is the oven heating to the correct temperature? OR Why did the cake not rise?
2. What was Erika’s hypothesis? [This is an answer to your problem question.] If the oven is not heating to the correct temperature, then the cake will not rise.
3. What was Erika’s conclusion? [This states whether your hypothesis was supported or refuted.] The oven is heating to the correct temperature; therefore the hypothesis was refuted (not
supported). OR The oven was heating to the correct temperature and therefore could not have been the
cause of the cake’s failure to rise.
4. Which step in the scientific method do you think Erika should do next? Explain your reasoning. Form a new hypothesis OR gather more information OR repeat the experiment.
5. List two other hypotheses which might explain why the cake did not rise. Answers will vary
TE
AC
HE
R
PA
GE
S
The Scientific Method Exploring Experimental Design
Come Fly With Us
This assignment is intended to be a quick and easy guide to the methods scientists use to solve problems. It should also give you information about how to “wing your way” through your own experiments. You are going to start by making a model helicopter with the attached instructions. You will be given a problem question, and it is your job to write a suitable hypothesis. Remember, your hypothesis should be a possible answer to the problem question and it should be based upon what you already know about a topic.
GLOSSARY OF WORDS USED IN CONDUCTING EXPERIMENTS
problem: scientific question that can be answered by experimentation hypothesis: an educated prediction about how the independent variable will affect the dependent variable stated in a way that is testable (This should be an “If…then…” statement.) variable: a factor in an experiment that changes or could be changed independent variable: the variable that is changed on purpose dependent variable: the variable that responds to the independent variable control: the standard for comparison in an experiment; the independent variable is not applied to the control group constant: a factor in an experiment that is kept the same in all trials repeated trials: the number of times an experiment is repeated
PURPOSE In this assignment you will practice applying the steps of the scientific method.
MATERIALS
copy of helicopter model scissors pen or pencil
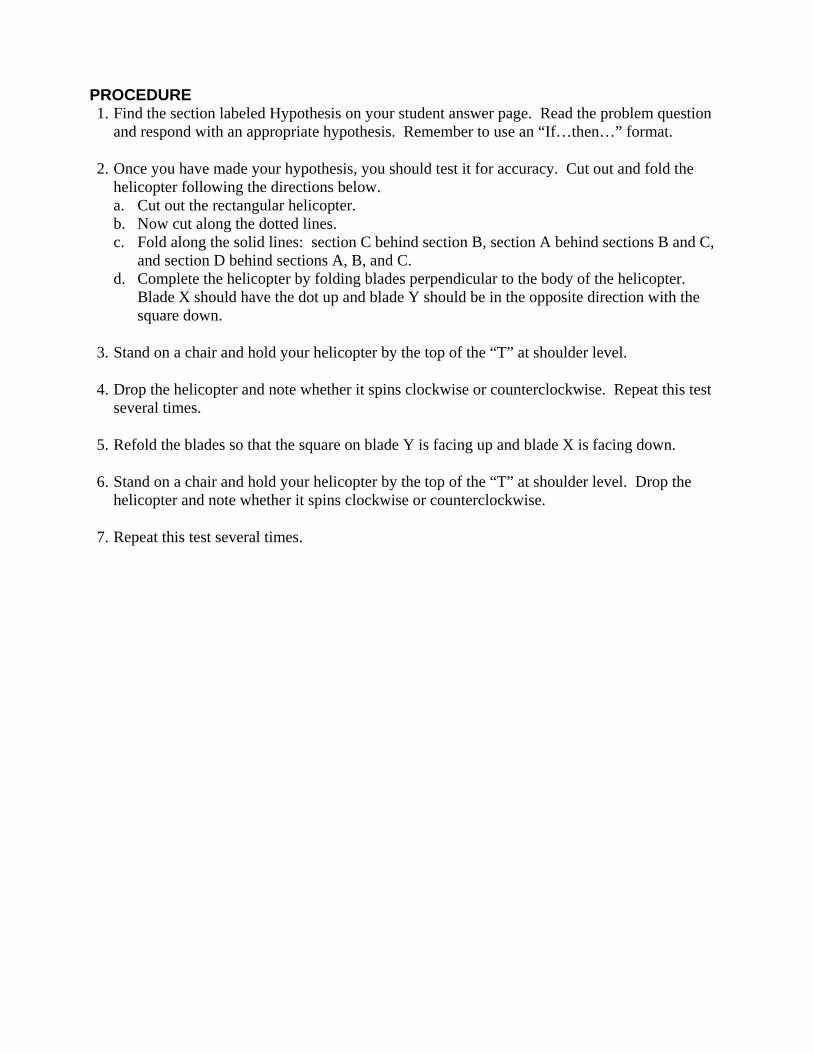
PROCEDURE 1. Find the section labeled Hypothesis on your student answer page. Read the problem question
and respond with an appropriate hypothesis. Remember to use an “If…then…” format.
2. Once you have made your hypothesis, you should test it for accuracy. Cut out and fold the helicopter following the directions below. a. Cut out the rectangular helicopter. b. Now cut along the dotted lines. c. Fold along the solid lines: section C behind section B, section A behind sections B and C,
and section D behind sections A, B, and C. d. Complete the helicopter by folding blades perpendicular to the body of the helicopter.
Blade X should have the dot up and blade Y should be in the opposite direction with the square down.
3. Stand on a chair and hold your helicopter by the top of the “T” at shoulder level.
4. Drop the helicopter and note whether it spins clockwise or counterclockwise. Repeat this test several times.
5. Refold the blades so that the square on blade Y is facing up and blade X is facing down.
6. Stand on a chair and hold your helicopter by the top of the “T” at shoulder level. Drop the helicopter and note whether it spins clockwise or counterclockwise.
7. Repeat this test several times.
The Scientific Method Exploring Experimental Design
Come Fly With Us
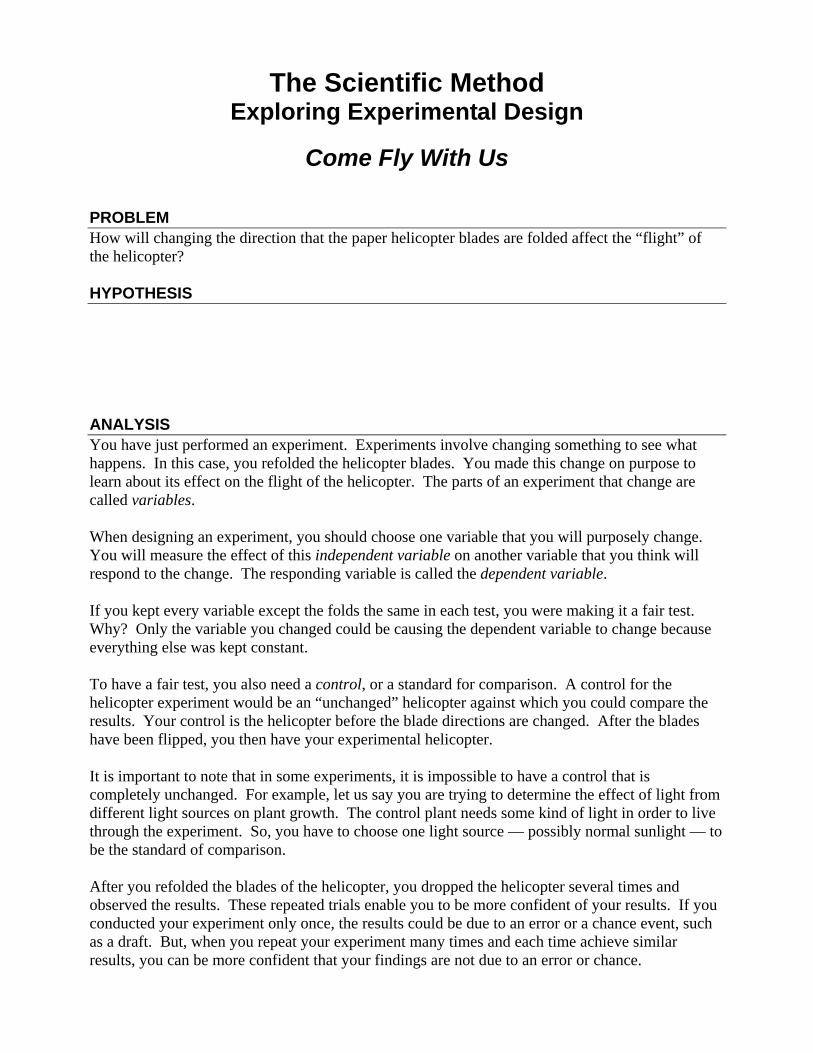
PROBLEM How will changing the direction that the paper helicopter blades are folded affect the “flight” of the helicopter?
HYPOTHESIS
ANALYSIS You have just performed an experiment. Experiments involve changing something to see what happens. In this case, you refolded the helicopter blades. You made this change on purpose to learn about its effect on the flight of the helicopter. The parts of an experiment that change are called variables.
When designing an experiment, you should choose one variable that you will purposely change. You will measure the effect of this independent variable on another variable that you think will respond to the change. The responding variable is called the dependent variable.
If you kept every variable except the folds the same in each test, you were making it a fair test. Why? Only the variable you changed could be causing the dependent variable to change because everything else was kept constant.
To have a fair test, you also need a control, or a standard for comparison. A control for the helicopter experiment would be an “unchanged” helicopter against which you could compare the results. Your control is the helicopter before the blade directions are changed. After the blades have been flipped, you then have your experimental helicopter.
It is important to note that in some experiments, it is impossible to have a control that is completely unchanged. For example, let us say you are trying to determine the effect of light from different light sources on plant growth. The control plant needs some kind of light in order to live through the experiment. So, you have to choose one light source — possibly normal sunlight — to be the standard of comparison.
After you refolded the blades of the helicopter, you dropped the helicopter several times and observed the results. These repeated trials enable you to be more confident of your results. If you conducted your experiment only once, the results could be due to an error or a chance event, such as a draft. But, when you repeat your experiment many times and each time achieve similar results, you can be more confident that your findings are not due to an error or chance.
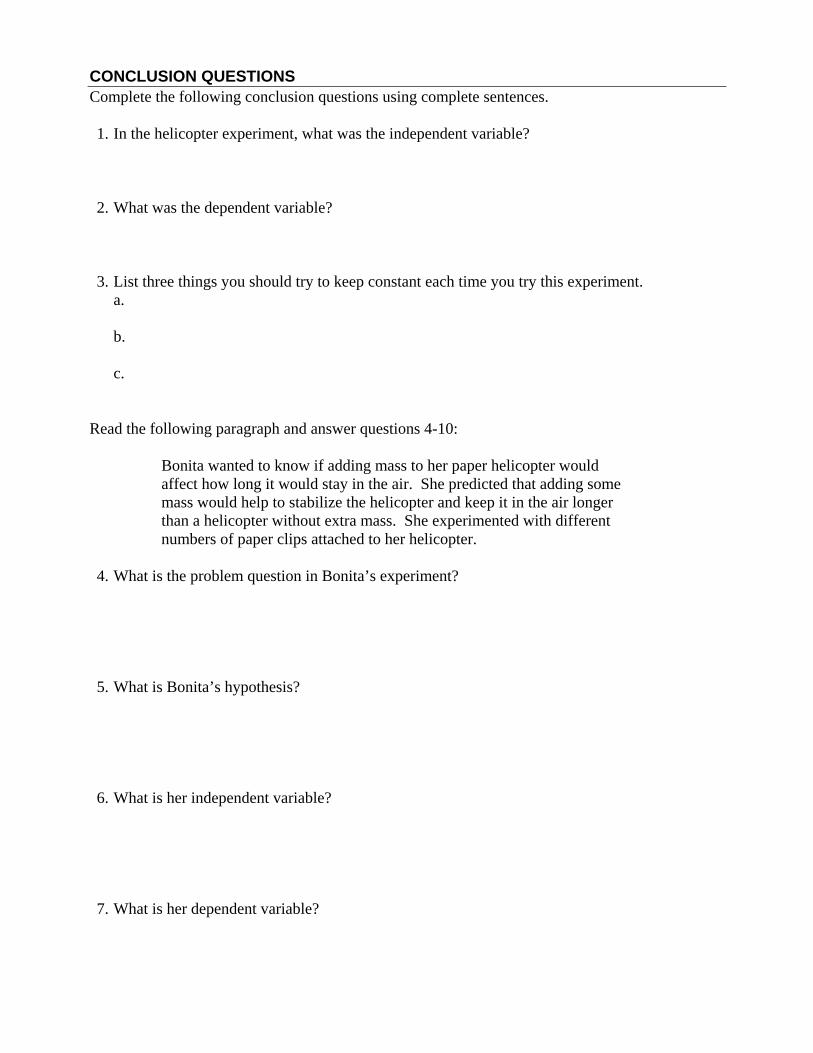
CONCLUSION QUESTIONS Complete the following conclusion questions using complete sentences.
1. In the helicopter experiment, what was the independent variable?
2. What was the dependent variable?
3. List three things you should try to keep constant each time you try this experiment. a. b. c.
Read the following paragraph and answer questions 4-10:
Bonita wanted to know if adding mass to her paper helicopter would affect how long it would stay in the air. She predicted that adding some mass would help to stabilize the helicopter and keep it in the air longer than a helicopter without extra mass. She experimented with different numbers of paper clips attached to her helicopter.
4. What is the problem question in Bonita’s experiment?
5. What is Bonita’s hypothesis?
6. What is her independent variable?
7. What is her dependent variable?
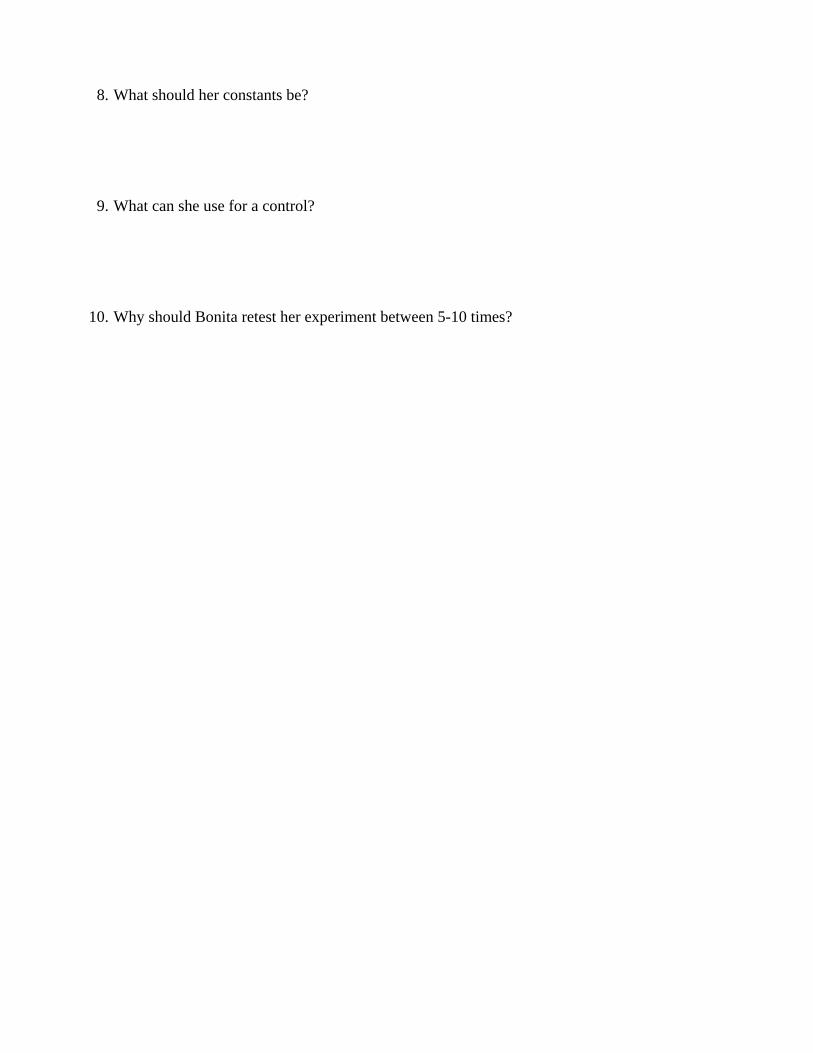
8. What should her constants be?
9. What can she use for a control?
10. Why should Bonita retest her experiment between 5-10 times?
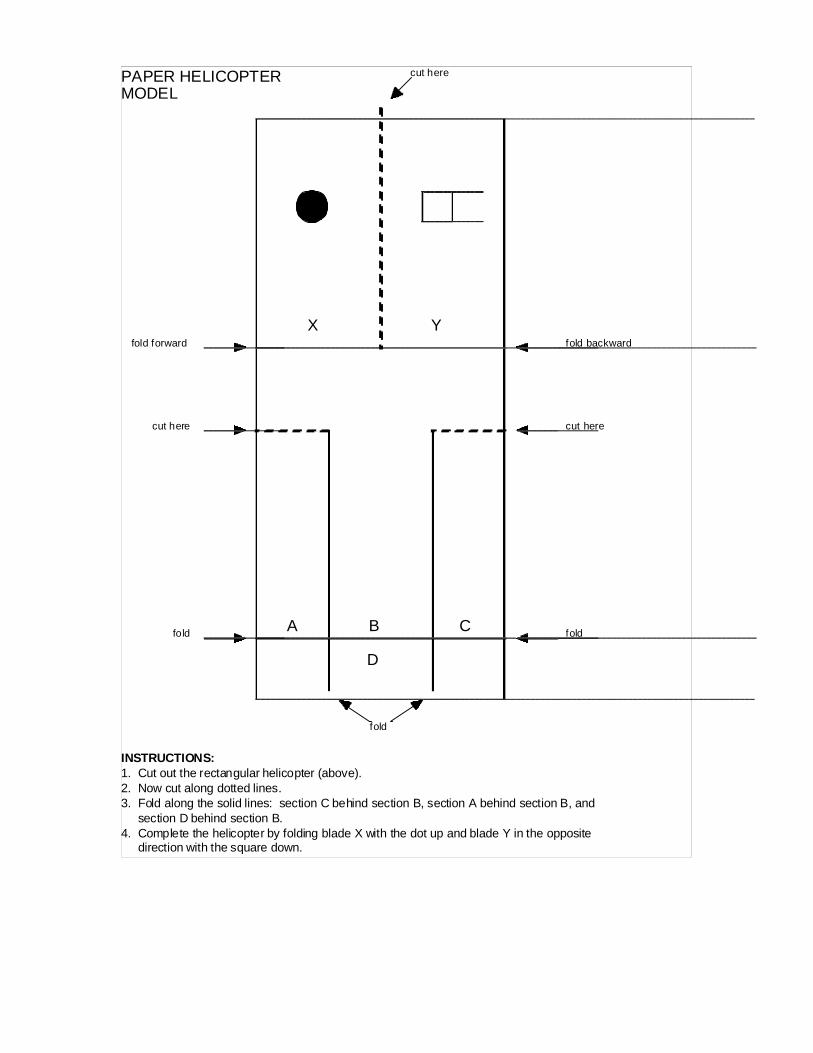
PAPER HELICOPTER MODEL
X Y
INSTRUCTIONS: 1. Cut out the rectangular helicopter (above).2. Now cut along dotted lines. 3. Fold along the solid lines: section C behind section B, section A behind section B, and section D behind section B. 4. Complete the helicopter by folding blade X with the dot up and blade Y in the opposite direction with the square down.
cut here
A B C
D
fold forward fold backward
cut here cut here
fold fold
fold
The Scientific Method Exploring Experimental Design
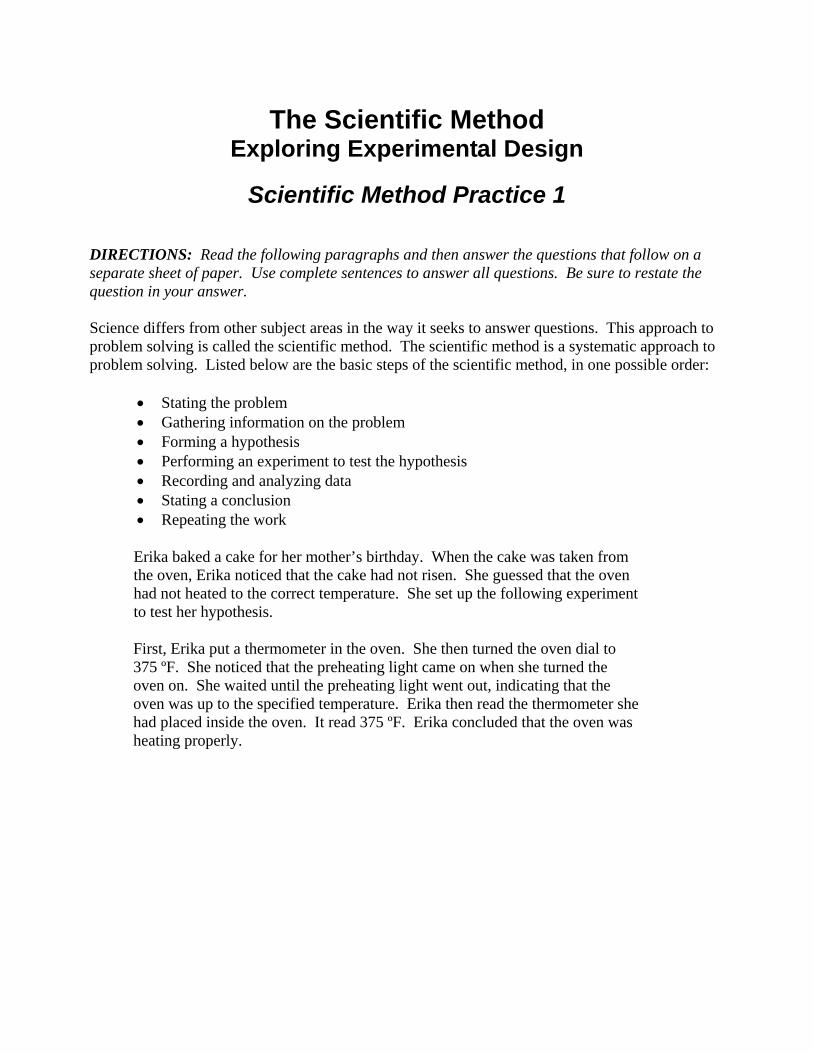
Scientific Method Practice 1
DIRECTIONS: Read the following paragraphs and then answer the questions that follow on a separate sheet of paper. Use complete sentences to answer all questions. Be sure to restate the question in your answer. Science differs from other subject areas in the way it seeks to answer questions. This approach to problem solving is called the scientific method. The scientific method is a systematic approach to problem solving. Listed below are the basic steps of the scientific method, in one possible order:
Stating the problem Gathering information on the problem Forming a hypothesis Performing an experiment to test the hypothesis Recording and analyzing data Stating a conclusion Repeating the work
Erika baked a cake for her mother’s birthday. When the cake was taken from the oven, Erika noticed that the cake had not risen. She guessed that the oven had not heated to the correct temperature. She set up the following experiment to test her hypothesis.
First, Erika put a thermometer in the oven. She then turned the oven dial to 375 ºF. She noticed that the preheating light came on when she turned the oven on. She waited until the preheating light went out, indicating that the oven was up to the specified temperature. Erika then read the thermometer she had placed inside the oven. It read 375 ºF. Erika concluded that the oven was heating properly.
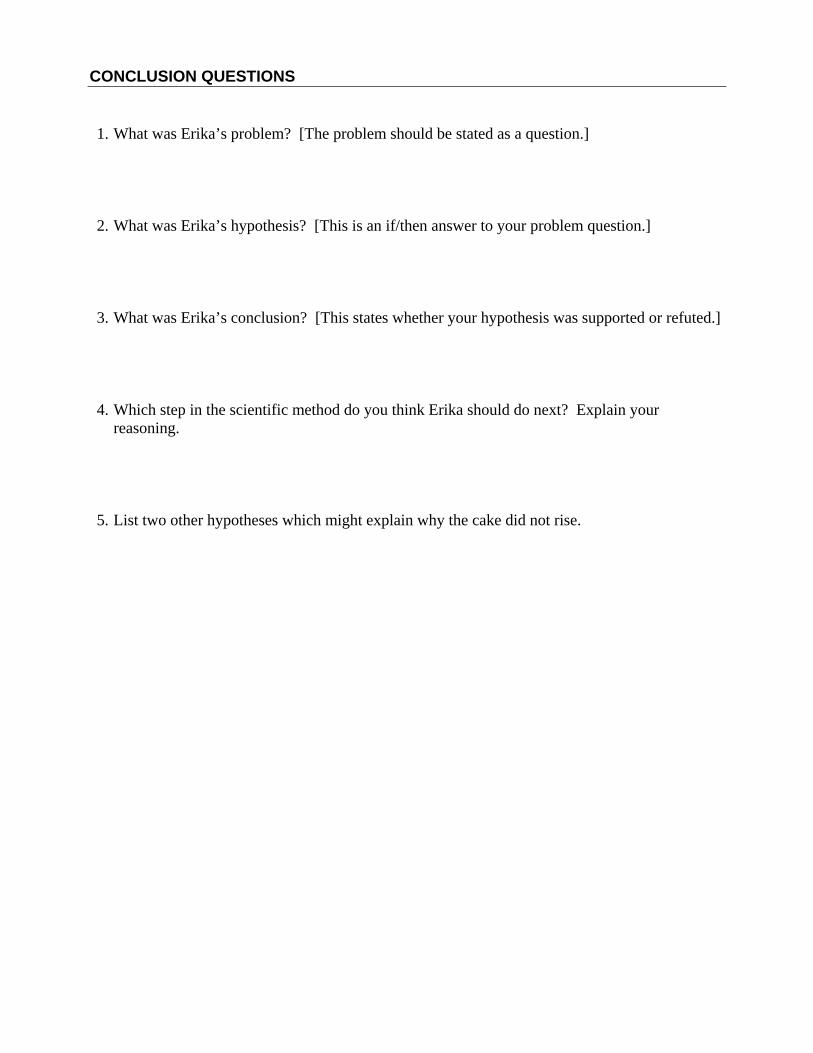
CONCLUSION QUESTIONS
1. What was Erika’s problem? [The problem should be stated as a question.]
2. What was Erika’s hypothesis? [This is an if/then answer to your problem question.]
3. What was Erika’s conclusion? [This states whether your hypothesis was supported or refuted.]
4. Which step in the scientific method do you think Erika should do next? Explain your reasoning.
5. List two other hypotheses which might explain why the cake did not rise.
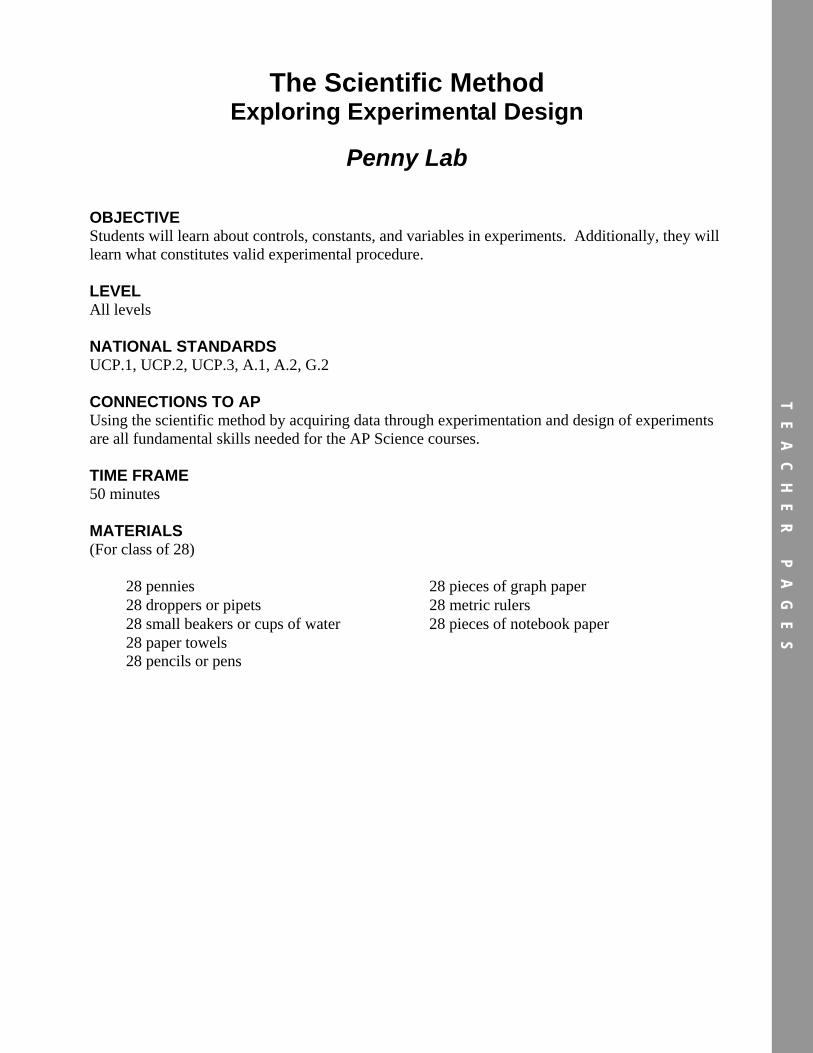
The Scientific Method Exploring Experimental Design
Penny Lab
OBJECTIVE Students will learn about controls, constants, and variables in experiments. Additionally, they will learn what constitutes valid experimental procedure.
LEVEL All levels
NATIONAL STANDARDS UCP.1, UCP.2, UCP.3, A.1, A.2, G.2
CONNECTIONS TO AP Using the scientific method by acquiring data through experimentation and design of experiments are all fundamental skills needed for the AP Science courses.
TIME FRAME 50 minutes
MATERIALS (For class of 28)
28 pennies 28 pieces of graph paper 28 droppers or pipets 28 metric rulers 28 small beakers or cups of water 28 pieces of notebook paper 28 paper towels 28 pencils or pens
TE
AC
HE
R
PA
GE
S
TEACHER NOTES
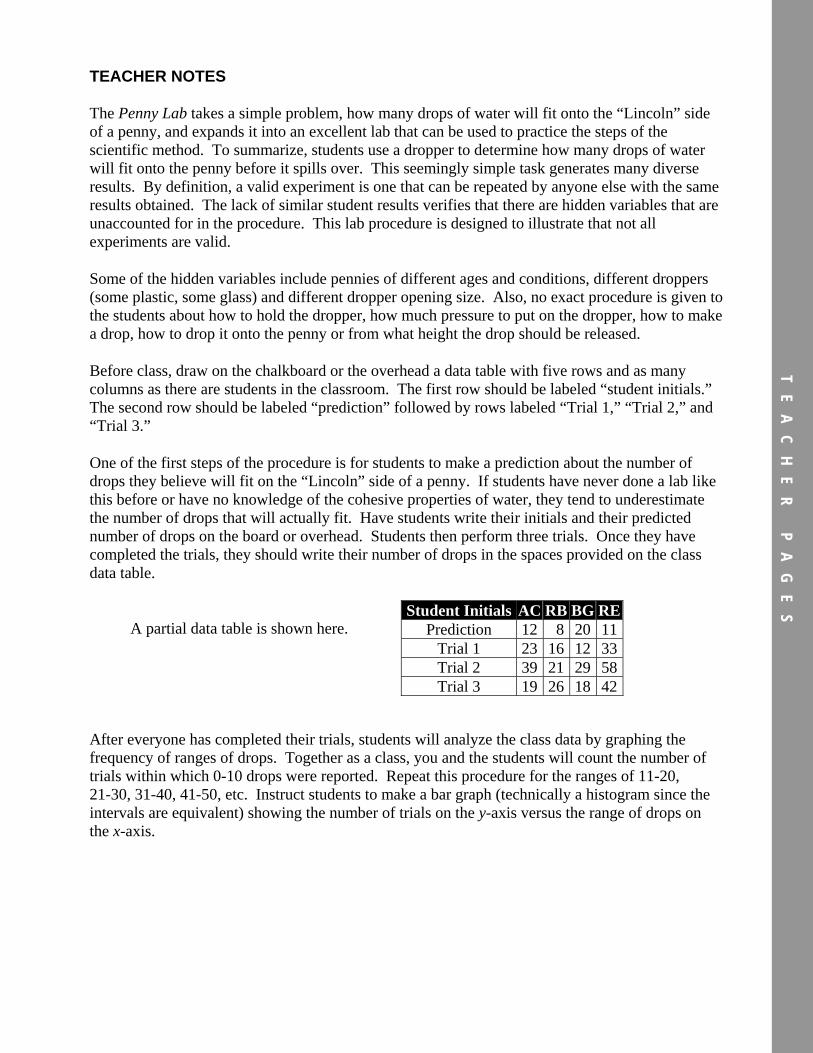
The Penny Lab takes a simple problem, how many drops of water will fit onto the “Lincoln” side of a penny, and expands it into an excellent lab that can be used to practice the steps of the scientific method. To summarize, students use a dropper to determine how many drops of water will fit onto the penny before it spills over. This seemingly simple task generates many diverse results. By definition, a valid experiment is one that can be repeated by anyone else with the same results obtained. The lack of similar student results verifies that there are hidden variables that are unaccounted for in the procedure. This lab procedure is designed to illustrate that not all experiments are valid.
Some of the hidden variables include pennies of different ages and conditions, different droppers (some plastic, some glass) and different dropper opening size. Also, no exact procedure is given to the students about how to hold the dropper, how much pressure to put on the dropper, how to make a drop, how to drop it onto the penny or from what height the drop should be released.
Before class, draw on the chalkboard or the overhead a data table with five rows and as many columns as there are students in the classroom. The first row should be labeled “student initials.” The second row should be labeled “prediction” followed by rows labeled “Trial 1,” “Trial 2,” and “Trial 3.”
One of the first steps of the procedure is for students to make a prediction about the number of drops they believe will fit on the “Lincoln” side of a penny. If students have never done a lab like this before or have no knowledge of the cohesive properties of water, they tend to underestimate the number of drops that will actually fit. Have students write their initials and their predicted number of drops on the board or overhead. Students then perform three trials. Once they have completed the trials, they should write their number of drops in the spaces provided on the class data table.
A partial data table is shown here.
After everyone has completed their trials, students will analyze the class data by graphing the frequency of ranges of drops. Together as a class, you and the students will count the number of trials within which 0-10 drops were reported. Repeat this procedure for the ranges of 11-20, 21-30, 31-40, 41-50, etc. Instruct students to make a bar graph (technically a histogram since the intervals are equivalent) showing the number of trials on the y-axis versus the range of drops on the x-axis.
Student Initials AC RB BG RE Prediction 12 8 20 11
Trial 1 23 16 12 33 Trial 2 39 21 29 58 Trial 3 19 26 18 42
TE
AC
HE
R
PA
GE
S

Here is an example of a possible student histogram.
15
10
5
0
Num
ber o
f Peo
ple
Number of Drops0-10 11-20 21-30 31-40 41-50 51-60
Frequency of Actual Number of Drops Put on a Penny
Before the students answer the conclusion questions, lead a discussion with students to identify the aspects of a valid versus invalid experiment. Most students come to the conclusion that this is an invalid experiment due to the variety of results. The discussion can also include the idea of hidden variables that were not held constant. These will include: different droppers, different pennies, no exact procedure for dropping, no definition of “drop,” unstable table, etc. You can reveal to the students that this lab was purposely designed to produce invalid results so that students could begin to understand that even in a simple task there can be many hidden variables.
TE
AC
HE
R
PA
GE
S
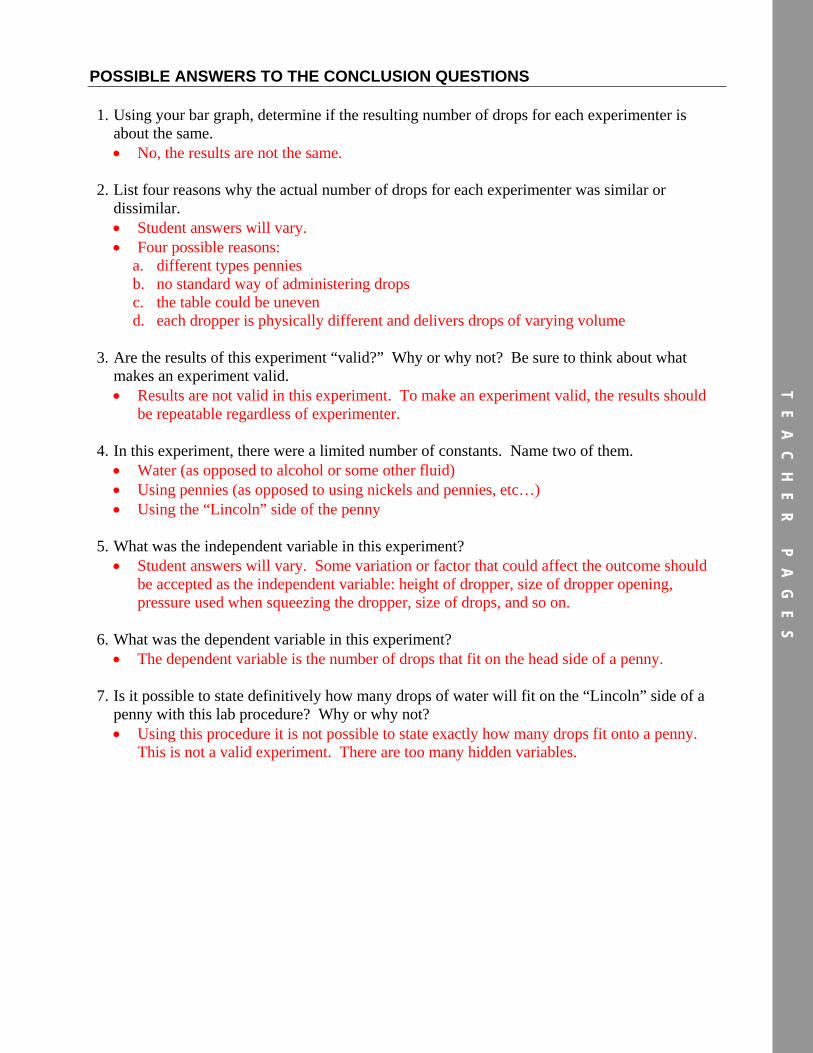
POSSIBLE ANSWERS TO THE CONCLUSION QUESTIONS 1. Using your bar graph, determine if the resulting number of drops for each experimenter is
about the same. No, the results are not the same.
2. List four reasons why the actual number of drops for each experimenter was similar or dissimilar. Student answers will vary. Four possible reasons:
a. different types pennies b. no standard way of administering drops c. the table could be uneven d. each dropper is physically different and delivers drops of varying volume
3. Are the results of this experiment “valid?” Why or why not? Be sure to think about what makes an experiment valid. Results are not valid in this experiment. To make an experiment valid, the results should
be repeatable regardless of experimenter.
4. In this experiment, there were a limited number of constants. Name two of them. Water (as opposed to alcohol or some other fluid) Using pennies (as opposed to using nickels and pennies, etc…) Using the “Lincoln” side of the penny
5. What was the independent variable in this experiment? Student answers will vary. Some variation or factor that could affect the outcome should
be accepted as the independent variable: height of dropper, size of dropper opening, pressure used when squeezing the dropper, size of drops, and so on.
6. What was the dependent variable in this experiment? The dependent variable is the number of drops that fit on the head side of a penny.
7. Is it possible to state definitively how many drops of water will fit on the “Lincoln” side of a penny with this lab procedure? Why or why not? Using this procedure it is not possible to state exactly how many drops fit onto a penny.
This is not a valid experiment. There are too many hidden variables.
TE
AC
HE
R
PA
GE
S
Scientific Method Practice 2
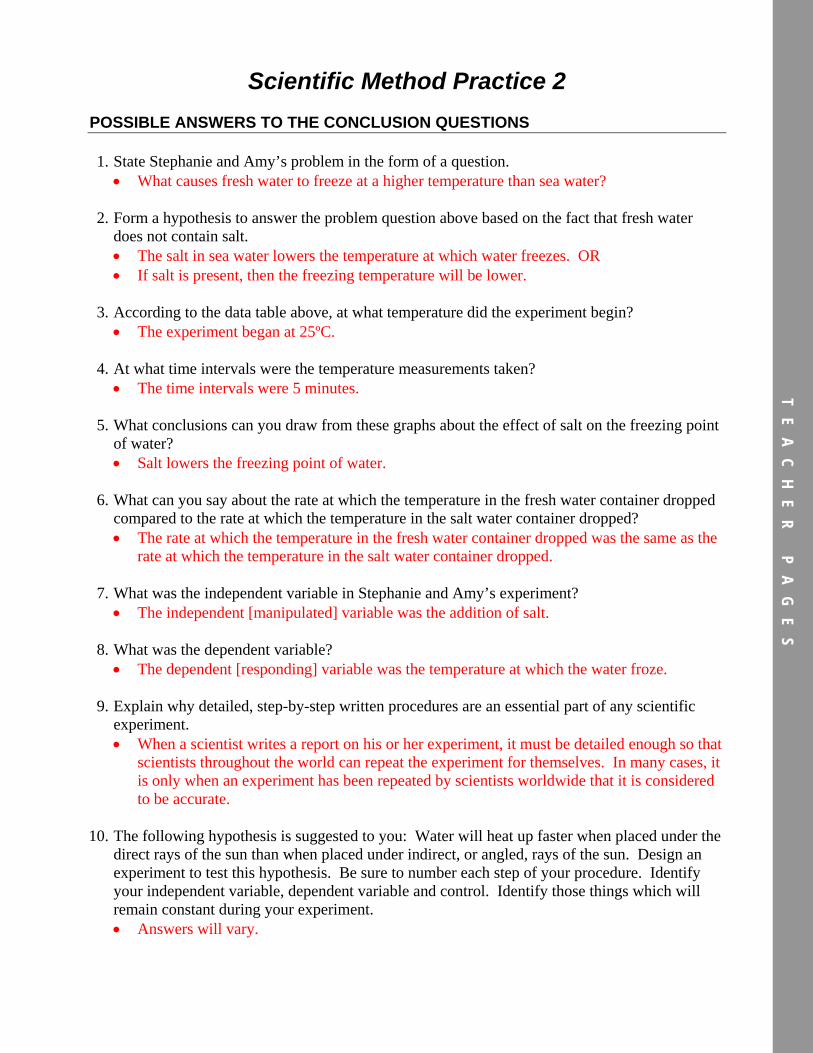
POSSIBLE ANSWERS TO THE CONCLUSION QUESTIONS
1. State Stephanie and Amy’s problem in the form of a question. What causes fresh water to freeze at a higher temperature than sea water?
2. Form a hypothesis to answer the problem question above based on the fact that fresh water does not contain salt. The salt in sea water lowers the temperature at which water freezes. OR If salt is present, then the freezing temperature will be lower.
3. According to the data table above, at what temperature did the experiment begin? The experiment began at 25ºC.
4. At what time intervals were the temperature measurements taken? The time intervals were 5 minutes.
5. What conclusions can you draw from these graphs about the effect of salt on the freezing point of water? Salt lowers the freezing point of water.
6. What can you say about the rate at which the temperature in the fresh water container dropped compared to the rate at which the temperature in the salt water container dropped? The rate at which the temperature in the fresh water container dropped was the same as the
rate at which the temperature in the salt water container dropped.
7. What was the independent variable in Stephanie and Amy’s experiment? The independent [manipulated] variable was the addition of salt.
8. What was the dependent variable? The dependent [responding] variable was the temperature at which the water froze.
9. Explain why detailed, step-by-step written procedures are an essential part of any scientific experiment. When a scientist writes a report on his or her experiment, it must be detailed enough so that
scientists throughout the world can repeat the experiment for themselves. In many cases, it is only when an experiment has been repeated by scientists worldwide that it is considered to be accurate.
10. The following hypothesis is suggested to you: Water will heat up faster when placed under the direct rays of the sun than when placed under indirect, or angled, rays of the sun. Design an experiment to test this hypothesis. Be sure to number each step of your procedure. Identify your independent variable, dependent variable and control. Identify those things which will remain constant during your experiment. Answers will vary.
TE
AC
HE
R
PT
EA
CH
ER
P
AG
ES
The Scientific Method Exploring Experimental Design
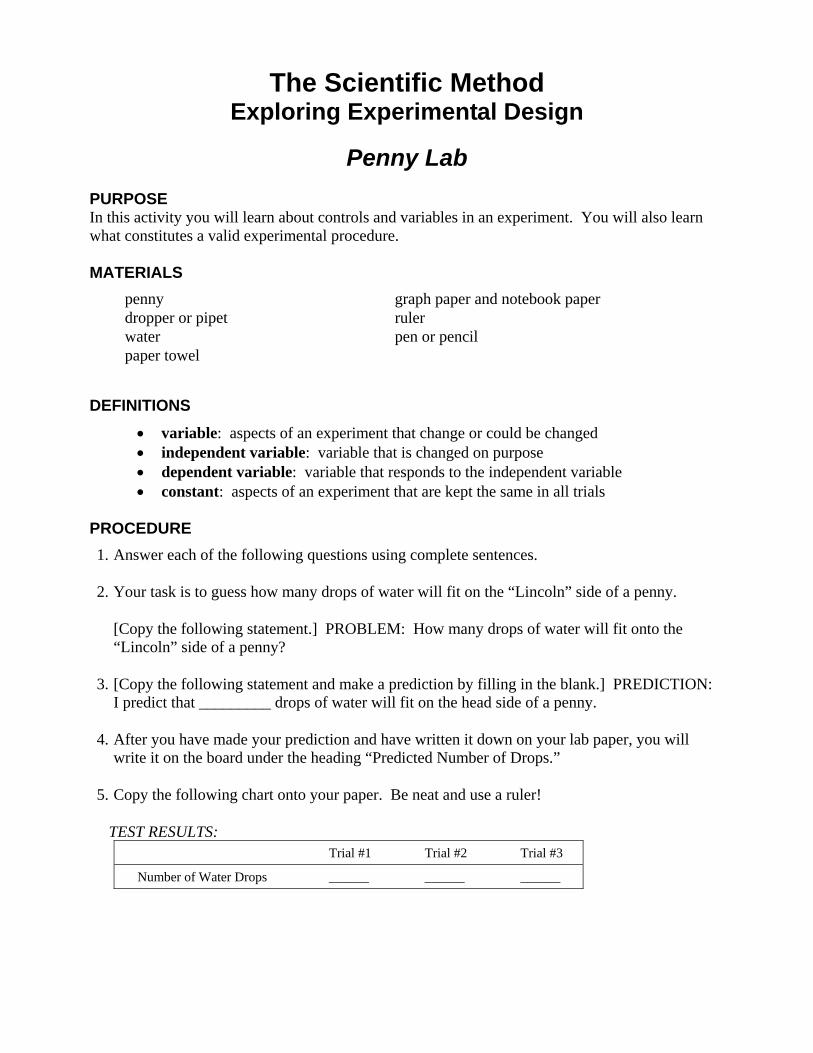
Penny Lab PURPOSE In this activity you will learn about controls and variables in an experiment. You will also learn what constitutes a valid experimental procedure.
MATERIALS
penny graph paper and notebook paper dropper or pipet ruler water pen or pencil paper towel
DEFINITIONS
variable: aspects of an experiment that change or could be changed independent variable: variable that is changed on purpose dependent variable: variable that responds to the independent variable constant: aspects of an experiment that are kept the same in all trials
PROCEDURE
1. Answer each of the following questions using complete sentences.
2. Your task is to guess how many drops of water will fit on the “Lincoln” side of a penny.
[Copy the following statement.] PROBLEM: How many drops of water will fit onto the “Lincoln” side of a penny?
3. [Copy the following statement and make a prediction by filling in the blank.] PREDICTION: I predict that _________ drops of water will fit on the head side of a penny.
4. After you have made your prediction and have written it down on your lab paper, you will write it on the board under the heading “Predicted Number of Drops.”
5. Copy the following chart onto your paper. Be neat and use a ruler!
TEST RESULTS: Trial #1 Trial #2 Trial #3
Number of Water Drops ______ ______ ______
6. Test to see if your prediction is correct. Place your penny on a paper towel and, using the dropper, add water to the “Lincoln” side of the penny, one drop at a time, counting each drop until the water spills over. Do not count the drop that causes the water to spill over. Write the number of drops you counted under Trial #1 on your chart. Repeat this procedure two more times. Fill in the number of drops you count for each trial under the appropriate heading on your Test Results chart.
7. Then write your number of drops for each trial on the chalkboard next to the appropriate heading.
8. Write a sentence that will serve as your conclusion for this experiment. This conclusion should state if your prediction matched the actual data.
9. Make a bar graph of the class data. Before graphing, you will need to organize the class data into ranges — make a chart that shows how many trials got results between 0-10, 11-20, 21-30, etc. The x-axis (horizontal line) should be titled “Average Number of Drops” and the y-axis (vertical line) should be titled “Number of Trials.” You will be graphing the total number of trials in your class that got a result within a range of numbers. For example, if 5 people got a result between 0 and 10, you would graph this data as your first bar. The next bar would be for all of those who got a result between 11 and 20 drops. When you have finished your bar graph, give it an appropriate title.
10. Answer the conclusion questions on your paper. Be sure to use complete sentences.
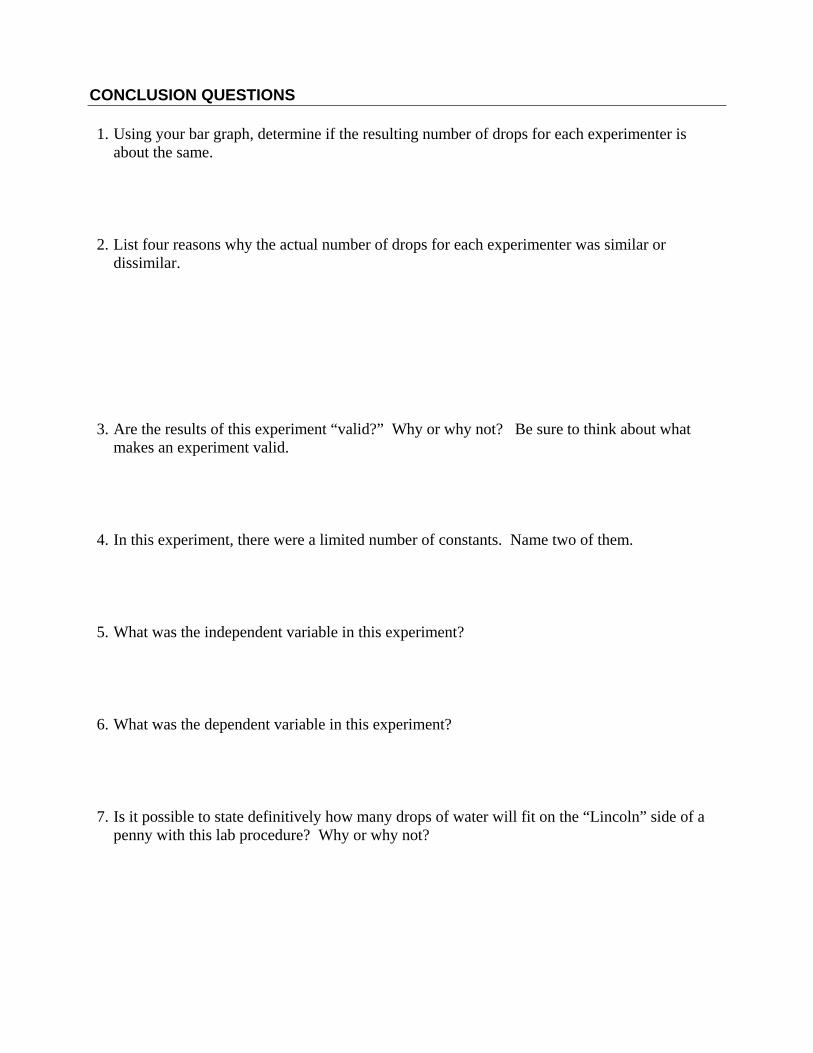
CONCLUSION QUESTIONS
1. Using your bar graph, determine if the resulting number of drops for each experimenter is about the same.
2. List four reasons why the actual number of drops for each experimenter was similar or dissimilar.
3. Are the results of this experiment “valid?” Why or why not? Be sure to think about what makes an experiment valid.
4. In this experiment, there were a limited number of constants. Name two of them.
5. What was the independent variable in this experiment?
6. What was the dependent variable in this experiment?
7. Is it possible to state definitively how many drops of water will fit on the “Lincoln” side of a penny with this lab procedure? Why or why not?
The Scientific Method Exploring Experimental Design
Scientific Method Practice 2
DIRECTIONS: Answer these questions on a separate sheet of paper using complete sentences to answer all questions. Be sure to restate the question in your answer! Stephanie and Amy were vacationing in Canada. Bundled up in warm clothing, they walked along the beach. Glistening strips of ice hung from the roofs of the beach houses. Only yesterday, Stephanie commented, these beautiful icicles had been a mass of melting snow. Throughout the night, the melted snow had continued to drip, freezing into lovely shapes. Near the ocean's edge, Amy spied a small pool of sea water. Surprisingly, she observed the sea water was not frozen like the icicles on the roofs. What could be the reason, they wondered?
A scientist might begin to solve the problem by gathering information. The scientist would first find out how the sea water in the pool differs from the fresh water on the roof. This information might include the following facts: The pool of sea water rests on sand, while the fresh water drips along a tar roof. The sea water is exposed to the cold air for less time than the fresh water. The sea water is saltier than the fresh water.
Using all of the information that has been gathered, the scientist might be prepared to suggest a possible solution to the problem. A proposed explanation or solution to a scientific problem is called a hypothesis. A hypothesis almost always follows the gathering of information about a problem. Sometimes, however, a hypothesis is a sudden idea that springs from a new and original way of looking at a problem.
A scientist (or a science student) does not stop once a hypothesis has been suggested. In science, evidence that either supports a hypothesis or does not support it must be found. This means that a hypothesis must be tested to show whether it is supported. Such testing is usually done by performing experiments.
Experiments are performed according to specific rules. By following these rules, scientists can be confident that the evidence they uncover will clearly support or not support their hypothesis. For the problem of the sea water and freshwater, a scientist would have to design an experiment that ruled out every factor but salt as the cause of the different freezing temperatures. Stephanie and Amy, being excellent science students, set up their experiment in the following manner.
First, they put equal amounts of fresh water into two identical containers. Then Stephanie added salt to only one of the containers. [The salt is the independent variable. In any experiment, only one independent variable should be tested at a time. In this way, scientists can be fairly certain that the results of the experiment are caused by one and only one factor — in this case the variable of salt.] To eliminate the possibility of hidden or unknown variables, Stephanie and Amy conducted a controlled experiment. A control group is set up exactly like the one that contains the variable. The only difference is that the control setup does not contain the independent variable. Scientists compare the results of the experimental setup to the control setup.
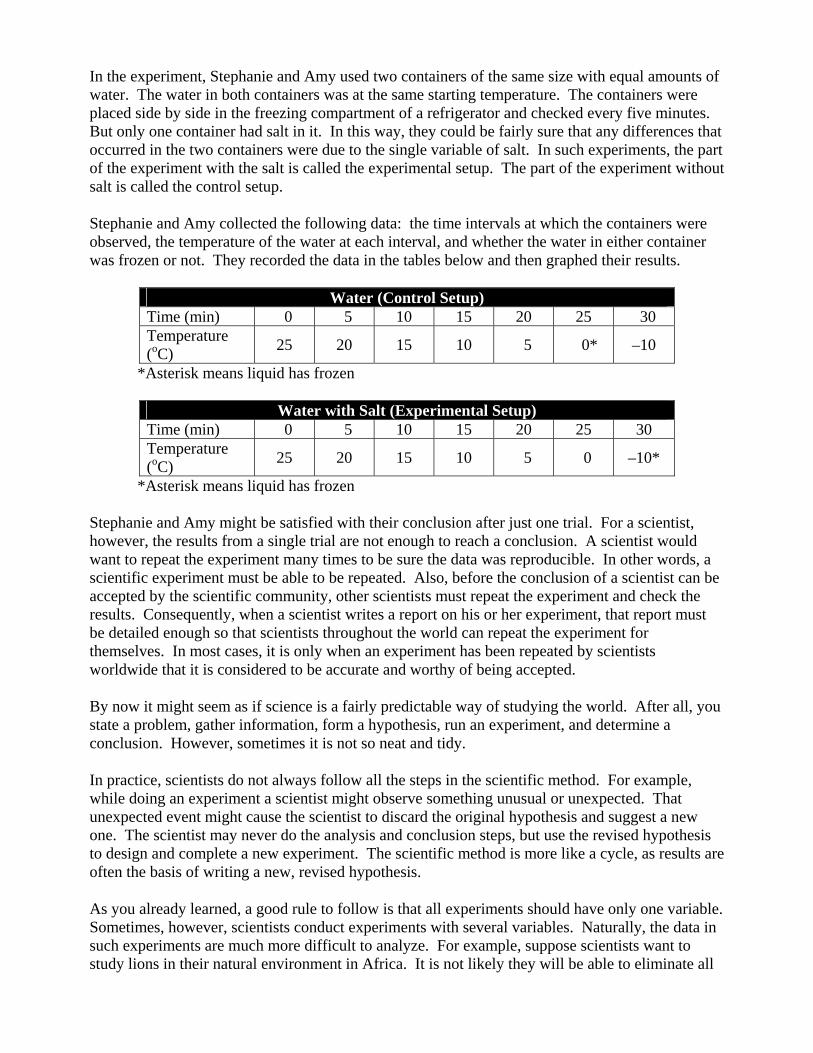
In the experiment, Stephanie and Amy used two containers of the same size with equal amounts of water. The water in both containers was at the same starting temperature. The containers were placed side by side in the freezing compartment of a refrigerator and checked every five minutes. But only one container had salt in it. In this way, they could be fairly sure that any differences that occurred in the two containers were due to the single variable of salt. In such experiments, the part of the experiment with the salt is called the experimental setup. The part of the experiment without salt is called the control setup.
Stephanie and Amy collected the following data: the time intervals at which the containers were observed, the temperature of the water at each interval, and whether the water in either container was frozen or not. They recorded the data in the tables below and then graphed their results.
Water (Control Setup) Time (min) 0 5 10 15 20 25 30 Temperature (oC)
25 20 15 10 5 0* –10
*Asterisk means liquid has frozen
Water with Salt (Experimental Setup) Time (min) 0 5 10 15 20 25 30 Temperature (oC)
25 20 15 10 5 0 –10*
*Asterisk means liquid has frozen Stephanie and Amy might be satisfied with their conclusion after just one trial. For a scientist, however, the results from a single trial are not enough to reach a conclusion. A scientist would want to repeat the experiment many times to be sure the data was reproducible. In other words, a scientific experiment must be able to be repeated. Also, before the conclusion of a scientist can be accepted by the scientific community, other scientists must repeat the experiment and check the results. Consequently, when a scientist writes a report on his or her experiment, that report must be detailed enough so that scientists throughout the world can repeat the experiment for themselves. In most cases, it is only when an experiment has been repeated by scientists worldwide that it is considered to be accurate and worthy of being accepted.
By now it might seem as if science is a fairly predictable way of studying the world. After all, you state a problem, gather information, form a hypothesis, run an experiment, and determine a conclusion. However, sometimes it is not so neat and tidy.
In practice, scientists do not always follow all the steps in the scientific method. For example, while doing an experiment a scientist might observe something unusual or unexpected. That unexpected event might cause the scientist to discard the original hypothesis and suggest a new one. The scientist may never do the analysis and conclusion steps, but use the revised hypothesis to design and complete a new experiment. The scientific method is more like a cycle, as results are often the basis of writing a new, revised hypothesis.
As you already learned, a good rule to follow is that all experiments should have only one variable. Sometimes, however, scientists conduct experiments with several variables. Naturally, the data in such experiments are much more difficult to analyze. For example, suppose scientists want to study lions in their natural environment in Africa. It is not likely they will be able to eliminate all
the variables in the environment and concentrate on just a single lion. So, although a single variable is a good rule and you will follow this rule in almost all of the experiments you design or perform, it is not always practical in the real world.
CONCLUSION QUESTIONS
1. State Stephanie and Amy’s problem in the form of a question.
2. Form a hypothesis to answer the problem question above based on the fact that fresh water does not contain salt.
3. According to the data table from Stephanie and Amy’s experiment, at what temperature did the experiment begin?
4. At what time intervals were the temperature measurements taken?
5. What conclusions can you draw from these data tables about the effect of salt on the freezing point of water?
6. What can you say about the rate at which the temperature in the fresh water container dropped compared to the rate at which the temperature in the salt water container dropped?
7. What was the independent variable in Stephanie and Amy’s experiment?
8. What was the dependent variable?
9. Explain why detailed, step-by-step written procedures are an essential part of any scientific experiment.
10. The following hypothesis is suggested to you: Water will heat up faster when placed under the direct rays of the sun than when placed under indirect, or angled, rays of the sun. Design an experiment to test this hypothesis. Be sure to number each step of your procedure. Identify your independent variable, dependent variable and control. Identify those things which will remain constant during your experiment.