the role of stereo vision in visual–vestibular integration · seeing and perceiving 24 (2011)...
TRANSCRIPT

Seeing and Perceiving 24 (2011) 453–470 brill.nl/sp
The Role of Stereo Vision in Visual–Vestibular Integration ∗
John S. Butler 1,2,∗∗, Jennifer L. Campos 1,3,4,5, Heinrich H. Bülthoff 1,6,∗∗ and
Stuart T. Smith 7
1 Max-Planck Institute for Biological Cybernetics, Spemannstrasse 38, Tübingen 72076, Germany2 Department of Pediatrics, Albert Einstein College of Medicine, Bronx, New York 10461, USA
3 Toronto Rehabilitation Institute, Toronto, Canada4 Department of Psychology, University of Toronto, Toronto, Canada
5 Centre for Vision Research, York University, Toronto, Canada6 Department of Brain and Cognitive Engineering, Korea University, South Korea
7 Neuroscience Research Australia, Randwick, NSW 2031, Australia
Received 14 January 2011; accepted 9 June 2011
AbstractSelf-motion through an environment stimulates several sensory systems, including the visual system andthe vestibular system. Recent work in heading estimation has demonstrated that visual and vestibular cuesare typically integrated in a statistically optimal manner, consistent with Maximum Likelihood Estimationpredictions. However, there has been some indication that cue integration may be affected by character-istics of the visual stimulus. Therefore, the current experiment evaluated whether presenting optic flowstimuli stereoscopically, or presenting both eyes with the same image (binocularly) affects combined visual–vestibular heading estimates.
Participants performed a two-interval forced-choice task in which they were asked which of two pre-sented movements was more rightward. They were presented with either visual cues alone, vestibular cuesalone or both cues combined. Measures of reliability were obtained for both binocular and stereoscopicconditions.
Group level analyses demonstrated that when stereoscopic information was available there was clear ev-idence of optimal integration, yet when only binocular information was available weaker evidence of cueintegration was observed. Exploratory individual analyses demonstrated that for the stereoscopic condition90% of participants exhibited optimal integration, whereas for the binocular condition only 60% of partici-pants exhibited results consistent with optimal integration. Overall, these findings suggest that stereo visionmay be important for self-motion perception, particularly under combined visual–vestibular conditions.© Koninklijke Brill NV, Leiden, 2011
* This article is part of the Multisensorial Perception Collection, guest edited by S. Wuerger, D. Alais andM. Gondan.** To whom correspondence should be addressed. E-mail: [email protected];[email protected]
© Koninklijke Brill NV, Leiden, 2011 DOI:10.1163/187847511X588070

454 J. S. Butler et al. / Seeing and Perceiving 24 (2011) 453–470
KeywordsStereo vision, multi-sensory integration, self-motion perception, maximum likelihood estimation, vestibular
1. Introduction
1.1. Visual–Vestibular Integration for Heading Perception
During self-motion through space several different sensory systems provide infor-mation about travelled distance, speed and direction of movement (i.e., heading),including important visual and vestibular information. Optic flow is the stream ofretinal information generated during self-movement through space, while vestibu-lar information is provided through the inner ear organs (otoliths and semicircularcanals), which provide information about changing velocities. In the context ofheading in particular, past research has demonstrated that both optic flow (Lappeet al., 1999; Royden et al., 1992; Warren and Hannon, 1990) and vestibular infor-mation (Butler et al., 2010; Fetsch et al., 2009; Gu et al., 2007, 2008, 2010; Ohmi,1996; Telford et al., 1995) can be used independently to judge heading. However,until very recently, there has been little understanding of how these two sources ofsensory information are integrated in the brain. Based on maximum likelihood es-timation (MLE) models, new evidence from both humans and non-human primatesdemonstrates that visual and vestibular information are typically combined in a ‘sta-tistically optimal fashion’ (Butler et al., 2010; Fetsch et al., 2009; Gu et al., 2008).Specifically, both psychophysical measures and neural responses demonstrate a re-duction in variance when visual and vestibular cue are combined (i.e., multisensoryconditions), compared to the response patterns when either cue is available alone(i.e., unisensory conditions). Conversely, a recent paper by de Winkel et al. (2010)reported no reduction in variance for combined cue estimates as would be predictedby MLE. Importantly, however, there were differences between the visual stimuluspresentation used by de Winkel et al. (2010) compared to past studies, which mayaccount for these discrepant findings (as will be discussed in greater detail below).
Primate neurophysiological studies have shown that neurons in the medial su-perior temporal (MST) and ventral intraparietal (VIP) areas are tuned to specificpatterns of visual motion typical of optic flow and also have response properties ap-propriate for encoding heading (Bremmer et al., 2002a, b; Britten and van Wezel,1998, 2002; Duffy and Wurtz, 1991; Gu et al., 2007, 2008, 2010; Heuer and Britten,2004; Page and Duffy, 2003; Perrone and Stone, 1998). While MST has long beenassociated with responding preferentially to optic flow stimuli, recent groundbreak-ing studies have now demonstrated functional and behavioral links between MSTdand heading perception based solely on vestibular signals in the absence of vision(Fetsch et al., 2009; Gu et al., 2007, 2008, 2010). These intriguing findings demon-strate that there are multisensory properties of heading detection that are observableat the neurophysiological level.

J. S. Butler et al. / Seeing and Perceiving 24 (2011) 453–470 455
Even though we are beginning to gain an understanding of the extent to whichvisual and vestibular inputs are integrated, much remains to be investigated withrespect to how different characteristics of each sensory input affect the integrationprocess. For instance, it has previously been demonstrated that an introduction ofadditional depth cues can improve heading estimation when only visual informationis available (van den Berg and Brenner, 1994); yet it is currently unclear how theinclusion of different types of visual cues relevant to self-motion perception alsoaffects the way in which visual cues are integrated with non-visual cues, such asvestibular signals.
1.2. Role of Stereo Vision in Visual Self-Motion Perception
Most of the work investigating observers’ abilities to estimate heading based onoptic flow alone have used monocularly or binocularly viewed random dot flowfields. However, in order to properly interpret the magnitude of self-motion usingoptic flow alone, scaling must often be provided via additional depth cues (Frenzand Lappe, 2005, 2006; Lappe et al., 1999). There has also been a suggestion thatthe inclusion of depth information could help dissociate retinal motion associatedwith movements of the head, from motion associated with eye movements in orderto accurately perceive visual self-motion information (Warren and Rushton, 2009).In one of the first and only demonstrations of the effect of stereo vision on headingperception, van den Berg and Brenner (1994) reported that by presenting a randomdot optic flow stimulus in stereo, heading estimates were improved. Specifically,stereoscopic conditions were shown to be far more robust to decreases in the signal-to-noise ratio than were binocular conditions (both eyes were presented with thesame image). Pictorial depth cues also improved performance but not to the extentobserved with the introduction of stereoscopic cues.
Vection is the illusory sensation of physical self-motion induced by moving vi-sual patterns and has also been shown to be affected by the presence or absence ofstereoscopic information. Specifically, Palmisano (1996) reported that when view-ing random dot optic flow displays depicting linear self-motion, earlier vectiononset times and longer vection durations were observed for stereoscopic conditionscompared to binocular or monocular conditions without stereo cues. The magni-tude of this effect also appeared to be contingent on speed, with the stereoscopicadvantage decreasing as a function of increasing optic flow speed.
Neurophysiological findings have also shown that neurons in MST (known to beassociated with visual and vestibular heading perception) have a stereo sensitivitythat could play a role in signaling the direction of self-motion (Roy and Wurtz,1990; Roy et al., 1992). Further, heading tuning in MST neurons is improved whendepth information is added to the visual scene (Upadhyay et al., 2000). These linesof evidence strongly suggest that the inclusion of stereoscopic visual information isimportant for self-motion perception in general, and heading specifically.
Despite the fact that there is now evidence to suggest that stereo is important forvisual heading perception, it is not clear whether the absence of stereoscopic infor-

456 J. S. Butler et al. / Seeing and Perceiving 24 (2011) 453–470
mation impacts performance when additional non-visual information is available.It is possible, for instance, that vestibular inputs could help scale the magnitude ofoptic flow, thus, reducing the importance of adding visual depth cues. If this werethe case, it would be predicted that there would be no difference in heading esti-mates under combined visual–vestibular conditions when comparing visual stimuliwith or without stereoscopic information. Alternatively, it is also possible that ifthe visual information does not reliably provide a compelling sense of self-motionthat is consistent with vestibular inputs, the brain might not interpret these two sen-sory cues as originating from the same event and, therefore, integration may notoccur (Kording et al., 2007; Sato et al., 2007; Wallace et al., 2004). Consequently,if stereo cues (or other depth cues) are needed to provide reliable visual informa-tion consistent with self-motion, visual–vestibular integration may not occur undernon-stereoscopic (binocular) conditions. Interestingly, the only study to date thathas failed to report the optimal integration of visual and vestibular cues for head-ing estimates (based on MLE), presented participants with non-stereoscopic visualinput (de Winkel et al., 2010). Therefore, in the current experiment we evaluatedwhether presenting a random dot optic flow display stereoscopically compared tobinocularly would affect visual–vestibular heading estimates. MLE models wereused to make predictions about the optimal reduction in variance in combined cueestimates using the individual variances of the unisensory estimates.
2. Methods
2.1. Participants
Ten participants (six male) with normal or corrected-to-normal vision, includingnormal stereo vision (tested using the stereo fly test; http://www.stereooptical.com/html/stereo-test.html) completed the experiment for payment. Half of the partici-pants completed the stereoscopic condition first, while the second half of partici-pants completed the binocular condition first. All participants apart from two of theauthors were naïve to the purpose of the experiment. The average age was 26 years(range 21–40). Participants gave their informed consent before taking part in the ex-periment, which was performed in accordance with the ethical standards specifiedby the 1964 Declaration of Helsinki.
2.2. Apparatus
This experiment was conducted in the Motion Lab at the Max Planck Institutefor Biological Cybernetics which consists of a Maxcue 600, six-degree-of-freedomStewart motion platform manufactured by Motion-Base PLC, UK (Fig. 1; see alsovon der Heyde, 2001, for a complete description). All visual motion informationwas displayed on a projection screen, with a field of view of 86◦ × 65◦ and a reso-lution of 1400×1050 pixels with a refresh rate of 60 frames per second. Participantsviewed the projection screen through an aperture, which reduced the field of view

J. S. Butler et al. / Seeing and Perceiving 24 (2011) 453–470 457
Figure 1. Apparatus. Participants were seated on the MPI Stewart motion platform and viewed theprojection screen through an aperture, which reduced the field of view to 50◦ × 50◦. Participantsresponded using a button box. The platform was surrounded by a black curtain to ensure that no cuesrelating to the spatial configuration of the surrounding laboratory space were available.
to 50◦ × 50◦. This ensured that the edges of the screen were not visible, thereby in-creasing immersion and avoiding conflicting information provided by the stabilityof the frame and the visual motion being projected on the screen. The stereoscopicimage was generated using red-cyan anaglyphs.
Participants wore noise-cancellation headphones with two-way communicationcapability and white noise was played to mask the noise of the platform. Sub-woofers installed underneath the seat and foot plate were used to produce so-matosensory vibrations to mask the platform motors. To keep head motion to aminimum, a foam head rest was used. Participants responded using a simple four-button response box. The entire experiment was coded using a graphical real-timeinteractive programming language (Virtools™, France).
2.3. Stimuli
The visual stimulus consisted of a limited lifetime starfield. Each star was a Gaus-sian blob and had a limited lifetime in the range of 0.5–1.0 s. The maximum numberof Gaussian blobs on the screen at any one time was 200 and the minimum was150. The participants were seated 100 cm from the screen. All blobs subtended an-gles ranging from 0.1◦ to 0.2◦, which depended on their virtual distance rangingfrom 2 to 2.5 m. The starfield was presented either with or without stereoscopicdepth cues (i.e., by viewing the starfield with or without the red-cyan passive stereoglasses). In the binocular condition, white blobs were presented on a black back-ground, whereas in the stereo conditions a grey background was used to facilitatethe fusing of the red and cyan blobs by minimizing ghost images. The vestibularstimuli were presented via the movement of the motion simulator on which par-ticipants were seated. For conditions in which only vestibular cues were available,passive movements were experienced in the complete absence of visual inputs tomotion (i.e., in a completely darkened space covered in black cloth).

458 J. S. Butler et al. / Seeing and Perceiving 24 (2011) 453–470
Figure 2. Participants were presented with two short movement intervals in different directions oneach trial and were asked to judge in which interval they moved more to the right. (a) The sinusoidalacceleration profile for all motions. (b) Example trial: In the first interval, participants were movedalong the standard heading of straight ahead (0◦) and in the second interval they were moved in aleftwards direction.
The visual and vestibular heading motion profile (m) was
s(t) = 0.49(2πt − sin(2πt))
4π2, 0 � t � 1 s, (1)
where t is time (Fig. 2(a)). All motion profiles had the same maximum forwarddisplacement, velocity and acceleration of 0.078 m, 0.156 m/s and 0.49 m/s2,respectively, which is above the detection threshold for blindfolded linear accel-erations (Benson et al., 1986). In pilot studies conducted with two participants,we manipulated the maximum acceleration to find a value such that the unisensoryvestibular reliability was approximately the same as the unisensory visual reliabilityin order to most effectively reveal any effects of cue integration.
The linear direction of motion was defined by the angle of heading, θ , which waskept constant during each individual movement interval. Hence, the motion in thehorizontal plane was defined as
x(t) = s(t) sin(θ)(2)
y(t) = s(t) cos(θ),
where x(t) is the fore-aft direction and y(t) is the lateral direction (Fig. 2(b)).
2.4. General Procedure
Participants performed a 2-interval forced choice task (2IFC) in which they wereasked to judge in which of two movement intervals they moved more to the right

J. S. Butler et al. / Seeing and Perceiving 24 (2011) 453–470 459
(see Fig. 2(b)). Each trial consisted of two linear heading motions, one being thestandard heading angle and the other being one of several comparison headingsangles. The standard and comparison heading angles were counterbalanced for or-der across trials (i.e., for 50% of trials the standard was first). The standard anglewas always fixed at 0◦ (straight ahead), while there were eight comparison angles(−20◦, −10◦, −5◦, −2◦, 2◦, 5◦, 10◦, 20◦). The comparison angles were presentedusing the method of constant stimuli. All trials were initiated with a short auditorybeep played over the headphones to indicate to the participant that they could startthe trial with a button press. After pressing the start button, there was a 0.75 s pausebefore the onset of the motion. Between intervals, there was a 1 s pause, followedby a second auditory signal indicating the commencement of the second interval.After the second interval, the participants responded via the button box. A left but-ton press indicated that they judged the first motion to be more to the right and aright button press indicated that they judged the second motion to be more to theright. Each participant completed two conditions — a stereoscopic condition and abinocular condition (blocked and counterbalanced). Within each of these conditionsthere were three trial types, including, vision alone trials (VIS), vestibular alone tri-als (VEST) and visual–vestibular cues combined trials (VIS–VEST) (blocked andcounterbalanced).
For the VIS and VIS–VEST trials, the limited life-time Gaussian starfield ap-peared and remained static for 0.75 s before the onset of the motion. In the VESTtrials there was a 0.75 s pause before the onset of the motion to ensure that the lengthof each trial was equal across all cue conditions. In the VEST and VIS–VEST trials,after responding, the participants were moved back to the start position in darknessat a constant, sub-threshold velocity of 0.025 m/s (Benson et al., 1986) for approx-imately six seconds before the next trial was initiated.
In total, participants completed at least 30 repetitions of each of the 8 compari-son heading stimuli for each condition (240 trials). These trials were divided intoblocks of 80 and each participant completed fifteen blocks over six days (approx.2.5 blocks per day). Each block took approximately 20 min to complete. A prelim-inary experimental session was used to familiarize the participants with the stimuliand setup and these data are not reported here.
2.5. Data Analysis
The proportion of rightward responses made by participants were plotted as a func-tion of heading angle, and cumulative Gaussian psychometric functions were fittedusing the psignifit toolbox (Wichmann and Hill, 2001a, b; see Fig. 3 for a repre-sentative example of data from one participant in the stereo condition). The justnoticeable difference (JND) was calculated, which is proportional to the standarddeviation, σ , of the probability density function
JND = σ√
2. (3)

460 J. S. Butler et al. / Seeing and Perceiving 24 (2011) 453–470
Figure 3. Data for visual alone (VIS, light grey circles), vestibular alone (VEST, medium grey invertedtriangles) and visual–vestibular conditions (VIS–VEST, dark grey squares) for participants 1 (P1) forstereoscopic condition. The data show the proportion of perceived ‘more rightward’ responses as afunction of heading angle. Solid lines represent the cumulative Gaussian functions that were fitted tothe data. Box plots whiskers indicate the confidence intervals at −2, −1, 1, 2 standard deviations.
The JND value is inversely proportional to reliability and, thus, the higher the JNDthe less reliable the cue (see Ernst and Bülthoff, 2004). For all tests the type-I errorrate was set at 0.05, without correcting for multiple comparisons.
2.6. Maximum Likelihood Estimation (MLE)
Using a simplified form of MLE (Alais and Burr, 2004; Bülthoff and Yuille, 1991;Ernst and Banks, 2002; Ernst et al., 2000; Yuille and Bülthoff, 1996), we used theJND to estimate a Gaussian likelihood distribution for each of the unimodal cues(visual, SVis and vestibular, SVest). If visual and vestibular information combine inan optimal fashion, we can predict the visual–vestibular likelihood, SVis-Vest, usingthe equation
SVis-Vest = wVisSVis + wVestSVest, (4)
where wVis,wVest are the weights corresponding to the reliability of the unimodalcues. From equation (4) we can predict the JND of the visual–vestibular combinedestimates
JNDVis-Vest =√
JND2VisJND2
Vest
JND2Vis + JND2
Vest
. (5)
Based on these assumptions, the greatest reduction in the combined JND should beobserved when the unimodal cues are of equal reliability JNDVis = JNDVest whichyields a
√2 reduction in the JND for the combined trials. From the VIS–VEST
condition we can extract the observed JND and compare it to the predicted JND,calculated from the unimodal JNDs using equation (5). Finally, based on the MLE

J. S. Butler et al. / Seeing and Perceiving 24 (2011) 453–470 461
account, the combined, JNDVis-Vest should always be less than or equal to the uni-modal JNDs
JNDVis-Vest � min(JNDVis, JNDVest). (6)
In order to evaluate whether the observed data were consistent with MLE predic-tions, both group and individual analyses were conducted. For the group analyses,the JNDs were submitted to a one-way repeated-measures analysis of variance(ANOVA) with factors VIS, VEST and VIS–VEST for both the binocular andstereoscopic conditions. The observed VIS–VEST JNDs for each condition werealso compared to the MLE predicted VIS–VEST JNDs using a paired t-test.
For the individual participant analyses, differences between the observed pat-tern of responding and that predicted using MLE were assessed in two ways. First,each participant’s observed VIS–VEST JND and unimodal JNDs were submitted toequation (6). If violated, this would suggest that the most reliable unimodal cue wasmore reliable than the combined cue estimate. Second, the 95% confidence inter-vals for the unimodal and combined cue JND were calculated by 1999 repetitionsof a bootstrap procedure (for details see Wichmann and Hill, 2001b). From the uni-modal bootstrapped 95% confidence intervals (VIS and VEST), the predicted 95%confidence interval was calculated using propagation of error (Taylor, 1997). The95% confidence intervals were used to determine if the observed combined JNDwas statistically different from the predicted JND and vice versa. If a participant’sdata failed both types of analyses this would suggest their VIS–VEST data was notconsistent with the MLE model.
Using these criteria, participants were divided into two groups as a function oftheir individual bootstrapped JND distributions; one group consisted of participantswho did demonstrate the predicted optimal reduction in variance for the combinedcue condition as defined above, and the other group consisted of participants whodid not demonstrate an optimal reduction in variance. The importance of analyzingindividual data when assessing behavioral and neurophysiological measures relatedto multisensory processing has recently been emphasized (e.g., Bentvelzen et al.,2009; Werner and Noppeney, 2010).
3. Results
3.1. Binocular Vision
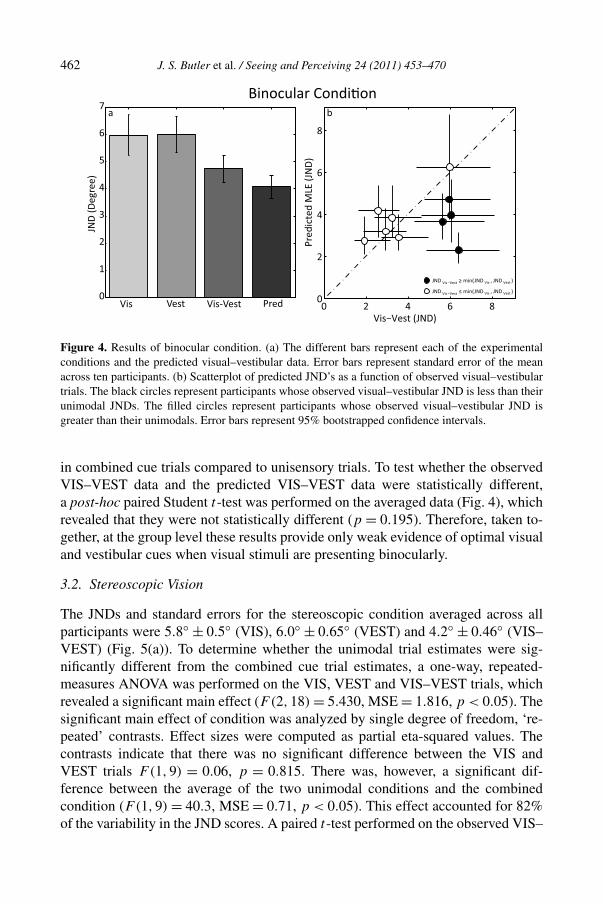
The JNDs and standard errors for the binocular condition averaged across all partic-ipants were 5.9◦ ±0.7◦ (VIS), 6.0◦ ±0.65◦ (VEST) and 4.8◦ ±0.42◦ (VIS–VEST).These values are plotted in Fig. 4(a) along with the predicted visual–vestibularJNDs calculated using MLE. To determine whether the unimodal cues were sig-nificantly different from the combined cues, we performed a one-way, repeated-measures ANOVA on the VIS, VEST and VIS–VEST trials. No significant maineffect was observed (F(2,18) = 2.285, MSE = 2.31, p = 0.1). This finding is notconsistent with an MLE model, which predicts a significant reduction in variance
462 J. S. Butler et al. / Seeing and Perceiving 24 (2011) 453–470
Figure 4. Results of binocular condition. (a) The different bars represent each of the experimentalconditions and the predicted visual–vestibular data. Error bars represent standard error of the meanacross ten participants. (b) Scatterplot of predicted JND’s as a function of observed visual–vestibulartrials. The black circles represent participants whose observed visual–vestibular JND is less than theirunimodal JNDs. The filled circles represent participants whose observed visual–vestibular JND isgreater than their unimodals. Error bars represent 95% bootstrapped confidence intervals.
in combined cue trials compared to unisensory trials. To test whether the observedVIS–VEST data and the predicted VIS–VEST data were statistically different,a post-hoc paired Student t-test was performed on the averaged data (Fig. 4), whichrevealed that they were not statistically different (p = 0.195). Therefore, taken to-gether, at the group level these results provide only weak evidence of optimal visualand vestibular cues when visual stimuli are presenting binocularly.
3.2. Stereoscopic Vision
The JNDs and standard errors for the stereoscopic condition averaged across allparticipants were 5.8◦ ± 0.5◦ (VIS), 6.0◦ ± 0.65◦ (VEST) and 4.2◦ ± 0.46◦ (VIS–VEST) (Fig. 5(a)). To determine whether the unimodal trial estimates were sig-nificantly different from the combined cue trial estimates, a one-way, repeated-measures ANOVA was performed on the VIS, VEST and VIS–VEST trials, whichrevealed a significant main effect (F(2,18) = 5.430, MSE = 1.816, p < 0.05). Thesignificant main effect of condition was analyzed by single degree of freedom, ‘re-peated’ contrasts. Effect sizes were computed as partial eta-squared values. Thecontrasts indicate that there was no significant difference between the VIS andVEST trials F(1,9) = 0.06, p = 0.815. There was, however, a significant dif-ference between the average of the two unimodal conditions and the combinedcondition (F(1,9) = 40.3, MSE = 0.71, p < 0.05). This effect accounted for 82%of the variability in the JND scores. A paired t-test performed on the observed VIS–

J. S. Butler et al. / Seeing and Perceiving 24 (2011) 453–470 463
Figure 5. Results of stereoscopic condition. (a) The different bars represent each of the experimentalconditions and the predicted visual–vestibular data calculated from the unimodal data. Error barsrepresent standard error of the mean across ten participants. (b) Scatterplot of predicted JND’s as afunction of observed visual–vestibular trials. The black circles represent participants whose observedvisual–vestibular JND is less than their unimodal JNDs. The filled circles represent one participantwhose observed visual–vestibular JND is greater than their unimodal JND. Error bars represent 95%bootstrapped confidence intervals.
VEST JNDs and the predicted VIS–VEST JDNs revealed no statistical difference(p = 0.35).
Therefore, taken together at the group level, these results provide stronger andmore consistent evidence in support of optimal visual–vestibular integration whenvisual stimuli were presented stereoscopically.
In order to evaluate whether stereoscopic cues affected the JND of heading esti-mates when only visual information was available, the VIS trials in the stereoscopiccondition were compared to the VIS trials in the binocular condition. Interestingly,the addition of stereoscopic cues to the optic flow field did not significantly affectaverage threshold values under unisensory visual conditions (5.9◦ ± 0.7◦ for thebinocular condition and 5.8◦ ± 0.5◦ for the stereoscopic condition (p = 0.658)).However, when visual information was combined with vestibular cues, differenceswere observed for binocular and stereoscopic conditions.
3.3. Comparing Binocular and Stereoscopic Conditions for IndividualParticipants
To gain further insight the differences between the characteristics of cue integrationin stereo versus binocular visual conditions, individual participant data was ana-lyzed independently. In Figs 4(b) and 5(b) the open circles represent participantswhose VIS–VEST JND was lower than either of their VIS and VEST JNDs. The

464 J. S. Butler et al. / Seeing and Perceiving 24 (2011) 453–470
filled circles represent participants whose VIS–VEST JND was larger than eitherof the unimodal JNDs (violating equation (6)) and whose bootstrapped 95% confi-dence intervals of the observed data did not overlap with the predicted JND.
Whereas in the binocular condition four of the ten participants’ data (40%) werenot consistent with the MLE predictions (Fig. 4(a)), in the stereo condition only oneparticipant’s data (10%) were not consistent with the MLE predictions (Fig. 5(a)).The results of a paired t-test performed on this subgroup of 4 participants com-paring their observed binocular VIS–VEST trials and the observed stereoscopicVIS–VEST trials approached significance (p = 0.06). To ensure that this result wasreplicable, we ran the same four participants who did not optimally combine withonly binocular cues in another binocular control experiment which yielded the sameresults as in the main experiment (see the Appendix). The results of this control ex-periment suggest that these individual differences are not simply due to features ofthe experimental design (e.g., order of conditions) or transient contextual effects,but rather reflect a consistently identified characteristic of individual participant re-sponding. Finally, to ensure that these results were not due to a false assumption thatthe data could be fit to a Gaussian function, we examined the fits of the individualparticipants data using the R2 value and Monte Carlo cumulative probability esti-mates (CPE) of the model (Wichman et al., 2001a). The mean R2 for the unimodaland bimodal fits were 0.943 and 0.97, respectively. The mean CPE for unimodal andbimodal fits were 0.49 with a standard deviation of 0.27 and 0.623 with a standarddeviation of 0.26, thus, verifying that the Gaussian was an appropriate function touse here.
4. General Discussion
4.1. The Role of Stereo in Visual–Vestibular Integration
Overall, the group data showed strong evidence of optimal visual–vestibular inte-gration when the visual stimuli were presented stereoscopically. In contrast, therewas only weak evidence of optimal integration when visual stimuli were pre-sented binocularly. Furthermore, exploratory analyses of individual participants’data showed that, when stereoscopic cues were available, 90% of participants opti-mally combined cues in a manner consistent with MLE predictions, whereas only60% of participants optimally combined when only binocular cues were available.The data from the four participants who did not optimally combine in the binoc-ular condition are consistent with the single previous study that did not includestereoscopic information and that also reported a lack of optimal visual–vestibularintegration during heading estimation (de Winkel et al., 2010). The results of thestereoscopic condition, on the other hand, are in agreement with the conclusionsof most previous studies that have consistently demonstrated an optimal integrationof visual and vestibular cues for heading and that also presented optic flow stimulistereoscopically (Butler et al., 2010; Fetsch et al., 2009; Gu et al., 2008).

J. S. Butler et al. / Seeing and Perceiving 24 (2011) 453–470 465
The fact that in the current study stereoscopic visual information was morestrongly associated with optimal cue integration, whereas non-stereoscopic visualinformation provided weak evidence of optimal cue integration, could potentiallyrelate to the fact that the scale of the optic flow is more ambiguous without the ad-ditional depth information provided by stereoscopic cues. In our binocular display,because the optic flow stimuli contained no absolute size cues, this may have ledto multiple interpretations of the movement profile, thereby increasing uncertaintyregarding whether the two sources of sensory information originated from the sameevent. This would lead to a violation of an underlying assumption of MLE (Kordinget al., 2007). We postulate that the stereoscopic display may have thereby reducedthis uncertainty.
It should be noted that there are many visual depth cues that could help to scaleoptic flow and, therefore, more research will be required to assess whether the ef-fects observed here are attributable to stereoscopic cues specifically or whether theaddition of other cues to depth would result in similar effects. For instance, onestrategy that has been used in other studies has been to include familiar size cues inthe visual scene, such as human avatars (MacNeilage et al., 2007), or other monoc-ular depth cues (e.g., ground texture gradient, linear perspective, etc.). Therefore,future work will consider whether stereoscopic information is unique, or whetherthe inclusion of other depth cues is also more likely to result in optimal visual–vestibular integration.
Fetsch et al. (2009) recently evaluated the effect of stereo cues on combinedcue heading estimation in non-human primates that was motivated by anecdotalobservations from previous studies in their laboratory suggesting that stereo cuesappeared to be important for observing statistically optimal reductions in variance.However, when they later compared stereo and binocular conditions in two well-trained monkeys, no differences were observed. Specifically, even without stereocues a statistically optimal reduction in variance was observed. The authors sug-gested that stereo cues might be important when first performing the task, butmay become less important with continued extensive training. In a control exper-iment following from the current experiment, we investigated whether the resultswould be replicated for the same participants in subsequent testing sessions (see theAppendix). Specifically, this study evaluated whether having some additional expe-rience with both stereoscopic and binocular conditions would change participants’performance. The results demonstrated that the responses in the control experimentreplicated the behavioral results reported in the current study. Specifically, partic-ipants who combined binocular visual and vestibular cues in the main experimentalso exhibited optimal integration in the control experiment, while those who didnot demonstrate optimal cue integration in the main experiment also did not exhibitoptimal integration in the control binocular experiment. These results demonstratethat the effects reported for the current experiment were robust and replicable forindividual participants. Future work will be needed to evaluate whether having even

466 J. S. Butler et al. / Seeing and Perceiving 24 (2011) 453–470
more extensive experience with the task and stimuli would change this pattern ofresponding.
4.2. No Effect of Stereo on Unisensory Visual Conditions
When comparing the reliability of heading estimates for the binocular and stereoconditions for unisensory trials when only visual information was presented, sur-prisingly no significant differences were observed. These results are not directlyconsistent with those of van den Berg and Brenner (1994) who reported improvedheading estimation during stereoscopic unisensory visual conditions. One possiblereason for this discrepancy may relate to the signal-to-noise ratio in the optic flowstimuli used in each experiment. Specifically, van den Berg and Brenner (1994) re-ported that the benefits provided through stereoscopic cues (over binocular cues)were only observed under conditions of low signal-to-noise; however, this was notcontrolled for in the current study. The trend of the measured variances in binoc-ular and stereoscopic conditions, however, indicates that the binocular estimates,on average were associated with a higher JND (i.e., lower reliability) compared tostereoscopic conditions. These results highlight the need to more carefully evalu-ate the mechanisms by which stereoscopic cues contribute to the interpretation ofheading from optic flow.
5. Summary
In summary, it appears as though the presence or absence of stereoscopic visualinformation can impact the extent to which visual and vestibular cues are integratedduring heading perception. Specifically, the presence of stereoscopic cues is associ-ated with stronger evidence of optimal integration compared to conditions in whichno stereoscopic cues are available. These results have implications for research ar-eas focused on understanding the contributions of particular visual and non-visualcues in self-motion perception and of the principles underlying multisensory inte-gration in general. There could also be considerable applied implications, includingwhether the incorporation of stereoscopic displays might improve motion simula-tion technologies for training and evaluation (e.g., the development of driving andflight simulators). By integrating specific depth cues into the visual display, thismay provide a more realistic experience of self-motion and could possibly reducemotion sickness associated with visual–vestibular cue conflicts.
Acknowledgements
This work was supported by the Max Planck Society, Enterprise Ireland and by theWCU (World Class University) program through the National Research Foundationof Korea funded by the Ministry of Education, Science and Technology (R31-2008-000-10008-0). The authors would like to thank Daniel Berger, John Foxe, MarcErnst and Martin Banks for their invaluable advice and guidance. We would like to

J. S. Butler et al. / Seeing and Perceiving 24 (2011) 453–470 467
thank Julian Hofmann, Michael Weyel and the participants for help with the datacollection.
References
Alais, D. and Burr, D. (2004). The ventriloquist effect results from near-optimal bimodal integration,Curr. Biol. 14, 257–262.
Benson, A. J., Spencer, M. B. and Stott, J. R. (1986). Thresholds for the detection of the direction ofwhole-body, linear movement in the horizontal plane, Aviat. Space Environ. Med. 57, 1088–1096.
Bentvelzen, A., Leung, J. and Alais, D. (2009). Discriminating audiovisual speed: optimal integrationof speed defaults to probability summation when component reliabilities diverge, Perception 38,966–987.
Bremmer, F., Duhamel, J. R., Ben Hamed, S. and Graf, W. (2002a). Heading encoding in the macaqueventral intraparietal area (VIP), Eur. J. Neurosci. 16, 1554–1568.
Bremmer, F., Klam, F., Duhamel, J. R., Ben Hamed, S. and Graf, W. (2002b). Visual–vestibular inter-active responses in the macaque ventral intraparietal area (VIP), Eur. J. Neurosci. 16, 1569–1586.
Britten, K. H. and Van Wezel, R. J. (1998). Electrical microstimulation of cortical area MST biasesheading perception in monkeys, Nat. Neurosci. 1, 59–63.
Britten, K. H. and Van Wezel, R. J. (2002). Area MST and heading perception in macaque monkeys,Cerebral Cortex 12, 692–701.
Bülthoff, H. H. and Yuille, A. (1991). Bayesian models for seeing shapes and depth, Comm. Theoret.Biol. 2, 283–314.
Butler, J. S., Smith, S. T., Campos, J. L. and Bülthoff, H. H. (2010). Bayesian integration of visualand vestibular signals for heading, J. Vision 10, 23.
de Winkel, K. N., Weesie, J., Werkhoven, P. J. and Groen, E. L. (2010). Integration of visual andinertial cues in perceived heading of self-motion, J. Vision 10, 1.
Duffy, C. J. and Wurtz, R. H. (1991). Sensitivity of MST neurons to optic flow stimuli. I. A continuumof response selectivity to large-field stimuli, J. Neurophysiol. 65, 1329–1345.
Ernst, M. O. and Banks, M. S. (2002). Humans integrate visual and haptic information in a statisticallyoptimal fashion, Nature 415, 429–433.
Ernst, M. O. and Bülthoff, H. H. (2004). Merging the senses into a robust percept, Trends Cognit. Sci.8, 162–169.
Ernst, M. O., Banks, M. S. and Bülthoff, H. H. (2000). Touch can change visual slant perception, Nat.Neurosci. 3, 69–73.
Fetsch, C. R., Turner, A. H., DeAngelis, G. C. and Angelaki, D. E. (2009). Dynamic reweighting ofvisual and vestibular cues during self-motion perception, J. Neurosci. 29, 15601–15612.
Frenz, H. and Lappe, M. (2005). Absolute travel distance from optic flow, Vision Research 45, 1679–1692.
Frenz, H. and Lappe, M. (2006). Visual distance estimation in static compared to moving virtualscenes, Spanish J. Psychol. 9, 321–331.
Gu, Y., DeAngelis, G. C. and Angelaki, D. E. (2007). A functional link between area MSTd andheading perception based on vestibular signals, Nat. Neurosci. 10, 1038–1047.
Gu, Y., Angelaki, D. E. and DeAngelis, G. C. (2008). Neural correlates of multisensory cue integrationin macaque MSTd, Nat. Neurosci. 11, 1201–1210.
Gu, Y., Fetsch, C. R., Adeyemo, B., Deangelis, G. C. and Angelaki, D. E. (2010). Decoding of MSTdpopulation activity accounts for variations in the precision of heading perception, Neuron 66, 596–609.

468 J. S. Butler et al. / Seeing and Perceiving 24 (2011) 453–470
Heuer, H. W. and Britten, K. H. (2004). Optic flow signals in extrastriate area MST: comparison ofperceptual and neuronal sensitivity, J. Neurophysiol. 91, 1314–1326.
Kording, K. P., Beierholm, U., Ma, W. J., Quartz, S., Tenenbaum, J. B. and Shams, L. (2007). Causalinference in multisensory perception, PLoS One 2, e943.
Lappe, M., Bremmer, F. and Van Den Berg, A. V. (1999). Perception of self-motion from visual flow,Trends Cognit. Sci. 3, 329–336.
MacNeilage, P. R., Banks, M. S., Berger, D. R. and Bülthoff, H. H. (2007). A Bayesian model of thedisambiguation of gravitoinertial force by visual cues, Exper. Brain Res. 179, 263–290.
Ohmi, M. (1996). Egocentric perception through interaction among many sensory systems, Brain Res.Cognit. Brain Res. 5, 87–96.
Page, W. K. and Duffy, C. J. (2003). Heading representation in MST: sensory interactions and popu-lation encoding, J. Neurophysiol. 89, 1994–2013.
Palmisano, S. (1996). Perceiving self-motion in depth: the role of stereoscopic motion and changing-size cues, Percept. Psychophys. 58, 1168–1176.
Perrone, J. A. and Stone, L. S. (1998). Emulating the visual receptive-field properties of MST neuronswith a template model of heading estimation, J. Neurosci. 18, 5958–5975.
Roy, J. P. and Wurtz, R. H. (1990). The role of disparity-sensitive cortical neurons in signalling thedirection of self-motion, Nature 348, 160–162.
Roy, J. P., Komatsu, H. and Wurtz, R. H. (1992). Disparity sensitivity of neurons in monkey extrastriatearea MST, J. Neurosci. 12, 2478–2492.
Royden, C. S., Banks, M. S. and Crowell, J. A. (1992). The perception of heading during eye move-ments, Nature 360, 583–585.
Sato, Y., Toyoizumi, T. and Aihara, K. (2007). Bayesian inference explains perception of unity andventriloquism aftereffect: identification of common sources of audiovisual stimuli, Neural Comput.19, 3335–3355.
Taylor, J. R. (1997). An Introduction to Error Analysis: The Study of Uncertainties in Physical Mea-surements. University Science Books, Sausalito, CA, USA.
Telford, L., Howard, I. P. and Ohmi, M. (1995). Heading judgments during active and passive self-motion, Exper. Brain Res. 104, 502–510.
Upadhyay, U. D., Page, W. K. and Duffy, C. J. (2000). MST responses to pursuit across optic flowwith motion parallax, J. Neurophysiol. 84, 818–826.
van den Berg, A. V. and Brenner, E. (1994). Why two eyes are better than one for judgements ofheading, Nature 371, 700–702.
von der Heyde, M. (2001). A Distributed Virtual Reality System for Spatial Updating: Concepts, Im-plementation, and Experiments. Universität Bielefeld, Germany.
Wallace, M. T., Roberson, G. E., Hairston, W. D., Stein, B. E., Vaughan, J. W. and Schirillo, J. A.(2004). Unifying multisensory signals across time and space, Exper. Brain Res. 158, 252–258.
Warren, W. H., Jr. and Hannon, D. J. (1990). Eye movements and optical flow, J. Optic. Soc. Amer. A7, 160–169.
Warren, P. A. and Rushton, S. K. (2009). Perception of scene-relative object movement: optic flowparsing and the contribution of monocular depth cues, Vision Research 49, 1406–1419.
Werner, S. and Noppeney, U. (2010). Superadditive responses in superior temporal sulcus predictaudiovisual benefits in object categorization, Cereb. Cortex 20, 1829–1842.
Wichmann, F. A. and Hill, N. J. (2001a). The psychometric function: I. Fitting, sampling, and good-ness of fit, Percept. Psychophys. 63, 1293–1313.
Wichmann, F. A. and Hill, N. J. (2001b). The psychometric function: II. Bootstrap-based confidenceintervals and sampling, Percept. Psychophys. 63, 1314–1329.

J. S. Butler et al. / Seeing and Perceiving 24 (2011) 453–470 469
Yuille, A. and Bülthoff, H. H. (1996). Bayesian decision theory and psychophysics, in: Perception asBayesian Inference, D. Knill and W. Richards (Eds). Cambridge University Press, Cambridge, UK.
Appendix: Experiment on Binocular Replication
Participants
Four of the original ten participants completed the control experiment without anyadditional knowledge of the purpose and manipulations in the main experiment.Three of the four participants (P8–P10) who exhibit non-optimal integration of vi-sual and vestibular information in the binocular condition of the main experimentwere included in this group.
General Procedure
The apparatus and stimuli were identical to those in the main experiment. In thiscase participants performed a 2-alternative forced choice task (2AFC) in which theywere asked to judge whether they moved to the left or the right. Each trial consistedof one linear heading motion chosen from eight angles ranging from −10◦ to 10◦on a log scale centered around 0◦. After the motion ended, the participants indicatedif they moved left or right via a button box. Participants completed one binocularexperimental session consisting of three experimental blocks; VEST, VIS and VIS–VEST. Each block contained 96 trials, participants completed 12 repetitions of eachof the 8 heading stimuli for each condition.
Results
The average JNDs and their standard errors for the binocular condition were3.3◦ ± 0.4◦ (VIS), 5.33◦ ± 1.2◦ (VEST) and 4.4◦ ± 0.86◦ (VIS–VEST). Fig-ure A1(a) shows the average JND values for the binocular condition. To determinewhether the responses in the unimodal cue conditions were different from the com-bined cue condition, we performed a one-way, repeated-measures ANOVA on thebinocular VIS, VEST and VIS–VEST conditions. The analysis revealed no signif-icant difference between the unimodal conditions and the combined cue condition(F(2,6) = 1.012, MSE = 4.039, p = 0.42). A post-hoc t-test performed on the ob-served binocular VIS–VEST values and the predicted VIS–VEST values revealedno statistical difference (p = 0.15).
Figure A1(b) shows the scatterplot for the observed VIS–VEST values versus thepredicted VIS–VEST values for each participant, with the dotted line representingthe ideal. The open circles indicate participants whose VIS–VEST JND was lowerthan at least one of their unimodal JNDs. The three filled circles indicate the par-ticipants whose VIS–VEST JND was larger than both of their unimodal JNDs. Thevertical and horizontal bars denote 95% bootstrapped confidence intervals for theobserved and predicted bimodal JNDs.

470 J. S. Butler et al. / Seeing and Perceiving 24 (2011) 453–470
Figure A1. Results of the binocular condition. (a) Averaged observed JND values for each of thebinocular conditions and the predicted combined cue data calculated from the unimodal data. Errorbars denote standard error of the mean across four participants. (b) Scatterplot of observed vs. pre-dicted JND values for the binocular combine cue condition. The open circle represents the participantwhose observed binocular VIS–VEST JND was less than their unimodal JNDs. The filled circles rep-resent the three participants who had observed binocular VIS–VEST JNDs that were greater than theirunimodal JNDs. Error bars represent 95% bootstrapped confidence intervals.
Summary
The results of the control binocular experiment are consistent with the results pre-sented in the main text. This demonstrates that, for a subset of participants, binoc-ular visual and vestibular cues do not combine in an optimal fashion and that thisis a robust and replicable result that is not dependent on individual participant priorexperience with the different types of visual stimuli (i.e., not due to experimentalcarry-over effects).