the role of spaceborne synthetic …s frigates report that they may be able to use their ... the...
TRANSCRIPT
ROBERT C. BEAL
THE ROLE OF SPACEBORNE SYNTHETIC APERTURE RADAR IN GLOBAL WAVE FORECASTING
Ocean wave research at APL using synthetic aperture radar (SAR) strongly suggests that a properly configured spaceborne SAR could substantially improve global ocean wave forecasts. A critical demonstration of the science and technology is planned for the early 1990s, when a real-time on-board SAR processor designed at APL will be mated to a NASA shuttle imaging radar to collect tens of thousands of globally distributed directional spectral estimates over a six- to eight-day period. A detailed comparison with operational wave forecasts should reveal the intrinsic value of the satellite information.
DESCRIBING AND PREDICTING OCEAN WAVES
Stormy seas have inspired writers and terrorized sailors for centuries. More than 2500 years ago, the psalmist proclaimed that only "those who go down to the sea in ships" will witness "the works of the Lord . .. For He commandeth and raiseth the stormy wind, which lifteth up the waves thereof. They mount up to the heaven, they go down again to the depths . . ." 1 More recently, 51 days into his one-man voyage around the world in the American Promise, Dodge Morgan conveyed some aspects of the terror:
The relentlessness of the violent rolling motion demands a tough constitution. There is no respite, no haven, except in the sturdiness of the mind in its goal to ignore the ceaseless motion. It is easy to see a man losing his mind if he loses his ability to see and understand that it will end. It will end. So it's you and I, chaos, one on one, and I am going to make an alliance with time and outlast you . . . 2
The stormy sea is aptly described as chaos by the solitary sailor.
Yet, there are patterns; there is order. There are waves in the sea, waves with characteristic heights, periods, and directions. Chaotic, apparently random seas may consist of many separate wave systems, each having large local variability in even these three simple descriptors. Moreover, a sufficiently long sequence of waves (e.g., about a hundred) can be fairly well described by its spatial or temporal distribution of height as a function of both frequency and direction, that is, by its directional spectrum. Entire fields of waves can be described by spatial arrays of temporally evolving directional spectra.
How well and how far into the future can the state of these evolving wave fields be predicted? The accuracy of a wave forecast depends on at least three elements: (1) a detailed knowledge of the history of the wind field (or, more precisely, momentum flux) at the ocean surface, (2) an understanding (or model) of how the wind raises the waves and how the resulting waves are propagated and dissipated, and (3) an understanding of how
54
local currents interact with the waves and how the waves interact with each other, especially within storms or in the presence of rapidly changing winds. Other more elusive factors, such as the gustiness of the wind and the discrete nature of numerical models, impose ultimate limits on predictability.
THE MOST EXTREME WAVES
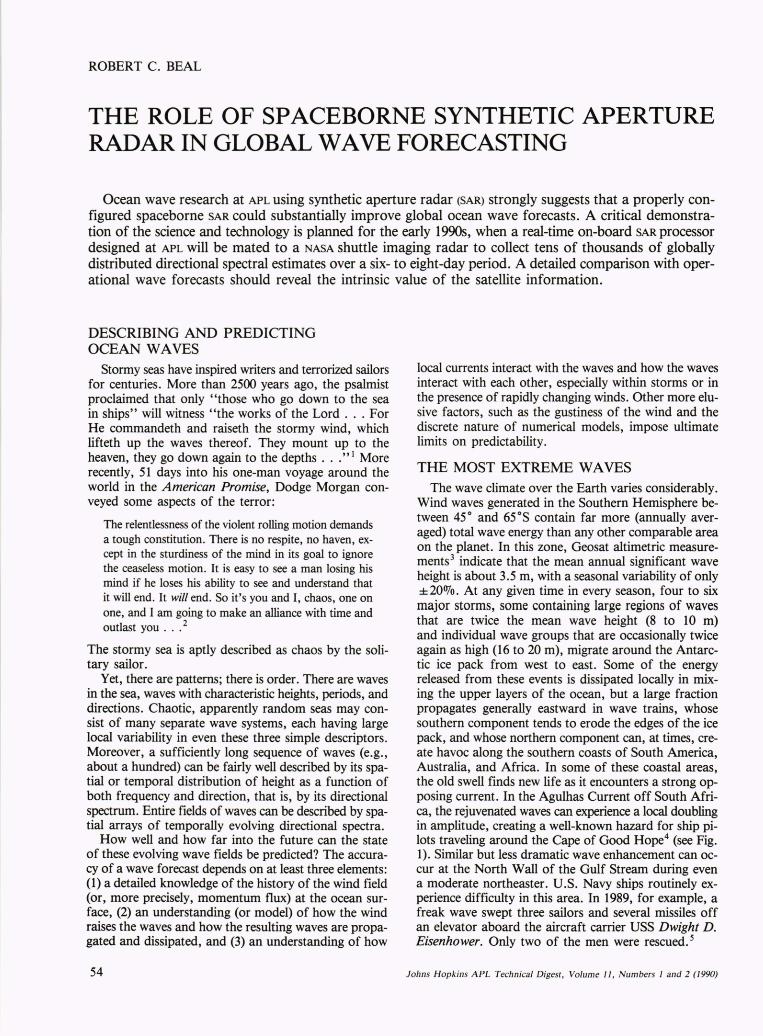
The wave climate over the Earth varies considerably. Wind waves generated in the Southern Hemisphere between 45° and 65°S contain far more (annually averaged) total wave energy than any other comparable area on the planet. In this zone, Geosat altimetric measurements 3 indicate that the mean annual significant wave height is about 3.5 m, with a seasonal variability of only ± 20%. At any given time in every season, four to six major storms, some containing large regions of waves that are twice the mean wave height (8 to 10 m) and individual wave groups that are occasionally twice again as high (16 to 20 m), migrate around the Antarctic ice pack from west to east. Some of the energy released from these events is dissipated locally in mixing the upper layers of the ocean, but a large fraction propagates generally eastward in wave trains, whose southern component tends to erode the edges of the ice pack, and whose northern component can, at times, create havoc along the southern coasts of South America, Australia, and Africa. In some of these coastal areas, the old swell finds new life as it encounters a strong opposing current. In the Agulhas Current off South Africa, the rejuvenated waves can experience a local doubling in amplitude, creating a well-known hazard for ship pilots traveling around the Cape of Good Hope4 (see Fig. 1). Similar but less dramatic wave enhancement can occur at the North Wall of the Gulf Stream during even a moderate northeaster. U.S. Navy ships routinely experience difficulty in this area. In 1989, for example, a freak wave swept three sailors and several missiles off an elevator aboard the aircraft carrier USS Dwight D. Eisenhower. Only two of the men were rescued. 5
Johns Hopkins APL Technical Digest , Volume 11 , Numbers I and 2 (1990)

1389
3,:>0
3 / 30
,\,," 1111
\ \ \ \ \ \ \"
3. Freak waV~5 of up to 65 feet in h~,gltt, preceded by a deep
trough, may be encountered ;n the area between he edge of the continental shelf and 20 miles to seaward. These co'; occur when a strong southwesterly ;s blowing, the sea IS rough and the barometric pressure IS low.
Figure 1. Storms circling the Southern Ocean (top), as seen from the Apollo 17 spacecraft in December 1972. The naviga· tion map (bottom) corresponds to the boxed area in the photo, which is the region off East London , South Africa. The map notes the danger from freak waves up to 20 m (65 ft) high , which are among the highest waves found anywhere on the globe.
Although ocean storms do not sink modern naval ships, their detrimental effects on seakeeping can
Johns Hopkins APL Technica l Digest, Volume 11 , Num bers J and 2 (1990)
nevertheless be paralyzing. Authors of a recent paper stated the following:
55

R. C. Beal
Because of poor seakeeping above 50o N, today's frigates can make their maximum speed only about 400/0 of the time annually and can achieve a speed of 24 or more knots only about 25% of the time during the winter ... During the winter they were limited to speeds of 15 knots or less, 20% of the time ... In the Greenland-IcelandUnited Kingdom Gap, the commanding officers of today's frigates report that they may be able to use their hull-mounted sonars only about one day out of three during the winter and operate their helicopters only one day out of four. 6
The response of a ship to the sea is a strong function of its size but is also tightly coupled to the directional character of the sea waves. Figure 2 shows the typical variation of roll with heading for (A) a destroyer in 6-m significant wave height and (B) a frigate in 2.3-m significant wave height. 7 In a long-crested (narrow spectrum) sea, a heading change of only 300 can, for some headings, reduce roll by a factor of 3 (see blue area of Fig. 2A). On the other hand, in a short-crested, bimodal sea, roll is virtually independent of heading (Fig. 2B). Improved global directional wave forecasts have important consequences for both the merchant marine and naval fleets worldwide, not only in the safety of deck operations, but also in the efficiency of transit and consequently in increasing the effective operational area.
SATELLITE SCATTEROMETRY AND NUMERICAL WAVE MODELS
Future progress in global wave forecasting depends directly on improvements in global wind fields, model physics, and global directional wave measurements and related assimilation schemes.
Wind and wave estimates with sufficient density and coverage to be of value to the global numerical models
A 8
0; Q)
"0 (J)
I 4
"0 a:
B
0; Q) "0
"0 a:
Ship heading to primary sea
Figure 2. Variation of roll with heading. A. A destroyer in 6-m significant wave height. B. A frigate in 2.3-m significant wave height. The blue area in part A highlights how a heading change of just 30° can reduce ship roll motions by a factor of 3. (Courtesy of W. C. E. Nethercote, 1990.)
56
must come from satellite platforms. Remote techniques to measure wind and waves over the oceans have been explored, both theoretically and experimentally, for more than 25 years.8 Both passive and active microwave techniques are attractive because of their all-weather, 24-hour potential. Properly designed radar scatterometers transmitting at a wavelength of a few centimeters have been shown to be sensitive indicators of both wind speed and direction. The evidence from the Seasat scatterometer flown in 1978 is strong enough that future wind-measuring scatterometers are planned for the European Space Agency (ESA) Remote Sensing Satellite (ERS-l) in 1991 and for the Japanese Advanced Earth Observing Satellite (ADEOS) scheduled for the mid-I990s. On board ADEOS will be the NASA-developed scatterometer originally planned for the U.S. Navy's Remote Ocean Sensing System (NROSS), an ambitious multisensor concept that fell to budget cuts in 1986. The ESA and NASA scatterometers should nevertheless permit substantially improved global wind field estimates by the mid-1990s.
Meanwhile, wave-modeling physics and global dataassimilation schemes are also advancing, particularly with the advent of the new generation of supercomputers. The U.S. Navy has been using a supercomputer to produce global directional wave forecasts since early 1984 and expects to upgrade again in the early 1990s. The European Centre for Medium-Range Weather Forecasts has been using a Cray supercomputer for third-generation global wave forecasts since early 1987. With a single processor rate in excess of 100 MFLOPS (million floating point operations per second), a 48-hour global forecast (3 0 x 30 grid every three hours) requires less than five minutes of computing time. Effective assimilation of sparse satellite wind data from ERS-l and ADEOS will create even more stringent computational demands in the early 1990s. Efficient and clever algorithms are required to blend the new satellite measurements objectively into. the existing conventional forecasts. Global estimates of the full two-dimensional (directional) wave spectrum will be essential to "close the loop" in this blending process and to provide a continuous measure of the quality of the forecasts.
THE FUTURE ROLE OF SPACEBORNE SYNTHETIC APERTURE RADAR
Just as active microwave radars have been shown to be useful for monitoring the surface wind field, they can be equally useful for monitoring the surface wave field. Whereas spaceborne scatterometers apparently can be tolerated with a surface resolution of perhaps 10 to 50 km, accurate monitoring of the energetic surface waves (wavelengths between about 100 and 600 m) requires a spatial resolution of 30 to 50 m, both along the satellite velocity vector and normal to it. In effect, a highresolution radar image of the wave field must be formed. But for this image to be of value in estimating the directional height spectrum, the brightness of the image (or the intensity of the radar backscatter) must have a known relationship to the wave height. Only a few radar techniques have been shown to be potentially useful for re-
fohn s Hopkins APL Technical Digest , Volume 11 , Numbers 1 and 2 (1990)

mote ocean wave monitoring; only the synthetic aperture radar (SAR) has actually flown in space.
In a typical spaceborne configuration (Fig. 3), the SAR
antenna beam is located in the plane normal to the velocity vector, about 20 0 to 30 0 from nadir for ocean wave imaging. Range (cross-track) resolution is obtained by transmitting a narrow pulse and measuring the delay of the return, as in conventional radars. Azimuth (alongtrack) resolution is obtained by creating a synthetic aperture, typically consisting of several hundred to perhaps a thousand real antenna lengths. The synthesis is accomplished by transmitting at least two pulses while the satellite moves forward by one antenna length. This constraint is called "filling the aperture"; if violated, it can cause the SAR to produce false images and a high level of background noise. For a typical azimuth antenna dimension L and satellite velocity V (about 10 m and 7 km/s, respectively), the maximum allowable interpulse period is T = L/2 V, and the maximum attainable crosstrack swath is cT/(2 sin 0) ::::: cL/(4 V sin 0) ::::: 100 km, where C is the speed of light and 0 = 30 0 (off-nadir angle). Assuming that the aperture is properly filled, azimuth resolution is determined by the length of the
H
Nadir
Illuminated swath
\
Figure 3. Geometry of a spaceborne synthetic aperture radar, illustrating both the real and synthetic beams. L = real antenna length (::::: 10 m), D = synthetic aperture length (::::: 10 km), fa = azimuth resolution limit (:::::5 m), H = satellite altitude (= 800 km), V = spacecraft velocity (= 7 km/s), and () = offnadir angle (:::::30°).
Johns Hopkins APL Technical Digest, Volume 11, Numbers 1 and 2 (1990)
Global Wave Forecasting Using Spaceborne SAR
synthetic aperture, which can be as long as the product of the satellite velocity and the interval over which a point in the scene is illuminated by the radar beam. Consequently, shorter antennas with broader beams permit potentially higher resolution. The upper limit to azimuth resolution is about L/2, but to attain this limit, all the returns (typically hundreds or even thousands) from each range bin must be stored and cross-correlated with a reference function consisting of a Doppler history of a point source at that particular range.
Real-time SAR processing of large swaths requires large digital memory banks and high-speed parallel computations on the Doppler histories of the full set of scene elements. Real-time SAR processing of large swaths remains problematic, especially from satellites. For collecting ocean wave spectra, however, the swaths can be small and spatial continuity is not essential. In that special case, present digital technology combined with an efficient architecture can achieve real-time processing in a practical space-worthy configuration. As described in the concluding section, APL is planning to demonstrate such a processor in 1993 as part of the NASA Space Radar Laboratory.
RESEARCH HIGHLIGHTS OF THE PAST DECADE
In 1978, the NASA Seasat L-band SAR provided the first opportunity to monitor the spatially evolving directional wave spectrum from space. Several Seasat passes were analyzed by APL investigators over tracks of up to 1000 km. One such pass along the U.S. East Coast exhibited clear evidence, in its evolving spectra, of deepwater dispersion, convergence of wave rays back to earlier generating sources, refraction in the Gulf Stream, and shallow-water shortening. Analysis of this single pass illustrated the value of spaceborne SAR for global monitoring of the directional wave spectrum. 9
As the number of analyzed spectra began to accumulate, however, it became clear that the Seasat SAR lacked the ability to respond to all but the longest waves traveling in the azimuth direction of the spacecraft and, even worse, appeared to rotate other wave systems away from the azimuth direction. This problem is now widely recognized as a fundamental limit for SAR imaging of the moving ocean. Because the SAR is a Doppler measuring device, it misregisters scene scatterers having radial velocity components according to the relation
where
V
R Llxa V Vrs
azimuth displacement, range from the spacecraft to the scene scatterer, spacecraft velocity, and radial component of the scatterer velocity.
A typical R/ V ratio for a satellite at 800-km altitude, such as Seasat and the European ERS-l, is about 130 s.
57

R. C. Beal
A typical root-mean-square (rms) scatterer velocity might vary from 1 to 3 mis, depending on the sea state. This rms velocity ensemble of scatterers produces a "smearing" in the azimuth direction, that is, an azimuth falloff or low-pass filter in the wave-number spectrum. Thus, a typical random ensemble of ocean scatterers might cause a smear of nearly 400 m in a high sea. The only practical way to reduce the smear is to lower the altitude of the spacecraft, but lower-altitude orbits encounter additional drag, which must be offset with active propulsion.
In 1984, the NASA Shuttle Imaging Radar-B (SIR-B)
provided a second opportunity to acquire ocean wave spectra from spaceborne SAR. The shuttle SAR was an important test of the role of R / V in ocean wave imaging, since its altitude was only 230 km and its corresponding R/ V was less than one-third that of Seasat. With SIR-B, several ocean wave data sets were acquired simultaneously with independent aircraft estimates of directional wave spectra. One such experiment occurred off the coast of Chile. Flights under the shuttle by a NASA P-3 aircraft with a surface contour radar (SCR) 10
and a radar ocean wave spectrometer (ROWS) II produced nearly simultaneous and coincident estimates of the spectrum. Also, the Navy's Global Spectral Ocean Wave Model (GSOWM)12 produced forecast spectra every 12 hours. On three days out of four, the three sensors (SAR, SCR, ROWS) agreed well, confirming the fundamental advantage of the low-altitude SAR orbit. But on the day with the lowest sea state (1.6-m significant wave height) when most of the energy was concentrated at wavelengths shorter than 100 m, substantial azimuth falloff occurred even at the low shuttle altitude. 13 Fortunately, the waves contained so little energy as to be of minor operational importance. The GSOWM forecast often differed substantially from the sensor estimates, strongly suggesting that spaceborne SAR
would be valuable for validating and updating global ocean wave forecasts, especially in regions where wind measurements are either poor or sparse.
More recently, in March 1987, eight nations in Europe and North America participated in a more comprehensive wave experiment conducted in the Labrador Sea. The experiment was called LEWEX (Labrador Extreme Waves Experiment). Over a seven-day interval, thousands of estimates of the directional wave spectrum were obtained from several ship-deployed directional buoys, two ship radars, three aircraft radars (a Canadian C-band SAR, the NASA SCR, and the NASA ROWS), and nine wind-wave forecast models. Although LEWEX was originally planned to coincide with a NASA shuttle flight (SIR-B ' ), the Challenger accident in early 1986 caused a major reconfiguration of the experiment.
The comprehensive LEWEX results will be published in a series of articles in the next issue of the Johns Hopkins APL Technical Digest (Vol. 11, Nos. 3 and 4). Among other things, the LEWEX results have indicated the following: (1) The low R / V ratio SAR spectral estimates, when collected close to nadir, describe the directional spectrum of ocean waves longer than 100m as well as the other two aircraft techniques do, reinforcing
58
the SIR-B Chile results; (2) the wave model forecasts, particularly when driven by separately derived winds, can be in gross disagreement with one another when describing the directional aspects of the wave field; and (3) wind field errors often constitute the single largest source of poor wave forecasts.
The implication from LEWEX is that spaceborne SAR
estimates of the global directional wave spectrum, if collected from a low-altitude ( < 300 km) orbit and properly assimilated into the numerical models, could substantially improve the present state of global wave forecasting. Of course, global forecasting will also be improved by the advent of satellite wind measurements. Ideally, satellite wind and wave measurements will be collected and assimilated into models simultaneously, although not necessarily from the same satellite platforms.
THE NEXT FIVE YEARS AND BEYOND More than 25 years ago, a group of radar experts and
oceanographers meeting at Woods Hole Oceanographic Institute proposed the use of spaceborne radar for global wave monitoring. 8 More than 15 years ago, APL
proposed to NASA a global ocean spectral sampling mode to enhance the Seasat SAR,14 which itself was then only an option on the newly conceived ocean remote sensing satellite. In the spectral sampling mode, small patches of ocean a few kilometers on a side were to be sampled every 250 km along track. The resulting data would be stored in an on-board tape recorder and transmitted each orbit to one of three ground stations. Within 24 hours, all the oceans would be sampled as if thousands of buoys had been uniformly deployed along the satellite track.
It was an ambitious idea at the time, and we now know that it was also premature. The excessive Doppler smearing from Seasat's high altitude would have severely limited the value of the spectra for wave forecasting. Now, with the hindsight of hundreds of analyzed spectra from Seasat and SIR-B and several thousand more from LEWEX, we are preparing once again to execute the 1974 concept, this time in the NASA SIR-C. The Space Radar Laboratory, which includes SIR-C, is the next step in NASA'S Earth Science and Applications Program to explore the role of multifrequency, multipolarization SAR. Nearly 50 experiments will be conducted by investigators from 13 countries in six scientific research areas: ecology, geology, hydrology, oceanography, radar calibration, and electromagnetic scattering theory. The Space Radar Laboratory will contain three separate transmitters at L, C, and X bands; the L and C channels will operate in both horizontal and vertical polarization. Investigators at APL will be participating in oceanographic experiments in both the Northern and Southern hemispheres. In addition, APL is developing an experimental on-board SAR processor to produce nearly continuous real-time ocean wave spectra from the Cband channel. The concept is similar to that proposed for Seasat in 1974, but with the following improvements:
1. Nearly contiguous azimuth coverage will increase the statistical reliability of the spectral estimates by about a factor of 3 over that proposed in 1974.
Johns Hopkins APL Technical Digest, Volume 11, Numbers 1 and 2 (1990)

2. The low R/ V ratio of the shuttle will improve the azimuth resolution of the spectra by a factor of more than 3, and should allow distortion-free monitoring of the more energetic waves in the ocean, especially in the Southern Hemisphere, where the waves tend to be longer because of the unlimited fetch available to the wind.
3. In addition to the on-board tape recorder storage proposed in 1974, the processed spectra from SIR-C will be multiplexed into a real-time telemetric downlink of the Space Radar Laboratory. They will then be relayed at S band through one of two NASA Tracking and Data Relay Satellites (TORS) to White Sands, New Mexico, and from there through the Domestic Satellite (DOMSA T) relay to the shuttle mission control at Johnson Space Center in Houston (see Fig. 4). Nearly instantaneous (within a few seconds) reception of the measured spectra will be available, even from the remote Southern Ocean.
On the ground, the raw spectra will be converted through a series of linear transformations to estimates of directional wave spectra. They will then be sent via standard 9600-baud telephone lines to an APL archiving computer, where they will be immediately accessible from numerous remote sites, including the Navy's Fleet Numerical Oceanography Center at Monterey. In collaboration with the Center's personnel, we plan to make direct comparisons of the sAR-measured spectra with the model-predicted spectra for the duration of each of the three shuttle missions, the first of which is now scheduled for 1993. The SIR-C experimental processor data should thus accomplish two major objectives that have eluded us for nearly 20 years: (1) It will illustrate in a statistically significant way, and over global scales, how much a spaceborne SAR could improve current operational directional wave forecasting, and (2) it will demonstrate the technical feasibility of a spaceborne real-time SAR processor.
As military budgets shrink in the 1990s, the Navy will have to take maximum advantage of smaller, more highly mobile surface forces. Improvements in medium-range (3- to 10-day) ocean wave forecasts will take on an added importance in the safe and reliable extension of naval power to remote parts of the globe. To enhance reliability, surface forces should have direct access to satellites for environmental updates. In such a cost-conscious environment, a tailored special-purpose wave-monitoring satellite, whose predicted performance could be based on an actual global demonstration, might become especially attractive.
REFERENCES
1 Psalms 107:23-26 (King James Version) . 2Morgan, D., The Voyage of American Promise, Houghton Mifflin Co.
(1989), p. 99. 3Dobson, E. B., and Porter, D. L., "Global Measurements of Wind Speed and Significant Wave Height from the Geosat Altimeter," 1. Geophys. Res. (in press, 1990).
4Schumann, E. H., "Giant Wave: Anomalous Seas of the Agulhas Current, " Oceans 13, 27-30 (1980).
5Wilson, G. c., "Navy Halts Routine to Reexamine Safety," The Washington Post, p. 1 (15 Nov 1988).
6Kehoe, J. W ., and Brower, K., "Finding a Frigate for the Future," Proc. U.S. Naval Institute 115, 79- 84 (Jun 1989).
7 NA TO Research Study Group [RSG-l] Final Report on Full Scale Wave Measurements (in press, 1990).
Johns Hopkin s APL Technical Digest , Volume 11 , Numbers 1 and 2 (1990)
On-board orbiter
Data relay
Ground processing
and distribution
Global Wave Forecasting Using Spaceborne SAR
Raw C-band signal from Space Radar Laboratory
APL on-board SAR processor
Shuttle network signal
processor
Tracking and Data Relay
Satellite
Johnson Space Center
APL processing computer
(Johnson Space Center)
Figure 4. Block diagram showing real-time data flow of the SIR-C on-board processor through the data relay and ground processing to remote sites such as the Navy's Fleet Numerical Oceanography Center at Monterey.
8 Oceanography from Space, Ewing, G. c., ed., Woods Hole Oceanographic Institute, Ref. No. 65-10 (Apr 1965).
9Beal, R. C., Gerling, T. W., Irvine, D. E., Monaldo, F. M., and Tilley, D. G., "Spatial Variations of Ocean Wave Directional Spectra from the Seas at Synthetic Aperture Radar," 1. Geophys. Res. 91,2433-2449 (1986).
IOWalsh, E . J., Hancock, D. W., Hines, D. E., Swift, R. N., and Scott, J . F., " Directional Wave Spectra Measured with the Surface Contour Radar, " J. Phys. Oceanogr. 15, 566-592 (1985).
IIJackson, F . C ., Walton, W. T., and Baker, P. L., "Aircraft and Satellite Measurements of Ocean Wave Directional Spectra Using Scanning Beam Microwave Radars, " J. Geophys. Res. 90, 987-1004 (1985).
12Clancy, R. M., Kaitala, J. E ., and Zambresky, L. F., "The Fleet Numerical Oceanography Center Global Spectral Ocean Wave Model," Bull. Am. Meteorol. Soc. 67, 498-512 (1986) .
59

R. C. Beal
I3Beal, R. C., " Spectrasat: A Hybrid ROWS/ SAR Approach To Monitor Ocean Waves from Space," fohns Hopkins APL Tech. Dig. 8, 107-115 (1987) .
14Seasat-A Definition Phase Baseline Mission Report, JHU/ APL SDO-3831 (Nov 1974).
THE AUTHOR
/
ACKNOWLEDGMENT: This review was supported by APL independent research and development. Since 1978, SAR ocean wave research at APL has also been supported by NOAA, ESA, NASA Headquarters, the Jet Propulsion Laboratory, the Office of Naval Research, and the Office of the Oceanographer of the Navy.
ROBERT C. BEAL was born in Boston in 1940. He received a B.S.E.E. from MIT in 1 % 1 and an M.S. in physics and astronomy from The University of Maryland in 1968. In 1980, he received a Parsons Fellowship for research in oceanography at The Johns Hopkins University. Mr. Beal has been with the APL Space Department since 1%1, except from 1968-72, when he was employed at Itek Optical Systems in Burlington, Mass., and during 1976-77, when he was a visiting scientist at the Jet Propulsion Laboratory. Since 1978, he has been a principal investigator for various
SAR oceanography research programs funded by NOAA, NASA, and the Navy. He is presently supervisor of the Oceans Section in the Space Geophysics Group.
60 Johns Hopkins APL Technical Digest, Volume 11, Numbers I and 2 (1990)

OCEANOGRAPHY: Further Reading
VOLUME 1
49 Mesoscale Oceanographic Mapping 148 The Potential of Spaceborne Synthetic Aperture Radar
for Oceanography 284 Direct Measurement of Vertical Shear in the Open Ocean
VOLUME 2
3 Satellites for Earth Surveying and Ocean Navigating 56 Optical Measurement of the Phase Velocity of Ocean Waves
During the 1978 Wave Dynamics Experiment
VOLUME 3
2 Guest Editor's Introduction 4 Airborne Radiometric Measurements of Sea Surface
Temperature 12 Vortex Trails in Stratified Fluids 19 The Separation of Oceanic Temperature Finestructure and
Internal Motion 28 Characteristics of Thermal Microstructure in the Ocean
36 Evolution of a Vertically Distributed Passive Scalar in the Seasonal Thermocline
42 Simulation of Oceanographic Processes in the Hydrodynamics Research Laboratory
49 W A VDYN: Measurements of the Independence of Ocean Wind Waves
59 Oceanographic ELF Electromagnetic Investigations at APL 67 Comparison of Three Acoustic Transmission Loss Models
with Experimental Data
VOLUME 4
212 Digital Recording and Signal Processing Systems for Hydrophone Arrays
267 Internal Solitary Waves in the Sulu Sea
VOLUME 6
186 The Reduction in Finestructure Contamination of Internal Wave Estimates from a Towed Thermistor Chain
194 A Statistical Analysis of Patches of Oceanic Small-Scale Activity
203 A Numerical Simulation of Vortex Motion in a Stratified Environment and Comparison with Experiments
211 Convection at a Model Ice Edge 216 Application of Coupled Mode Theory to Acoustic
Scattering from a Rough Sea Surface Overlying a Surface Duct
227 Biological Transport, Internal Waves, and Mixing in the Chesapeake Bay
276 APL's Independent Research and Development Thrust in Oceanography
284 Remote Sensing for Oceanography: An Overview 293 Ocean Research with Synthetic Aperture Radar 300 Image Formation from Spaceborne Synthetic Aperture
Radar Signals 313 Waves Across the Ocean 320 Remote Sensing of the Ocean-Surface Wind Field with
a Scatterometer and a Synthetic Aperture Radar 330 Hydrodynamics and Radar Signatures of Internal Solitons
in the Andaman Sea 338 Synthetic Aperture Radar Imaging of Internal Waves
346 Intensity Modulations in Synthetic Aperture Radar Images of Ocean Surface Currents and the' Wave/ Current Interaction Process
354 Measurements of Directional Wave Spectra by the Shuttle Synthetic Aperture Radar
Johns H opkins A PL Technical Digesc, Volume 11 , N umbers I and 2 (1990)
Oceanography
Henrick, R. F.
Beal, R. C. Smart, J. H.
Black, H. D.
Gotwols, B. L., and Irani, G. B.
Smith, G. L.
Gasparovic, R. F., Peacock, K., and Tubbs, L. D. Pao, H. -P., Lai, R. Y., and Schemm, C. E.
Roth, M. W. Mack, S. A., Wenstrand, D. c., CaIman, J., and
Burkhardt, R. C. Crawford, L. J., Vasholz, D. P., Giles, J. w., Jr.,
and Gundersdorf, C. J.
Brandt, A., and Hurdis, D. A.
Irani, G. B., and Gotwols, B. L. Ko, H. W. , Giannini, J. A ., and Herchenroeder, P. A.
Boyles, C. A., and Joice, G. W.
South, H. M. Apel, J. R., and Holbrook, J. R.
Dubbel, D. C.
Schoeberlein, H. C.
Hirsh, R. S. CaIman, J.
Boyles, C. A., Dozier, L. B., and Joice, G. W. Sarabun, C. c., Brandt, A., Tyler, M. A .,
and Smith, G. D.
Gilreath, H. E. McGoldrick, L. F. Beal, R. C.
McDonough, R. N., Raff, B. E., and Kerr, J. L. Irvine, D. E.
Gerling, T. W. Apel, J. R., Thompson, D. R. , Tilley, D. G.,
and Van Dyke, P. Gasparovic, R. F., Apel, J. R., Brandt, A.,
and Kasischke, E. S.
Thompson, D. R.
Monaldo, F. M.
61
Oceanography
VOLUME 7
42 A Linear Response Theory for Waves in a Geophysical Fluid
VOLUME 8
4 Symposium Overview 7 Ocean-Wave Prediction: Where Are We?
11 A General Explanation of the Quasi-Universal Form of the Spectra of Wind-Generated Gravity Waves at Different Stages of Their Development
15 Limitations of Spectral Measures and Observations of the Group Structure of Surface Waves
18 The Effect of Swell on the Growth of Wind Waves 24 The Present Status of Operational Wave Forecasting 33 The Operational Performance of the Fleet Numerical
Oceanography Center Global Spectral Ocean-Wave Model 37 Recent Results with a Third-Generation Ocean-Wave Model 42 Practical Seakeeping Using Directional Wave Spectra 48 Some Approaches for Comparing Remote and In-Situ
Estimates of Directional Wave Spectra 55 The Microwave Measurement of Ocean-Wave Directional
Spectra 65 The Physical Basis for Estimating Wave Energy Spectra
from SAR Imagery 70 The Physical Basis for Estimating Wave Energy Spectra
with the Radar Ocean-Wave Spectrometer 74 Wave-Measurement Capabilities of the Surface Contour
Radar and the Airborne Oceanographic Lidar 82 A Practical Methodology for Estimating Wave Spectra
from the SIR-B 87 SIR-B Ocean-Wave Enhancement with Fast-Fourier
Transform Techniques 94 The Age and Source of Ocean Swell Observed in Hurricane
Josephine 100 Extreme Waves in the Agulhas-A Case Study in Wave
Current Interaction 107 Spectrasat: A Hybrid ROWS/SAR Approach to Monitor
Ocean Waves from Space 116 The Radar Ocean-Wave Spectrometer 138 Panel Discussion: Is There a Clear Need for a Global Wave
Monitoring System?
VOLUME 10
45 The Spatial Characterization of Bio-Optics in the Sargasso Sea 279 Project LEWEX: An International Reading of Ocean Waves 293 Guest Editors' Introduction 295 Internal Wave Measurements in a Norwegian Fjord Using
Multifrequency Radars 307 Internal Waves from Moving Point Sources 318 Delta-k Radar Measurements of Internal Waves in the
Sognefjord 326 Synthetic Aperture Radar Imaging of Ship-Generated
Internal Waves 332 Probing the Ocean Waves with Microwave Radar 339 Refraction Modeling of Internal Waves in a Two-Layer
System, as Observed in the Strait of Gibralter 348 A Statistical and Mechanical Explanation of the Garrett
and Munk Model of Oceanic Internal Waves
Apel, J. R.
Donelan, M. A., and Plant, W. J. Phillips, 0. M.
Kitaigorodskii, S. A.
Mollo-Christensen, E. Donelan, M. A . Cardone, V. J.
Zambresky, L. F. Komen, G. J. Bales, S. L.
Pierson, W. J., Jr.
Plant, W. J.
Lyzenga, D. R.
Jackson, F. C. Walsh, E. J., Hancock, D. W., III, Hines, D. E.,
Swift, R. N., and Scott, J. F.
Mona/do, F. M.
Tilley, D. G.
Gonzalez, F. I., Holt, B. M., and Tilley, D. G.
Irvine, D. E.
Beal, R. C. Jackson, F. C.
Ondercin, D. G. McCloskey, W. Ape/, J. R., Gasparovic, R. F., and Kilgus, C. C.
Apel, J. R., and Gjessing, D. T. Dysthe, K. B., and Truisen, J.
Jensen, J. R.
Gasparovic, R. F., Thompson, D. R., and Apel, J. R. Thompson, D. R .
Watson, G.
Allen, K. R., and Joseph, R. I.
62 Johns Hopkins APL Technical Digest, Volume II , Numbers I and 2 (1990)