the role of r&d leverage as a dynamic capability in
TRANSCRIPT

20
Journal of Business Administration Research | Volume 02 | Issue 02 | April 2019
Distributed under creative commons license 4.0 DOI: https://doi.org/10.30564/jbar.v2i2.755
Journal of Business Administration Research
http://ojs.bilpublishing.com/index.php/jbar
ARTICLE
The Role of R&D Leverage as a Dynamic Capability in Performance Creation: Evidence from SMEs in Taiwan
Tung-Shan Liao* College of Management, Yuan Ze University, Taoyuan City, 32003, Taiwan
ARTICLE INFO ABSTRACT
Article historyReceived: 11 April 2018 Accepted: 17 April2018Published Online: 19 April 2019
This study addresses the role of R&D leverage in SMEs’ performance creation. The authors do so by considering SMEs’ high resource depen-dence due to isomorphism. We propose that R&D leverage, with a pres-ence of dynamic capabilities, plays a moderating role in the relation be-tween resource investments and performance. This study, which focused on Taiwan’s SMEs, conducts a questionnaire survey using the hierarchi-cal sampling technique, across various industries and geographic areas in Taiwan. The empirical findings reveal that R&D leverage as an essential leveler in resource management enhances resource advantages.
Keywords:Dynamic capabilities viewR&D leverageIsomorphismSMEsFirm performance divergence
*Corresponding Author:Tung-Shan Liao,College of Management, Yuan Ze University, No.135 Yuan-Tung Road, Zhongli District, Taoyuan City, 32003, Taiwan;Email: [email protected]
1. Introduction
Relative to large companies, the market scope of small and medium sized enterprises (SMEs) is generally restricted due to resource or capital
limitations [33,104]. The development of the resources of SMEs is forced to be highly path dependent not only on the existing resource base, but also on the technologi-cal trends in the factor market. Therefore, when SMEs compete in the same market position, they may display a greater degree of resource homogeneity than that of large firms.
Scholarly work on organization theory expresses such resource dependent phenomenon as organizational isomor-phism. DiMaggio and Powell [39] define isomorphism as “a constraining process that forces one unit in a population to
resemble other units that face the same set of environmental conditions” (p.149). Industrial organizations can be viewed as isomorphic when considering the similarity of their structures, resources, practices and strategies [35].
Studies suggest that organizational isomorphism is especially evident for small firms as they generally have similar capital scale and capacity to access market com-mon resources [21].
Popadiuk, S., Rivera, E. R. and Bataglia, W [99] reveal a common isomorphic pattern, showing that resource dependence drives resource similarity, which in turn caus-es performance convergence among isomorphic SMEs. These findings may be extended as a basic model to in-vestigate SMEs’ dependence upon technological resources and R&D management.
R&D and innovation are often considered as self-ev-

21
Journal of Business Administration Research | Volume 02 | Issue 02 | April 2019
Distributed under creative commons license 4.0 DOI: https://doi.org/10.30564/jbar.v2i2.755
idently positive for organizational performance. Many SME studies (e.g. [116]; Iorun, 2014) have provided rigor-ous evidence that R&D effort is a determinant of SME success. However, these studies generally focus on the role of R&D in product and service innovation and dif-ferentiation. Little research has been extended to focus on the issue of how R&D practices influence an SME’s overall resource management. In addition, there has been even less research on such an influence under isomorphic conditions.
This study defines R&D leverage as a firm’s capacity of resource management in R&D [88] by using the dynam-ic capabilities view (DCV) grounded in strategic manage-ment [44,121,122,123,124,125,126,132,130,131] and modifying the concept of dynamic R&D resource allocation (Scholefield, 1994).We argue that R&D leverage spurs the generation of id-iosyncratic resources and intangible capital, and makes them sharable and useful with other functional units within the firm [20,62]. In addition, the recent investigation on the evolution of R&D management also presents that R&D management has evolved as a multi-technological network platform that supports a firm’s development in terms of its resource base as a whole for its business mod-el innovation[82,90].
Such thought gives rise to the purpose of this study for the investigation of the extent and consequences of R&D leverage with regard to our first research question: how R&D leverage supports and spurs SMEs’ transformation of resource investments to competitive advantages? In ad-dition, as aiming for the analysis of this relationship (stated in the first purpose) under the assuming isomorphic situa-tion among SMEs, we pose the second research question: does the isomorphic condition neutralize the moderating effect of R&D leverage of SMEs on the relationship be-tween resource investments and competitive advantages?
The research is organized as follows. First, the hypoth-eses will be built for presenting the moderating role of R&D leverage in the relation between resource invest-ments and the superiority of resource advantages. Second, the methodologies used in this paper are noted to present how we proceed with the data collection and analysis. We then present the empirical results and analysis. Finally, this paper discusses the findings, limitations and implica-tions.
2. Hypotheses
Past studies on the RBV seem to have a consensus regard-ing the causal nexus between resources (also capabilities and core competencies) and performance (e.g. [8,13,38,69]). Newbert [89] conducted a post hoc analysis through a large-scale empirical research to assess the RBV’s fundamental
hypotheses. His findings provide overall support with a positive view for this relationship. Considering a firm’s resource development with a dynamic view, Mahoney and Pandain [80] suggest that a firm’s efforts to develop com-petitive advantages need the introduction of new resources (Teece, et al., 1997; [122]). To do this, firms need timely and continuous resource investments into their resource bases [12,14,60].
Having the DCV in mind, resource investment could be considered as a basic form of microfoundation of a firm’s dynamic capability, referring to an action of how firms modify, integrate and innovate the resource base toward competitive advantages [59,121,122,124,125,132]). For ex-ample, human resources, encompassing both individuals and organizations, present kinds of resources comprising knowledge and techniques [58,68]; their organization and renovation (i.e. the processes of recruitment, training and cultivation) are perceived as critical elements determin-ing the competitive advantage of firms [78]. The similar investigations and results are also revealed with the other resource foundations of firms, such as R&D investments [76,115,111,110], marketing-related resource investments [40,64,117], and resource investments and renewal for asset specificity ([112]; [119]). This leads us to propose a statistical approach to test SMEs’ behavior functions of resource management toward competitive advantages. We investigate whether and how SMEs’ resource investments contribute to perfor-mance growth of the firm. Thus, we propose the following hypothesis:
Hypothesis 1: SMEs with a Higher Level of Resource Investments are Likely to Have Better Growth in Firm Performance.
The influence of R&D on firm performance is gener-ally evident, especially among the technology-intensive industries [34]. A significant portion of the most commonly presented research in the field has drawn this influence as a causal relationship between R&D investments and performance (e.g. [25,49,52; 76;79; 84;92;102;116]). Another portion of research has considered R&D relevance as being far more aligned with the orientation of resource leverage, suggesting that a firm’s resource advantages are generated by resource concentrating, accumulating, complementing, conserving, and recovering [57]. Scholars have explored the potentials of the synergic effects on performance through the linkage, integration and interaction among the R&D process and other functional operations within organiza-tions (e.g. [30, 51,54,62,73,88]).
Clearly, the major difference between these two streams stems from how research operationalizes R&D activity in regard to whether it tends to be resource investment or resource leverage. It has been suggested that the resource
22
Journal of Business Administration Research | Volume 02 | Issue 02 | April 2019
Distributed under creative commons license 4.0
investment relevance refers more to resource allocation, and thus relies upon aspects of theory developed by the RBV [10]. However, the research stream that relates to resource leverage features a theoretical application with CBV logic [57,88] and later with DCV [59,132,121,122].
This study suggests that it is critical to highlight the theoretical basis of R&D leverage in relation to the mi-crofoundations of the dynamic capability that reflects the process of R&D deployment and management[88]. In practice, this process supports a firm in making better applications for its overall resource base in order to at-tain its specific strategic intentions and goals [20,57,80]. This argument essentially aligns with the DCV that dynamic capabilities signify a higher order capability [44,131], where how firms organize their organizational processes show-cases the way in which, and the capacity by which, they develop and deploy their resource bases [132].
Assessing our arguments depends on how we put forth the role of R&D leverage in the relationship between resource investment and performance. It can be seen that R&D leverage plays as a moderator in the relationship between resource investments and performance. For ex-ample, given two firms (firm A and firm B) competing in the same market with similar dominant power in the dis-tribution channel (i.e. assuming a comparable resource level in the market), if these two firms offer similar prod-ucts in the market (i.e. without the moderating effects of R&D leverage), both firms may gain even performance. In another situation, if firm A’s R&D process is better than firm B’s in the market driven design for its prod-ucts, firm A may thus gain more market power in the dis-tribution channel, as supported by its product offerings in so far as they can better meet market needs than can firm B (i.e. with moderating effects of R&D leverage). Hence, firm A can experience better financial yield (along with an increase in market power).
We therefore consider how R&D leverage influences performance, which occurs mostly through the moder-ating effect on the relationship between resource invest-ments and performance. This study proposes the follow-ing hypothesis for SMEs:
Hypothesis 2: SMEs’ Synergistic Effect of Resource Investments on Performance Growth Will be Greater When They Have Increased R&D Leverage.
In regard to isomorphism, we see it as an influential environmental factor in the research context of this study. Isomorphism has been largely recognized as a socializa-tion process that drives the interactions and convergence among firms’ structural settings, operational practices, strategy development, and even performance [36].
Empirical studies on isomorphism largely intend to
investigate how isomorphic factors influence firm per-formance (e.g. [71,91,50,109,19,33,74, 104]). Although their out-comes are significant, another, but recently emerging and considering more important, research interest of isomorphism studies is performance convergence among firms [36]. [104] study on the isomorphic process in indus-tries suggests that performance convergence is an inevi-table consequence. For example, due to the limitation in capital scale, isomorphic SMEs are generally considered as resource-dependent in regard to their applications of technological innovation [33,104]. Performance conver-gence is thus highly possibly based on the similar use of technologies [33], even if the application of technologies is viewed as an essential leveler of competitive perfor-mance [104]. Therefore, considering the interdependence of isomorphism and resource dependence, it should be possible to assume that performance convergence is more evident in isomorphic SMEs than in non-isomor-phic SMEs.
In response to our hypothesized model, performance convergence (or divergence) can be examined by testing the differences between isomorphic SMEs and non-iso-morphic SMEs, depending on the influential strength of the causal nexus between resource investments and per-formance, as well as from R&D leverage that is hypothe-sized to moderate resource investments on performance. Therefore, this study hypothesizes:
Hypothesis 3a. Compared with isomorphic SMEs, non-isomorphic SMEs’ performance growth is more like-ly to be influenced by resource investments.
Hypothesis 3b. Compared with isomorphic SMEs, non-isomorphic SMEs’ R&D leverage is more likely to generate a stronger moderating effect on performance growth as a result of resource investments.
3. Methodologies
3.1 Sample and Data Collected
In this study, hierarchical sampling was used to compose the sample from Taiwan’s SMEs registered at TaiwanPage Corp. (www.taiwanpage.com.tw, investigated in the first week of March, 2017). The sample clusters were set in accordance with the county/city areas in Taiwan. In each area, 2% of the registered companies were selected ran-domly to compose the sample; 1,970 companies (out of 98,501 SMEs registered at TaiwanPage) were selected for the further task of data collection.
To avoid the potential common method variance (CMV) or common method bias (CMB) in the survey (especially when concerning the cross-sectional investigation in this study), the questionnaire was developed through an itera-
DOI: https://doi.org/10.30564/jbar.v2i2.755

23
Journal of Business Administration Research | Volume 02 | Issue 02 | April 2019
Distributed under creative commons license 4.0
tive process involving discussion, review and refinement (with industrial experts), and pre-testing (through more than 25 managers worked in SMEs); the questionnaire design involved instructions, information and cues for responses; and the questionnaire was designed by requir-ing to be completed by different respondents according to their expertise [97,98]. The questionnaire was designed for collecting 4 parts of the data, including the basic information and industrial background of the company, performance relative factors, R&D leverage activities, and resource investments and management. In the ques-tionnaire, instructions on the cover letter requested either the company representative, chief executive, or senior manager to complete the first two parts of the survey for basic information and industrial background and re-source investments and management, then to forward the part on the R&D leverage survey to the R&D manager and the part on the performance survey to the manager in charge of the finance department, in order to complete the survey.
In addition to the questionnaire design, this study also used the Harman single-factor test [97] and the Un-measured Latent Method Construct (ULMC) approach [75,98,103,129] to assess the potential CMV in this study. The results of Harman single-factor test showed that the variance of the first factor accounted for either 37.39% (before the item analysis) or 31.12% (after the item analysis) of the overall variance was far lower than the benchmark (50%) of the emergence of CMV [48]. Second, in the ULMC test, we included a common latent factor (or common method factor), which is an aggregate of all observed variables used in the study, to represent and partial out the potential CMV. The results showed that the average explained variance of the proposed factors (0.324) is much more dominant than the average ex-plained variance of the common latent factor (0.06); and that almost all of the common latent factor loadings are non-significant in the test. Given these results, includ-ing Harman single-factor test and the ULMC test, we contended that the CMV was unlikely to confound the investigation of this study (see Appendix 3).
This study conducted data collection based on the sample selected through various questionnaire survey techniques. These include post, email, on-call interview, and face to face interview. These surveys were conduct-ed from March to June of 2017. In March and April, the post and email survey was conducted by mailing/email-ing the questionnaires to the selected samples. In the first week of May (1st - 5th), we collected about 89 (post=56; email=33) effective samples (total respondents = 112 (post=65; email=47) error sample=23 (post 9; email 14)).
The effective response rate is about 4.52% at this stage. We further conducted the on-call survey and face-to-face interviews for the rest of the companies in our selected sample in May. We obtained another 66 effective sam-ples (on-call = 43; face-to-face = 23; error = 0). In total, 155 effective samples were collected, for an effective response rate of about 7.87% (total respondents = 178, error respondents = 23). Finally, the occasional missing data on exogenous variables were dealt with by replac-ing them with the average value. In our prior investiga-tion on preparing the sample, the percentage of missing data in our survey was about 1.98%. The comprehensive information on the sampling is listed in Appendix 1.
Given a low response rate may give rise to the pos-sibility of nonresponse bias (NRB) in the data. In this study, ANOVA analysis was undertaken to investigate such survey bias. We tested whether any difference ex-ists between the effective responses which were grouped based on the survey types (e.g. post, email, on-call inter-view, and face to face interview used in this study) and collected in the different time frames [42,53,72]. The test results (see Appendix 4) showed that, for each question, the null hypothesis of no significant difference was not rejected. In other words, respondents among the de-signed groups did not differ in responses. It can thus be suggested that non-response bias is not a considerable problem in the survey of this study.
3.2 Measures Adopted
3.2.1 Performance Growth (Dependent Factor)
While performance is often measured by using objective measures (such as ROA, ROE, sales growth, and others), this study constructed the factor of performance growth through judgment measure instrumented by the execu-tive’s perception on how well the organization performs. One reason for making this decision is that the investiga-tion of this study is cross-sectional, rather than longitu-dinal (the latter may be advantageous in using objective measures of performance). A cross-sectional investigation on firm performance growth is advantageous in looking to various performance aspects of management practic-es in organizations [65]. In addition, other special reasons may be that, for SMEs, many see objective measures of performance as business secrets and thus are unwilling to reveal them in public; executives or senior managers may also have poor memory of performance in special figure measurement. If there is no compulsive mater (i.e. gov-ernments’ regulations), this kind of questions may signifi-cantly reduce the response rate of the survey.
This study asked SMEs’ executives to rate the perfor-
DOI: https://doi.org/10.30564/jbar.v2i2.755

24
Journal of Business Administration Research | Volume 02 | Issue 02 | April 2019
Distributed under creative commons license 4.0
mance growth for 7 aspects within the latest three years (2014-2016). These questions included financial perfor-mance [100], satisfaction of shareholders [85, 86,87], market share and growth [76,100], market control and power [84], industrial relationship[85, 86], employee turnover [100], and internal process efficiency [86,100]. A 7-point scale – 1 for strongly worse to 7 for strongly better if comparing the performance growth between the latest three years (2014-2016) and the previous three years (2011-2013) – was used (the full question descriptions list in Appendix 2).
In the pre-analysis (item analysis) for these exogenous measures in the factor of change in performance by using Cronbach’s alpha evaluation and commonality test (eval-uated by corrected item total correlation), three questions were considered to be dropped from our investigation on performance based on their significant low reliability statistics, even if the Cronbach’s alpha of the performance
survey was tested at about 0.760 (the acceptable level). These question items were satisfaction of shareholders (corrected item total correlation = 0.237), industrial rela-tionship (0.271), and market control and power (0.263). Therefore, for the further analysis, this study used four other measures (including: financial performance, market share and growth, employee turnover, and internal process efficiency) to measure the performance growth factor (see Table 1).
3.2.2 Resource Investments (Independent Factor)
In order to measure the latent factor of resource invest-ments, we asked SMEs’ executives to rate the extent of capital investments for the designated aspects. These in-clude human capital [17], asset specificity[105], manufactur-ing (production) management [57], marketing management [77], organizational structure and process [11,121], finance
Table 1. The Results of Reliability Test (Cronbach’s Alpha)
Latent and Observed Variables Mean Standard Error Corrected Item Total Cor-relation
Firm PerformanceCronbach’s Alpha of Construct = 0.760
Financial performance 5.045 1.083 0.485
Satisfaction of stakeholders* 4.728 0.917 0.237
Market share and growth 5.335 1.065 0.589
Market control and power* 4.920 1.008 0.263
Industrial relationship* 4.815 1.042 0.271
Employee turnover 4.865 1.217 0.546
Internal process efficiency 5.129 1.085 0.620Resource Investments
Cronbach’s Alpha of Construct = 0.814
Human capital intensity 5.090 0.863 0.564
Asset specificity intensity 5.477 1.002 0.525
Manufacturing (production) management 5.116 0.933 0.564
Marketing management 5.419 1.080 0.645
Organizational structure and process 5.297 1.106 0.673
Finance management 4.961 0.911 0.489
Management of external cooperative relations* 4.821 1.075 0.211R&D Leverage
Cronbach’s Alpha of Construct = 0.744
Market Driven R&D 5.394 0.970 0.528
Project management* 4.530 1.151 0.189
Introducing new technologies 5.032 1.066 0.492
Training of R&D 5.503 0.833 0.502
Efficiency of R&D organization 5.594 0.895 0.581
Product driven R&D 5.323 0.890 0.450
Risk management* 4.557 0.811 0.287
Note: Sample size = 155. Observed variables noted ‘*’ are considered dropping from the investigation due to the low reliability statistics.
DOI: https://doi.org/10.30564/jbar.v2i2.755

25
Journal of Business Administration Research | Volume 02 | Issue 02 | April 2019
Distributed under creative commons license 4.0
management [28], and the management of external coopera-tive relations [118].
Instructions on this part of survey required the exec-utives of the sample companies to respond, if possible, by referring to the comparison between their expenditure (or capital) intensity within 2014-2016 and that within 2011-2013. A 7-point scale – 1 for strongly worse to 7 for strongly better – was used (the full question descriptions are listed in Appendix 2). In addition, in the item analysis of this part, the Cronbach’s alpha statistics was tested at about 0.814, a good level of reliability. Still, only the man-agement of external cooperative relations was dropped from the investigation of resource investments due to its significantly low commonality test result (0.211) (see Ta-ble 1).
3.2.3 R&D Leverage (Moderator)
Developing the measurement of the latent factor of R&D leverage is linked to the task of exploring a set of micro-foundations of firm dynamic capabilities in terms of R&D management and processes. This study reviewed a broad scope of literature relevant to R&D management and dynamic capabilities in order to build a set of potential exogenous measures to construct this latent factor. These measures include: market/customer driven R&D [23,26,83, 114], project management [18,29, 114], introducing new tech-nologies ([114]; [120]), training of R&D [76,127,128], efficiency of R&D organization [31,114], product driven R&D [26, 90], and risk management [41].
This study asked SMEs’ executives to rate R&D lever-age by measuring the extent of the change of expenditures and efforts invested in the R&D management activities [16] in 7 aspects, by comparing them within the latest three years (2014-2016) and before (2011-2013). These ques-tions (variables) were measured by a 7-point scale, where 1 means strongly limited, and up to 7 reflecting a strongly aggressive manner (the full question descriptions are listed in Appendix 2). Nevertheless, two question items, including project management and risk management, were dropped from the investigation because in the item analysis of R&D leverage, these two items presented a significantly low lev-el of commonality tests (project management=0.189; risk management = 0.287). After dropping these two items, the Cronbach’s alpha statistics was tested at about 0.744, an acceptable level of reliability (see Table 1).
To investigate the moderating role of R&D leverage in this study, following [96], we built a moderating variable for this investigation. A moderating variable is characterized statistically as an interaction form of variable that affects the direction and strength of the relation between the de-pendent and independent variables [7,32,96]. Ping [96] suggests
that the product of the sums of the relevant indicators (as the observed variables associated resource investments and R&D leverage in this study) is used as the sole indica-tor of the latent product in SEM test (see Equation 1).
Note: MF=Moderating Factor; RI=Resource Investments; RDL=R&D Leverage; i=sample index; j=moderating variable index; k=resource in-vestment variable index; l=R&D resource leverage variable index; M=5, number of RDL variables.
Ping [96] recommended that the loading and error of such indicator of the latent product would be assigned for the estimation of the moderating variable in such multi-plicative model in SEM analysis. The factor loading and error of the indicator of the latent product were set in the analysis by the following equations [96]:
Note: MV=moderating variable; RI=Resource Investments; RDL=R&D Leverage; λ=factor loading; θε=error; i=variable index; M=6, number of RI variables; N=5, number of RDL variables.
3.3 Control Variables
In this study, the control variables were organized and investigated as part of the basic information and industrial background of the sample companies. The setting of the control variables was designed in three parts. First, firm control variables included in order to justify the causal influence from the independent and moderating variables were ‘firm size’ measured by capital size and ‘firm age’. These two variables are considered to be related to a firm’s intentions and operations in marketplaces [94]. This study measured firm age and firm size based on ranges. For firm age, five ages were designed as follows: within 5 years; 6-10 years; 11-15 years; 16-20 years; and above 20 years. For capital size, we designed a set of linear scale ranges by an around average 1.1 (1.0-1.2) nature log scale difference between each designed capital size (in NTD). These designed capital ranges were: under 1M (million NTD), 1-3M, 3-10M, 10-30M, and 30-80M (80M NTD as the maximum value of an SME’s capital size defined in Taiwan, also mentioned above).
Second, to control the contextual settings of this study, we used industry dummy variables for each industry. In our analysis, each industry dummy variable contributes variance to the performance latent factor that essentially
DOI: https://doi.org/10.30564/jbar.v2i2.755

26
Journal of Business Administration Research | Volume 02 | Issue 02 | April 2019
Distributed under creative commons license 4.0
represents those unobserved confounding effects owing to the exogenous environmental settings [93]. These variables were developed by following the “Standard Industrial Classification” of Taiwan [37]. There were 8 types of in-dustries engaged, which were reported by the participant SMEs in our survey. These industries included: food, electrical and mechanical engineering, electrical cable, biology and chemistry, iron and steel, electronics, culture and creativity, and miscellaneous.
Finally, to control for isomorphism, this study devel-oped a dummy variable as the determinant of the isomor-phic condition. This variable was obtained by transform-ing the six isomorphism-related questions (asking in the dummy variable form) rated by using the Guttman scale. The executives of the participant SMEs were asked to evaluate, the resource ‘similarities’ or market ‘commonal-ities’ (in the part of industrial background of the question-naire design) including: products and services [107], organi-zational capital scale [45], market engagement [56], technical and technological level [61], human capital scale [22], and political-legal settings (Beckert, 2010, 39,106]). The isomor-phic condition was set to 1 (concerning an isomorphic situation), if a participant SME’s average score of isomor-phism-related variables is above the average score of the total samples; otherwise it is set to ‘0’ (not concerning an isomorphic situation). In our pre-analysis for the sample, 67 SMEs were considered to face an isomorphic condition (the full question descriptions are listed in Appendix 2).
3.4 Analyses
The primary analytical technique used in this study is structural equation modeling (SEM), undertaken with AMOS 20 with the maximum likelihood (ML) method. In addition to the path analysis on the proposed model, this study also used this approach (by the ULMC test) to assess the CMV in our dataset. Other analyses relating to Harman single-factor analysis for CMV, ANOVA analysis for NRB, and the reliability analysis (the item analysis) for the factors of firm performance growth, resource in-vestments and R&D resource leverage were conducted by using SPSS 22.
In addition to the CMV test, NRB test and item analysis (as the pre-analysis for survey questions), our analysis for the proposed hypotheses essentially comprised the follow-ing steps, including: confirmatory factor analysis (CFA) for each of the proposed latent factors; the SEM that ex-amines the causal link between resource investments and performance (including control variables and the factor of Hypothesis 1); the SEM that examines the moderat-ing effects of R&D leverage (for Hypothesis 2); and the multiple-group analysis for SEMs for the examination of
whether any differences existed between non-isomorphic SMEs and isomorphic SMEs under the rules of the hy-pothesized model (Hypotheses 3a and 3b).
4. Results
4.1 Factor Validations
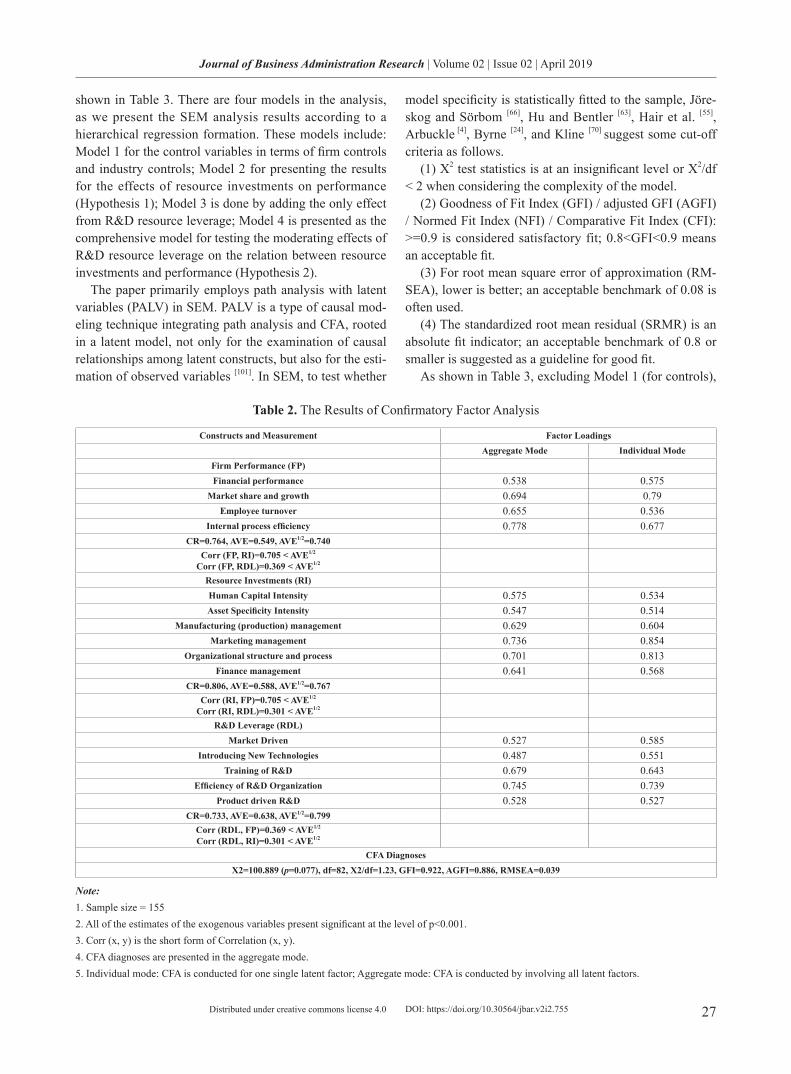
CFA was conducted to ensure that the hypothesized fac-tors, such as firm performance, resource investments and R&D leverage, were statistically adequate for the fur-ther SEM analysis in this study. This part of the analysis included internal consistency, convergent validity and discriminant validity of the hypothesized factors [27]. The referred tests and benchmarks suggested are as follows:
(1) Internal consistency: Composite reliability (CR) > 0.6 [9]
(2) Convergent validity: The value of average variance extracted AVE > 0.5 [47]; all of the exogenous variables’ item factor loadings of a factor > 0.5 [3,43]
(3) Discriminant validity: the square root of AVE of a latent factor being greater than the correlation between it and others (in the aggregate mode of tests) [27]
Table 2 summarizes the CFA results of the measure-ment model. We present the results by using the stan-dardized regression weight for each exogenous variable in both the individual construct mode (individual mode) and the aggregate construct mode (aggregate mode). The individual mode is the means of CFA performing a single factor analysis for each latent factor, respectively. The ag-gregate mode that includes all of the design latent factors examines the covariance among these design factors.
The results of CFA show that all of the theoretical fac-tors defined by this study are considered as empirically specified to fit the sample. First, the CR tests indicate that all the factors have qualified internal consistence as all of the CR values (FP=0.764, RI=0.806, RDL=0.733) are greater than 0.6. Second, convergent validity for each con-struct is also adequate because almost all of the item fac-tor loadings of each construct are over the benchmark of 0.5 and strongly significant (p < 0.001), and the AVE test for each factor is greater than 0.5 (FP=0.549, RI=0.588, RDL=0.638). These are only ‘introducing new technolo-gies’ in the RDL factor at the aggregate mode, of which the item factor loading is lower than 0.5, at 0.487. Finally, for discriminant validity, since the correlations between any two factors are less than the corresponding square root of AVE shown in the specific construct, the qualified discriminant validity for each design factor is indicated.
4.2 Model Validations
The results, analyzed by using the SEM technique, are
DOI: https://doi.org/10.30564/jbar.v2i2.755
27
Journal of Business Administration Research | Volume 02 | Issue 02 | April 2019
Distributed under creative commons license 4.0
shown in Table 3. There are four models in the analysis, as we present the SEM analysis results according to a hierarchical regression formation. These models include: Model 1 for the control variables in terms of firm controls and industry controls; Model 2 for presenting the results for the effects of resource investments on performance (Hypothesis 1); Model 3 is done by adding the only effect from R&D resource leverage; Model 4 is presented as the comprehensive model for testing the moderating effects of R&D resource leverage on the relation between resource investments and performance (Hypothesis 2).
The paper primarily employs path analysis with latent variables (PALV) in SEM. PALV is a type of causal mod-eling technique integrating path analysis and CFA, rooted in a latent model, not only for the examination of causal relationships among latent constructs, but also for the esti-mation of observed variables [101]. In SEM, to test whether
model specificity is statistically fitted to the sample, Jöre-skog and Sörbom [66], Hu and Bentler [63], Hair et al. [55], Arbuckle [4], Byrne [24], and Kline [70] suggest some cut-off criteria as follows.
(1) X2 test statistics is at an insignificant level or X2/df < 2 when considering the complexity of the model.
(2) Goodness of Fit Index (GFI) / adjusted GFI (AGFI) / Normed Fit Index (NFI) / Comparative Fit Index (CFI): >=0.9 is considered satisfactory fit; 0.8<GFI<0.9 means an acceptable fit.
(3) For root mean square error of approximation (RM-SEA), lower is better; an acceptable benchmark of 0.08 is often used.
(4) The standardized root mean residual (SRMR) is an absolute fit indicator; an acceptable benchmark of 0.8 or smaller is suggested as a guideline for good fit.
As shown in Table 3, excluding Model 1 (for controls),
Table 2. The Results of Confirmatory Factor Analysis
Constructs and Measurement Factor LoadingsAggregate Mode Individual Mode
Firm Performance (FP)Financial performance 0.538 0.575
Market share and growth 0.694 0.79Employee turnover 0.655 0.536
Internal process efficiency 0.778 0.677CR=0.764, AVE=0.549, AVE1/2=0.740
Corr (FP, RI)=0.705 < AVE1/2
Corr (FP, RDL)=0.369 < AVE1/2
Resource Investments (RI)Human Capital Intensity 0.575 0.534Asset Specificity Intensity 0.547 0.514
Manufacturing (production) management 0.629 0.604Marketing management 0.736 0.854
Organizational structure and process 0.701 0.813Finance management 0.641 0.568
CR=0.806, AVE=0.588, AVE1/2=0.767Corr (RI, FP)=0.705 < AVE1/2
Corr (RI, RDL)=0.301 < AVE1/2
R&D Leverage (RDL)Market Driven 0.527 0.585
Introducing New Technologies 0.487 0.551Training of R&D 0.679 0.643
Efficiency of R&D Organization 0.745 0.739Product driven R&D 0.528 0.527
CR=0.733, AVE=0.638, AVE1/2=0.799Corr (RDL, FP)=0.369 < AVE1/2
Corr (RDL, RI)=0.301 < AVE1/2
CFA DiagnosesX2=100.889 (p=0.077), df=82, X2/df=1.23, GFI=0.922, AGFI=0.886, RMSEA=0.039
Note:1. Sample size = 1552. All of the estimates of the exogenous variables present significant at the level of p<0.001.3. Corr (x, y) is the short form of Correlation (x, y).4. CFA diagnoses are presented in the aggregate mode.5. Individual mode: CFA is conducted for one single latent factor; Aggregate mode: CFA is conducted by involving all latent factors.
DOI: https://doi.org/10.30564/jbar.v2i2.755

28
Journal of Business Administration Research | Volume 02 | Issue 02 | April 2019
Distributed under creative commons license 4.0
the model fit diagnoses of Models 2-4 overall show that almost all of the hypothetical models’ statistical specifi-cations are satisfied and fit the sample well. The statistics of X2/df of Models 2-4 are lower than 2. Other indices, including GFI, AGFI, and CFI all meet at least the ac-ceptable fit requirement; as well, all of the RMSEA and SRMR diagnoses are considered to be acceptable (below 0.08).
4.3 Hypothesis Tests
Hypothesis 1 posited the causal relation between resource investments and firm performance. From the results
(shown in Table 3), Hypothesis 1 is tested, whether tak-ing action (i.e. Models 3-4) or not (Model 2) in regard to the moderating effects of R&D leverage, that SMEs’ performance is immediately and positively influenced by the variance of resource investment intensity (Model 2: estimate = 0.706 (p<0.001); Model 3: 0.644 (p<0.001); Model 4: 0.487 (p<0.05)). Therefore, we conclude that Hypothesis 1 gains support from the sample.
Hypothesis 2 suggests a moderating effect of R&D re-source leverage on the causal relation between investment intensity and performance. Hypothesis 2 was examined by adding the moderating factor to the analysis, and then
Table 3. The Results of Path Analysis with Latent Variables (PALV)
Model 1(Controls)
Model 2(Resource Investments Intensity)
Model 3(R&D leverage)
Model 4(Moderating)
Firm Age .144 .049 -.011 .006
Capital .005 .026 .005 .019
Isomorphism .033 -.007 -.008 .000
Industry D1 -.081 -.143 -.147 -.142
Industry D2 -.042 -.028 -.031 -.052
Industry D3 .011 -.074 -.072 -.077
Industry D4 -.165 -.141 -.175 -.169
Industry D5 .162 .181 .175* .176*
Industry D6 -.186 -.198 -.221 -.224
Industry D7 -.059 -.101 -.143 -.148
Resource Investment Intensity (RI) .706*** .644*** .487**
R&DLeverage (RDL) .232* .002
ModeratingFactor
(RI x RDL).291**
Model Fit Diagnoses
X2 test (p) 308.808 (0) 227.475 (0) 344.287 (0) 397.587(0)
X2 /df 4.01 1.422 1.334 1.42
GFI .836 .884 .858 .844
AGFI .777 .848 .821 .805
NFI .339 .761 .731 .809
CFI .384 .911 .912 .933
SRMR .151 .058 .050 .059
RMSEA .140 .052 .047 .052
R-Squared .106 .583 .650 .681
Note:1. ***p<.001; **p<0.01; *p<0.05; 2. Sample size = 155.3. Industry dummy variables D1-D7 present the industries, listed as follows: food, electrical and mechanical engineering, electrical cable, biology and chemistry, iron and steel, electronics, culture and creativity.4. R-Squired is reported by presenting the estimate of ‘Squired Multiple Correlation’ of the performance (PF) factor.
DOI: https://doi.org/10.30564/jbar.v2i2.755

29
Journal of Business Administration Research | Volume 02 | Issue 02 | April 2019
Distributed under creative commons license 4.0
evaluating whether the path from the moderating factor to performance presents a positive and statistically sig-nificant effect, and whether there is any declining change from investment intensity on performance. In comparing the results among Models 2, 3 and 4, a positive and sig-nificant moderating effect as this study hypothesized is identified, from (a) the estimate of Resource Investment Intensity dropped from Model 2’s 0.706 to Model 4’s 0.487, (b) the estimate of Resource Investment Intensity dropped from Model 3’s 0.644 to Model 4’s 0.487 and (c) the moderating factor showed a significant result in Model 4 (RI x RDL = .291, p<0.01). These results show that Hy-pothesis 2 is supported by the sample.
In addition, similar results for Hypothesis 2 from the simple linear contract analysis (based on the moderating effects of R&D leverage (RDL) across the high-to-low re-source investment intensity (RI) levels). It can be seen that the sample group of higher level R&D leverage has a big-ger slot than that of lower level R&D leverage concerning the effect of their resource investments on performance. This result also demonstrates that R&D leverage has a positive and significant relation in the proposed model.
Figure 1. The Moderating Effect of R&D LeverageNote: RDL: R&D Leverage; RI: Resource Investment Intensity
Hypothesis 3 (including 3a and 3b) suggests that there may be some theoretical behavior differences between non-isomorphic SMEs and isomorphic SMEs based on the hypothesized model. This study estimated a multi-ple-group analysis for these two designed groups. The assessment results are listed in Table 4. The indices of difference (by Z score) between the non-isomorphic and isomorphic groups (RI = 0.088 – for Hypothesis 3a; RDL = 1.013; RIxRDL = -0.096 – for Hypothesis 3b) are less than the benchmark 1.96 (p = 0.05) in the absolute val-ue comparison, which shows that there is no significant difference in the theoretical behavior to achieve rents ruled by the hypothesized model between isomorphic and non-isomorphic SMEs. Thus, Hypotheses 3a and 3b could not be seen to gain support from the sample.
Table 4: Multiple-Group Analysis between the Isomor-phic and Non-isomorphic SMEs
Non-isomorphic SMEs Isomorphic SMEs Difference
Estimate p Estimate p Z Score
Con
trol
Var
iabl
e
Age 0.037 0.781 -0.000 0.996 -0.651
Capital 0.010 0.910 0.127 0.262 0.867
Industry D1 -0.138 0.300 -0.178 0.215 -0.273
Industry D2 0.009 0.981 -0.053 0.886 -0.381
Industry D3 -0.031 0.886 -0.127 0.257 -0.753
Industry D4 -0.14 0.320 -0.179 0.144 -0.417
Industry D5 0.228 0.295 0.291 0.042 0.534
Industry D6 -0.288 0.394 -0.161 0.41 0.228
Industry D7 0.008 0.931 -0.307 0.030 -1.712
Lat
ent F
ac-
tor
RI 0.489 0.018 0.617 0.009 0.088
RDRL 0.001 0.984 0.018 0.217 1.013
RIxRDL 0.298 0.041 0.253 0.013 -0.096
Note:1. Dependent Factor = Firm Performance.2. Sample size: Total = 155; Non-isomorphic Group = 88; Isomorphic Group = 67;3. Estimates are reported in standardized value.4. RI = Resource Investment Intensity; RDL: R&D resource Leverage; RIxRDL = Moderating (interaction) effect.5. Industry dummy D1-D7 present the industries, listed as follows: food, electrical and mechanical engineering, electrical cable, biology and chemistry, iron and steel, electronics, culture and creativity.6. For this multiple-group analysis, the controlling for isomorphism was dropped from the original controlling settings in the hypothesized model.
5. Discussion
This paper addressed the role of R&D leverage (RDL) in SMEs’ performance divergence by considering SMEs’ high resource dependence due to isomorphism; and by per-ceiving R&D leverage as possessing dynamic management capability, we investigated whether and how R&D manage-ment plays a role in advancing the effect of resource invest-ments (RI) on firm performance.
The strong and positive results in relation to Hypothe-sis 1 support the view that resource investments improve resource advantages of SMEs, which is generally consis-tent with the DCV, which is considered central as asset orchestration and strategic renewal of firm resources for rebuilding a firm’s resource position, hence performance growth [59,60,113,121,122,124,125]). For Hypothesis 2, we tested the moderating role of RDL in the relation between resource investments and performance. Hypothesis 2 gains strong support in the present analysis. Furthermore, our investiga-tion, by using linear contrast analysis (shown in Figure 1), also reveals that just as certain SMEs exhibit high level of RDL, they perform better than others with low level RDL
DOI: https://doi.org/10.30564/jbar.v2i2.755

30
Journal of Business Administration Research | Volume 02 | Issue 02 | April 2019
Distributed under creative commons license 4.0
in the high RI group; while they have poorer performance in the low RI group. These findings suggest that SMEs’ RDL activities can advance the efficiency and effectiveness of resource deployment and development, but only in so far as they have proper resource investments. Otherwise, high RDL may lead to performance erosion.
Our investigation can also be further inferred for SMEs’ performance divergence that four general situations of SMEs would be categorized through the level of their RDL activities on the resource investment behavior. These in-clude: ‘high RDL-high RI’, ‘high RDL-low RI’, ‘low RDL-high RI’, and ‘low RDL-low RI’. On the ‘high-RI’ part, ‘high RDL-high RI’ suggests that proper manipulation of RDL is necessary for those SMEs, which are able to con-duct a relatively high level of resource investments. This finding provides strong empirical evidence to link resource possession, exploration and exploitation. The instrumental RBV literature has always argued that competitive advan-tages to a firm requires exploring valuable and rare resourc-es (i.e. resource investments in this study) and exploiting its distinctive competencies to make its resources well man-aged and leveraged (i.e. RDL activities in this study) [80,95,132]. ‘Low RDL-high RI’ presents the sample companies’ be-havior that follows the conventional resource-dependent model, reflecting a relatively less-aggressive approach with R&D leverage to achieving rents.
On the ‘low-RI’ part, ‘High RDL-low RI’ represents that if there are not proper resource investments, too much RDL manipulation is usually unnecessary and greatly in-creases the possibilities of meaningless resource consump-tion, hence performance erosion. In addition, our findings provide insights for the ‘low RDL-low RI’ SMEs which have a relatively high growth in firm performance. These SMEs may be generally considered as lacking resources and enough competence to access to venture capital, since they are those participants relatively small-sized and new-ly established in our sample. This observation implicates that this kind of SMEs’ operational success lies in the all-round development of firm resources for the specifically predefined niche opportunity.
The evidence provided by the research regarding Hy-potheses 3a and 3b is not significant as it was expected that SMEs’ operations and performance are likely to be forced by the environmental forces in light of isomorphism. The results of the multiple-group analysis (Table 4) indicate that the participant SMEs, whether isomorphic or not, have similar behavior to achieve rents under the hypothesized model. This result may reflect a reality in the Taiwanese SME context: the environmental settings has been largely promoted by the R&D and technology upgrading policies of the Taiwanese government (Mar, 2015); when the oper-
ational environment is considered as technology-intensity, SMEs’ growth and development is largely dependent on a technological resource dependent pattern.
The empirical findings of this study provide significant contributions to support, expand and connect the literature on R&D management, isomorphism, SMEs, and the DCV. First, this study provides a potential approach for industrial firms to measure dynamic capabilities. This study suggests that R&D leverage that showcases a set of aggregative processes and innovation behavior in R&D management would be referred to as a set of microfoundations of dy-namic capabilities [15]. Our approach to measure the level of R&D leverage can be extended to the manner in which dynamic capabilities are investigated by measuring their re-source leverage in various micro aspects of the managerial activities of organizations.
Second, by proposing the hypothesized model in con-junction with empirical evidence, this study provides clarity regarding the ambiguous relationship between the DCV and RBV [5,6,14,81]. We have identified the moderating role of R&D leverage, as a dynamic capability, in the relation between resource investments and firm performance. There is an important implication in contrasting the theoretical positions of, and explaining the relationship between, the DCV and RBV, strongly suggesting that the DCV is theo-retically complementary to the RBV [2,44,108]; [121]; Zollo and Winter, 2002[133]; [131]). Herein, while resources establish the performance baseline, dynamic capabilities amplify the effect of resources on performance. As a consequence, this study extends the DCV by proposing an empirical approach for integrating the RBV, which is far beyond the tradition-al investigation on the DCV to highlight the differences between the DCV and RBV in respect of their theoretical logic.
Finally, this study offers practical implications for SME management. While organizations’ operations are bound to be affected by environmental changes [60,121], SMEs, subject to resource availability, are typically considered as having less flexibility to fit in the environmental changes. Thus, their operations and strategic behavior are forced to be normative and dependent on the environmental institutions, forces and trends. The present investigation reveals that SMEs in approaching rent creation need to focus on the development of resources, but necessarily balanced devel-opment in each functional area of the organization. Simul-taneously, we observe that the role of R&D management in SMEs has evolved from its leading function of product and service innovation to a coordinative and supportive role in business innovation. We suggest that the use of R&D leverage should be considered as a key to improve SMEs’ specific skills and know-how for resource deployment and
DOI: https://doi.org/10.30564/jbar.v2i2.755
31
Journal of Business Administration Research | Volume 02 | Issue 02 | April 2019
Distributed under creative commons license 4.0
management across the various units of the firm, hence driving resource advantages and organizational innovation as a whole.
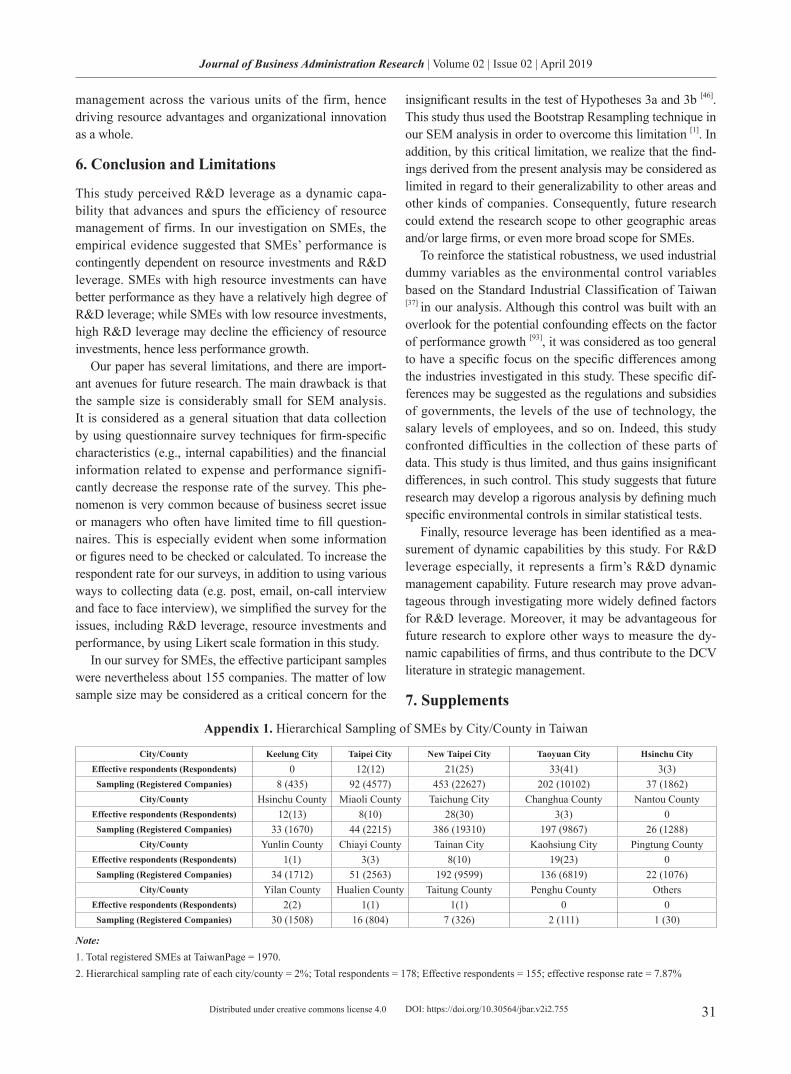
6. Conclusion and Limitations
This study perceived R&D leverage as a dynamic capa-bility that advances and spurs the efficiency of resource management of firms. In our investigation on SMEs, the empirical evidence suggested that SMEs’ performance is contingently dependent on resource investments and R&D leverage. SMEs with high resource investments can have better performance as they have a relatively high degree of R&D leverage; while SMEs with low resource investments, high R&D leverage may decline the efficiency of resource investments, hence less performance growth.
Our paper has several limitations, and there are import-ant avenues for future research. The main drawback is that the sample size is considerably small for SEM analysis. It is considered as a general situation that data collection by using questionnaire survey techniques for firm-specific characteristics (e.g., internal capabilities) and the financial information related to expense and performance signifi-cantly decrease the response rate of the survey. This phe-nomenon is very common because of business secret issue or managers who often have limited time to fill question-naires. This is especially evident when some information or figures need to be checked or calculated. To increase the respondent rate for our surveys, in addition to using various ways to collecting data (e.g. post, email, on-call interview and face to face interview), we simplified the survey for the issues, including R&D leverage, resource investments and performance, by using Likert scale formation in this study.
In our survey for SMEs, the effective participant samples were nevertheless about 155 companies. The matter of low sample size may be considered as a critical concern for the
insignificant results in the test of Hypotheses 3a and 3b [46]. This study thus used the Bootstrap Resampling technique in our SEM analysis in order to overcome this limitation [1]. In addition, by this critical limitation, we realize that the find-ings derived from the present analysis may be considered as limited in regard to their generalizability to other areas and other kinds of companies. Consequently, future research could extend the research scope to other geographic areas and/or large firms, or even more broad scope for SMEs.
To reinforce the statistical robustness, we used industrial dummy variables as the environmental control variables based on the Standard Industrial Classification of Taiwan [37] in our analysis. Although this control was built with an overlook for the potential confounding effects on the factor of performance growth [93], it was considered as too general to have a specific focus on the specific differences among the industries investigated in this study. These specific dif-ferences may be suggested as the regulations and subsidies of governments, the levels of the use of technology, the salary levels of employees, and so on. Indeed, this study confronted difficulties in the collection of these parts of data. This study is thus limited, and thus gains insignificant differences, in such control. This study suggests that future research may develop a rigorous analysis by defining much specific environmental controls in similar statistical tests.
Finally, resource leverage has been identified as a mea-surement of dynamic capabilities by this study. For R&D leverage especially, it represents a firm’s R&D dynamic management capability. Future research may prove advan-tageous through investigating more widely defined factors for R&D leverage. Moreover, it may be advantageous for future research to explore other ways to measure the dy-namic capabilities of firms, and thus contribute to the DCV literature in strategic management.
7. Supplements
Appendix 1. Hierarchical Sampling of SMEs by City/County in Taiwan
City/County Keelung City Taipei City New Taipei City Taoyuan City Hsinchu CityEffective respondents (Respondents) 0 12(12) 21(25) 33(41) 3(3)Sampling (Registered Companies) 8 (435) 92 (4577) 453 (22627) 202 (10102) 37 (1862)
City/County Hsinchu County Miaoli County Taichung City Changhua County Nantou CountyEffective respondents (Respondents) 12(13) 8(10) 28(30) 3(3) 0Sampling (Registered Companies) 33 (1670) 44 (2215) 386 (19310) 197 (9867) 26 (1288)
City/County Yunlin County Chiayi County Tainan City Kaohsiung City Pingtung CountyEffective respondents (Respondents) 1(1) 3(3) 8(10) 19(23) 0Sampling (Registered Companies) 34 (1712) 51 (2563) 192 (9599) 136 (6819) 22 (1076)
City/County Yilan County Hualien County Taitung County Penghu County OthersEffective respondents (Respondents) 2(2) 1(1) 1(1) 0 0Sampling (Registered Companies) 30 (1508) 16 (804) 7 (326) 2 (111) 1 (30)
Note:1. Total registered SMEs at TaiwanPage = 1970.2. Hierarchical sampling rate of each city/county = 2%; Total respondents = 178; Effective respondents = 155; effective response rate = 7.87%
DOI: https://doi.org/10.30564/jbar.v2i2.755

32
Journal of Business Administration Research | Volume 02 | Issue 02 | April 2019
Distributed under creative commons license 4.0
Appendix 2. Question Descriptions
Questions of Performance Growth (evaluate the performance growth within 2014-2016, if possible, comparing with it within 2011-2013)
1. Financial performance: Our Company’s overall financial performance, such as ROA, ROE, EPS, etc., is better than before.
2. Satisfaction of shareholders: Our shareholders are generally satisfied with the way we manage, and the outcomes of, the Company, as well as their returns.
3. Market share and growth: Our Company’s market has been growing and market share increases are better than before.
4. Market control and power: Our Company has stronger power to control, or better capabilities to manage, the market channel and distribution sys-tem.5. Industrial relationship: Our Company maintains a better relationship than before with our customers, suppliers, cooperative companies and com-plementors.
6. Employee turnover: Our Company maintains a lower employee turnover than before.
7. Internal process efficiency: Our Company shows better managerial efficiency in business routines and process flows.
Questions of Resource Investments (evaluate the extent of capital investments; if possible, refer to the expenditure (or capital) intensity within 2014-2016).
1. Human capital: Our Company shows stronger aggressiveness in human capital investment than before.
2. Asset specificity: Our Company makes more investments to advance operational efficiency by investing in specialized machines or equipment, computers or IT systems, and other dedicated assets.3. Manufacturing (or production) management: Our Company makes a higher level of expenditure for the better management in manufacturing sites or production lines.
4. Marketing management: Our Company makes stronger efforts and investments to advance the capacity to engage in the market.
5. Organizational structure and process: Our Company makes a higher level of expenditure to refine organizational structure and business flows.
6. Finance management: Our Company makes stronger efforts and investments for the management of funds and monetary-related resources and to advance the capacity of capital budgeting, current liabilities, and other relevant applications.7. Management of external cooperative relations: Our Company makes more investments to better engage in strategic alliances, suppliers, and the like organizations.Questions of R&D Leverage (evaluate R&D leverage by measuring the extent of the change of expenditures and efforts invested in the R&D management activi-
ties within 2014-2016 on the basis of the previous R&D leverage in 2011-2013).
1. Market driven R&D: In our Company, R&D efforts and investments are increased to secure appropriate alignment between new products and mar-ket or customer demands.2. Project management: Our Company’s increased R&D efforts and investments are set to the project management for new product/service develop-ment and other R&D projects (with a deliberate discipline of initiating, planning, executing, controlling, and closing procedures.).3. Introducing new technologies: Our Company makes efforts and investments to introduce new technologies, knowledge, and techniques for R&D capacity advancement.
4. Training of R&D: Our Company makes efforts and investments to train and educate the R&D people.
5. Efficiency of R&D organization: In our Company, R&D efforts and investments are increased to improve the efficiency of communications and operations within the R&D department, and that between the R&D department and other departments.6. Product driven R&D: Our Company’s R&D efforts and investments are increased to reinforce our strengths of product/service innovation based on technology orientation (rather than market orientation).7. Risk management: Our Company pays efforts and investments for risk management that is to set to build good control of R&D projects in re-sponse to the uncertainties within or outside the Company.Questions of Isomorphism (evaluate the commonalities of resource base and market forces by identifying the existence and tendency for your firm to acquire or
confront the attributes upon which your rival competitors depend within 2014-2016).
1. Products and services: The differences of the product (or service) offerings between our company and the rival competitors have been getting smaller.
2. Organizational capital scale: The size of capital scale between our company and the rival competitors have been getting similar.
3. Market engagement: There is a big, and getting bigger, overlap in the target markets, channels and customer segments between our company and the rival competitors.4. Technical and technological level: Because of the technological trend, the technical and technological difference between our company and the rival competitor are getting smaller.5. Human capital scale: The human resource base has similar composition with size (number of employees), wage level, educated level, professional experience, working seniority, and other relevant features.6. Political-legal settings: The operations of our company and the rival competitors have been influenced by the political-legal settings of the environ-ment set by the governments and other relevant institution organizers at the similar level.
Note:1. Questions of firm performance, resource investments and R&D leverage are formatted in the 7-point Likert scale2. Questions of isomorphism are rated by using Guttman scale and the relevant questions are asked by the dummy variable form.
DOI: https://doi.org/10.30564/jbar.v2i2.755

33
Journal of Business Administration Research | Volume 02 | Issue 02 | April 2019
Distributed under creative commons license 4.0
Appendix 3. The Results of Common Method Variance Test
Factor / Variable Proposed Factor Loadings R2 Common Latent Factor Load-ings R2
Performance
Financial performance 0.524* 0.275 0.180 0.032Market share and growth 0.816*** 0.666 0.109 0.012
Employee turnover 0.506* 0.256 0.429* 0.184Internal process efficiency 0.701** 0.491 0.374 0.140
Resource Investments 0.000Human Capital Intensity 0.550* 0.303 0.207 0.043
Asset Specificity Intensity 0.623* 0.388 0.093 0.009Manufacturing (production) management 0.529** 0.280 0.321 0.103
Marketing management 0.658* 0.433 0.381 0.145Organizational structure and process 0.585* 0.342 0.356 0.127
Finance management 0.529* 0.280 0.396 0.157R&D Leverage 0.000Market Driven 0.530*** 0.281 -0.076 0.006
Introducing New Technologies 0.493*** 0.243 -0.136 0.018Training of R&D 0.674*** 0.454 0.045 0.002
Efficiency of R&D Organization 0.733*** 0.537 -0.144 0.021Product driven R&D 0.525*** 0.276 -0.124 0.015
Average 0.598 0.324 0.161 0.060
Note:***: p<0.001; **: p<0.01; *: p<0.05;The common method variance test only included the variables acceptable by the item analysis.
Appendix 4. The Results of Non-Response Bias Test
Factor/Variable Mean G1 G2 G3 G4 F-test pFirm Performance
Financial performance 5.045 5.071 5.121 4.814 5.304 1.161 .327Satisfaction of stakeholders 4.728 4.528 4.963 4.762 4.816 1.728 .164
Market share and growth 5.335 5.143 5.515 5.372 5.478 1.081 .359Market control and power 4.920 4.859 5.025 4.822 5.100 .837 .476
Industrial relationship 4.815 4.799 4.824 4.669 5.112 1.947 .124Employee turnover 4.865 4.679 5.182 4.837 4.913 1.207 .309
Internal process efficiency 5.129 4.911 5.273 5.163 5.391 1.421 .239Resource Investments
Human capital intensity 5.090 4.964 5.152 5.093 5.304 .923 .431Asset specificity intensity 5.477 5.375 5.485 5.442 5.783 .923 .431
Manufacturing (production) management 5.116 5.000 5.333 5.163 5.000 1.042 .376Marketing management 5.419 5.339 5.545 5.419 5.435 .250 .861
Organizational structure and process 5.297 5.214 5.455 5.256 5.348 .359 .783Finance management 4.961 4.786 5.212 4.837 5.261 2.510 .057
Management of external cooperative rela-tions 4.821 4.730 5.024 4.779 4.830 .707 .549
R&D Leverage
Market Driven R&D 5.394 5.214 5.576 5.349 5.652 1.619 .187Project management 4.530 4.479 4.599 4.384 4.827 1.942 .125
Introducing new technologies 5.032 4.911 5.091 4.930 5.435 1.517 .212Training of R&D 5.503 5.375 5.545 5.465 5.826 1.676 .175
Efficiency of R&D organization 5.594 5.589 5.606 5.419 5.913 1.543 .206Product driven R&D 5.323 5.286 5.606 5.093 5.435 2.281 .082
Risk management 4.557 4.423 4.674 4.536 4.758 1.820 .146
Note:Group of survey type: G1=post; G2=email; G3=on-call interview; G4=face to face interviewSample size: Total=155; G1=56; G2=33; G3=43; G4=23.
DOI: https://doi.org/10.30564/jbar.v2i2.755

34
Journal of Business Administration Research | Volume 02 | Issue 02 | April 2019
Distributed under creative commons license 4.0
References
[1] Adèr, H. J., Mellenbergh, G. J. and Hand, D. J.. Advising on research methods: A consultant’s com-panion, Johannes van Kessel, Huizen, Netherlands, 2008.
[2] Agarwal, R., and Selen, W.. ‘The incremental and cumulative effects of dynamic capability building on service innovation in collaborative service organiza-tions,’ Journal of Management & Organization, 2013, 19 (5): 521-543.
https://doi.org/10.1017/jmo.2014.5 [3] Anderson, J. C., and Gerbing, D. W.. ‘Structural
equation modeling in practice: A review and recom-mended two-step approach,’ Psychological bulle-tin, 1988, 103(3): 411-423.
https://psycnet.apa.org/buy/1989-14190-001 [4] Arbuckle, J.. Amos 5.0 update to the Amos user’s
guide. SPSS Incorporated, 2003.[5] Arend, R. J., & Bromiley, P.. Assessing the dynamic
capabilities view: spare change, everyone?. Strategic Organization, 2009, 7(1): 75–90.
https://doi.org/10.1177/1476127008100132 [6] Arend, R. J. and Lévesque, M.. “Is the resource-based
view a practical organizational theory?” Organization Science, 2010, 21(4): 913-930.
https://doi.org/10.1287/orsc.1090.0484 [7] Arnold, H. J.. ‘Moderator variables: A clarification of
conceptual, analytic, and psychometric issues,’ Orga-nizational behavior and human performance, 1982, 29(2): 143-174.
https://doi.org/10.1016/0030-5073(82)90254-9 [8] Audretsch, D. B.. ‘Sustaining innovation and growth:
Public policy support for entrepreneurship,’ Industry and innovation, 2004, 11(3): 167-191.
https://doi.org/10.1080/1366271042000265366 [9] Bagozzi, R. P., and Yi, Y.. ‘On the evaluation of
structural equation models,’ Journal of the academy of marketing science, 1988, 16(1): 74-94.
https://doi.org/10.1007/BF02723327 [10] Barney, J.. ‘Firm resources and sustained competitive
advantage,’ Journal of management, 1991, 17(1): 99-120.
https://doi.org/10.1177/014920639101700108 [11] Barney, J. B.. ‘The resource-based theory of the
firm,’ Organization science, 1996, 7(5): 469-469. https://doi.org/10.1287/orsc.7.5.469 [12] Barney, J. B.. ‘Should strategic management research
engage public policy debates?’ Academy of Manage-ment Journal, 2005, 48(6): 945-948.
https://doi.org/10.5465/amj.2005.19573092 [13] Barney, J. B., and Arikan, A. M.. ‘The resource-based
view: Origins and implications,’ Handbook of strate-gic management, 2001: 124-188.
[14] Barney, J. B. and Clark, D. N.. Resource-based the-ory: Creating and sustaining competitive advantage, Oxford University Press, 2007.
[15] Barney, J., and Felin, T.. ‘What are microfounda-tions?’ The Academy of Management Perspec-tives, 2013, 27(2): 138-155.
https://doi.org/10.5465/amp.2012.0107 [16] Bhagwat, Y., DeBruine, M., and V. Gondhalekar.,.
‘R&D Leverage – A Measure to Evaluate the Impact of R&D on Earnings of Pharmaceutical Companies,’ Journal of Research in Pharmaceutical Economics, 2001, 11(3-4): 55-68.
[17] Bierman, L. and Gely, R.. ‘The need for real striker replacement reform,’ NCL Rev., 1995, 74(3): 813-831.
[18] Blomquist, T., Hällgren, M., Nilsson, A. and Söder-holm, A.. ‘Project-as-practice: In search of project management research that matters,’ Project Manage-ment Journal, 2010, 41(1): 5-16.
https://doi.org/10.1002/pmj.20141 [19] Boeker, W. and Goodstein, J.. ‘Organizational per-
formance and adaptation: Effects of environment and performance on changes in board composi-tion,’ Academy of Management Journal, 1991, 34(4): 805-826.
https://doi.org/10.5465/256390 [20] Boles, J., & Link, A. N.. On the R&D/marketing in-
terface in knowledge intensive entrepreneurial firms. International Entrepreneurship and Management Journal, 2017, 13(3): 943-952.
https://link.springer.com/article/10.1007/s11365-016-0429-0
[21] Bretherton, P. and Chaston, I.. ‘Resource dependency and SME strategy: an empirical study,’ Journal of Small Business and Enterprise Development, 2005, 12(2): 274-289.
https://doi.org/10.1108/14626000510594656 [22] Brewster, C., Wood, G., & Brookes, M.. Similarity,
isomorphism or duality? Recent survey evidence on the human resource management policies of multina-tional corporations. British Journal of Management, 2008, 19(4): 320-342.
https://doi.org/10.1111/j.1467-8551.2007.00546.x [23] Busarovs, A.. ‘Open innovation: current trends and
future perspectives,’ Humanities and Social Scienc-es, 2013, 21(2): 103-119.
[24] Byrne, B. M.. ‘Structural equation modeling: Per-spectives on the present and the future,’ International Journal of Testing, 2001, 1(3-4): 327-334.
https://doi.org/10.1080/15305058.2001.9669479
DOI: https://doi.org/10.30564/jbar.v2i2.755

35
Journal of Business Administration Research | Volume 02 | Issue 02 | April 2019
Distributed under creative commons license 4.0
[25] Cardinal, L. B. and Hatfield, D. E.. ‘Internal knowledge generation: the research laboratory and innovative productivity in the pharmaceutical in-dustry,’ Journal of Engineering and Technology Man-agement, 2000, 17(3): 247-271
https://doi.org/10.1016/S0923-4748(00)00025-4 [26] Calantone, R. J., Di Benedetto, C. A., & Divine, R..
Organisational, technical and marketing antecedents for successful new product development. R&D Man-agement, 1993, 23(4): 337-351.
https://doi.org/10.1111/j.1467-9310.1993.tb00839.x [27] Chin, W. W.. ‘The partial least squares approach to
structural equation modeling,’ Modern methods for business research, 1998, 295(2): 295-336.
[28] Chung, K. H. and Charoenwong, C.. ‘Investment op-tions, assets in place, and the risk of stocks,’ Finan-cial Management, 1991, 20(3): 21-33.
DOI: 10.2307/3665748[29] Cooper, R. G.. New product strategies: what distin-
guishes the top performers?. Journal of Product Inno-vation Management, 1984, 1(3): 151-164.
https://doi.org/10.1016/S0737-6782(84)80012-0 [30] Cooper, R. G., & Kleinschmidt, E. J.. Benchmark-
ing the firm’s critical success factors in new product development. Journal of product innovation manage-ment, 1995a, 12(5): 374-391.
https://doi.org/10.1111/1540-5885.1250374 [31] Cooper, R. G. & Kleinschmidt, E. J.. ‘Performance
typologies of new product projects,’ Industrial Mar-keting Management, 1995b , 24(5): 439-456.
https://doi.org/10.1016/0019-8501(95)00034-8 [32] Cortina, J. M., Chen, G., & Dunlap, W. P.. Testing
interaction effects in LISREL: Examination and illustration of available procedures. Organizational research methods, 2001, 4(4): 324-360.
https://doi.org/10.1177/109442810144002 [33] Cragg, P., King, M. and Hussin, H.. ‘IT alignment
and firm performance in small manufacturing firms,’ The Journal of Strategic Information Sys-tems, 2002, 11(2): 109-132.
https://doi.org/10.1016/S0963-8687(02)00007-0 [34] Crépon, B., Duguet, E. and Mairessec, J.. ‘Research,
innovation and productivity: an econometric analysis at the firm level,’ Economics of Innovation and new Technology, 1998, 7(2): 115-158.
https://doi.org/10.1080/10438599800000031 [35] Deephouse, D. L.. ‘Does isomorphism legiti-
mate?’ Academy of management journal, 1996, 39(4): 1024-1039.
https://doi.org/10.5465/256722 [36] Deephouse, D. L.. ‘To be different, or to be the
same? It’s a question (and theory) of strategic bal-
ance,’ Strategic management journal, 1999, 20(2): 147-166.
https://doi.org/10.1002/(SICI)1097-0266(199902) 20:2<147::AID-SMJ11>3.0.CO;2-Q
[37] DGBAS. ‘Standard industrial classification of ROC,’ Directorate General of Budget, Accounting & Statis-tics, 2006.
https://eng.stat.gov.tw/ct.asp?xItem=5008&ct-Node=1528
[38] Díaz-Díaz, N. L., Aguiar-Díaz, I. and De Saá-Pérez, P.. ‘The effect of technological knowledge assets on performance: The innovative choice in Spanish firms,’ Research Policy, 2008, 37(9): 1515-1529.
https://doi.org/10.1016/j.respol.2008.06.002 [39] DiMaggio, P. and Powell, W. W.. ‘The iron cage
revisited: Collective rationality and institutional iso-morphism in organizational fields,’ American Socio-logical Review, 1983, 48(2): 147-160.
[40] Dobni, C. B. and Luffman, G.. ‘Determining the scope and impact of market orientation profiles on strategy implementation and performance,’ Strategic management journal, 2003, 24(6): 577-585.
https://doi.org/10.1002/smj.322 [41] Doctor, R. N., Newton, D. P. and Pearson, A..
‘Managing uncertainty in research and develop-ment,’ Technovation, 2001, 21(2): 79-90.
https://doi.org/10.1016/S0166-4972(00)00026-2 [42] Dolsen, D. E., & Machlis, G. E.. Response rates and
mail recreation survey results: how much is enough?. Journal of Leisure Research, 1991, 23(3): 272-277.
https://doi.org/10.1080/00222216.1991.11969858 [43] Dunn, S. C., Seaker, R. F. and Waller, M. A.. ‘Latent
variables in business logistics research: scale devel-opment and validation,’ Journal of Business Logis-tics, 1994, 15(2): 145-172.
[44] Eisenhardt, K. M. and Martin, J. A.. ‘Dynamic capa-bilities: what are they?’ Strategic management jour-nal, 2000, 21: 1105-1121.
[45] Etemad, H., & Wright, R. W. (Eds.).. Globalization and entrepreneurship: policy and strategy perspec-tives. Edward Elgar Publishing, 2003.
[46] Faber, J., & Fonseca, L. M.. How sample size in-fluences research outcomes. Dental press journal of orthodontics, 2014, 19(4): 27-29.
http://dx.doi.org/10.1590/2176-9451.19.4.027-029.ebo
[47] Fornell, C. and Larcker, D. F.. ‘Structural equation models with unobservable variables and measure-ment error: Algebra and statistics,’ Journal of market-ing research, 1981, 18(3): 382-388.
https://doi.org/10.1177/002224378101800313 [48] Fuller, C. M., Simmering, M. J., Atinc, G., Atinc, Y.,
DOI: https://doi.org/10.30564/jbar.v2i2.755

36
Journal of Business Administration Research | Volume 02 | Issue 02 | April 2019
Distributed under creative commons license 4.0
& Babin, B. J.. Common methods variance detection in business research. Journal of Business Research, 2016, 69(8): 3192-3198.
https://doi.org/10.1016/j.jbusres.2015.12.008 [49] Ganotakis, P. and Love, J. H.. ‘R&D, product inno-
vation, and exporting: evidence from UK new tech-nology based firms,’ Oxford Economic Papers, 2010, 63(2): 279-306.
https://doi.org/10.1093/oep/gpq027 [50] Granovetter, M.. ‘Economic action and social struc-
ture: The problem of embeddedness,’ American jour-nal of sociology, 1985, 91(3): 481-510.
h t t p s : / / w w w. j o u r n a l s . u c h i c a g o . e d u / d o i /abs/10.1086/228311
[51] Griffin, A., & Hauser, J. R.. Integrating R&D and marketing: a review and analysis of the literature. Journal of product innovation management, 1996, 13(3): 191-215.
https://doi.org/10.1111/1540-5885.1330191 [52] Griliches, Z..“Productivity, R&D, and the data con-
straint” in R&D and Productivity: The Econometric Evidence, Ed, Z. Griliches, University of Chicago Press, 1998: 347-374.
[53] Goudy, W. J.. Interim response to a mail question-naire: impacts on variable relationships. The Socio-logical Quarterly, 1978, 19(2): 253-265.
https://doi.org/10.1111/j.1533-8525.1978.tb01168.x [54] Gupta, A. K., Raj, S. P., & Wilemon, D.. A model for
studying R&D. Marketing interface in the product innovation process. The Journal of Marketing, 1986: 7-17.
https://doi.org/10.1177/002224298605000201 [55] Hair, J. F., William, C. B., Babin, B. J., Anderson,
R. E. and Tatham, R. L.. Multivariate Data Analysis, New Jersey: Pearson University Press, 2006.
[56] Hall, P. and Soskice, D.. An Introduction to the Vari-eties of Capitalism, in Hall, P. and Soskice, D. (Eds.), Varieties of Capitalism: The Institutional Basis of Competitive Advantage. Oxford: Oxford University Press, 2001.
[57] Hamel, G., & Prahalad, C. K.. Competing for the Fu-ture. Harvard business review, 1994, 72(4): 122-128.
[58] Hashemifar, E.. ‘Human resource development: An attitude towards the importance and necessity of paying attention to education and improvement of human resources,’ Journal of Educational Sciences of Training and Correction, 1999, 45: 7-9.
https://doi.org/10.5465/256712 [59] Helfat, C. E., Finkelstein, S., Mitchell, W., Peteraf,
M., Singh, H., Teece, D. and Winter, S. G.. Dynamic capabilities: Understanding strategic change in orga-nizations. John Wiley & Sons, 2009.
[60] Helfat, C. E. and Peteraf, M. A.. ‘The dynamic re-source-based view: Capability lifecycles. Strategic management journal, 2003, 24(10): 997-1010.
https://doi.org/10.1002/smj.332 [61] Herrigel, G.. American Occupation, Market Order,
and Democracy: Reconfiguring the Steel Industry in Japan and Germany after the Second World War. In Zeitlin J. & Herrigel, G. (Eds), Americanization and Its Limits: Reworking US Technology and Manage-ment in Post-War Europe and Japan, New York: Ox-ford University Press, 2000: 340-400,
[62] Hempelmann, F., & Engelen, A.. Integration of fi-nance with marketing and R&D in new product de-velopment: the role of project stage. Journal of Prod-uct Innovation Management, 2015, 32(4): 636-654.
https://doi.org/10.1111/jpim.12237 [63] Hu, L. T. and Bentler, P. M.. ‘Cutoff criteria for fit in-
dexes in covariance structure analysis: Conventional criteria versus new alternatives,’ Structural equation modeling: a multidisciplinary journal, 1999, 6(1): 1-55.
https://doi.org/10.1080/10705519909540118 [64] Hult, G. T. M. and Ketchen, D. J.. ‘Does market ori-
entation matter? A test of the relationship between positional advantage and performance,’ Strategic management journal, 2001, 22(9): 899-906.
https://doi.org/10.1002/smj.197 [65] Jaworski, B. J. and Kohli, A. K.. ‘Market orientation:
antecedents and consequences,’ The Journal of mar-keting, 1993, 57(3): 53-70.
https://doi.org/10.1177/002224299305700304 [66] Jöreskog, K. G. and Sörbom, D.. LISREL VI: Anal-
ysis of linear structural relationships by maximum likelihood, instrumental variables, and least squares methods. Scientific Software, 1986.
[67] Katila, R. and Shane, S.. ‘When does lack of resourc-es make new firms innovative?’ Academy of Man-agement Journal, 2005, 48(5): 814-829.
https://doi.org/10.5465/amj.2005.18803924 [68] Kavousi, E. and Ahmadi, F.. ‘Globalization and hu-
man resource development (comparative comparison of 62 countries),’ Journal of Strategic Studies of Glo-balization, 2011, 1, 79-108.
[69] King, A. W. and Zeithaml, C. P.. ‘Competencies and firm performance: Examining the causal ambiguity paradox,’ Strategic management journal, 2001, 22(1): 75-99.
https://doi.org/10.1002/1097-0266(200101)22:1 <75::AID-SMJ145>3.0.CO;2-I
[70] Kline, R. B.. Principles and practice of structural equation modeling. Guilford publications, 2015.
[71] Kondra, A. Z. and Hinings, C. R.. ‘Organizational
DOI: https://doi.org/10.30564/jbar.v2i2.755
37
Journal of Business Administration Research | Volume 02 | Issue 02 | April 2019
Distributed under creative commons license 4.0
diversity and change in institutional theory,’ Organi-zation studies, 1998, 19(5): 743-767.
https://doi.org/10.1177/017084069801900502 [72] Lankford, S. V., Buxton, B. P., Hetzler, R., & Little, J.
R.. Response bias and wave analysis of mailed ques-tionnaires in tourism impact assessments. Journal of Travel Research, 1995, 33(4): 8-13.
https://doi.org/10.1177/004728759503300402 [73] Leenders, M. A., & Wierenga, B.. The effectiveness
of different mechanisms for integrating marketing and R&D. Journal of product innovation manage-ment, 2002, 19(4): 305-317.
https://doi.org/10.1111/1540-5885.1940305 [74] Levy, M. and Powell, P.. ‘Information systems
strategy for small and medium sized enterprises: an organisational perspective,’ The Journal of Strategic Information Systems, 2000, 9(1): 63-84.
https://doi.org/10.1016/S0963-8687(00)00028-7 [75] Liang, H., Saraf, N., Hu, Q., and Xue, Y.. Assimila-
tion of Enterprise Systems: The Effect of Institutional Pressures and the Mediating Role of Top Manage-ment, MIS Quarterly, 2007, 31(1): 59-87.
DOI: 10.2307/25148781[76] Liao, T. S. and Rice, J.. ‘Innovation investments,
market engagement and financial performance: A study among Australian manufacturing SMEs,’ Re-search Policy, 2010, 39(1): 117-125.
https://doi.org/10.1016/j.respol.2009.11.002 [77] Liao, T. S., Rice, J. and Lu, J. C.. ‘The vicissitudes
of competitive advantage: Empirical evidence from Australian manufacturing SMEs,’ Journal of Small Business Management, 2015, 53(2): 469-481.
https://doi.org/10.1111/jsbm.12078 [78] Liao, T. S., Rice, J. and Martin, N.. ‘The role of the
market in transforming training and knowledge to superior performance: evidence from the Australian manufacturing sector,’ The International Journal of Human Resource Management, 2011, 22(02): 376-394.
https://doi.org/10.1080/09585192.2011.540161 [79]Love, J. H. and Roper, S.. ‘SME innovation, exporting
and growth: A review of existing evidence,’ Interna-tional Small Business Journal, 2015, 33(1): 28-48.
https://doi.org/10.1177/0266242614550190 [80] Mahoney, J. T. and Pandian, J. R.. ‘The re-
source-based view within the conversation of strategic management,’ Strategic management jour-nal, 1992, 13(5): 363-380.
https://doi.org/10.1002/smj.4250130505 [81] Makadok, R.. ‘Toward a synthesis of the re-
source-based and dynamic-capability views of rent creation,’ Strategic management journal, 2001, 22(5):
387-401. https://doi.org/10.1002/smj.158 [82] Mikulskienė, B.. Research and development project
management, Study Book, 2014.[83] Montoya-Weiss, M. M. and Calantone, R.. ‘Deter-
minants of new product performance: A review and meta-analysis,’ Journal of product innovation man-agement, 1994, 11(5): 397-417.
https://doi.org/10.1016/0737-6782(94)90029-9 [84] Morgan, N. A., Vorhies, D. W. and Mason, C. H..
‘Market orientation, marketing capabilities, and firm performance.’ Strategic Management Journal, 2009, 30(8): 909-920.
https://doi.org/10.1002/smj.764 [85] Moullin, M.. ‘Measuring Performance,’ in Delivering
excellence in health and social care: quality, excel-lence and performance measurement, Ed. M. Moul-lin, McGraw-Hill Education, 2002: 185-216;
[86] Moullin, M.. ‘Performance measurement definitions: Linking performance measurement and organisation-al excellence,’ International journal of health care quality assurance, 2007, 20(3): 181-183.
https://doi.org/10.1108/09526860710743327 [87] Neely, A. D., Adams, C. and Kennerley, M.. ‘The
performance prism: The scorecard for measuring and managing business success,’ London: Financial Times, 2002.
[88] Nelson, R. R.. Why do firms differ, and how does it matter?. Strategic management journal, 1991, 12(S2): 61-74.
https://doi.org/10.1002/smj.4250121006 [89] Newbert, S. L.. ‘Empirical research on the re-
source-based view of the firm: an assessment and suggestions for future research,’ Strategic manage-ment journal, 2007, 28(2): 121-146.
https://doi.org/10.1002/smj.573 [90] Nobelius, D.. ‘Towards the sixth generation of R&D
management,’ International Journal of Project Man-agement, 2004, 22(5): 369-375.
https://doi.org/10.1016/j.ijproman.2003.10.002 [91] Oliver, C.. ‘The antecedents of deinstitutionaliza-
tion.’ Organization studies, 1992, 13(4): 563-588. https://doi.org/10.1177/017084069201300403 [92] Pakes, A. and Griliches, Z.. ‘Patents and R&D at the
firm level: a first look,’ in R&D, patents, and produc-tivity, Ed. Z. Griliches. University of Chicago Press, 1984: 55-72.
https://doi.org/10.1016/0165-1765(80)90136-6 [93] Pennings, E. and Sleuwaegen, L.. ‘International relo-
cation: firm and industry determinants,’ Economics Letters, 2000, 67(2): 179-186.
https://doi.org/10.1016/S0165-1765(99)00269-4
DOI: https://doi.org/10.30564/jbar.v2i2.755

38
Journal of Business Administration Research | Volume 02 | Issue 02 | April 2019
Distributed under creative commons license 4.0
[94] Perry, M. K.. ‘Vertical integration: determinants and effects,’ International Journal of Accounting Informa-tion Systems, 1989, 2: 271-294.
https://doi.org/10.1016/S1573-448X(89)01007-1 [95] Peteraf, M. A.. ‘The cornerstones of competitive ad-
vantage: A resource-based view,’ Strategic manage-ment journal, 1993, 14(3): 179-191.
https://doi.org/10.1002/smj.4250140303 [96] Ping Jr, R. A.. A parsimonious estimating technique
for interaction and quadratic latent variables. Journal of Marketing Research, 1995, 336-347.
https://doi.org/10.1177/002224379503200308 [97] Podsakoff, P. M., & Organ, D. W.. Self-reports in or-
ganizational research: Problems and prospects. Jour-nal of management, 1986, 12(4): 531-544.
https://doi.org/10.1177/014920638601200408 [98] Podsakoff, P. M., MacKenzie, S. B., Lee, J. Y., &
Podsakoff, N. P.. Common method biases in behav-ioral research: A critical review of the literature and recommended remedies. Journal of applied psychol-ogy, 2003, 88(5): 879-903.
[99] Popadiuk, S., Rivera, E. R. and Bataglia, W.. ‘Het-erogeneity of isomorphic pressures: Intertwining the Resource-Based view and the neo institutional approach,’ BAR-Brazilian Administration Re-view, 2014, 11(4): 455-475.
http://dx.doi.org/10.1590/1807-7692bar2014130003 [100]Raju, P. S., Lonial, S. C., Gupta, Y. P. and Ziegler,
C.. ‘The relationship between market orientation and performance in the hospital industry: A structural equations modeling approach,’ Health Care Manage-ment Science, 2000, 3(3): 237-247.
[101]Raykov, T. and Marcoulides, G. A.. ‘Can there be infinitely many models equivalent to a given cova-riance structure model?’ Structural Equation Model-ing, 2001, 8(1): 142-149.
https://doi.org/10.1207/S15328007SEM0801_8 [102]Raymond, L. and St-Pierre, J.. ‘R&D as a determi-
nant of innovation in manufacturing SMEs: An at-tempt at empirical clarification.’ Technovation, 2010, 30(1): 48-56.
https://doi.org/10.1016/j.technovation.2009.05.005 [103]Richardson, H. A., Simmering, M. J., and Sturman,
M. C.. A Tale of Three Perspectives: Examining Post Hoc Statisical Techniques for Detection and Correc-tion of Common Method Variance, Organizational Research Methods, 2009, 12(4): 762-800.
https://doi.org/10.1177/1094428109332834 [104]Salmeron, J. L. and Bueno, S.. ‘An information
technologies and information systems industry-based classification in small and medium-sized enterprises: An institutional view,’ European Journal of Opera-
tional Research, 2006, 173(3): 1012-1025. https://doi.org/10.1016/j.ejor.2005.07.002 [105]Samee, K. and Pongpeng, J.. ‘Structural equation
model for construction equipment selection and con-tractor competitive advantages,’ KSCE Journal of Civil Engineering, 2016, 20(1): 77-89.
[106]Sawyerr, O. O.. Environmental uncertainty and en-vironmental scanning activities of Nigerian manufac-turing executives: a comparative analysis. Strategic Management Journal, 1993, 14(4): 287-299.
https://doi.org/10.1002/smj.4250140405 [107]Scherer, F. M., & Ross, D.. Industrial market struc-
ture and market performance. Houghton Mifflin Company, Boston, USA, 1990.
[108]Schreyögg, G. and Kliesch-Eberl, M.. ‘How dynam-ic can organizational capabilities be? Towards a du-al-process model of capability dynamization,’ Strate-gic management journal, 2007, 28(9): 913-933.
https://doi.org/10.1002/smj.613 [109]Scott, L. L.. Recent progress on the isomorphism
problem. Proc. Symposia in Pure Math, 1987, 47: 259-274.
[110]Sher, P. J. and Yang, P. Y.. ‘The effects of innovative capabilities and R&D clustering on firm perfor-mance: the evidence of Taiwan’s semiconductor in-dustry,’ Technovation, 2005, 25(1): 33-43.
https://doi.org/10.1016/S0166-4972(03)00068-3 [111]Shortridge, R. T.. ‘Market Valuation of Successful
versus Non-successful R&D Efforts in the Pharma-ceutical Industry,’ Journal of Business Finance & Accounting, 2004, 31(9-10): 1301-1325.
https://doi.org/10.1111/j.0306-686X.2004.00575.x [112]Sirmon, D. G., Hitt, M. A., & Ireland, R. D.. Manag-
ing firm resources in dynamic environments to create value: Looking inside the black box. Academy of management review, 2007, 32(1): 273-292.
https://doi.org/10.5465/amr.2007.23466005 [113]Sirmon, D. G. and Hitt, M. A.. ‘Contingencies within
dynamic managerial capabilities: Interdependent ef-fects of resource investment and deployment on firm performance,’ Strategic Management Journal, 2009, 30(13): 1375-1394.
https://doi.org/10.1002/smj.791 [114]Souder, W. E., & Chakrabarti, A. K.. The R&D/mar-
keting interface: results from an empirical study of innovation projects. IEEE Transactions on Engineer-ing Management, EM, 1978, 25(4): 88-93.
DOI: 10.1109/TEM.1978.6447302[115]Sougiannis, T.. ‘The accounting based valuation of
corporate R&D,’ Accounting review, 1994, 69(1): 44-68.
[116]St-Pierre, J. and Audet, J.. ‘Intangible assets and per-
DOI: https://doi.org/10.30564/jbar.v2i2.755
39
Journal of Business Administration Research | Volume 02 | Issue 02 | April 2019
Distributed under creative commons license 4.0
formance: Analysis on manufacturing SMEs,’ Journal of Intellectual Capital, 2011, 12(2): 202-223.
https://www.emeraldinsight.com/doi/abs/10.1108/ 14691931111123395
[117]Stewart, J. F., Harris, R. S. and Carleton, W. T.. ‘The role of market structure in merger behavior,’ The Journal of Industrial Economics, 1984, 32(3): 293-312.
DOI: 10.2307/2098019[118]Stull, W., Sanders, N. and Stull, J.. ‘The effects of
school size and leadership on participation in the School-to-Work movement,’ Journal of Vocational Education Research, 2000, 25(4): 472-502.
https://doi.org/10.5328/JVER25.4.472 [119]Swamidass, P. M. and Newell, W. T.. ‘Manufacturing
strategy, environmental uncertainty and performance: a path analytic model,’ Management science, 1987, 33(4): 509-524.
https://doi.org/10.1287/mnsc.33.4.509 [120]Tabrizi, B. and Walleigh, R.. ‘Defining next-gen-
eration products: An inside look,’ Harvard business review, 1997, 75(6): 116-124.
[121]Teece, D. J., Pisano, G. and Shuen, A.. ‘Dynamic capabilities and strategic management,’ Strategic management journal, 1997, 18(7): 509-533.
https://doi.org/10.1002/(SICI)1097-0266(199708) 18:7<509::AID-SMJ882>3.0.CO;2-Z
[122]Teece, D. J.. ‘Explicating dynamic capabilities: the nature and microfoundations of (sustainable) enter-prise performance.’ Strategic management journal, 2007, 28(13): 1319-1350.
https://doi.org/10.1002/smj.640 [123]Teece, D. J.. ‘Business models, business strategy
and innovation.’ Long range planning, 2010, 43(2-3): 172-194.
https://doi.org/10.1016/j.lrp.2009.07.003 [124]Teece, D. J.. Business models and dynamic capabili-
ties. Long Range Planning, 2018a, 51(1): 40-49. https://doi.org/10.1016/j.lrp.2017.06.007
[125]Teece, D. J.. Dynamic capabilities as (workable) management systems theory. Journal of Management & Organization, 2018b, 24(3): 359-368.
https://doi.org/10.1017/jmo.2017.75 [126] Wang, C. L. and Ahmed, P. K.. ‘Dynamic capa-
bilities: A review and research agenda,’ International journal of management reviews, 2007, 9(1): 31-51.
https://doi.org/10.1111/j.1468-2370.2007.00201.x [127]Wang, C.-H.. “Clarifying the Effects of R&D on
Performance: Evidence from the High Technology Industries”, Asia Pacific Management Review, 2011, 16(1): 51-64.
[128]Wang, C. W., Wu, J. J. and Horng, R. Y.. ‘Creative thinking ability, cognitive type and R&D perfor-mance,’ R&D Management, 1999, 29(3): 247-254.
https://doi.org/10.1111/1467-9310.00134 [129]Williams, L. J., Cote, J. A., & Buckley, M. R.. Lack
of method variance in self-reported affect and per-ceptions at work: reality or artifact?. Journal of ap-plied psychology, 1989, 74(3): 462-468.
[130]Williamson, O. E.. ‘Strategy research: governance and competence perspectives,’ Strategic management journal, 1999-20(12): 1087-1108.
https://doi.org/10.1002/(SICI)1097-0266(199912) 20:12<1087::AID-SMJ71>3.0.CO;2-Z
[131]Winter, S. G.. ‘Understanding dynamic capabili-ties,’ Strategic management journal, 2003, 24(10): 991-995.
https://doi.org/10.1002/smj.318 [132]Zahra, S. A., Sapienza, H. J. and Davidsson, P.. ‘En-
trepreneurship and dynamic capabilities: A review, model and research agenda,’ Journal of Management studies, 2006, 43(4): 917-955.
https://doi.org/10.1111/j.1467-6486.2006.00616.x [133]Zollo, M. and Winter, S.G.. ‘Deliberate Learning and
the Evolution of Dynamic Capabilities,’ Organization Science, 2002, 13(3): 339-351.
https://doi.org/10.1287/orsc.13.3.339.2780
DOI: https://doi.org/10.30564/jbar.v2i2.755