the role of fish as sources and vectors of bacteria and...
TRANSCRIPT

The Role of Fish as Sources and Vectors of Bacteria and Influence of Bat Colonies on
Indicator Bacteria Levels
George GuillenPresented at Texas Watershed
Coordinator Roundtable – Bacteria Dynamics , Assessment Methods,
and BMPsJuly 27, 2011
Funded by: Harris County Public Infrastructure Department (HCPID)

Acknowledgments
Dr. Robin Brinkmeyer – Bat colony studies Jenny Wrast – Fish and Bat study – field
coordinator

Sources of E. coli within urban streams & bayous
Contaminated runoff & stormwater Malfunctioning wastewater collection
systems Improperly functioning wastewater plants Livestock & domesticated animalsWildlife and Waterfowl Reservoirs of E. Coli include:
– Algae & periphyton mats– Soils & sediments
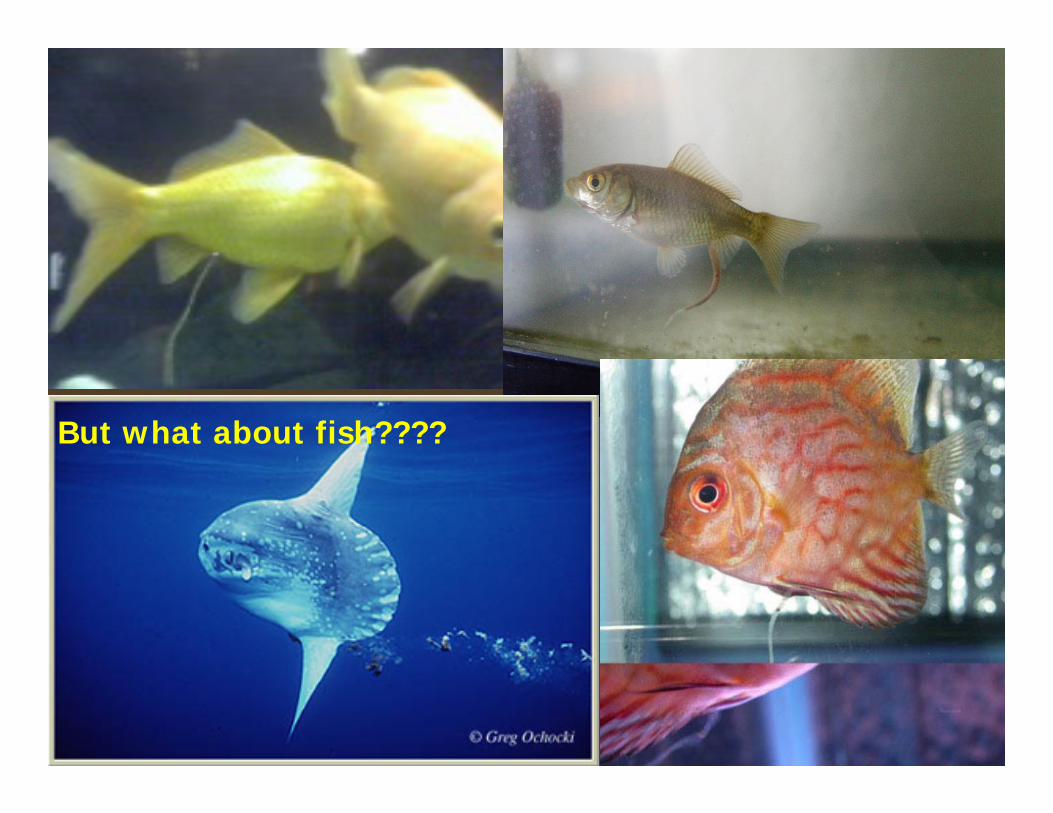
But what about fish????

But what about bats????

Outline
Fish Study Bat Study

Outline – Fish Study
Background Field Studies Fish Aquarium Studies Conclusions Future work


a. Rainbow trout (carnivore);b. Catfish (omnivore emphasizing animal sources food);c. Carp (omnivore, emphasizing plant sources of food);d. Milkfish (microphagous planktovore).
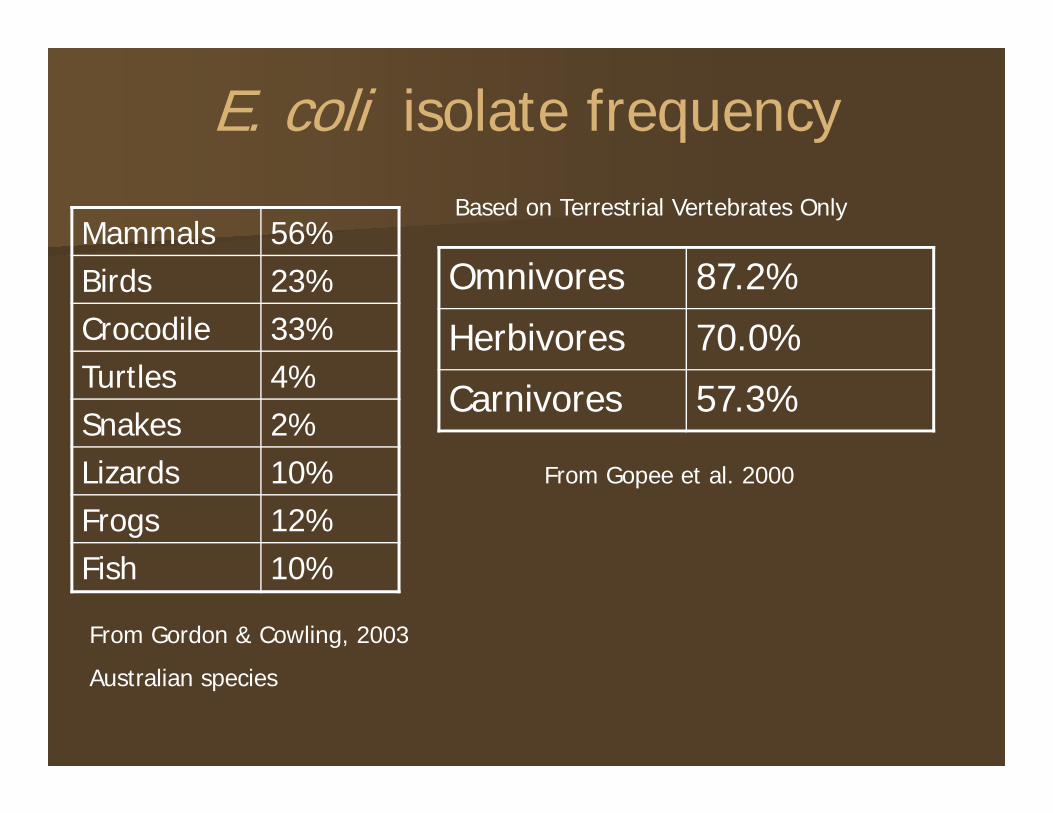
E. coli isolate frequency
Omnivores 87.2%
Herbivores 70.0%
Carnivores 57.3%
From Gopee et al. 2000
Mammals 56%Birds 23%Crocodile 33%Turtles 4%Snakes 2%Lizards 10%Frogs 12%Fish 10%
From Gordon & Cowling, 2003
Australian species
Based on Terrestrial Vertebrates Only
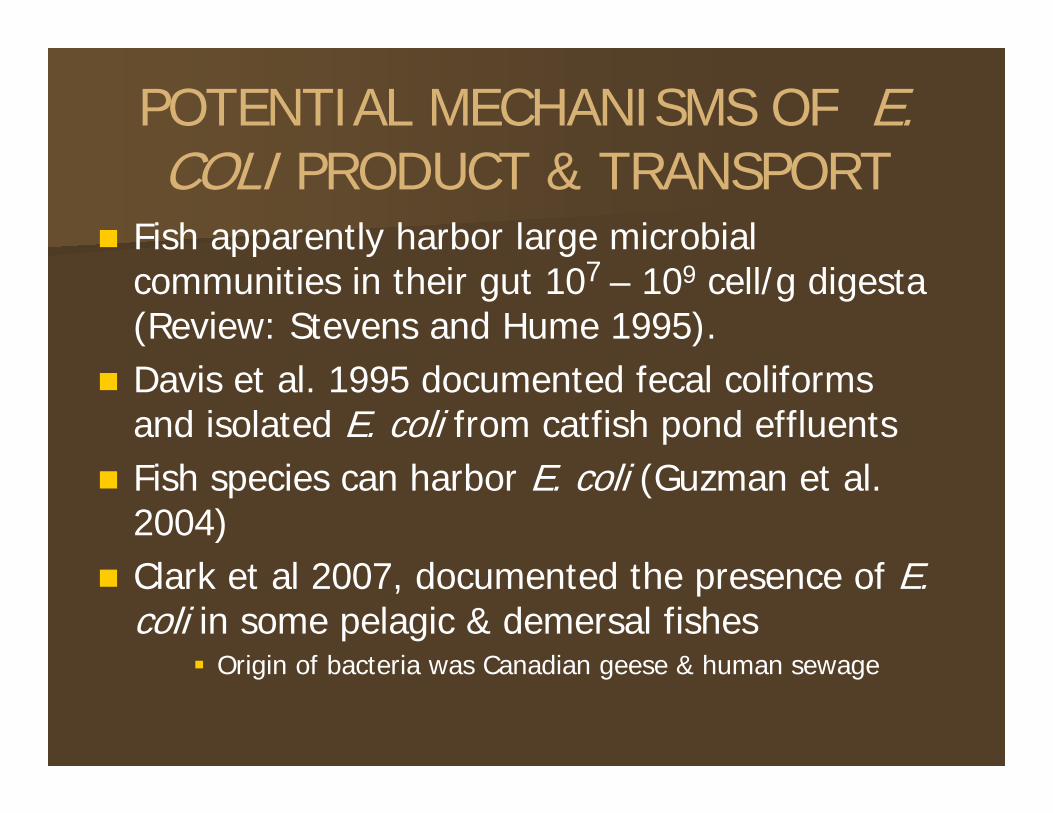
POTENTIAL MECHANISMS OF E. COLI PRODUCT & TRANSPORT
Fish apparently harbor large microbial communities in their gut 107 – 109 cell/g digesta (Review: Stevens and Hume 1995).
Davis et al. 1995 documented fecal coliforms and isolated E. coli from catfish pond effluents
Fish species can harbor E. coli (Guzman et al. 2004)
Clark et al 2007, documented the presence of E. coli in some pelagic & demersal fishes
Origin of bacteria was Canadian geese & human sewage

POTENTIAL MECHANISMS OF E. COLI PRODUCT & TRANSPORT
Hansen et al. (2008) Pelagic & Benthic Fish:– Percentage of benthic fish harboring fecal coliforms
(FC) not sig. diff. than Pelagic fish– Of those that did harbor FC they found E. coli in
benthic fish at a rate 10x that of pelagic fish (e.g. 42% vs. 4%)
– Sources were identified for 65% of E. coli isolated Fecal coliforms found in every species examined,
but not every fish Not dominated by a single strain
– Concluded fish may acquire microorganisms while feeding


Objectives 1) Determine whether wild caught fish from
Harris County waterways, representing various species and trophic groups produce feces with detectable levels of indicator bacteria, E. coli
2) Determining whether farmed raised fish retained in aquaria transmit E. coli bacteria to ambient water and/or contain feces with E. coli.
3) Using literature and field data estimate potential “loading” ranges of E. coli from fish

Horsepen Bayou
White Oak Bayou
GreensBayou

Sampling Sites

Target SpeciesTrophic Group Candidate SpeciesHerbivore Armored Catfish
Grass Carp
Striped mullet
Benthic omnivore Channel catfish
Carp
Smallmouth buffalo
Insectivore Bluegill
Rio Grande Cichlid
Redear Sunfish
Longear Sunfish
Omnivore Gizzard or Threadfin shad
Gulf Menhaden
Tilapia
Piscivore Largemouth Bass
Spotted Bass
Green SunfishSpotted Gar
Benthic predator Blue catfish


Field study
Fish Collection– Tote barge Electroshocker– Euthanized in MS-222

Field study
Fecal Material Extraction– Fish measured & weighed– Large intestine removed– Fecal material extracted into pre-weighed
Bacti-bottles with 100 ml of sterile water

Fecal Matter Extraction
Laboratory Processing:
IDEXX Method

Field Study Data Analysis
E. coli – water (#/100ml), sediment (#/g), fish feces (#/g feces)
Compare sites, trophic groups (species), seasons
95% CI graphical comparison Kruskal-Wallis Multiple Comparisons with a
MINITAB Macro -Dunn’s Test - test median levels
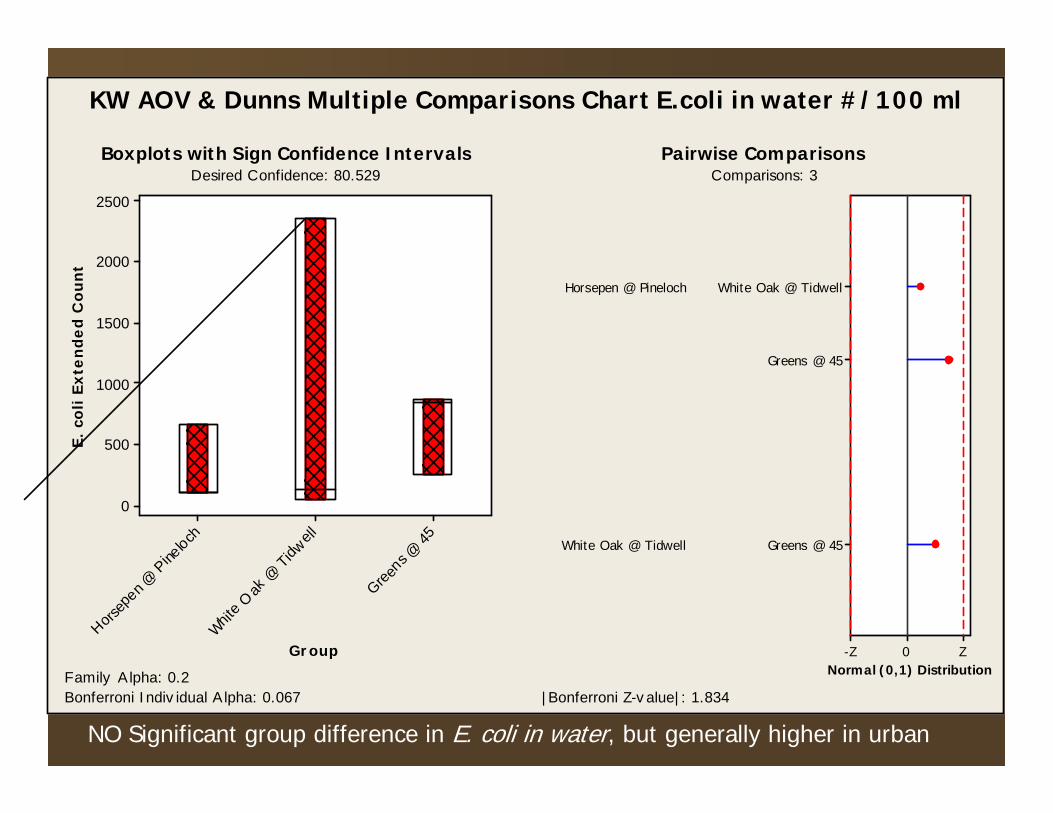
KW AOV & Dunns Multiple Comparisons Chart E.coli in water #/100 ml
Greens
@ 4
5
Whit
e Oak
@ T
idwell
Horsep
en @
Pine
loch
2500
2000
1500
1000
500
0
Group
E.
coli
Ex
ten
de
d C
ou
nt
White Oak @ Tidwell
Horsepen @ Pineloch
Greens @ 45
Greens @ 45
White Oak @ Tidwell
Z0-ZNormal (0,1) Distribution
Boxplots with Sign Confidence IntervalsDesired C onfidence: 80.529
Family A lpha: 0.2Bonferroni Indiv idual A lpha: 0.067
Pairwise ComparisonsC omparisons: 3
|Bonferroni Z-v alue|: 1.834
NO Significant group difference in E. coli in water, but generally higher in urban
Significant group differences
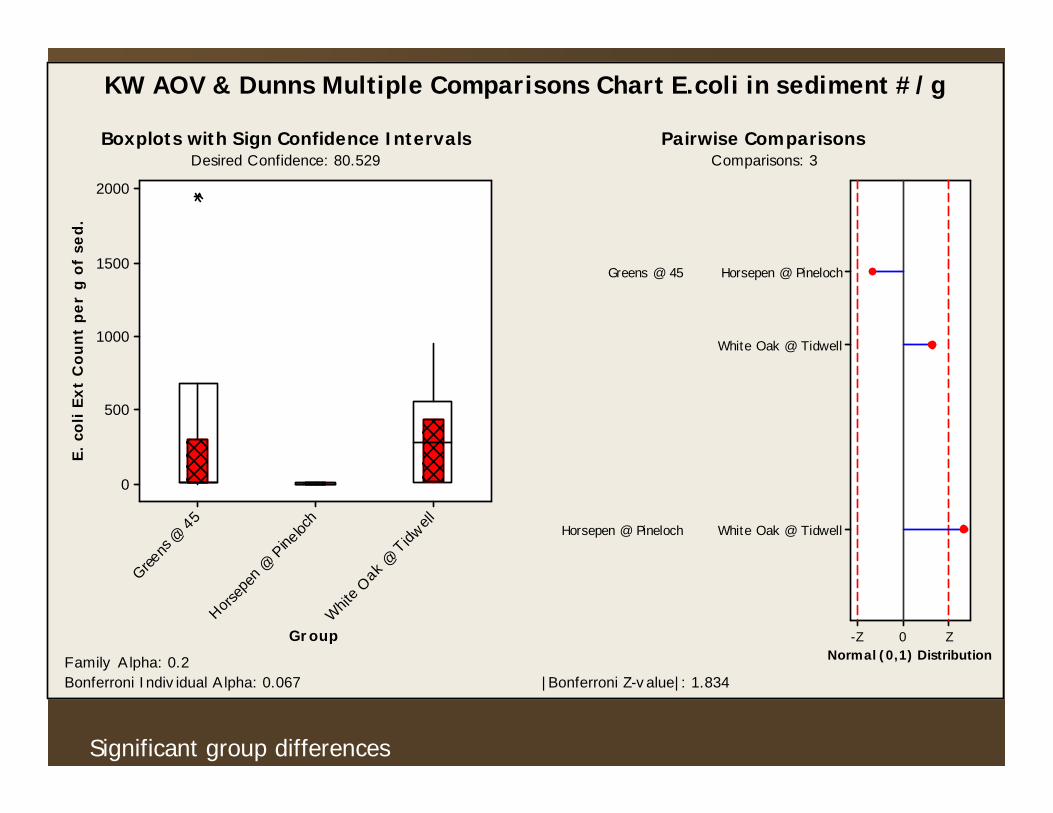
KW AOV & Dunns Multiple Comparisons Chart E.coli in sediment #/g
Whit
e Oak
@ T
idwell
Horsep
en @
Pine
loch
Greens
@ 4
5
2000
1500
1000
500
0
Group
E.
coli
Ex
t C
ou
nt
pe
r g
of
sed
.
Horsepen @ Pineloch
Greens @ 45
White Oak @ Tidwell
White Oak @ Tidwell
Horsepen @ Pineloch
Z0-ZNormal (0,1) Distribution
Boxplots with Sign Confidence IntervalsDesired C onfidence: 80.529
Family A lpha: 0.2Bonferroni Indiv idual A lpha: 0.067
Pairwise ComparisonsC omparisons: 3
|Bonferroni Z-v alue|: 1.834
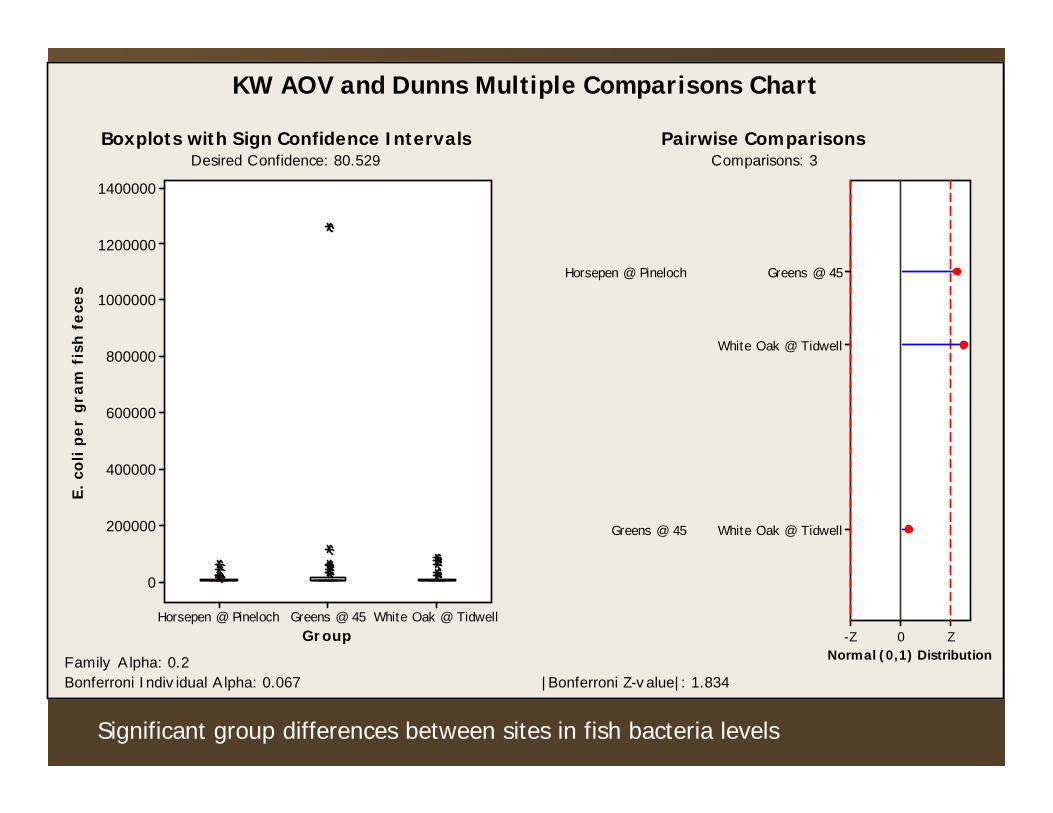
Significant group differences between sites in fish bacteria levels
KW AOV and Dunns Multiple Comparisons Chart
White Oak @ TidwellGreens @ 45Horsepen @ Pineloch
1400000
1200000
1000000
800000
600000
400000
200000
0
Group
E.
coli
pe
r g
ram
fis
h f
ece
s
Greens @ 45
Horsepen @ Pineloch
White Oak @ Tidwell
White Oak @ Tidwell
Greens @ 45
Z0-ZNormal (0,1) Distribution
Boxplots with Sign Confidence IntervalsDesired C onfidence: 80.529
Family A lpha: 0.2Bonferroni Indiv idual A lpha: 0.067
Pairwise ComparisonsC omparisons: 3
|Bonferroni Z-v alue|: 1.834
30.027.525.022.520.017.515.0
2500
2000
1500
1000
500
0
Water Temp (C)
E. c
oli (
#/1
00 m
l)
Greens @ 45Horsepen @ PinelochWhite Oak @ Tidwell
Sample Location
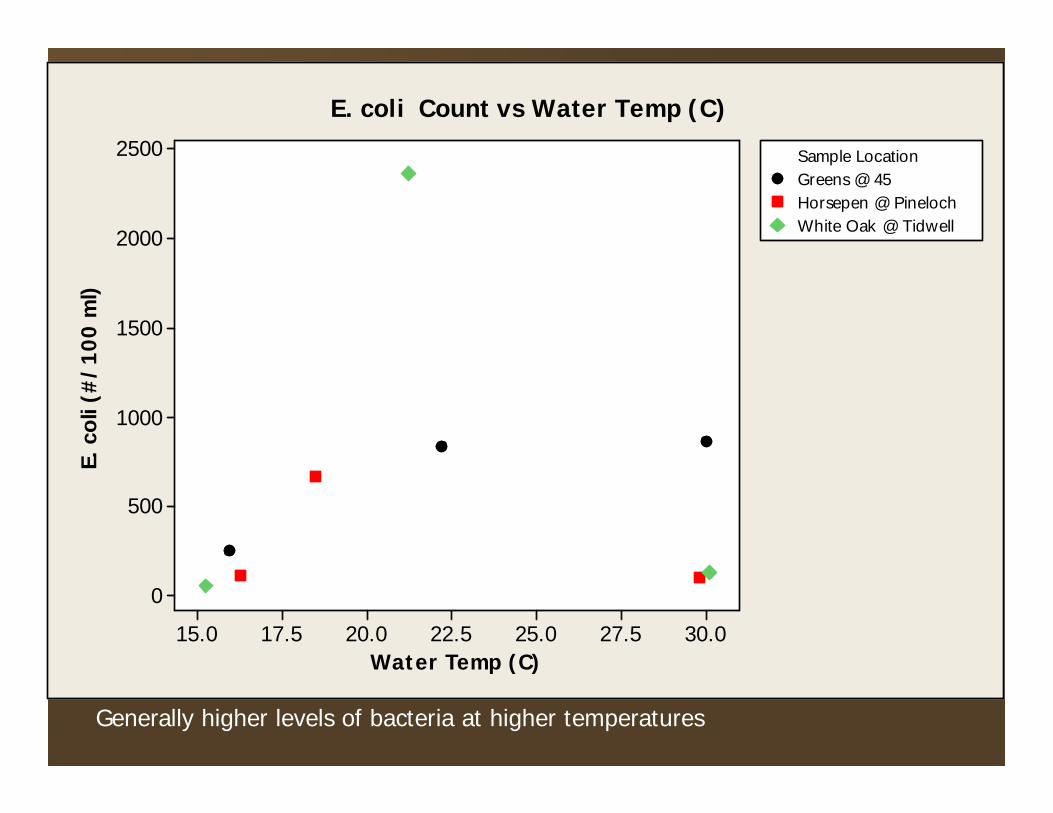
E. coli Count vs Water Temp (C)
Generally higher levels of bacteria at higher temperatures

Generally higher levels of bacteria at higher temperatures
30.027.525.022.520.017.515.0
2000
1500
1000
500
0
Water Temp (C)
E. c
oli E
xt C
ount
per
g o
f se
d.
Greens @ 45Horsepen @ PinelochWhite Oak @ Tidwell
Sample Location
E. coli per g of sed. vs Water Temp (C) (not data for Fall)

Significant differences seasonally fish fecal bacteria levels
KW AOV and Dunns Multiple Comparisons Chart
SummerFallSpring
1400000
1200000
1000000
800000
600000
400000
200000
0
Group
E.
coli
pe
r g
ram
fis
h f
ece
s
Fall
Spring
Summer
Summer
Fall
Z0-ZNormal (0 ,1) Distr ibution
Boxplots with Sign Confidence IntervalsDesired C onfidence: 80.529
Family A lpha: 0.2Bonferroni Indiv idual A lpha: 0.067
Pairwise ComparisonsC omparisons: 3
|Bonferroni Z-v alue|: 1.834

Stron
gylur
a mari
na
Pteryg
oplich
thys s
pp.
Paral
ichthy
s leth
ostig
ma
Oreoc
hrom
is sp
p.
Mugil c
epha
lus
Microp
terus
salm
oides
Lepo
mis micr
oloph
us
Lepo
mis meg
alotis
Lepo
mis mac
rochir
us
Lepo
mis gu
losus
Lepo
mis cya
nellu
s
Lepis
osteu
s ocu
latus
Ictalu
rus p
uncta
tus
Doro
soma c
eped
ianum
Cypr
inus c
arpio
Cten
opha
rynyo
don i
del la
Cichla
soma c
yano
gutta
tum
Atrac
tosteu
s spa
tula
150000
100000
50000
0
-50000
-100000
Species (Scientific name)
E. c
oli p
er g
fis
h fe
ces
95% Confidence Interval for Mean
Highest levels generally seen in L. cyanellus and L. gulosus - predators

PiscivoreOmnivoreInvertebrate FeederHerbivoreBenthic Omnivore
80000
70000
60000
50000
40000
30000
20000
10000
0
-10000
Trophic
E. c
oli p
er g
ram
fis
h fe
ces
95% Confidence Interval for Mean

No statistically significant trophic group differences
KW AOV and Dunns Multiple Comparisons Chart
Omniv
ore
Benthic
Om
nivore
Herbiv
ore
Inve
rtebra
te F
eede
r
Pisci
v ore
1400000
1200000
1000000
800000
600000
400000
200000
0
Group
E.
coli
pe
r g
ram
fis
h f
ece
s
Benthic O mniv ore
Herbiv ore
Inv ertebrate Feeder
P isciv ore
O mniv ore
O mniv ore
Benthic O mniv ore
O mniv ore
Benthic O mniv ore
Herbiv ore
O mniv ore
Benthic O mniv ore
Herbiv ore
Inv ertebrate Feeder
Z0-ZNormal (0 ,1) Distr ibution
Boxplots with Sign Confidence IntervalsDesired C onfidence: 90.003
Family A lpha: 0.2Bonferroni Indiv idual A lpha: 0.02
Pairwise ComparisonsC omparisons: 10
|Bonferroni Z-v alue|: 2.326

Estimated Loading
Few fecal production studies Varies with diet, temperature, trophic level Few true “density” studies of fish in
natural streams (requires mark recapture, multi-pass surveys or kill out – rotenone to estimate true density and biomass)

Estimated E. coli Loading from Fish
Used limited wild marine fish data in lab –fecal production rates, based on weight
Literature values of density of fish in rivers Our estimates of E. coli / gram of feces Biomass or # X fecal prod/fish X
Bacteria/feces = Daily rate of E. coliproduction

Estimated Loading of E. coli from fish
Based on our analyses, median loading estimates ranged between 935,113 and 29,703,591 E. coli MPN per hectare.
Arithmetic mean values ranged between 9,494,191 and 301,580,204 E. coli MPN per hectare.
Absolute highest estimate = 29.8 Billion Most methods yielded median and mean
E. coli levels ranging in the millions.

Estimated Loads
ValueProduction of Fish E.coli/day
Volume (cubic ml) # E.coli/ml # E. coli/100 ml
High Mean 301,580,204 10,000,000,000 0.030158 3.01580204Maximum 29,832,819,372 10,000,000,000 2.9832819 298.3281937

Aquarium Study
1st round used Bluegill (Lepomis macrochirus) 2nd round used channel catfish (Ictalurus
punctatus) 15 15 gal. aquaria
– 5 replicates Control Low density (1 fish/tank) High Density (3 fish/ tank)
Basic WQ parameters monitored daily– Additional parameters measured on bacteria sampling
days

Aquarium Study
Bacteria sampled– Pre-stocking– 1d post-stocking– 3d post-stocking– 7d post-stocking– 14d post-stocking

Blue Gill Aquarium Water E. coli (MPN) Values
(C. Catfish: 0 - E.coli)
Day# Fish
147310310310310310310
7
6
5
4
3
2
1
0
E. c
oli (
MPN
/ 1
00 m
l )
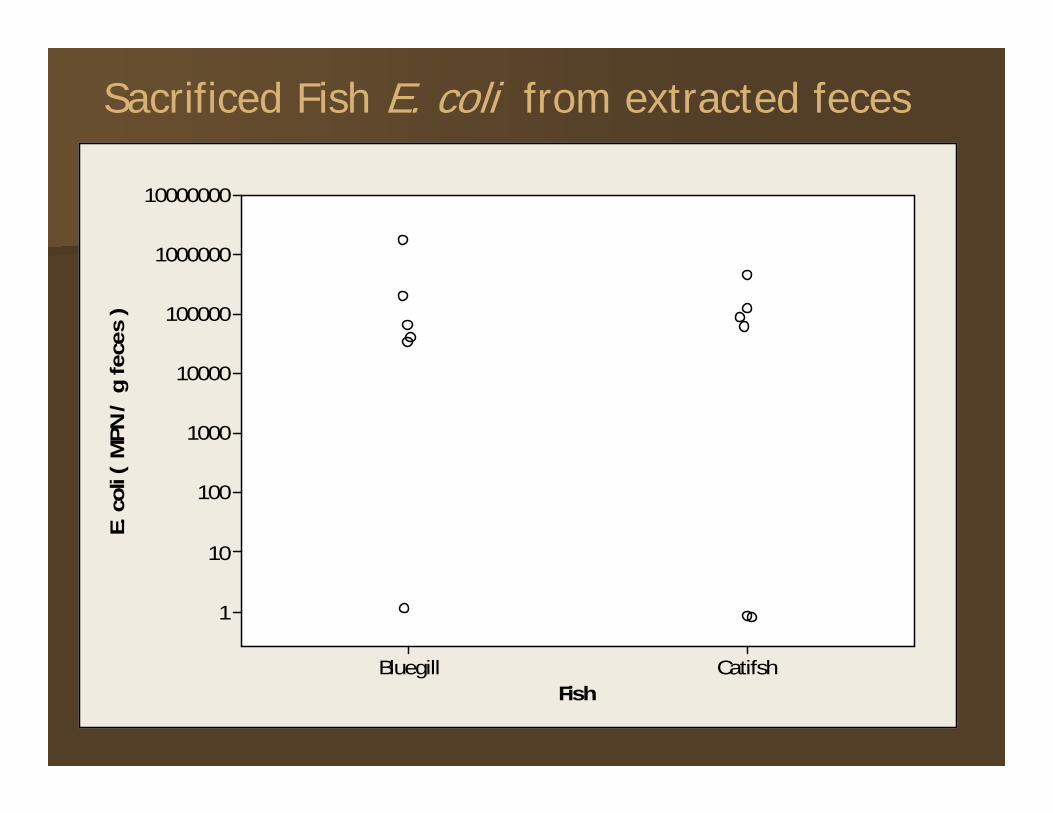
Sacrificed Fish E. coli from extracted feces
CatifshBluegill
10000000
1000000
100000
10000
1000
100
10
1
Fish
E. c
oli (
MPN
/ g
fec
es )
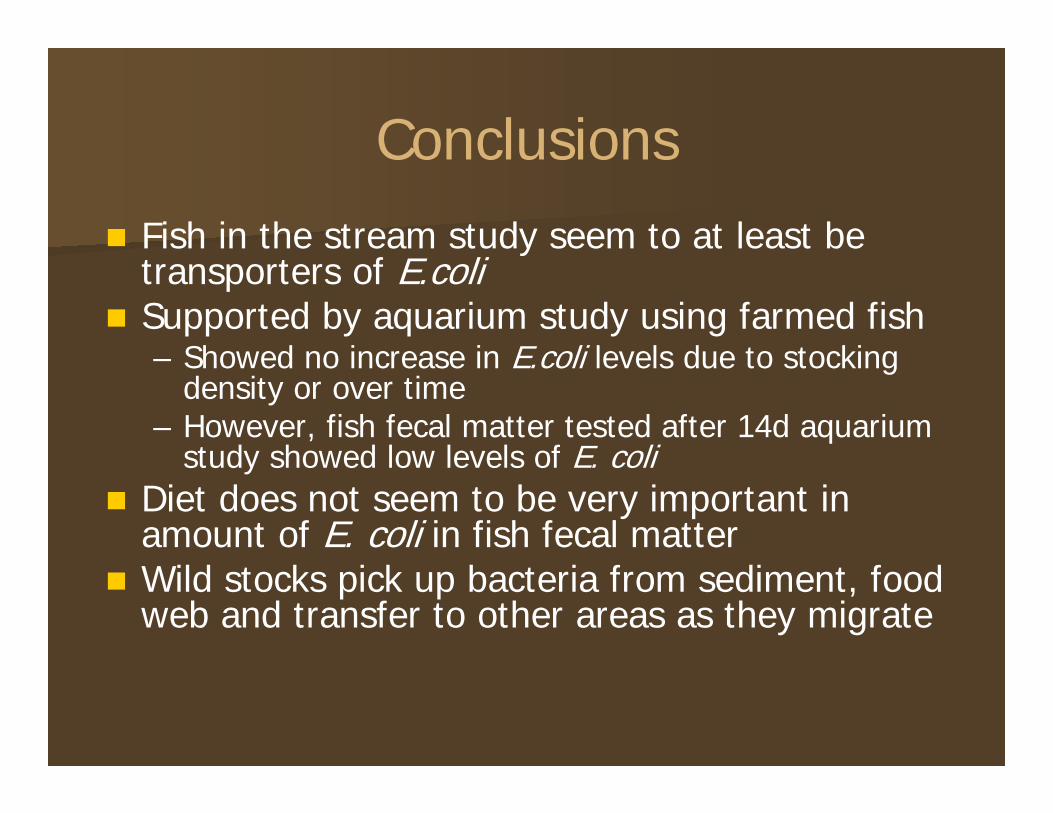
Conclusions Fish in the stream study seem to at least be
transporters of E.coli Supported by aquarium study using farmed fish
– Showed no increase in E.coli levels due to stocking density or over time
– However, fish fecal matter tested after 14d aquarium study showed low levels of E. coli
Diet does not seem to be very important in amount of E. coli in fish fecal matter
Wild stocks pick up bacteria from sediment, food web and transfer to other areas as they migrate

Conclusions/Future Implications
Bacteria in fish maybe indicators of bacteriological pollution in the waterbodies they inhabit
Fish seem to absorb the bacteria from their food as well as their environment
Therefore fish maybe significant transport vectors not captured by current modeling efforts

Conclusions
Seasonal and site differences contributed to probability of fish containing high indicator bacteria levels in feces
Sites with higher sediment and water bacteria generally contained fish with higher indicator bacteria
Fish in summer months generally yielded higher indicator bacteria levels.

Future Research Needs Studies (genetic and other) needed for
identifying and confirming original sources (pass through or specific to fish)
Investigate influence environmental gradient influence on bacteria levels: (pristine watershed urban) needed to evaluate trends in fish fecal E. coli vs. sediment and water levels
More lab studies needed to evaluate gut residence time vs. levels of feces bacteria levels.
(Also supplemental commercial aquarium studies). Fish Density Estimate = e.g. side scan high
definition acoustic studies

Mexican or Brazilian Free Tailed Bat (Tardarida brasiliensis)
Bat Field Study

Outline
Literature Review Historical Monitoring Data Review Field Study – upstream and downstream
sampling of colony Potential Loading Genetic sampling of fecal material and
water

Background Mexican Free Tailed bats are also considered
“guano” bats due to the large quantities of feces produced
Typically emerge from their roost areas shortly before dark to begin their nightly foraging. They can forage up to 50 miles and normally return back to their roost before sunrise
The abundance of the bats follows an annual pattern where highest numbers occurring during spring through fall. Most of these bats migrate to Mexico (early December through February) to overwinter

Background Recent estimates of the bats at the Commerce
Street Bridge Austin range up to 1.5 million per year (Tuttle 2003).
Waugh Street colony Houston size is estimated to range between 250,000 – 300,000 bats
Mexican Free Tailed bats are also considered “guano” bats due to the large quantities of feces produced
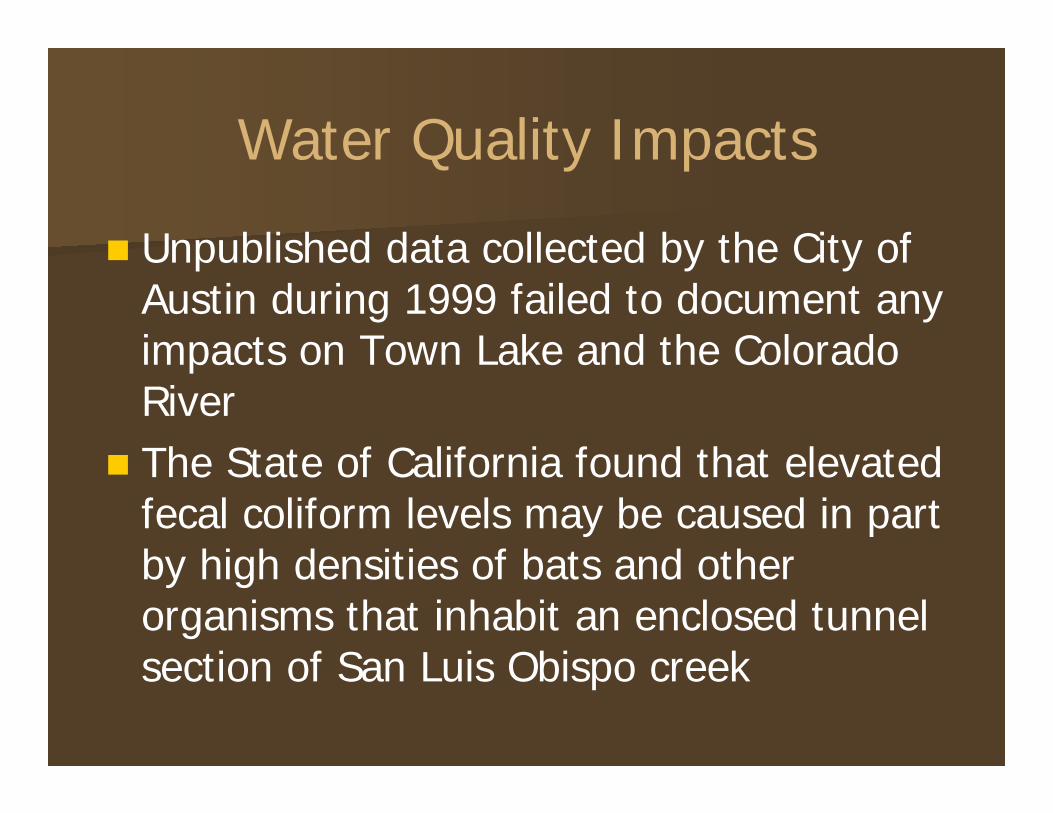
Water Quality Impacts
Unpublished data collected by the City of Austin during 1999 failed to document any impacts on Town Lake and the Colorado River
The State of California found that elevated fecal coliform levels may be caused in part by high densities of bats and other organisms that inhabit an enclosed tunnel section of San Luis Obispo creek


Site Location Seasons
Site 1. Upstream (200 ft) * Summer (Aug and Sept 08), Fall (Nov) 08, Winter (Feb) 09, Spring (April) 09
5 events total (ambient monitoring)
Site 2. Immediately below bridge (bat colony at .
Same (*) + fecal pellet sampling (April & Nov 09)
Site 3A Downstream 100 ft Source ID (water): (Aug 08, April and Nov 09)
Site 3 Downstream 200 ft. Same (*) + Source ID (water): (Aug 08, April and Nov 09)
Site 4. Downstream 1000 ft Same (*) + Source ID (water): (Aug 08, April and Nov 09)


New Bat Colonies Discovered!!


Estimates of E. coli loading into Buffalo Bayou from Waugh Street bat colony based on E. coli counts taken from fecal material suspensions and literature fecal production rates (Sgro and Wilkins 2003).
ID numbermL of dilution
waterNumber of
pelletsfeces
weight (g) <=>Extended
count E. coli1/2 extended count E. coli <=>
E. coli per gram
Using 1/2 E. coli for < DL
1 80 2 0.0174 < 1.25 0.63 < 71.8 35.92 80 2 0.0132 = 3.75 3.75 = 284.1 284.13 80 2 0.0151 < 1.25 0.63 < 82.8 41.44 80 2 0.0127 < 1.25 0.63 < 98.4 49.25 50 10 0.0384 = 275.20 275.20 = 7,166.7 7,166.76 50 10 0.0475 > 4,839.20 4,839.20 > 101,877.9 101,877.97 50 10 0.0540 = 251.80 251.80 = 4,663.0 4,663.08 50 10 0.0402 < 2.00 1.00 < 49.8 24.99 50 18 0.0773 = 2.00 2.00 = 25.9 25.9
10 40 18 0.0863 > 6,049.00 6,049.00 > 70,092.7 70,092.711 40 18 0.0539 = 5.00 5.00 = 92.8 92.812 40 18 0.0851 > 6,049.00 6,049.00 > 71,081.1 71,081.113 100 Blank 0.0027 < 1.00 0.50 < 370.4 185.2
Average 21,298.9 21,286.3
Daily loading rate in grams (g) of feces based on 300,000 bats 29,500 29,500Daily loading rate in grams (g) of feces based on 250,000 bats 24,600 24,600
Daily loading # E. coli MPN based on 300,000 bats 628,317,626 627,945,438Daily loading # E. coli MPN based on 250,000 bats 523,953,003 523,642,636
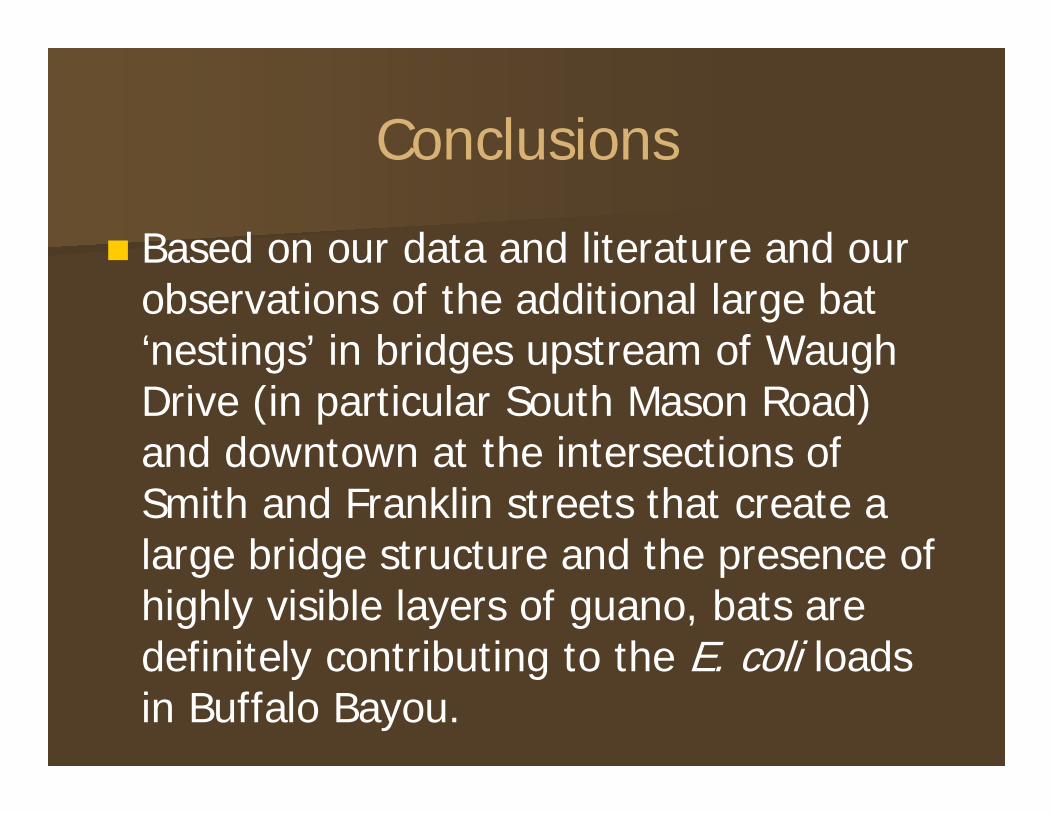
Conclusions
Based on our data and literature and our observations of the additional large bat ‘nestings’ in bridges upstream of Waugh Drive (in particular South Mason Road) and downtown at the intersections of Smith and Franklin streets that create a large bridge structure and the presence of highly visible layers of guano, bats are definitely contributing to the E. coli loads in Buffalo Bayou.

Conclusions
Since 2009, we have observed bats at the Waugh Drive Bridge as well as downtown at the Smith-Franklin Street Bridge complex year round. The absolute densities and activity of these overwintering bats would determine their overall contribution to E. coli loads in Buffalo Bayou.

Recommendations
Represent a significant but poorly understood source of nutrients and E. colibacteria in our urban watersheds.
Additional research is critically needed to characterize the interaction of bat population dynamics, seasonal and dielmovement, fecal and associated nutrient and bacteria loading, and resulting instream indicator bacteria concentrations.
THANKS to everyone who helped: Brian Muery, Julie Sandefur, Danielle Crossen, Mike Franks, Dianna Ramirez + TAMUG students