the role of calcineurin in skeletal muscle differentiation ...clok.uclan.ac.uk/9563/1/panagiotis...
TRANSCRIPT

The role of Calcineurin in skeletal muscle differentiation
PANAGIOTIS MANOLOPOULOS BSc (ions)
A thesis submitted in partial fulfilment of the requirements for the
Degree of Masters of Science (by research)
Department of Biological Sciences
University of Central Lancashire
October 2002
PANAGIOTIS MANOLOPOULOS

Contents
Abstract LI
Table of Contents ifi
Abbreviations VH
Index of Figures vffl
Index of Tables XI
Acknowledgements XLI
Declaration XIV

ABSTRACT
1. Strong evidence suggests that Calcineurin levels are higher in fast muscle
fibers compared to slow-twitch in resting skeletal muscles. Activation of the
Calcineurin in 4 skeletal muscle myocytes selectively up-regulates slow-
fiber-specific gene promoters through a mechanism involving the transcription
factor NFATcI. The Calcineurin pathway itself was down-regulated when rat
skeletal muscles were chronically stimulated at 10 FIz for a period of 3 weeks
illustrating adaptation.
2. Skeletal muscles that received chronic stimulation treatment showed a
significant increase in mitochondrial content. Histochemical studies detected a
change towards the slow phenotype, through the decrease of fast-twitch Type
Bib fiber content in fast skeletal muscles. Metabolic activity was not
significantly affected through this period of chronic stimulation.
3. Cyclosporin A was not able to prevent this initial transition towards the slow
phenotype, even though 3 weeks of 10 Hz chronic stimulation was insufficient
to cause marked changes in the skeletal muscle metabolism. This suggests an
incomplete fast-to-slow transformation was elicited by these conditions.
4. Stimulation of L6 myocytes with the calcium ionophore 4-Bromo-A23 187
(I 0 M) a partial fast-to-slow transformation occurred. It is likely that this
change was brought about by a number of processes including NFAT
translocation to the nucleus.
11

CONTENTS
CHAPTER 1- INTRODUCTION
1.1 Muscle structure and histology 2
1.1 .1 Muscle microstructure and macrostructure 2
1.1.2 The muscle fibre 3
1.2 Muscle innervation 11
1.3 Muscle function 13
1.3.1 The neuromuscular junction 12
1.3.2 Excitation- Contraction coupling 14
1.3.3 Muscle contraction 15
1.4 Skeletal muscle plasticity 17
1.5 The role of Calcineurin 48
1.5.1 Introduction to the role of Calcineurin 18
1.5.2 Structure of Calcineurin 18
1.5.3 Regulation of Calcineurin 21
1.6 Transcription factors of the NFAT family: Regulation and function 24
1.6.1 Introduction to the role of NFAT 24
1.6.2 Structure and distribution of NFAT proteins 25
1.6.3 Regulation of NFAT activation 31
1.6.4 DNA binding and transactivation 33
1.7 Inhibition of Calcineurin by Cyclosporin A (and FK506) 35
1.8 Muscle fiber differentiation induced by Calcineurin-
the role of Calcium 39
Page
111

1.9 Other transcription factors and calcium induced pathways involved in
muscle fiber plasticity 45
CHAPTER 2- METHODS
2.1 Induction of a fast- oxidative phenotype by chronic muscle stimulation (in
vivo study) and investigation of the effect of cyclosporin A: histochemical
and metabolic studies 50
2.1.1 Muscle fibre determination 53
2.1.2 Calcineurin and NFAT localization and translocation 55
2.1.3 Investigation of changes on enzyme activities of four
metabolic pathways 58
2.2 The effect of increased intracellular Ca2 in NFAT translocation on L6
Muscle cell cultures (in vitro study) 63
2.2.1 Lt muscle cell culture 63
2.2.2 Increase intracellular Ca 21 of L6 myocytes using Calcium
lonophore 4-Bromo-A23 187 69
2.2.3 Fura-2 [C2] measurements in L6 myocytes grown on
cut glass coverslips 70
2.2.4 Effects of increased intracellular Ca 2 in NFAT localization and
translocation 71
2.3 Statistical analysis 72
Iv
CHAPTER 3- RESULTS
3.1. Induction of a fast- oxidative phenotype by chronic muscle stimulation
and investigation of the effect of cyclosporin A : histochemical and
metabolic studies 74
3.1.1 The effect of chronic stimulation on muscle fiber differentiation 74
3.1.2 Calcineurin content of different muscle fiber types 81
3.1.3 The effect of chronic stimulation on enzyme activities
of four metabolic pathways 87
3.2. Investigation of the effect of increased intracellular Ca 2 in NFAT
translocation on 4 Muscle cell cultures 93
3.2.1 The effect of Br-A89 123 lonophore in intracellular calcium
concentration of L6 myotubes 93
3.2.2 The effect of increased intracellular calcium in NFAT
localization and translocation 95
CHAPTER 4- DISCUSSION
4.1. Induction of a fast- oxidative phenotype by chronic muscle stimulation
and investigation of the effect of cyclosporin A histochemical and
metabolic studies 102
4.1.1 Effect of chronic stimulation on muscle fiber differentiation 102
4.1.2 Effect of chronic stimulation in Calcineurin content of
different muscle fiber types 105
4.1.3 The effect of chronic stimulation on enzyme activities
of four metabolic pathways 108
V

4.2. Investigation of the effect of increased intracellular Ca 2 in NFAT
translocation on 4 Muscle cell cultures
111
REFERENCES
116
APPENDIX
VI

Abbreviations
[Ca'~]j Free intracellular calcium ion concentration
AP- 1 Activator protein I (c-fos and c-jun).
CaM Calmodulin
CamK Ca2 Vcalmodulin dependent protein kinase
CnA Calcineurin A
CnB Calcineurin B
CsA Cyclosporin A
ERIC Extracellular signal regulated kinase
GATA2 Skeletal muscle transcription factor binding a GATA DNA sequence
GM-CSF Granular macrophage colony-stimulating factor
U-protein Guanine nucleotide-bindinG-protein
GSK-3 Glycogen synthase kinase-3
IFN-g Interferon-g
IUF Insulin like growth factor
IL-2/4/5/1 3 Interleukin-2/4/5/13
Jak/STAT Janus kinase/signal transducers and activators of transcription
JNK N-terminal kinase
MAPK Mitogen activated protein kinases
MEF2 Myogenic enhancing factor 2
MHC Myosin heavy chain
MLC Myosin light chain
Miff Muscle regulatory factor
MyoD Myogenic regulatory factor
NFAT Nuclear factor of activated I cells
NF-icB Nuclear factor-kB
PIP2 Phosphatidylinositol 4,5 bisphoshate
PKC Protein kinase C
LU

Index of Figures
Figure 1.1 Basic components of a skeletal muscle 3
Figure 1.2 Interior structure of a muscle fiber 5
Figure 1.3 Electron micrograph of mammalian skeletal muscle 6
Figure 1.4 The arrangement of myofilament in the sarcomere 7
Figure 1.5 A molecular view of muscle structure 8
Figure 1.6 Motor end plates at low magnification in micrograph 11
Figure 1.7 Continuous stimulation of skeletal muscle at 10 1-Iz 12
Figure 1.8 Different views of the neuromuscular junction and motor end 13
Figure 1.9 The location of the genes for Calcineurin A (CnA) subunit
isoforms in the human genome map 19
Figure 1.10 The primary sequence structure of the binding site of the
subunits of the heterodimer on CnA 20
Figure 1.11 The CnB subunit again with the myristoyl residues and
EF-hands with four C2 ions complexed 21
Figure 1.12 Calmodulin ribbon structure 23
Figure 1.13 Schematic alignment of NFAT proteins predicted
from their cDNAs 25
Figure 1.14 Schematic diagram of the primary structure of
the NFATI protein 28
Figure 1.15 NFAT consensus binding sequences 33
Figure 1.16 Natural product inhibitors of calcineurin, the
immunossupressant drugs CsA and FK506 35
Figure 1.17 Immunophilin- immunosuppressant complexes inhibit
Calcineurin 36
Figure 1.18 Calcineurin dependent gene regulation in skeletal muscle 39
Figure 1.19 Model for a calcineurin-dependent pathway linking 41
Figure 1.20 Ras or Rac or PKC must be coincident with Ca 2 / calcineurin
signalling to activate NFAT and in turn genes 46
Figure 1.21 Ca2 Signalling Pathways Implicated in Myocyte
Remodelling and Hypertrophy 47
Figure 2.1 The enzyme catalysing the ATP hydrolysis 54
VIII

Figure 2.2 Addition to the cuvette for enzyme assays. 60
Figure 2.3 L6 muscle cell line photographs in different stages of cell
growth and confluency 66
Figure 2.4 L6 muscle cell line grown in coverslips (photographs) in
different stages of cell differentiation (myotube formation) 68
Figure 2.5 EosinlHematoxylin stain in L6 cells cultured in coverslips 69
Figure 2.6. Schematical figure showing the steps involved in [Ca2h]i
measurements in L6 myocytes 71
Figure 3.1 Skeletal muscle under various treatments- ATPase stain 76
Figure 3.2 Skeletal muscle under various treatments- ATPase stain 76
Figure 3.3 Skeletal muscle under various treatments- ATPase stain 77
Figure 3.4 Skeletal muscle under various treatments- ATPase stain 77
Figure 3.5 Skeletal muscle under various treatments- NADH-TR stain 79
Figure 3.6 Skeletal muscle under various treatments- NADH-TR stain . 79
Figure 3.7 Skeletal muscle under various treatments- NADH-TR stain 80
Figure 3.8 Skeletal muscle under various treatments- NADH-TR stain 80
Figure 3.9 Immunohistochemical stain for Calcineurin under
different treatments 82
Figure 3.10 Immunohistochemical stain for Calcineurin under
different treatments 82
Figure 3.11 Immunohistochemical stain for Calcineurin under
different treatments 83
Figure 3.12 Immunohistochemical stain for Calcineurin under
different treatments 83
Figure 3.13 Immunohistochemical stain for Calcineurin under
different treatments 83
Figure 3.14 Western bolt for Calcineurin in EDL control and
stimulated muscles 83
Figure 3.15 A: Western blot for Calcineurin B: Amount values
obtained by densitometric scanning of the western blots 86
Figure 3.16 Conversion of Pyruvate to Lactate 88
Figure 3.17 Changes in Mean activity Mol/Kg dry weight/hr for Lactate
Dehydrogenase after 20 days of chronic stimulation at 10 Hz 89
Figure 3.18 Conversion of Phosphocreatine to Creatine 89
Ix

Figure 3.19 Changes in Mean activity Mol/Kg dry weight/hr for Creatine Kinase
after 20 days of chronic stimulation at 10 Hz 90
Figure 3.20 Conversion of Malate to Oxaloacetate 90
Figure 3.21 Changes in Mean activity MoIIKg dry weight/hr for Malate
Dehydrogenase after 20 days of chronic stimulation at 10Hz 91
Figure 3.22 Conversion of glucose to glucose-6-phospate with the use of ATP 91
Figure 3.23 Changes in Mean activity MolIKg dry weight/hr for Hexokinase
after 20 days of chronic stimulation at 10Hz 92
Figure 3.24 Dual-wavelength photon counting measurements of intracellular
calcium in L6 myotubes 94
Figure 3.25 Fura-2 measurements in 4 myotubes under various calcium
ionophore concentrations 94
Figure 3.26 Immunohistochemical photographs of 4 myotubes in x40
magnification. Investigation of NFAT kinetics 97
Figure 3.27 Immunohistochemical photographs of 4 myotubes in x40
magnification. Investigation of NFAT kinetics 99

Index of Tables
Table 1.1 Proposed nomenclature for NFAT family proteins and
chromosomal location of the genes 26
Table 1.2 Tissue distributions of NFAT family members 30
Table 1.3 Each NFAT isoform undergoes nuclear translocation at specific
stages of muscle differentiation 32
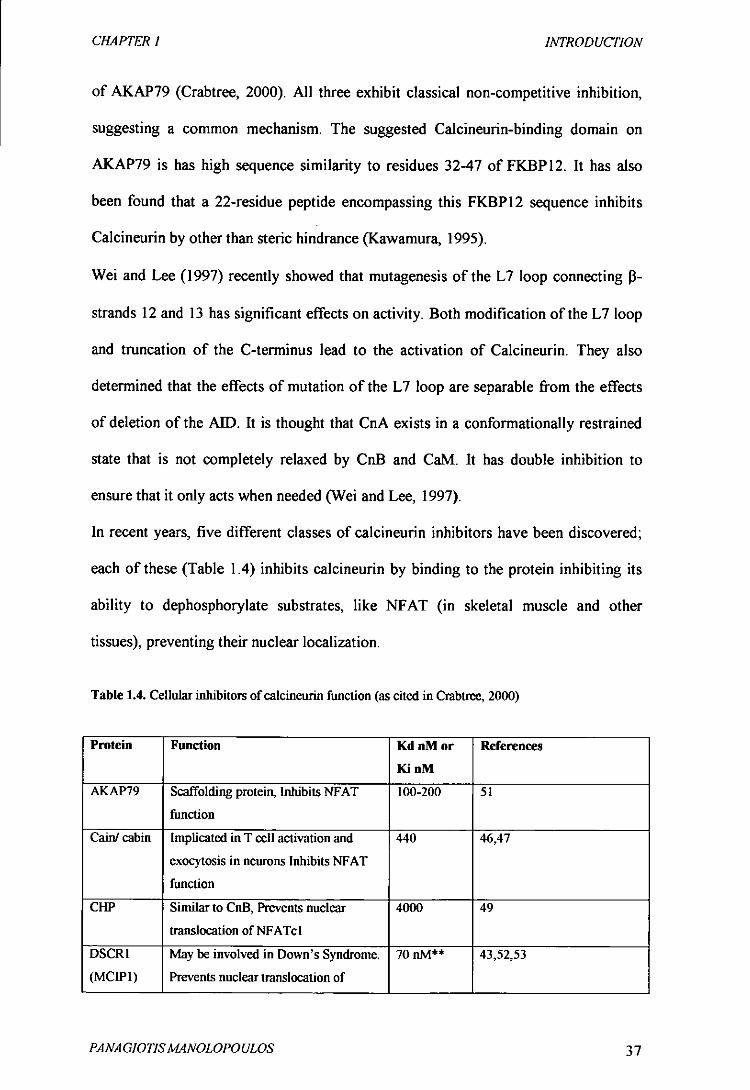
Table 1.4 Cellular inhibitors of calcineurin function
37
Table 2.1 Animal code name and stimulation pattern relation 50
Table 2.2 Muscle fiber identification using ATPase staining 54
Table 2.3 Muscle fiber identification using NADH-TR staining 55
Table 2.4 The reactions involved in Ceatine Kinase assay and the enzymes,
which catalyse them 59
Table 2.5 The reactions involved in Hexokinase assay and the enzymes,
which catalyse them 61
Table 2.6 The reaction in Lactate dehydrogenase assay and
the enzyme involved 61
Table 2.7 The reactions involved in malate dehydrogenase assay and
the enzymes, which catalyse them 62
Table 4.1 Fiber type composition in the skeletal muscle of the rat 103

A CKNO WLEDGEMENTS
There has been numerous individuals whose invaluable support, guidance and
instruction has contributed to the completion of this thesis. These words will
hopefully express my deep gratitude for their assistance.
Firstly, I would like to thank my first supervisor Dr. Niall Woods, for his support,
dedication, ongoing enthusiasm and friendship throughout my Masters at the
University of Central Lancashire. Secondly, I would like to thank my second
supervisor Dr. Henning Wackerhage, for his academic support, friendship, enthusiasm
and guidance throughout my research. In addition, I would like to thank the other
members of the Muscle research group, my friends and co-workers, James Higginson,
Philip Atherton and Montague Hope for their help and support.
I wish to thank the University of Central Lancashire for making possible the
completion of my work.
I wish to extend thanks to Dr. Stanley Salmons, Dr. J. Jarvis, Dr. Hazel Sutherland
and the University of Liverpool for providing the chronically stimulated muscle
samples that most of my work was based on, as well as for their help and support.
I would also like to thank Prof J.P. Singh, Dr. G. Iveson, Dr. G. Georgiou and the rest
of the academic, technical, and secretarial staff, as well as all the rest of my fellow
researchers for the support I received during my research work.
:4u

Finally, a great thanks to my family for their love and ongoing support. Without them
I would never have the opportunity to complete my studies.
XIII

DECLARA liON
This Thesis is an original and authentic piece of work produced in fblfilment of my
Masters degree regulations. I have frilly acknowledged and referenced all my
secondary sources. This thesis has not been submitted in whole or part for assessment
in another module at this or any other University. I have read the Academic
Regulations and I am fully aware of the potential consequences of any breach of
them.
Signed......................................PANAGIOTIS MANOLOPOULOS
Date S .....................
XIV
CHAPTER 1 INTRODUCTION
CHAPTER 1- INTRODUCTION
1.1 Muscle structure and histology
1.1.1 Muscle microstructure and macrostructure
1.1.2 The muscle fibre
1.2 Muscle innervation
1.3 Muscle function
1.3.1 The neuromuscular junction
1.3.2 Excitation- Contraction coupling
1.3.3 Muscle contraction
1.4 Skeletal muscle plasticity
1.5 The role of Calcineurin
1.5.1 Introduction to the role of Calcineurin
1.5.2 Structure of Calcineurin
1.5.3 Regulation of Calcineurin
1.6 Transcription factors of the NFAT family: Regulation and function
1.6.1 Introduction to the role of NFAT
1.6.2 Structure and distribution of NFAT proteins
1.6.3 Regulation of NFAT activation
1.6.4 DNA binding and transactivation
1.7 Inhibition of Calcineurin by Cyclosporin A (and FK506)
1.8 Muscle fiber differentiation induced by Calcineurin- the role of Calcium
1.9 Other transcription factors and calcium induced pathways involved in
muscle fiber plasticity
PANA GIOTISMANOLOPOULOS 1

CHAPTER 1
INTRODUCTION
CHAPTER 1- Introduction
1.1 Muscle Structure and Histology
1.1.1 Muscle microstnicture and macrostructure
For a human, as for other animals, to move is to survive. Apart from thinking, every
human activity requires a movement, or at least a muscle contraction, whether it is for
walking, running, swimming, and breathing, or even standing still (McComas, 1996).
The pumping of blood depends on the continual activity of cardiac muscle, while
smooth muscle controls such processes as the movement of food through the
gastrointestinal tract (peristalsis), the variations in the cross-sectional area of blood
vessels and the vascular tone (Bullock et al., 1986). Each skeletal muscle is an organ
that contains muscle tissue, connective tissue nerves, and blood vessels. Like
connective tissue elsewhere in the body, muscle consists of fibres embedded in an
amorphous ground substance. Most of the connective tissue fibres are made of
collagen. There are at least five immunologically distinct types, while the remaining
fibres are elastin (McComas, 1996). The connective tissue in muscle has three
anatomical parts, one of which is Epimysium the fibrous connective tissue that covers
more than 430 skeletal muscles and continuous with the tendons at the ends of the
muscle (Figure 1. 1) (Baechle, 1994). It contains tightly woven bundles of collagen
fibres, from 600 to 1800 rim in diameter, which have a wavy appearance and
connected to the perimysium (McComas, 1996).
PA NA GIOTIS MA NOLOPO ULOS 2

CHAPTER I
INTRODUCTION
t
Musa fibTh3
Figure 1.1 This diagram illustmtes the arrangement of the basic components, which make up a skeletal muscle (as cited in Burkitt, Young, and Heath, 1993).
The tendon is attached to bone periosteum, contraction of the muscle pulls on the
tendon and, in turn, the bone. Limb muscles have two attachments to bone: proximal
(closer to the trunk) and distal (farther from the trunk). The two attachments of trunk
muscles are termed superior (closer to the head) and inferior (closer to the feet). By
convention, the origin of a muscle is defined as the attachment of the muscle that is
more proximal or superior, and the insertion is defined as the attachment that is more
distal or inferior (Baechle, 1994).
1.1.2 The muscle fibre
A single skeletal- muscle cell is known as a muscle fibre. Each muscle fibre is formed
during development by the fusion of a number of undifferentiated, mononucleated
cells, known as myob/asts, into a single cylindrical, multinucleated muscle fibre. This
stage of muscle differentiation is completed around the time of birth, and the
differentiated fibres continue to increase in size with the growth of the organism
(Vander et al., 1994). In addition, it has been shown that fibre-type-specific programs
of gene expression can be detected at early stages of myogenic development in the
embryo (DiMario et al., 1993; Ontell et al., 1993; Stockdale 1997), but remain plastic
in adults, in whom they are subjected to modification as a function of contractile load
PANA GIOTIS MANOLOPO ULOS 3

CHAPTER 1 INTRODUCTION
(e.g., exercise training), hormonal shifts, or systemic diseases (Holloszy and Coyle
1984; Massie et al., 1988; Ianuzzo et al., 1991; Sabbah et al., 1993; Williams and
Neufer 1996). Sometimes skeletal muscle fibers are destroyed as a result of injury. It
is now generally known that that these damaged muscle fibers cannot be replaced
from existing muscle fibers. New fibres can be reformed, however, from
undifferentiated cells known as satellite cells. It must be noted however that this
mechanism cannot restore a severely damaged muscle to fill strength (Vander et al.,
1994). In addition, there is a different mechanism, which can make up to a point for a
loss of muscle tissue, through increased growth in the size of the remaining muscle
fibres (Vander et al., 1994). Muscle fibers are long cylindrical cells 50 to 100 zm in
diameter. The nuclei in these fibers are known to be located in the periphery of the
cell's cylindrical structure. Under the epimysium, the muscle fibres are grouped in
bundles (called fasciculi) that may consist of up to 150 fibres, with the bundles
surrounded by the connective tissue mentioned before, called the perimysium. Each
muscle fibre is surrounded by connective tissue called endomysium, which encircles
and is continuous with the fibre's membrane, or sarcolemma. All the connective
tissue- epimysium, perimysium, and endomysium- is continuous with the tendon, so
tension developed in one muscle cell can develop tension in the tendon (Baechle,
1994) (see Figure 1. 1). In addition, perimysium provides the pathway for the major
blood vessels and nerves to run through the muscle belly.
Underneath the coarse perimysial sheets of connective tissue is a looser and more
delicate network in which collagen fibrils run in all directions, some being connected
to the endomysium. The arterioles and venules are found in these regions, often with
intramuscular nerve branches. Figure 320 (in Appendix 1) illustrates the blood supply
of the lower leg.
PANAGIOTISMINOLOPOULOS 4

CHAPTER 1 INTRODUCTION
The interior structure of a muscle fibre is depicted in figure 1.2 following. The
sarcoplasm- the term used for the cytoplasm of a muscle fibre- contains contractile
components, which consist of protein filaments; other proteins; stored glycogen and
fat particles; enzymes; and specialized structures such as mitochondria and the
sarcoplasmic reticulum (Baechle, 1994). The most striking feature seen when
observing a muscle fibre through a light microscope (Figure 1.3) is a series of light
and dark bands perpendicular to the long axis of the fibre. Both skeletal and cardiac
muscle fibres have this characteristic banding and are known as striated muscles,
while smooth muscle cells do not show a banding pattern. The striated pattern in
skeletal and cardiac fibres, results from the presence of numerous thick and thin
filaments in the cytoplasm that are organized into approximately cylindrical bundles
(Ito 2 un in diameter) known as Myofibrils (Figure 1.4).
Sarcopla
Figure 1.2 The interior structure of a muscle fiber (source: Burkitt, Young, and Heath, 1993).
PANA GIOTJS MA NOLOPO (IL OS 5

CHAPTER! INTRODUCTION
Most of the cytoplasm is filled with myofibrils, each of which extends from one end
of a fibre to the other (Vander et al., 1994). Each myofibril is composed of thick and
thin filaments arranged in a repeating pattern along the length of the myoflbril. One
unit of this repeating pattern is known as a sarcomere. The thick filaments are
composed almost entirely of the contractile protein Myosin (Vander et al., 1994).
Figure 1.3 (A): This electron micrognph of mammalian skeletal muscle cut section demonstnites the main elements of the conducting system. (B): High magnification of a single sarcomere within a single myofibril (affow at the right of A band indicates end of a thick filament) (Source: Vander et al., 1994).
The myosin filaments (thick filaments about 16 nm in diameter) contain up to 200
myosin molecules (Baechle, 1994). On the other hand the thin filaments contain the
contractile protein actin as well as two other proteins- troponin and tropomyosin
(Vander et al., 1994). A typical myofibril will contain about 450 myosin filaments in
the centre of a sarcomere and 900 actin filaments at either end of the sarcomere. There
are additional filaments present in skeletal muscle that probably assist in maintaining
the structural integrity of the muscle (Baechle, 1994).
PANAGIOTIS MA NOLOPOUL OS 6
CHAPTER 1
INTRODUCTION
Samomero Samonic.e
Aband . - AWmi
Hbard Ilband ________ I I I I I
Zifle 11w,. ZIlne Mkne 21k'.
Mo&n Athi
Transverse seotion,
(00 01, :*1 •0 Myotãbrtl in relaxed state
Myottill In contacted state --
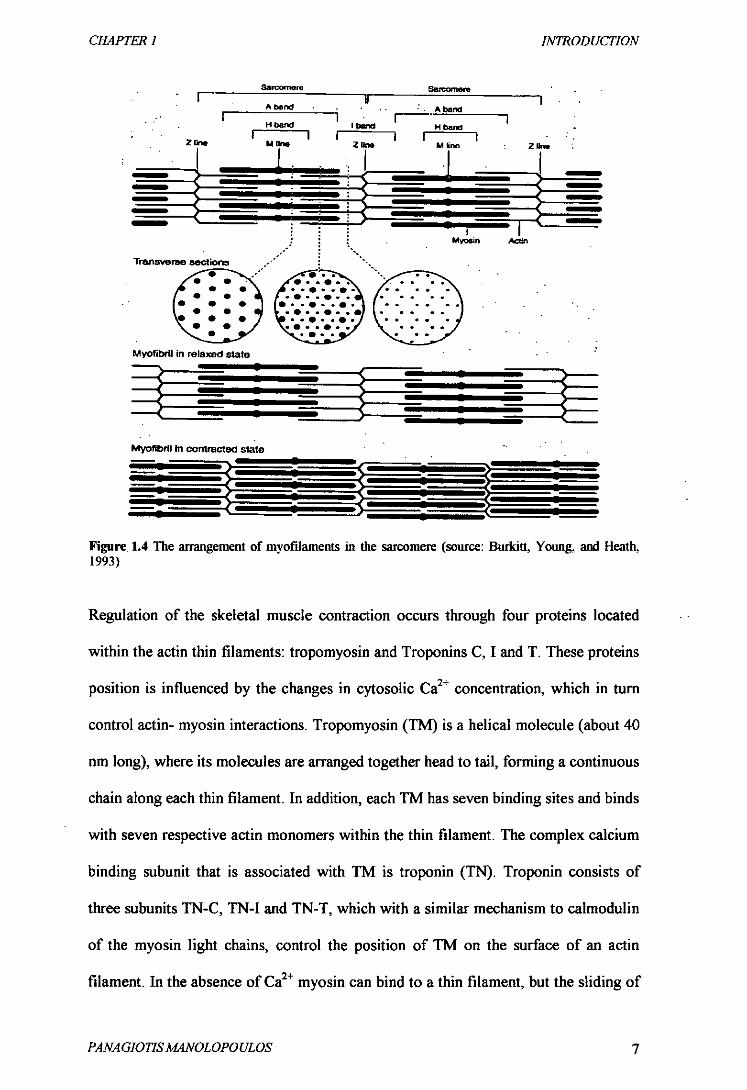
Figure 1.4 The anangemenl of myofilaments in the sarcomeit (source: Burkiti, Young and Heath, 1993)
Regulation of the skeletal muscle contraction occurs through four proteins located
within the actin thin filaments: tropomyosin and Troponins C, I and T. These proteins
position is influenced by the changes in cytosolic Ca2t concentration, which in turn
control actin- myosin interactions. Tropomyosin (TM) is a helical molecule (about 40
nm long), where its molecules are arranged together head to tail, forming a continuous
chain along each thin filament. In addition, each TM has seven binding sites and binds
with seven respective actin monomers within the thin filament. The complex calcium
binding subunit that is associated with TM is troponin (TN). Troponin consists of
three subunits TN-C, TN-I and TN-T, which with a similar mechanism to calmodulin
of the myosin light chains, control the position of TM on the surface of an actin
filament. In the absence of Ca2t myosin can bind to a thin filament, but the sliding of
PA NA GIOTIS MAIVOLOPO UL OS 7

n
SL
DHPR
Ell
RyR
SR
lain M line Nebulin
(b)
I)
Gelsolintreatad
ii)
CHAPTER 1 INTRODUCTION
myosin across the thin filament is prevented by the TM-TN complex. This is believed
to be the first of the two positions that the TM and TN molecules can occupy on the
thin filament under the control of Ca 2 and is called the "off position". On the other
hand in the "on position" situation binding of Ca 2 ions to TN-C triggers a slight
movement of TM towards the centre of the actin filament. This in turn exposes the
myosin- binding sites on actin. (Lodish et al., 2000).Finally, as it has been
demonstrated, the globular head regions are the ones, which contain binding sites for
actin with the use of ATP (hydrolysis) (Zubay et al., 1995). it is now established that
an intracellular calcium concentration larger than 10 4 M stop the TM-TN inhibition
and contraction occurs (Lodish et al., 2000).
(a) Z disk 4ctin thin filament
Skeletal muscle
Figure 1.5 i) a) Skeletal muscle; structural organization of the thick and thin filaments b) The role of fitin in the structure and lhnction of the skeletal muscle. (Lodish et at, 2000). ii) The role of DHPR and Ryanodine receptors in Ca 2 influx for activation of the SR via a signal transduction mechanism (Wasserstrom, 1998).
The thick filaments are located in the middle of each sarcomere, where the A band
(wide, dark band) is formed by their orderly parallel arrangement. Each sarcomere
contains two sets of thin filaments, one at each end. The end of the sarcomere is the Z
PA/VA GIOTISMANOLOPOULOS

CHAPTER 1 INTRODUCTION
line meaning that two successive Z lines define its limits. One end of each thin
filament in a set is bound (like an anchor) to a network of interconnecting proteins (Z
line), whereas the other end overlaps a portion of the thick filaments. Titin or
connectin connects the ends of the myosin thick filaments to the Z discs and extends
the thick filament along to the H zone. This set of proteins organize thin and thick
filaments in their three-dimentional arrys and give muscle much of its elasticity
(Lodish et al., 2000). The light band, known as the I band (figure 1.4), lies between
the ends of the A bands of two adjacent sarcomeres and it is bisected by the Z line. It
contains those portions of the thin filaments that do not overlap the thick filaments. In
addition, two other bands are present in the A band region of each sarcomere. A
relatively light band located in the centre of the A band, is known as the H zone,
which corresponds to the space between the ends of the two sets of thin filaments in
each sarcomere. As a result, only thick filaments, specifically their central parts, are
found in the H zone. The narrow, dark band in the centre of the H zone is known as
the M line and corresponds to the proteins that link together the central region of the
thick filaments. Thin filaments are anchored to the Z line, while thick filaments are
linked together by the M line and to the Z line by the titin filaments as mentioned,
meaning that neither thick nor thin filaments are free-floating. Moreover, each thick
filament is surrounded by a hexagonal array of six thin filaments, and each thin
filament is surrounded by a triangular arrangement of three thick filaments.
Altogether there are twice as many thin as thick filaments in the region of filament
overlap (Vander et al., 1994).
Each myofibril is surrounded by a system of tubes called sarcoplasmic reticulum
(SR), which terminates in the Z lines (see figure 1.2). Calcium ions are stored in the
SR, in formations called vesicles, which play a very important role in muscle
PANAGIOTJSM4NOLOPOULOS 9
CHAPTER / INTRODUCTION
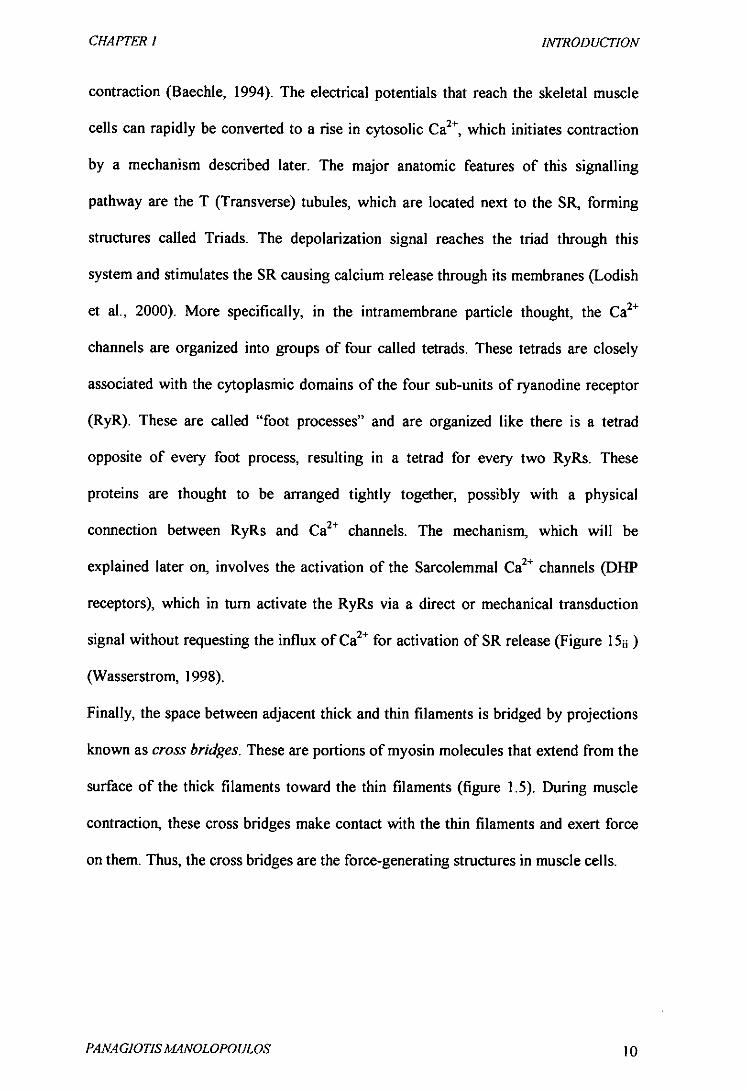
contraction (Baechle, 1994). The electrical potentials that reach the skeletal muscle
cells can rapidly be converted to a rise in cytosolic Ca 2 , which initiates contraction
by a mechanism described later. The major anatomic features of this signalling
pathway are the T (Transverse) tubules, which are located next to the SR, forming
structures called Triads. The depolarization signal reaches the triad through this
system and stimulates the SR causing calcium release through its membranes (Lodish
et al., 2000). More specifically, in the intramembrane particle thought, the Ca 2
channels are organized into groups of four called tetrads. These tetrads are closely
associated with the cytoplasmic domains of the four sub-units of ryanodine receptor
(RyR). These are called "foot processes" and are organized like there is a tetrad
opposite of every foot process, resulting in a tetrad for every two RyRs. These
proteins are thought to be arranged tightly together, possibly with a physical
connection between RyRs and Ca 2 channels. The mechanism, which will be
explained later on, involves the activation of the Sarcolemmal Ca 2 channels (DHP
receptors), which in turn activate the RyRs via a direct or mechanical transduction
signal without requesting the influx of Ca 2 for activation of SR release (Figure 1 5 )
(Wasserstrom, 1998).
Finally, the space between adjacent thick and thin filaments is bridged by projections
known as cross bridges. These are portions of myosin molecules that extend from the
surface of the thick filaments toward the thin filaments (figure 1.5). During muscle
contraction, these cross bridges make contact with the thin filaments and exert force
on them. Thus, the cross bridges are the force-generating structures in muscle cells.
PA NA GJOTIS MA NOLOPO ULOS 10

CHAPTER 1
IWIRODUCTION
1.2 Innervation
The nerve cells whose axons innervate skeletal muscle cells and cell bodies are
located in either the brainstem or the spinal cord, are called motor neurons. These are
myelinated axons and very large in diameter giving them the ability to propagate
action potentials at very high velocities. When the axon of the motorneuron reaches
the muscle it divides into many branches and each branch forms a single junction with
a muscle fiber. This means that one motor neuron controls many muscle fibers but
every single fiber is innervated by only one motor neuron. A motor unit is the
complex formed by the motor neuron and the muscle fiber it innervates. The muscle
fibers of the motor unit even though they are located in the same muscle they do not
lay one next to an other, instead they are scattered throughout the muscle. In addition,
an action potential will cause contraction of all the muscle fibers connected to the
motor neuron, which is carrying the action potential (Vander et al., 1994).
a. b. Figure 1.6 Motor end plates at low magnification in micrograph a, the terminal part of the axon of a motor neuron is seen dividing into several branches, each terminating as a motor end plate on a different skeletal fiber near to its mid.poiim Micrograph b shows the lowennost of these motor end plates at higher magnification. The axonal branch is seen to lose its myelin sheath and divides to form a cluster of small bulbous swellings (terminal boutons) on the muscle fiber surface (as cited in Burkitt, Young; and Heath, 1993).
PANAGIOTISMANOLOPOULOS 11

CHAPTER I IPTIRODUCTION
Moreover Salmons and Sreter (1976) suggested that the changes, which follow cross
reinnervation of mammalian fast-to-slow twitch muscles, may reflect a capacity of
skeletal muscle to respond adaptively to different functional requirements. This
interpretation is supported by experiments in which long-term electrical stimulation
was used both to reproduce and to oppose the effects of cross reinnervation (Salmons
and Sreter, 1976).
The innervation of the lower leg in the animal used for experimentation (adult
Sprague Dawley rats of either sex) is illustrated in Figures 187, 188 (Appendix 1).
10 Hz Continuous 100 Hz Intermittent
Slow oxidative program Type Imyosin Mitochondria rich Limited glycolytic capacity
tzs{i)
Fast glycolytic program Type II myosln Mttochondrta poor High glycolytle capacity
Figure 1.7. Continuous stimulation at 10 Hz (left panel) leads to sustained elevations of [Ca 21 in a mnge from tOO to 300 nM that are chaiacteristic of slow fibers. Intennittent nerve stimulation at higher frequencies (100 Hz) produces large but transient oscillations in [ca 21 that itach as high as 1000 nM, but are maintained at resting levels around 50 nM in a manner characteristic of fast fibers (as cited in Olson and Williams, 2000).
Finally, different patterns of motor neurons firing lead to distinctive waveforms of
oscillations in intracellular calcium and determine skeletal muscle fiber type. Varying
the frequency of neural stimulation will transform one fiber type into another causing
muscle fiber differentiation (Figure 1.7) (Olson and Williams, 2000).
PANAGJOTISMANOLOPOULOS 12

CHAPTER 1 INTRODUCTION
1.3 Muscle function
1.3.1 The neuromuscular junction
"The skeletal muscle fibers are innervated by large myelinated nerve fibers that
originate in the large motorneurons of the anterior horns of the spinal cord" (as cited
in Guyton, 1991). The motor end plate is defined as the region of the muscle fiber
plasma membrane that lies directly under the terminal portion of the axon. Moreover,
the junction of an axon terminal with the motor end plate is known as a
neuromuscular junction (Figure 1.8).
A
Tologilal cell Myelin sheath
terminal nervo -
: 1
Myotibnls branches
1 C
I Axon terminal in synaptic trough
Figure I.S. Different views of the neuromuscularjunction and motor end plate (From (Juyton, 1991).
Like the synaptic junctions (between two neurons), the axon terminals of a motor
neuron have membrane bound vesicles, which contain the chemical transmitter
acetylcholine (ACh) (Vander et al., : 1994)
About 300 vesicles of acetylcholine are released to the synaptic trough when the
neuromuscular junction is 'stimulated' by a nerve impulse (Guyton, 1991). The
PA NA GIOTIS MANOLOPO UL OS 13

CHAPTER / INTRODUCTION
synaptic trough with the nerval membrane are identified above and the muscle
membrane with its subneural cleft below. The process is triggered by the action
potential, which causes the calcium channels, located in the end of the neural
membrane, to release large quantities of calcium, which in turn diffuses to the interior
of the terminal. The calcium ions attract the acetylcholine vesicles through the dence
bars to the synaptic trough where they release their acetylcholine by the process of
exocytosis (Guyton, 1991).
The acetylcholine diffuses across the cleft and binds to specific nicotinic receptors,
which in turn cause the movement of sodium and potassium ions though them. This
causes a local depolarisation of the motor end plate called end-plate potential (EPP)
(this is similar to the EPSP:excitatory postsynaptic potential, at a synapse). In
addition, the motor end plate contains the enzyme acelyicholineslerase at its surface,
which breaks down ACh. Finally, most neuromuscular junctions are located in the
middle of a muscle fiber, and action potentials created can go in both directions
toward the ends of the fiber (Vander et al., 1994).
1.3.2 Excitation- contraction coupling
Excitation- contraction coupling refers to the sequence of events by which an action
potential in the plasma membrane of a muscle fiber leads to cross- bridge activity.
The contractile activity of muscles, as previously explained, is influenced by
neurotransmitters released by autonomic nerve endings (Vander et al., 1994). In
addition, it has been established that L-type Ca 2 channels activation can in turn
activate the release of Ca 2 from the Sarcoplasmic Reticulum (SR) stores; finally
resulting in muscle contraction (Wasserstrom, 1998). This process occurs in response
to the activation of the dihydropyridine (DHP) receptors located in the t-tubules
PANAGIOTISM4NOLOPOULOS 14

CHAPTER 1 J?VTRODUCTJON
(Fig. 1.5). When these sarcolemmal chanels are activated, as result of the action
potential, they trigger the opening of the Ca 2 channels on the SR membrane and the
release of Ca2 in the cytosol. This "link" between the DI-IP receptors and the RyR
receptors (the sarcolemal event and the SR event) is not well known but it is thought
to rely on a mechanical process. This hypothesis was based on the fact that this
process, that probably involves the "foot process" between the DFLP receptors and the
RyR, can occur in the absence of Ca 2 influx, which means that excitation contraction
coupling is a voltage dependent process (Wassertrom, 1998).
1.3.3 Muscle contraction
Many people have linked the term contraction with shortening when this is not
necessarily the case. Contraction refers to the turning or the force generating sites in a
muscle fiber. In order for shortening to occur, the opposing force must be smaller than
the force produced by the muscle fibers (Vender et al., 1994). First an action potential
travels along a motor nerve towards its endings on the neuromuscular junction. The
release of Ach as described before causes the opening of several acetylcholine-gated
protein channels, on the motor end plate. This results on the influx of large quantities
of sodium ions to flow to the interior of the muscle fiber membrane, which in turn
initiates an action potential in the muscle fiber. The depolarisation caused by the
action potential, travels deeply within the muscle fiber and causes calcium ion release
from the SR. The calcium ions are the ones who trigger the attractive forces between
the actin and myosin filaments, causing them to slide together. The calcium ions then
return to the SR, after fraction of a second, where they are stored till a new action
potential stimulates the SR, to cause a new contraction (Guyton, 1991).
PANAGIOTISMANOLOPOULOS 15

CHAPTER 1 INTRODUCTION
"It has been estimated that about 30% of the SR Ca 2 is released during contractions
of the perifised heart (Chen et al., 1996). Whether there is a decrease in SR Ca 2
content in fatigued muscle is controversial. It has been demonstrated that a decrease in
the force of muscle contraction in electrical stimulation protocols correlates with
decreased Ca2 release from the SR (Fins and Balog, 1996; Westerblad and Allen,
199 1) and a decrease in the SR Ca 2 content has been reported (Schneider, Simon, and
Szucs, 1987). However, a decrease in the SR Ca 2 with fatigue has not been a
universal finding (Gonzalez-Serratos et al., 1978)" (as cited in Halseth et al., 2000).
The basic mechanism of contraction is illustrated in figure 1.4. It shows the relaxed
(above) and the contracted state of the sarcomere (below). The thick filaments, which
are composed mainly of the protein myosin, are maintained in register by their
attachment to a disc-like zone represented by the M line. Similarly the thin filaments,
which are composed mainly of the protein actin, are attached to a disc-like zone
represented by the Z line. The widely accepted sliding filament theory proposes that
under the influence of energy released from ATP, the thick and thin filaments slide
over one another, thus causing shortening of the sarcomere (Burkitt, Young, and
Heath, 1993). The energy for this process comes from the hydrolysis of the adenosine
triphosphate (ATP) to adenosine diphosphate (ADP) and phosphate (Pi) (as shown
below).
This reaction is catalysed by an enzyme called myosin ATPase, which allows the
contraction process to continue or for relaxation to occur (Baechle, 1994).
PANAGIOTISJyL4NOLOPOULO5' 16

CHAPTER 1 INTRODUCTION
1.4 Skeletal muscle plasticity
Skeletal muscle adapts with a great specificity to different types of exercise. Muscle
plasticity [Plasticotita (Greek): the ability the change, reshape] refers to this ability of
the muscle tissue to adapt to various stimuli depending on the contractile force, speed
and duration. There is now strong evidence suggesting there is a link between the
intracellular calcium increases (associated with contractile signals and stress) and a
specifically activated signal transduction network (Chin et al., 1998). This network
has been shown to consist of several pathways inducing muscle fiber differentiation or
hypertrophy. There has been suggested that these signal transduction pathways
interact with each other. This interaction is called 'cross-talk' and has been shown to
link many pathways especially in the better-researched heart (Ruwhof and Van der
Laarse, 2000). These pathways include the calcineurin pathway (Chin et al., 1998),
the myogenic regulatory factor (MyoD) pathway (Cox, Quinn, and McDermott, 1999;
Chin et at., 1998), the calmodulin-dependent protein kinase (CaMIK) pathway
(Cruzalegui and Bading, 2000), the mitogen-activated protein kinase (MAPK)
pathway (Treisman, 1996), the nuclear factor-KB (NF-icB) pathway (Timmerman et
al., 1996), as well as insulin signaling and developmental pathways (Musaro et al.,
1999; Olson and Williams, 2000). These pathways and especially the calcineurin
pathway will be explained in more detail next. Finally, they are thought to activate a
variety of transcription factors, which in turn activate specific muscle genes. It might
though require a combination of mechanisms or transcription factors in order to
activate a certain muscle gene.
PANAGJOTJSMANOLOPOULOS 17

CHAPTER 1 INTRODUCTION
1.5 The role of Calcineurin
1.5.1 Introduction to the role of Calcineurin
Calcineurin is a serine- theonine specific Ca 2 -calmodulin- activated protein
phosphatase that has been identified in many organisms from yeast to humans. This
enzyme is targeted by cyclosporin A and FK506, two structurally unrelated
immunosuppressive drugs. Both drugs form complexes with abundant intracellular
binding proteins, cyclosporin A with cyclophilin A and FKSOG with FKBP 12, which
bind to and inhibit calcineurin (Hemenway and Heitman, 1999). In addition,
calcineurin is known to play an important part in the regulation of the transcription
factor family of NFAT proteins during T cell activation, and in mediating responses
of microorganisms to caution stress (Hemenway and Heitman, 1999). Moreover,
evidence was presented showing that calcineurin is a key component in T cell
signalling pathways, just after the demonstration that calcineurin is the target of CsA
and FK506 (Liu et al., 1992; Clipstone and Crabtree, 1992). Finally, there is direct
evidence that calcineurin is involved in muscle growth and can induce muscle
hypertrophy and fiber type changes (Chin et. al., 1998; Olson and Williams, 2000;
Mayne et. al., 1996).
1.5.2 Structure of Calcineurin
Calcineurin was initially identified like a bovine brain cAMP phosphodiesterase
inhibitor with a 'protein-like' activity (Wang and Desai, 1976; Wang and Desai,
1977). This protein was later termed as a Ca 2 - dependent activator jkotein, regulator
protein and was used for the purification of other proteins with the use of a
calmodulin by affinity chromatography. Klee and Krinks (1978) managed to purif'
PA NA GIOTIS MANOLOPO UL OS 18

CHAPTER 1 INTRODUCTION
calcineurin while trying to purify cAMP phosphodiesterase by affinity
chromatography. Klee et al. (1979), named this protein 'Calcineurin' as they
identified that it was rich in bovine brain tissue, and bounded to Ca 2 even in the
absence of calmodulin (Hemenway and Heitman, 1999). Calcineurin is not a large
protein, but it does offer great opportunities to observe the many ways such a small
protein can exert broad influence. Calcineurin is a heterodimer, with a 59-kDa
calcineurin A (CnA= catalytic) subunit and a 19-kDa calcineurin B (CnB= regulatory)
subunit (Cohen and Cohen, 1989; Ensembl: http://www.ensembl.org ).
Primary Structure
At least 2 genes encoding isoforms of CnA have been identified from complimentary
DNA cloning of the major catalytic subunit of Calcineurin in mammalian brain. The a
and b genes are localized on human chromosomes 4 and 10 respectively. In addition
two more isoforms of the protein have been identified in chromosomes 8, and 19 as
presented in the international databases (Ensembl: http://www.ensembl.org ; NCBI:
http://www.ncbi.nlm.nih.po ; UCSC http://genome.cse.ucsc.edu ) (Figure 1.9).
I S
- -
I I I —8
p !
- !
Figure 1.9 The location of the genes for Calcineurin A (CnA) subunit isofornis in the human genome map (as cited in Ensembi: http://www.ensembl.org ).
PA NA GIOTIS M4NOLOPO UL OS 19

CHAPTER 1 INTRODUCTION
Zhuo and co-workers (1994) have identified a major structural difference between
two first isoforms, which is thought to play a role in regulation (Zhuo et al., 1994).
Only 1 gene for Calcineurin B (CnB), located on human chromosome 2 has been
found (Navia, 1996; Ensembl: http://www.ensembl.org ). Below is a figure from work
by Kawamura & Su (1995), which illustrates the primary sequence structure of the
binding site of the subunits of the heterodimer on CnA (Figure 1.10)
Catalytic Domain BBD CaM-BD Al
HA-aCnAcx
HA
LPNFMDVFTWSLPFVGEKV 343 361
Figure 1.10 The primazy sequence structure of the binding site of the subunits of the heterodimer on CnA (as cited in Kawainum and Su, 1995).
Secondary/Supersecondary Structure
Various domains have been identified on the Calcineurin subunits. The core structure
is composed of a combination of 6-strands, surrounded by a-helices and J3-sheets
(Goldberg et al., 1995).
The mechanism of calcineurin and the other protein phosphatases depends on the
divalent metal coordinating site. The metal ions activate water molecules to catalyse
hydrolysis of the phosphate in a single-step reaction. -
The CnB-binding site is a long 22-residue a-helix (sometimes called the b-binding
helix: BBFI). CnB has 2 EF-hand Ca2tcoordinating domains. Each domain
coordinates 2 Ca 2 ' atoms. The EF-hand motif consists of a-helices joined by a n-loop.
PANAGIOTISMANOLOPOULOS 20

CHAPTER I INTRODUCTION
In this way, CnB is very similar to CaM, except without the long linking a-helix
(Griffith et al., 1995). The structure below illustrates the CriB subunit again with the
EF-hands and with four Ca 2 ions bound to it (Figure 1.11).
Figure 1.11 The CnB subunit again with the myristoyi residues and EF-hands with four Ca 2 ions complexed (as cited in Http://attila.stevens-tech.edu/chebio/miippingfstmctword.htm#references ).
Despite the structural similarities of CnH and calmodulin, reconstitution of the
holoenzyme from purified subunits demonstrates that CnB cannot substitute for the
activity of calmodulin nor can calmodulin frmnctionally substitute CnB (Merat et al.,
1985). The importance of the structures mentioned will be discussed in more detail in
the section of calcineurin regulation.
1.5.3 Regulation of Calcineurin
It is well known that protein phosphorylation controls many cellular events meaning
regulation requires many levels. The Calcineurin pathway involves many different
regulatory mechanisms. These include site localization, Ca 2 -activation, auto-
inhibition (by auto-inhibitory domain - AID), CriB-activation, CaM-activation. In
PA NA GIOTIS MA NOLOPOULOS 21

CHAPTER 1 INTRODUCTION
addition, there are a number of recent studies elucidating the great complexity of the
regulation to which Calcineurin is subject (Klee, Ren, and Wang, 1998).
Site localization
One regulatory mechanism is that kinases and phosphatases are maintained at discrete
cellular locations through their interaction with anchoring proteins. Enzymes may be
positioned in close proximity to specific substrates, which then can be efficiently
modified in response to the appropriate signals (Http://attila.stevens-
tech.edulchebio/mjippinglstructword.htm#references ). Politino & King suggested in
1990 that it might function in membrane anchoring, from studies with phospholipid
interactions, while Griffith has noted that other EF-hand superfamily proteins use
Ca2 as a switch (Griffith et al., 1995).
Auto-inhibition
There is an autoinhibitory domain (AID) at the carboxyl terminal of the CnA subunit.
It lies over the substrate-binding channel of the catalytic domain. When Calcineurip is
auto-inhibiting, the CaM-binding domain, which is an amphipthic a-helix at the
carboxyl terminus of the CnA, lies under the CnB-binding helix, linked at one end to
the AID. This places the AID close to the active site where it could inhibit the binding
of substrates and inhibitors (Stoddard and Flick; 1996).
Calcium activation
Upon the addition of Ca2 , both CaM and CnB are activated (even without CaM, CnB
confers some activation on CnA). The activation apparently disrupts the interaction
PANA GIOTIS MANOLOPO ULOS 22

CHAPTER 1
INThOD UCTION
between CaM and the CnB-binding helix on CnA, moving the AID away from its
inhibitory position (Barford, 1996).
Calmodulin (Cai%'f) binding
CaM and CnB apparently activate CnA by different but complimentary mechanisms..
In the Kissinger structure, CaM binds with the two domains on opposite sides of the
helix but is very difficult to define the link to the CnA molecule (Http://attila.stevens -
tech.edu/chebio/miipping/structword.htm#references).
Figure 1.12 Calmodulin ribbon structure (as cited in Http://attila.stevens-
tech.edulchebio/mjipping/structword.htm#references).
CnB-binding
The CnB-binding site on CnA is a long 22-residue a-helix. In 1995, Watanabe, et al.,
identified that CnB binds to CnA very differently from how CaM binds, even though
they are very similar. The Kissinger structure of the human Calcineurip structure has
an additional CM amino-terminal sequence that assists in CnB-binding (Kissinger et
al., 1995). While there seems to be some conformational change in CnA upon the
binding of CnB, it is not clear how the information is transmitted to the active site on
the CnA subunit.
PA NA GIO TIS MANOLOPOUL OS 23

CHAPTER 1 INTRODUCTION
1.6 Transcription factors of the NFAT family: Regulation and function
1.6.1 Introduction to the role of NFAT
Transcription factors play a major role in tissue development and maintenance by
regulating the expression of genes required for cell function. In skeletal muscle cells,
the best-studied transcription factors are the myocyte enhancer factor 2 (MEF2), the
nuclear factor of activated T cells (NFAT) family and the muscle regulatory factor
(MRF), which are among other things involved in muscle differentiation.
Proteins that comprise the family of transcription factors known as nuclear factor of
activated I cells play an essential role in inducible gene expression during immune
responses (Rao, Luo and Hogan, 1997). Although first identified in T cells, these
proteins have also been detected in many other tissues and cell types, like skeletal
muscle. Calcium mobilization as well as receptor stimulation result in activation of
many intracellular enzymes including, the pathway that involves the calcium and
calmodulin dependent phosphatase calcineurin. As mentioned before, this is a very
important upstream regulator of NFAT proteins (Weiss and Littman, 1994; Cantrell,
1996). Different cell types when stimulated have been shown to elicit transcription of
activation-associated genes, many of which are potential targets of NFAT; the genes
encode transcription factors, signalling proteins, cytokines, cell surface receptors, and
other effector proteins (Crabtree, 1989; Kelly and Siebenlist, 1995; Cockerill et al.,
1995; Rao, Luo and Hogan, 1997).
Calcineurin controls the translocation of NFAT proteins from the cytoplasm to the
nucleus of activated cells by interacting with an N-terminal regulatory domain
conversed in the NFAT family (Rao, Luo and Hogan, 1997). Rao, Luo and Hogan
(1997), suggest that the DNA- binding domains of NFAT proteins resemble those of
PANAGIOTISMANOLOPOULOS 24

CHA PTER / JW1'RODUCTION
Rel- family proteins, and Rel and NFAT proteins show some overlap in their ability to
bind to certain regulatory elements in cytokine genes. In addition, NFAT is also
notable for its ability to bind cooperatively with transcription factors of the AP-1
(Fos/Jun) family (Rao, Luo and Hogan, 1997).
1.6.2 Structure and distribution of NFAT proteins
Isolation and Nomenclature
The studies from several laboratories indicated that NFAT is a mixture of proteins
belonging to a novel family of transcription factors [reviewed in Crabtree and
Clipstone, 1994; Jam, Lob, and Rao, 1995; Serfling, Avots, and Neuman, 1995; see
Figure 1.13 and Table 1.1].
7AU REGULATOW, UrSA BiNDING TAt • -
Cfl niflthl.9 ,JJultIfltCfltrlOfl
fl;A11 icc 43T Gfl 9107
17Z'] I 054 z UFATU. hm*T7iit 1 •. ía a.
tj921 b rlrgals
C .. NFATIC S
MAW -
42 ice 425
a tlEATè;n 9716
827 - b JJFATcJi
102 Ite - npnla .
NPAT 5 .tUflSStq'
HFAT4 - 42C • -
G PIFAT4a
b NFA1lt,
- jp;.Ta *x44*2ztLte.a
x I4FAI
Figure 1.13 Schematic alignment of NFAT proteins predicted from their eDNAs. For nomenclature, see table 1.1. The region of highest homology within NFAT proteins is the DNA-binding domain (DBD), which shows similarity to the Ret homology region of Ret-family transcription factors. A second region of homology is the NFAT homology region (NI-IR), which binds to calcineiuin (Cn) and is found only in NFAT family proteins. The N- and C-tenninal transactivation domains (TADs) are indicated. The acidic/hydrophobic motifs in the N-tenninal TAOs are schematised as a dot. The C-terminal motif present is indicated as a thick bar. For protein isoforms, identical shading patterns
PA NA GIOTIS MA NOLOPO ULOS 25

cJL4nER / WJ'RODUCTION
represent identical sequences. The boundary of each region is labelled above the sequences with numbering referring to position in the human protein. (as cited in Rao, Luo and Hogan, 1997; For more information: Ensembi: http://www.ensembl.org ; NCBI: http://www.ncbi.nlmnihgov ; UCSC http://enomecseucsc.edu ).
Table 1.1 Proposed nomenclamre for NFAT family proteins and chromosomal location of the genes (as cited in Rao, Luo and Hogan, 1997).
Proposed Nomenclature Chromosomal location Chromosonwi location Current Human Mouse
NFAT1 20q13.1-13.31 (Li et ? (Li et aL, 1995; Luo al., 1995; Luo et at, etat, 1996b) 1996b)
NFATIa NFATp (McCaffrey et al., 1993), NFAc2(Li et al., 1995), NFATIA(Luo et at, 1996a)
NFATIb NFATIb (Luo et at, 1996a)
NFAT1c NFATIc (Luo et at, 1996a)
NFAT2 18q23-qter" (Li et at, 18E4(Lietat, 1995) 1995
NFAT2a NFATc (Northrop ci al., 1994), NFATcI (Li et at, 1995), NFATc.a (Park, Takeuchi, and Sharma, 1996)
NFAT2b NFATc4 (Hoey et at, 1995)
NFAT3 NFAT3 NFAT3 (Hoey ci at,
1995) NFAT4 16q21-22 (Masuda ci 81)(Hoetal., 1995)
al., 1995) NFAT4x NFATx (Masuda et al.,
1995), NFATc3 (Ho ci ____________________ at, 1995)
NFAT4a, b, c NFATa,b,c (Hoey ci at, 1995)
lbe Mat locus maps between Ada and Gnas (expressed as genetic distance in centiMorgans): centromere-Ada-3.1-(Nfatl, Cebpb)-4.8- Gnas (184) "The human NFAT2 gene is closely linked to STS marker D18S497 (183) NOTE: NFAT = preexisting I NFATC = cytoplasmic NOTE: For more information: Ensembl: http://www.ensembl.org ; NCBI: htty:/Iwww.ncbi.nlm.nih.gov ; UCSC http://genomecse.ucsc.edu ).
It must be noted that NEAT is used as a general abbreviation, which stands for the
NFAT family proteins as well as NEAT containing complexes. The first member of
PANA GJOTISMANOLOPOULOS 26

CHAPTER 1 JNThODUCTION
the family (NFATp, later renamed NFAT1) was purified from cytoplasmic extracts of
a murine IL-2 promoter (Jain et al., 1993; McCaffity et al., 1993) and cloned from
murine (Ar-5) and human (Jurkat) T cell eDNA libraries (McCaffrey et al., 1993; Luo
et al., 1996; Rao, Luo and Hogan, 1997). A Uniing nomenclature for NFAT
proteins is proposed in Figure 1.18 and Table 1, which also list the chromosomal
location of the NFAT genes (For more information: Ensembl:http://www.ensembl.org
NCBI:http://www.ncbi.nlm.nih.go ; UCSC:http:f/genome.cse.ucsc.edu ). Rao, Luo
and Hogan (1997) have suggested the present complicated nomenclature from the
isolation, in different laboratories, of multiple isoforms and species variants of the
same protein; and from the fact that the names NFATp (preexisting) and NFATc
(Cytoplasmic), which were originally used to describe NFAT DNA binding activity,
were carried over to the recombinant proteins (Rao, Luo and Hogan, 1997).
Sequence Homologies, Functional Domains
Members of the NFAT family are divided according to primary structure homology
into four subgroups: NFATI (1& IB, and 1C), NFAT2 (NFATc.a and NFATc.b),
NFAT3, and NFAT4 (4a, 4b, 4c, and NFATx). NFAT proteins vary in size from
NFAT4a (708 amino acid residues) to NFATx (1075 amino acid residues) (Rao, Luo
and Hogan, 1997). Two major regions of homology exist among these subgroups: the
DNA-binding domain (DBD) and the NFAT homology region (NHR). The DBD is
positioned within amino acid residues —400 and —700 in the known isoforms of NFAT
and shows some similarity to the DBD of Rel-family transcription factors (Figure
1.14) (Rao, Luo and Hogan, 1997).
PA NA GIOTIS MA NOLOPOULOS 27

CHAPTER 1 INTRODUCTION
/\ RAH:VE1tG
Splicing Variants Isofonns
Figure 1.14: Schematic diagnm of the primary structure of the NFATI protein, as deduced from analysis of cDNA clones. The region of highest homology within NFAT proteins is the DNA-binding domain (DBD), which shows similarity to the Rel homology region of Ret-family transcription factors, and encodes the amino acids that contact DNA. Other regions such as transactivation domain (FAD), NFAT homology region (N}IR), and splicing vathnis isoforms are indicated (Source: Memorias do Instiluto Oswaldo Cnn-on line: http://iris.dbbm.fiocruz.br/www-memJindex.htm I).
The NHR is about 300 amino acid residues in length and is located N-terminal to the
DBD. Although the DBD sequences of different isoforms of NFAT proteins have
distinct affinities, they bind to a consensus sequence of T(A)GQAAANT(AIC) (Chin
et al., 1998; Rao, Luo and Hogan, 1997; Fiering et al., 1990). This site is present in
many genes involved in immune responses, including interleukin-2 (IL-2), IL-4, IL-5,
granular macrophage colony-stimulating factor (GM-CSF), WN-g, and IL-13 (Rao,
Luo and Hogan, 1997). In many cases, for DNA binding and transactivation, NFAT
proteins cooperate with AP-1, which binds c-Jun/fos dimers. Complexes formed from
cooperative binding of NFAT proteins, AP-1, and DNA are significantly more stable
than complexes of NFAT and DNA alone (1-Ioey et al., 1995; Ho et al., 1995).
In resting cells, NFAT proteins are phosphorylated and reside in the cytoplasm.
Stimuli that increase calcium mobilization result in the activation of NFAT proteins.
The rapid dephosphorylation and translocation of NFAT proteins to the nucleus
characterize activation; upon translocation, the dephosphorylated proteins show
higher affinity for DNA. CsA or FK506 can block each step in the activation of
PANA GIOTIS MANOLOPO ULOS 28

CHIt PIER 1 INTRODUCTION
NFAT proteins (Chin et at., 1998; Hemenway and Heitman, 1999; Rusnak and Mertz,
2000). Therefore, NFAT activation follows precisely the activation of calcineurin by
increased free calcium levels in the cytoplasm (Ruff et al., 1995; Loh et al., 1996).
Researchers from diverse fields are interested in the NFAT family of transcription
factors, which are potential targets for newer and safer immunosuppressive drugs
(Rao, Luo and Hogan, 1997). In addition, the activation of NFAT proteins involves
various cellular signal transduction pathways, including calcium mobilization and
MAP kinase pathways linked to T-cell receptors and Ras (Rao, Luo and Hogan,
1997).
Tissue Distribution, potential Target Genes
Despite their name, NFAT proteins are expressed not only in T cells, but also in other
classes of immune and non-immune cells. At the protein level, NFATI and NFAT2
are expressed in peripheral T cells and T cell lines, and NFATI is also expressed in B
cells, mast cells, NK cells, monocytes and macrophages (Ho et al. 1994, Aramburu et
al. 1995, Ruff & Leach 1995, Wang et al. 1995, Weiss et al. 1996). Moreover,
NFATI is expressed in a neuronal cell line and in the nervous system (Ho et al. 1994),
and an endothelial cell line (Cockerill et al. 1995, Wang et al. 1995). NFATI and
NFAT2 mRNAs are expressed in peripheral lymphoid tissue (spleen), and NFAT2
mRNA is upregulated in activated T cells and NK cells (Northrop et al. 1994,
Aramburu et al. 1995, Hoey et al. 1995, Masuda et al. 1995, Park et al. 1996). NFAT4
mRNA is expressed at high levels in the thymus (Hoey et al. 1995, Ho et al. 1995,
Masuda et al. 1995), and NFAT3 is expressed at low levels in lymphoid tissues (Hoey
etal. 1995).
The transcript sizes and reported sites of expression of NFAT mRNAs are listed in
Table 1.2, following, where the information were taken from its complete version in
PA NA GJOTJS MA NOLOPO ULOS 29

CHAPTER /
INTRODUCTION
Rao, Luo and Hogan, 1997 publication (all the tissues are listed were NFAT family
members have been identified by different laboratories as well as the techniques
used). Furthermore, it is indicated that a correlation with protein isoforms has only
been done in the case of NFAT2a and NFAT2b. Likely, after analysing NFAT1 it was
shown that protein and mRNA expression do not always correlate, although NFAT 1
mRNA has been variably detected in brain, heart and skeletal muscle, NFAT1 protein
expression has not been detected in circulating lymphocytes or resident mast cells
(Wang, McCaflIey, and Rao, 1995; Ruff and Leach, 1995). As illustrated in Table
1.2, mRNA of NFAT1, NFAT2a, NFAT2b, and NFAT4 have been identified in
muscle, while just NFATI and NFAT3 were found in the heart (Rao, Luo, and Hogan,
1997).
Table 1.2 Tissue distributions of NFAT family members
Tissue distribution Tissue distribution Member mRNA size mRNA Protein NFATI 8 kb (h,m) Thymus, spleen, bean, Thyinus, spleen and
brain (Northrop et al., many others but not 1994), muscle (Hoey ci present in cardiac or al., 1995) skeletal muscle
NFAT2a 2.7 kb (Ii) Thymus, spleen, T cell, mast cells, not (NFATc.a) muscle (Hoey et aL, detected in NK cell, not
1995; Masuda et al., determined in other 1995) tissues
NFAT2b 4.5 kb (h) Thymus, colon, spleen, Not determined (NFATcj) muscle (!-loey et aL,
1995; Masuda et aL, 1995)
NFAT3 3 kb (h) Placenta, kidney, Not determined 45 kb (h) Heart, colon, Not determined 4.7kb (h) Low in brain, spleen, Not determined
thymus Hoey et al., 1995)
NFAT4 7.0 kb (h) Thymus, spleen, Not determined kidney, muscle (Hoey ei aL, 1995; Masuda et al., 1995; Ho et aJ., 1995)
Abbreviations: h, human; m, mouse
(Source: Rim, Luo, and Hogan, 1997)
PA NA GIOTIS MA NOLOPO ULOS 30

CUI4PTER I INTRODUCTION
1.6.3 Regulation of NFAT activation
NFAT transcription factors are cytosolic proteins constitutively expressed in resting
cells (R.ao et al. 1997). NFAT proteins are activated by stimulation of receptors
coupled to calcium mobilization, such as the antigen receptors on T and B cells
(Yaseen et al. 1993, Choi et al. 1994, Crabtree & Clipstone 1994, Venkataraman etal.
1994, Jain et al. 1995, Serfling et al. 1995, Loh et al. 1996b), Fce receptors on mast
cells and basophils (Hutchinson & McCloskey 1995, Prieschl et al. 1995, Weiss et al.
1996), the Fcg receptors on macrophages and NK cells (Aramburu et al. 1995), and
receptors coupled to heterotrimeric G proteins (Desai et al. 1990, Wu et al. 1995, Boss
et al. 1996). Three different steps of activation have been defined for NFAT proteins:
dephosphorylation, nuclear translocation, and DNA binding. In resting cells, NFAT
proteins are phosphorylated and cytoplasmic, and show a low affinity for DNA (Shaw
et al. 1995). Stimuli that trigger calcium mobilization result in rapid
dephosphorylation of NFAT proteins and their trans!ocation to the nucleus, and
dephosphorylated proteins show increased affinity for DNA (Chin et al., 1998; Shaw
et al. 1995, Loh et al. 1996a,b). Receptor stimulation and calcium mobilization result
in activation of the calmodulin-dependent phosphatase calcineurin (Chin et al., 1998;
Weiss & Littman 1994). In the nucleus, NFAT forms complexes with the AP-1 family
members, the MEF2 family as well as other transcription factors, leading to
transcriptional activation (Chin et al., 1998; Karen et. al., 1998). The calcineurin
inhibitors CsA or FK506 can block each step of NFAT activation, suggesting that
calcineurin is a major upstream regulator of NFAT proteins, and that
dephosphorylation is the initial step of NFAT activation (Chin et al., 1998;
1-lemenway and Heitman, 1999; Rusnak and Mertz, 2000).
PA NA (JIOTIS MA NOLOPOULOS 31

CHA PTER 1 INTRODUCTION
In lymphocytes, the general role of NFAT proteins in the induction of early gene
expression in response to antigen receptor engagement is well defined (Rao et al.,
1997). On the other hand, the involvement of NFAT in gene expression has been
shown in other tissues like skeletal muscle, where NFAT proteins are expressed at all
three stages of myogenesis: myoblasts, nascent and mature myotubes (Karen et. al.,
1998). Moreover, different developmental stages of muscle may differ to the degree to
which either intracellular calcium or AP-1 can be elevated. In addition, it has been
shown that NFAT 4/x/c3 is the only isoform in high-density myoblasts as well as in
the heart that undergoes nuclear translocation in response to an intracellular calcium
stimulus (Ruwhof and Van der Laarse, 2000). Karen and co-workers (1998) have
suggested that in lymphocytes each isoform undergoes nuclear translocation with the
same kinetics in response to a given stimulus. In contrast, in skeletal muscle cells each
isoform undergoes nuclear translocation only at specific stages of myogenesis. The
ability of individual NFAT isoforms to undergo calcium-induced nuclear
translocation at only specific stages of myogenesis suggests that individual NFAT
isoforms may regulate distinct subsets of genes necessary for muscle cell physiology
(Karen et. al., 1998) (see Table 1.3).
Table 1.3. Each NFAT isoform undergoes nuclear iraslocation at specific stages of muscle differentiation (as cited in Karen ci at, 1998).
Stage of myogenesis Stage of myogenesis Stage of myogenesis NFAT isoform Myoblast? Myotubes (nascent) t' Myotubes (mature)° C (+)t
Nuclear selectivity (+)
Nuclear selectivity P (-) (+)
All_nuclei (-)
41x/c3 (+) (-) (-) - 80-9VYo contluent. b 24h in FM (fusion medium). c758ohthFM d indicates lack of calcium- dependent nuclear translocation.
(+) indicates occunence of calcium- dependent nuclear tianslocation.
PANA GIOTIS MANOLOPO ULOS 32

CHAPTER 1 INTRODUCTION
This fact also suggests specificity in the activation of NFAT beyond just that
amplitude and the duration of changes in intracellular calcium (Dolmetsch et. al.,
1997). This specificity may occur in the level of NFAT dephosphorylation by
calcineurin (Chow et al., 1997), and possibly individual isoforms of NFAT exist in
different subcellular compartments that differ in accessibility to calcium (Thomas et
al., 1996) or downstream effectors.
1.6.4 DNA binding and transactivation
The nerves innervating slow muscles are characterised by a tonic motor activity,
which achieves sustained [Ca2 ']1 levels and activates the calcineurin pathway.
Calcineurin dephosphorylates NFAT, which in turn binds to DNA in conjunction with
other transcription factors like MEF2. Chin et al. (1998) suggest that the binding sites,
where NFAT and other transcription factors bind DNA, are clustered in promoter-
enhancer regions controlling transcription of genes encoding proteins of the slow fiber
program (Chin et al., 1998) (Figure 1.5).
CAGG conserved CCAC MEfl sequence element consensus E-box
SURE FIRE
21 bp - (unique to FIRE)
Figure 1.15 NFAT consensus binding sequences, which are present in tnnscriptional control regions. which Chin et al. (1998) have shown to direct tnnscription selectivity in slow-oxidative myofibers. Conserved sequence blocks [CAGG, CCAC, MEF2, and E box] common in rat skeletal muscle genes are presented (as cited in Chin et al., 1998). SURE: Slow Upstream Regulatory Element; FIRE: Fast Intronic Regulatoiy Element
PA NA Gb TIS MA NOLOPOULOS 33

CHAPTER 1 INTRODUCTION
In addition, it has been shown that a continuous active calcineurin selectively
transactivates promoters from two genes that are expressed preferably in slow genes
(Chin et al., 1998). The DNA-binding domains of NFAT proteins are likely to be
similar in three-dimensional structure to the DNA-binding domains of Rel-family
proteins, and to utilize corresponding loops to make some of their contacts with DNA
(Jain et. al., 1995; Nolan, 1994; Chityl and Verdine, 1996). The minimal
DNA-binding domain (-190 amino acids) of NFATI (Jain et. al., 1995) corresponds
almost exactly to the N-terminal specificity domain of NF-KB p50, which makes the
majority of base-specific contacts with DNA (Muller et. al., 1995; Ghosh et. al.,
1995). NFAT proteins are monomeric in solution and when bound to DNA, whereas
Rel proteins are dimeric (Hoey et. al., 1995). NFAT proteins can also bind to certain
icB-like sites (Chityl and Verdine, 1996). The monomeric nature of NFAT proteins
explains why the minimal DNA binding fragment of NFATI, which lacks the region
corresponding to the C-terminal dimerization domain of Rel proteins, can bind
independently to DNA (Jain et. al., 1995). In addition, it has been shown that all four
of the NFAT family proteins are able to bind to IL-2 promoter NFAT site, after
binding the AP-1 proteins (Hoey et. al., 1995; Masuda et. al., 1995; Park, Takeuchi,
and Sharma, 1996).
Luo and colleagues, in their 1996 publication suggest that both the N- and C-terminal
regions of NFAT contain transcriptional activation domains. Moreover, NFAT
proteins have been shown to bind to sites that are, or resemble, binding sites of the
Rel family proteins. In addition, sites in which the GGAAA core sequence is preceded
by a T rather than an A appear to bind NFAT proteins more strongly (Rao, Luo, and
Hogan, 1997). The general DNA binding sequence of the NFAT family proteins as
derives for all the findings so far is T(A)GGAAAA(N)T(AIC)N (where N= A/TIGIC)
PA NA C/OTiS MA NOLOPO ULOS 34

CHAPTER 1 INTRODUCTION
(Chin et al., 1998; Rao, Luo, and Hogan, 1997). Finally, an important feature of
NFAT- dependent promoters and enhancers is the presence of multiple NFAT binding
sites. Each of these regulatory regions contains three to five sites for NFAT binding,
within a total length of 200 to 300 base pairs (Rao, Luo, and Hogan, 1997). It is so
hypothesised that the implication is that higher-order, synergic interactions among
NFAT- containing complexes are required for effective transcription (Rao, Luo, and
Hogan, 1997).
Finally, Chin and co-workers (1998) in their study have suggested that DNA binding
of NFAT is insufficient to cause signal transduction via the calcineurin pathway.
NFAT transcription factors require collaboration with MEF2 and/or other
transcription factors in order to cause fast-to-slow differentiation.
1.7 Inhibition of Calcineurin by Cyclosporin A (and FK506)
A number of natural products have been isolated that are potent inhibitors of
calcineurin as well as the other serine /threonine protein phosphatases. The best-
known inhibitors are the immunosuppressant drugs Cyclosporin A (C5A) and FK506
(Figure 1.16), which inhibit calcineurin when complexed with their respective
cytoplasmic receptors cyclophilin and FKBP (Figure 1.17).
Cyclosporin A FK506
Figure 1.16. Natuml product inhibitors of calcineurin, the inununossupressant drugs CM and FK506 (as cited in Rusnak and Mertz, 2000).
PANAGIOTISMANOLOPOULOS 35

CHAPTER 1
INTRODUCTION
C
Figure 1.17. Immunophilin- immunosuppivssant complexes inhibit calcineurin. The natural products CsA and FK506 associate with highly conserved intracellular binding proteins, the immunophilins cyclophilin A and FKEP 12, to form the active protein- drug complexes that bind to and inhibit the protein phosphatase calcineurin. Calcineurin is a heterodimer composed of catalytic (A), regulatory (B), and calmodulin (CAM) subunits. The cyclophilin A-CsA and FKBPI2- FK506 complexes bind to a groove between the calcineurin A and B subunits (as cited in Hemenway and Heitman, 1999)
Moreover, cyclophilin A and FKBPI2 have similar structural features, while
Cyclosporin A (CsA) and FK506 are very different compounds when it comes to
structure (Figure 1.16). In each case, drug binding occurs within the hydrophobic
catalytic site (Hemenway and Heitman, 1999). Despite these dissimilarities between
the immunophilins and the immunosuppressants, the resulting complexes cyclophilin
A-CsA and FKBPI2-FK506 may share some common features (Hemenway and
Heitman, 1999). The FKBPI2-FK506 complex neither blocks nor induces an
observable conformation change in the active site. Kissinger et al. (1995) have
presented evidence that FKBPI2- FK506 inhibits calcineurin in a classical non-
competitive fashion. This has been shown to be the case for cyclophilin A-CsA
inhibition as well (Etzkorn et al., 1994).
In understanding the regulation mechanism for Calcineurin, the cyclophilin-
cyclosporin A(CyP-CsA) -binding site is very important. It appears to be the same
binding site for binding of FKBPI2-FK5Oo (Liu et al., 1992) and the site for binding
PANA GIOTISMANOLOPOULOS 36
CHAPTER 1 INTRODUCTION
of AKAP79 (Crabtree, 2000). All three exhibit classical non-competitive inhibition,
suggesting a common mechanism. The suggested Calcineurin-binding domain on
AKAP79 is has high sequence similarity to residues 3247 of FKBPI2. It has also
been found that a 22-residue peptide encompassing this FKBP12 sequence inhibits
Calcineurin by other than steric hindrance (Kawamura, 1995).
Wei and Lee (1997) recently showed that mutagenesis of the L7 loop connecting 0-
strands 12 and 13 has significant effects on activity. Both modification of the Li loop
and truncation of the C-terminus lead to the activation of Calcineurin. They also
determined that the effects of mutation of the L7 loop are separable from the effects
of deletion of the AID. It is thought that CnA exists in a conformationally restrained
state that is not completely relaxed by CnB and CaM. It has double inhibition to
ensure that it only acts when needed (Wei and Lee, 1997).
In recent years, five different classes of calcineurin inhibitors have been discovered;
each of these (Table 1.4) inhibits calcineurin by binding to the protein inhibiting its
ability to dephosphorylate substrates, like NFAT (in skeletal muscle and other
tissues), preventing their nuclear localization.
Table 1.4. Cellular inhibitors of calcineurin function (as cited in Crabtree, 2000)
Protein Function Kd nM or References
KI nM
AKAP79 Scaffolding protein, Inhibits NFAT 100-200 51
function
Cain/ cabin Implicated in T cell activation and 440 46,47
exocytosis in neurons Inhibits NFAT
function
CLIP Similar to CnB, Prevents nuclear 4000 49
translocation of NFATc 1
DSCRI May be involved in Down's Syndrome. 70 nM 43,52,53
(MCIPI) Prevents nuclear translocation of
PA NA GIOTIS MA NOLOPO ULOS 37

CHAPTER 1 INTRODUCTION
NFATc Proteins
DSCR2 N.D. N.D. 52,53
(MCJP2)
ZAK4 Prevents nuclear translocation of N.D. 43,54 (DSCR3) NFATcI
rcnlp/CBPI Related to DSCR1, mutants are action 6,500* 44,45
sensitivity and defective for crzy/tcn (peptide)
function. 7,000
(protein**)
A23SL Blocks NFATc translocation; viral N.D. 50
encoded
This measurement was made with a synthetic peptide derived from rcnlp/CBPI and the Ki for the full-length protein might be much lower. **Kyle Cunningham, personal communication with Crabtree, G.R. Stanford University, California.
DSCR1 gene and its relatives (DSCR2 and ZAK14) are thought to be the most
important calcineurin inhibitors of the above (Rothermel et al., 2000). DSCR1 is the
Down's syndrome Critical Region 1 gene and is located on chromosome 21. As it is
well known a trisomy, which causes the Syndrome, results in the over expression
DSCRI, which in turn effects the development of the brain, immune system, heart and
skeleton. Moreover, the CHP proteins seem to compete with CnB for binding to the A
protein, while Cabin is a non-competitive inhibitor of calcineurin phosphatase
activity. The A238L protein encoded by a virus (African Swine Fever virus) binds
tightly to calcineurin and blocks NFATe translocation. The final inhibitor is AKAP79
protein, was the first calcineurin inhibitor found, bind both calcineurin and PICA and
may anchor calcineurin at specific sites that allow the protein to engage the proper
substrates when activated.
PA NA GIOTIS M4NOLOPO UL OS 38

CHAPTER 1 INTRODUCTION
1.8 Muscle fibre differentiation induced by Calcineurin- the role of calcium
Calcium signalling plays a very important role in heart and skeletal muscle
hypertrophy in response to mechanical load and a variety of intrinsic and extrinsic
stimuli. These calcium alterations have been shown to cause long-term changes in
muscle gene expression, apart from hypertrophy, but the exact mechanism is yet to be
clarified. As mentioned before calcineurin is though to be the key molecule involved
in the control of gene expression (Chin et al., 1998). As shown in 1996 by Mayne and
co-workers, calcineurin controls the contractile and metabolic properties of a skeletal
muscle by activating the Ca2tdependent slow muscle fibre gene program
(Figurel .18; as cited in Chin and co-workers in1998).
Figure 1.18. Calcineurin dependent gene regulation in skeletal muscle. CnB, CnA Calcineurin B and A. NFAT Nuclear factor of activated T-cells. MEF2 Myocyte enhancer factor 2. SR Sarcoplasmic reticulum (Chin et at, 1998).
Fibre-type specific programs of gene expression can be detected at early stages of
myogenic development in the embryo (DiMario et al., 1993; Ontell et al., 1993;
Stockdale, 1997). On the other hand, they are thought to remain plastic in adults, and
are shown to be controlled by contractile load, hormonal shifts and systemic diseases
PANAGIOTISM4NOLOPOULOS 39

CHAPTER 1 JWTRODUCTION
(Holloszy and Coyle, 1984; Massie et al., 1998; lanuzzo et al., Sabbah et al., 1993;
Williams and Neufer, 1996).
Skeletal myofibers are known for their specialized characteristics when it comes to
size, metabolic activity and contractile function. The slow-twitch (Type 1) muscles
have as their main fbnction the maintenance of posture, balance and opposition to
gravity forces. They are also rich in mitochondria and enzymes of oxidative
metabolism. Moreover, slow myofibers have been shown to express specialized forms
of myosin and other sarcomeric proteins that convert chemical energy into contractile
work (Olson and Williams, 2000; Chin et al., 1998). On the other hand, Fast- twitch
muscles function concentrates in powerful bursts of contractile work, hence
generation of movement. Fast myofibers express different sarcomeric proteins, form
those of the slow-fibers, and are known to generate force rapidly. They are enriched in
enzymes of glycolysis and are not energy efficient (Type Hb). Type ila fibers are Fast
fibers of a different subset that resemble type I fibers with respect to high expression
of proteins of oxidative metabolism (such as myoglobin and mitochondrial enzymes
of oxidative phosphorylation) (Olson and Williams, 2000).
An increase in the intracellular calcium ion concentration has been shown to control a
wide range of cell fbnction like motility, adhesion, gene expression and proliferation
(Ghosh and Greeberg, 1995; Berridge, 1993). Chin et al., in 1998, have shown that
activation of calcineurin in skeletal myocytes selectively up-regulates slow-fibre-
specific gene promoters, while inhibition of this pathway by CsA promotes slow to
fast fiber transformation.
Studies have shown that the calcineurin-NFAT pathway is not sensitive to transient,
high-amplitude oscillations in [Ca2 ]i. On the other hand, calcineurin-NFAT pathway
responds perfectly to sustained, low-amplitude elevations of [Ca 2 ]i (Timmerman et
PA NA Gb TIS MA NOLOPO ULOS 40

CHAPTER 1 INTRODUCTION
al., 1996; Doimetsch et al., 1997). This suggests that calcineurin pathway has the
ability to distinguish and discriminate between different patterns in the amplitude and
duration of changes in [Ca 2 ']i, and influence in proportion fibre type specific gene
expression (Figure 1.19).
— — — -a" ftc1 ___ cc.2
I r ineurw wtivttv
,
L CYCWqmdn A
slowfiber fastilber
Figure 1.19. Model for a calcineurin-dependent pathway linking specific patterns of motor nerve activity to distinct programs of gene expression that establish phenotypic differences between slow and fast myofibers. MR172 is shown to represent the requirement for collaboration between activated NFAT proteins and muscle-restricted transcription flictors in slow-fiber-specific gene transcription, but other proteins (not shown) also are likely to participate (as cited in Chin et al., 1998).
Tonic motor nerve activity at 10-15 Hz is a characteristic of slow- twitch fibers
(Hennig and Lomo, 1985). Chin and Mien (1996) have provided information
suggesting that this nerve activity leads to a sustained elevation of [Ca 2ii within a
concentration range between 100 and 300 nM (Chin and Mien 1996). This pattern is
thought to activate the Calcineurin pathway (Chin et al., 1998). On the other hand,
Westerbiad and Allen (1991) have shown that in fast myofibers intracellular calcium
resting levels are maintained at 50 nM (Westerbiad and Allen 1991). A high
amplitude (1 pM) of calcium has been suggested to be insufficient duration to evoke
calcineurin-stimulated signalling (Chin et al., 1998).
PA/VA GIOTIS MANOLOPOULOS 41

CHAPTER 1 INTRODUCTION
Moreover, it has been shown that at single fiber level, as well as in skeletal muscle
tissue, chronic stimulation can alter mitochondrial composition, cause myosin heavy
chain changes towards the slow phenotype (Wehrle, Düsterhôft, and Pette, 1994), and
enzyme metabolism changes (Chi et al., 1986; Henriksson et al., 1986). After the
change to a slow phenotype, caused by chronic stimulation, all the fibers resemble
slow fibers in terms of histochemical classification, fatigue and contraction time
patterns (Mayne et al., 1996; Jarvis et al., 1996; Dirk, 1984).
Calcium evoked changes in cultured muscle cell line (IL 6 myotubes)
Motor neuron activity is known to cause sarcolemmal depolarisation and transient
increases in cytosolic Ca 2 , which in turn leads to muscle contraction through actin
and myosin interactions. The cytosolic Ca 2 concentration varies from <100 nM in
resting muscle to about 1-2 p.M in contracting muscle fibers (Allen, Lee, and
Westerblad, 1989; Westerblad and Allen, 1991). The primary source of calcium in the
muscle cells is the sarcoplasmic reticulum (SR) (Robert et al., 1998; Vander et al.,
1994). It is now well known that after each contraction calcium goes back to the SR.,
through an active re-uptake mechanism, which involves a Ca 2t ATPase pump located
in the SR membrane. The role of Ca2 in mediating contraction has been well studied,
in contrast with its role in skeletal muscle gene regulation (Huang et al., 1994; Shin et
al., 1997). Ginty (1997) presented data implying that cytosolic calcium fluctuations
are involved in the alteration of gene expression in different cell types through several
mechanisms (Ginty, 1997).
Calcium is additionally thought to play a crucial role in development and cell
differentiation in the neuromuscular system. The process of myoblast fusion during
skeletal myogenesis is calcium regulated (Seigneurin-Venin et al., 1996). In addition,
PANA GIOTIS MANOLOPO ULOS 42

CHAPTER 1 INTRODUCTION
both dihydropyridine receptor and ryanodine receptor are already present on muscle
precursors, at the perflsional stage, before they are required for excitation-contraction
coupling (Seigneurin-Venin et al., 1996). Moreover, it is thought that the gap junction
formation (Rash and Fambrough, 1972; Balogh, Naus, and Merrifield, 1993) is likely
to be involved in the synchronization and metabolic coupling of myoblasts during the
fusion process (Mege et al., 1994). Likely, transmembrane Ca 2 flux, controls the
conversion to the multinucleate state, since fUsion is stimulated by the Ca 2 ionophore
A23 187 (David, See and Higginbotham, 1981) and inhibited by D600 (Entwistle et
al., 1988), an L-type Ca 2 channel antagonist. The L-type Ca 2 channel is a complex
of five subunits (al, a2, 3, y, 5) of which thea! subunit contains the binding sites for
dihydropyridine (DHP-receptor, DHPR) and other Ca 2 channel modulating drugs
(Seigneurin-Venin et al., 1996).
In adult skeletal muscle, the DHPR is mainly localized in the transverse tubular
system (T-tubules). There it mediates the long-lasting Ca 2 current and also serves as
the voltage sensor for excitation-contraction coupling (Fosset et al., 1983; Romey et
al., 1989; Catterall, 1991). Other findings suggest that at these junctions mentioned,
the DHPR associates with the Ca 2 release channel of the sarcoplasmic reticulum
(ryanodine receptor, RyR) to form an electron-dense structure called the foot of the
triad (Franzini-Amstrong, 1970; Marty et al., 1994). However, Seigneurin-Venin et al.
(1996) in their study mention that in addition to being present in adult muscle, both
the DFIPR and the RyR are expressed throughout myotube fUsion and consequently
before any excitation-contraction coupling takes place (Fosset et al., 1983; Airey,
Baring, and Sutko, 1991; Kyselovic et al., 1994; Seigneurin-Venin et al., 1996).
Differentiation of skeletal muscle cells is known to be associated with glycosylation
events as shown in Sato and Miyagi publication, in 1996. As mentioned before, the
PAP/A GIOTISMANOLOPOULOS 43

CfL4 PiER 1 INTRODUCTION
L6 cells are produced from myoblasts (satellite cells). These were obtained from the
skeletal muscle of a rat, which was one day old at sacrifice (Yaffe and Fachs, 1967).
A reduction of the fetal bovine serum (FBS) in the a-MEM used for culturing, from
10% to 2% caused the cells to undergo differentiation and fuse into myotubes (Sato
and Miyagi, 1996). The maturation of the myotubes can be detected by the
multinuclei cell formations, by activating factors such as MyoDi and myogenin
(Specific for skeletal muscle) (Sato and Miyagi, 1996), and by specific proteins
expressed in skeletal muscle, such as actin and myosin heavy chain, and Creatine
kinase (Friday, Horley, and Parlath, 2000; Incerpi et al., 1995; Seigneurin-Venin et
al., 1996).
There is strong evidence suggesting that the muscle regulatory factor family (Myf-5,
Myo-D, myogenin, MRF4) of transcription factors is involved in regulating
myogenesis. In addition, it has been shown that they are regulated by phosphorylation
and could therefore be potential targets for phosphatase activity of calcineurin
(Friday, Honey, and Parlath, 2000).
The first part of this study involves the investigation of the role of Ca 2 in skeletal
muscle gene regulation. This type of research has limitations when it comes to
manipulating intramuscular Ca 2 concentrations in vivo independently of muscle
contraction. For this reason, the second part of the study was performed on a cultured
muscle cell line, L6 myotubes (Osawa, Printz, and (iranner, 1993). Apart from the
'advantage' this tissue model has; there is strong evidence suggesting that, when these
L6 cells are at the myotube state, they resemble with mature skeletal muscles, since
they have similar morphological, metabolic, and biochemical characteristics (Yaffe
and Fachs, 1967; Klip et aL, 1984).
PA NA 0/OTIS MANOL OPOULOS 44

CHAPTER I INTRODUCTION
1.9 Other transcription factors and calcium induced pathways involved in
muscle fibre plasticity
There is evidence that Myocyte enhancer factor 2 (MEF2) is associated with
calcineurin dependent gene regulation (Chin et al., 1998), and interacts with myogenic
regulatory factors (MRF's: MyoD, Myf-5, myogenin, MIRF4) causing an
amplification of muscle protein expression (Molkentin et al., 1995; Cox et al., 2000).
In addition, MEF2 is also though to interact with several mitogen-activated protein
kinases (MAPK; Bennett and Tonks 1997, Zetser et al., 1999, Cox 2000). Other
interactions of the MEF2 proteins have been reported, like with the class H histone
deacetylases HDAC4 and HDACS, resulting in repression of MEF2-dependent genes.
Calciumlcalmodulin-dependent protein kinase (CaMK) signalling, stimulates
myogenesis, prevents formation of MEF2-HDAC complexes, and induces nuclear
export of HDAC4 and HDAC5 by phosphorylation of these transcriptional repressors
(McKinsey et al., 2000).
In 1997, Dolmetsch and co-workers have shown that the amplitude and the duration
of calcium signals in B lymphocytes controls differential activation of the pro-
inflammatory transcriptional regulators NF-kB, c-Jun. N-terminal kinase (JNK) and
NFAT. Moreover, NF-kB and INK are selectively activated by a large transient
[Ca2 ']1 raise, whereas a low, sustained Ca2+ plateau activates NFAT. Differences in
the Ca2 sensitivities and kinetic behaviour of all three above pathways cause this
differential activation.
Murgia et al., (2000) illustrated that the slow myosin heavy chain protein is induced
by a constituvely active Ras in regenerating muscle. Ras is a mitogen- activated
protein (MAY) kinase kinase, which phosphorylates the extracellular signal regulated
kinase (ERKI,2). ERKs, in turn, translocate into the nucleus where they activate
PANA GIOTISMANOLOPOULOS 45

CHAPTER! INTRODUCTION
transcription factors (Cruzalegui and Bading, 2000), like NFATn (Crabtree, 1999).
Moreover, an increased ERK activity in regenerating and stimulated muscle,
illustrated by Murgia and co-workers in 2000 publication, suggests a physiological
role of Ras/ERK signalling. In 2000, Crabtree suggested that Ca 2 signalling becomes
dependent on coincident Ras/PKC signalling and vice versa. In nearly all cell types
studied, activation of R.ac, Ras or PKC must accompany a Ca 2 signal for activation of
NFAT- dependent transcription (Figure 1.20).
Coincidence Detection and Signal Integration by the NF-AT1 Transcriptional Complex
Receptor 2 Receptor I
\.. Ras. Rac P1CC
-c_
Figure 1.20. Ras or Rae or PKC must be coincident with 2+ / calcineurin signalling to activate NEAT and in turn genes. More that one receptor can activate the above pathways, like in T cells (as cited in Crabtree, 2000).
In addition the movement of NFATc3 into the nucleus is enhanced (rather than
blocked) by the actions of either iNK kinase (Chow et al., 1997) or the combination
of MEKKI and CK1 (Zhu et al., 1998). NFAT is also a substrate for glycogen
synthase kinase (GSK-3) but this has only been reported in lymphoid cells (Beals et
al., 1997). GSK-3 is thought to be a potential export kinase for NFAT family of
proteins. In order to maintain NFAT in the nucleus, the persistent activation of
calcineurin via the CRAC (Capacitance Regulated Activation Channels) is required
(Crabtree, 2000).
PANAGIOTISMANOLOPOULOS 46

CHIt P'TER I
INTRODUCTION
It has been shown that blockade of calcineurin with CsA prevents insulin like growth
factor (TGF-1) induced hypertrophy, suggesting that this type of hypertrophy is
mediated by Calcineurin (Dunn et al., 1999; Semsarian et al., 1999; Musaro et al.,
1999), which seems to be the main pathway involved (Figure 1.26) (Olson and
Williams, 2000; Dunn, Bums, and Michel, 1999).
Activity . Agonists
Other Transducers?
CsA /_
HDAC CaMK Cabin
K Calcthcfl Other
I t LEEI1- H
GATA Other Transducers?
Reprogramming Gene Expression Myocyte Hypertrophy I Tissue Remodeling
Figure 1.21. Ca 2 Signalling Pathways Implicated in Myocyte Remodelling and Hypertrophy (as cited in Olson and Williams 2000 b)
Both calcineurin and its activity-linked upstream signalling elements are crucial for
muscle adaptation to overload (Dunn, Chin, and Michel, 2000). In addition, IGF's are
acting by stimulating expression of L-type Ca 2 channels, which in turn increase near-
membrane Ca2 concentrations (Olson and Williams, 2000).
Both JOF and Calcineurin induce expression of GATA2 in skeletal muscle, which
associates with calcineurin and NFATcI (Olson and Williams, 2000).
PA NA GJOTIS M4 NOLOPO UL OS 47
CHAPTER 1
INTRODUCTION
Myostatin, a member of the TGF-0 superfamily expressed specifically in skeletal
muscle, appears to act as an inhibitor of skeletal muscle hypertrophy, since strains of
livestock or transgenic mice bearing mutations in the myostatin gene exhibit massive
increases in muscle size (McPherron, Lawier, and Lee, 1997).
The pathways mentioned are though to be 'interacting' with the calcineurin pathway,
by either affecting the pathway itself or via a different routes regulating gene
expression in skeletal muscle. As a result, they have to be taken into consideration,
since calcineurin might be one of the most important gene regulation pathways but
definitely not the only one.
1.10 Scope of the study
The main objective of this study was to investigate the role of calcineurin in calcium
induced muscle fiber differentiation both in rat skeletal muscle and in Ls rat muscle
cell line. There are four specific aims:
1. To investigate the histological and metabolic changes, after 3 weeks of 10Hz
chronic stimulation, in rat skeletal muscle.
2. To investigate the differences in the calcineurin content between fast-twitch
and slow-twitch skeletal muscle fibers.
3. To investigate the inhibitory effect of cyclosporin A on the calcineurin
pathway under the effect of chronic stimulation in rat skeletal muscle.
4. To determine the mechanism of action of calcineurin, through NFAT
phosphorylation and nuclear translocation, in L rat skeletal muscle myocytes.
PA NA GIOTJS MA NOLOPO UL OS 48

CHAPTER 2
METHODS
METHODS
2.1 Induction of a fast- oxidative phenotype by chronic muscle stimulation (in
vivo study) and investigation of the effect of cyclosporin A histochemical and
metabolic studies
2.1.1 Muscle fibre determination
2. 1.2 Calcineurin and NFAT localization and translocation
2.1.3 Investigation of changes on enzyme activities of four metabolic pathways
2.2 The effect of increased intracellular Ca21 in NFAT translocation on U
Muscle cell cultures (in vitro study)
2.2.1 L6 muscle cell culture
2.2.2 Increase intracellular Ca 2 of L6 myocytes using Calcium lonophore 4-Bromo-
A23 187
2.2.3 Fura-2 [Ca 2+]j measurements in L6 myocytes grown on cut glass coverslips
2.2.4 Effects of increased intracellular Ca 2 in NFAT localization and translocation
2.3 Statistical analysis
PA NA GJOTJS MA NOLOPOULOS 49

CHAPTER 2
METHODS
2.1 Induction of a fast- oxidative phenotype by chronic muscle stimulation (in
vivo study) and investigation of the effect of cyclosporin A : histochemical and
metabolic studies
Ten Adult Sprague Dawley rats of either sex were divided to groups and all of them
received 10 Hz stimulation to the left limb. The right limb was used as a control for
every treatment. In addition, all animals with the code name "Green" received vehicle
injections (no cyclosporin), while the ones labelled "Black" and "Red" received
cyclosporin injection throughout the whole period of stimulation (see Table 2.1). The
naming based on colour identifies different animal groups that have been used. These
names are for lab organization only and these groups have no special features, have
not received any special treatment and were randomly used. The chronic stimulation,
termination and sample collection procedures were performed in collaboration with
Dr. S.Salmons, Dr. J.Jarvis and Dr. H.Sutherland at the Department of Human
anatomy and Cell biology, University of Liverpool, Liverpool L69 3 BX, United
Kingdom.
Table 2.1 Animal code name and stimulation pattern relation
/l 111110,1 ((MIt' 1101,1(3 .4111(111 III (If sti ,,ulation ( Days)
--____________________
Green2 18
Green3 19
Green4 19
PANAGIOTISMANOLOPOULOS 50

CHAPTER 2
METHODS
Green 5 20
BlackI 18
Black2 18
Redi 19
Red2 19
Red3 20
Chronic stimulation
All 10 animals were prepared for aseptic surgery with a preanesthetic medication of
diazepam (Valium, 5 mg/kg; Roche Products) and atropine sulfate (Bimeda, 3 mg/kg)
delivered subcutaneously, followed after 20 min by an intramuscular injection of
Hypnorm (Janssen Pharmaceuticals; fluanisone, 10 mg/mI, and fentanyl citrate, 0.315
mg/mI, 0.3 mI/kg). Miniature electrical stimulators (see Jarvis and Salmons, 1991)
were implanted into these animals under strictly aseptic conditions. The electrodes
were arranged to stimulate the tibialis anterior (TA) and extensor digitorum longus
(EDL) muscles via the common peroneal nerve. Further details of the procedure may
be found in the companion papers (Jarvis et al., 1996 and Mayne et al., 1996). In all
cases, the nerve was subjected to a continuous train of pulses at a frequency of 10 Hz.
Stimulation was confined to muscles in the left hindlimb; the right was used as a non-
stimulated control. This pattern was used since no evidence was found relealing
differences of either systemic or contractile effects in a variety of previous
experiments (Henriksson et al., 1986) (also see discussions: Eisenberg and Salmons,
1981; Salmons and Henriksson, 1981).
PANA GIOTIS MANOLOPO ULOS 51

CHAPTER 2
METHODS
Anaesthesia procedures
Animals were anesthetized by intravenous injection of urethane (50 mg/kg; Sigma
Chemical) followed immediately by pentobarbital sodium (Sagatal, 30 mg/kg to
effect; May and Baker). Deep anaesthesia was maintained by supplementary
intravenous injections of pentobarbital sodium.
Sample collection
The method of "freeze- nibbling" (Mayne, Jarvis, and Salmons, 1991) was used for
the purpose of measuring metabolite levels. This consisted of clamping small samples
from the surface of the exposed muscle with forceps that had been cooled in liquid
nitrogen. A small cut under the forceps freed the frozen tissue with minimal bleeding.
This sampling procedure has been shown to have no significant effect on the
subsequent mechanical performance of the muscle (Myane, Jarvis, and Salmons,
1991). Biopsies were stored at -77°C, pending analysis.
After the physiological measurements had been completed, further samples for
biochemical analysis were obtained from the whole TA and EDL muscles by freeze-
clumping the distal section in brass- jawed tongs cooled to the temperature of liquid
nitrogen. Tissues were then wrapped in cool aluminium foil and stored at -77°C in
hermetically sealed bags, pending analysis.
The procedure mentioned above was entirely performed in the Department of Human
anatomy and Cell biology, University of Liverpool, by licensed personnel. The
samples were kindly provided to the Muscle research group of the Biological Sciences
department at the of the University of Central Lancashire pending further analysis.
PANA GIOTIS MANOLOPO ULOS 52

CHAPTER 2 METHODS
For the histological and histochemical analysis, a transverse slice through the widest
part of the muscle was mounted on a cork disk, frozen in melting isopentane above
liquid nitrogen, and stored in the -80°C. The muscle samples were held upside down
just long enough for the fibres to hang down straight before placed in the isopentane.
The samples were left in the liquid nitrogen once they had been frozen for further
analysis. The ideal thickness for the ATPase and NBT staining is though to be 7-10
m muscle sections in the microtome at - 22 °C, while for immunohistochemical
techniques 5 pin. The sections were mounted on glass gelatin coated slides.
2.1.1 Muscle fibre determination
Skeletal muscle is made of muscle cells (fibers) having different contraction speeds.
Muscles that are active most of the time are typically slow contracting while muscles
that have bursts of activity are typically fast contracting. These differences in
contraction speed are the result of different myosin isoforms that have different
ATPase activities. Mammalian muscles may be separated into type I or type II, as the
major fiber types, using the calcium dependent adenosine triphosphatase (ATPase)
reaction. The differences in alkaline and acid stabilities of myosin ATPase are the
basis for this stain. A method to determine muscle fiber type (fast or slow myosin
ATPase) is to cut a section then treat it with acid. This acid kills the activity of the fast
myosin ATPase activity. This is followed by washing and adding AlP which is
hydrolyzed to ADP + Pi. The amount of Pi is detected by a chemical reaction that
makes a dense precipitate with the Pi. Thus, the slow fibers stain black and the fast
fibers have no stain. Using mATPase histochemistry, four major fiber types, three fast
and one slow, are currently delineated in skeletal muscle of small mammals. One of
the problems with this method is the species variation in acid liability of myofibrillar
PANA GIOTISMANOLOPOULOS 53

CHAPTER 2 METHODS
ATPase. However, Tunell and Hart in 1977 report a rapid and reproducible method,
which we used after slight modifications, that enables three (or more) fiber types to be
determined from a single slide, making this diagnostic procedure applicable for
routine use. In this method the sections are treated with pre-incubation medium at pH
7.25, resulting in slow fibers staining white, while fast fibers stain from light dark to
black (Tunell and Hart, 1977; Brooke and Kaiser, 1970; Pette and Staron, 1997).
The fist method used in this study, for the muscle fibre identifications was the ATPase
staining technique (Modified protocol of the original: Tunell and Hart, 1977).
Reaction Enzyme
ATP <-* ADP + P i Ca,Mg-ATPase
Figure 2.1 The enzyme catalysing the ATP hydrolysis (Zubay, Parson and Vance, 1995).
The sections were treated with the pre-incubation medium (pH 7.25) of the following
composition Glycine (100 nM), Calcium chloride (1%) and formaldehyde (3.7%) for
5 mm, following a 90 minutes incubation period with the incubation medium [Al?
(2.8 mM), Sodium barbital (100 mM) and CaCl2 (2%)]. After treating the sections
with I % calcium chloride solution and 2 % cobalt chloride solution, 2 % ammonium
sulphide solution was applied to give the reaction the black and white staining. This
myofibrillar ATPase method clearly demonstrates three or even four fibre types in
each section.
Table 2.2 ATPase results interpretation.
Legend: 0 no staining; 1 light stain; 2 heavy stain.
PA NA (310 TIS MA NOLOPO ULOS 54

CHAPTER 2 METHODS
In order to verify the results of the ATPase staining NADT-TR (slight modification of
the: Novikoff, Shin, and Drucker, 1961) staining was performed to all the muscle
sections of the samples of Table 2.1. This stain stains for mitochondrial enzymes such
as succinate dehydrogenase. The sections were stained for 20 to 30 minutes with the
Stock NADH-TR solution ['URIS base (40mM), TRIS HCL (160mM) and Nitro blue
tetrazolium (1mg mF')] with an addition of I mg of NADH per tube on the day of the
experiment. Sometimes, three fibre types (or four) can be determined.. The type I and
ha fibres stain dark, while Type fix and fib stain light. However, normal results show
the following:
Table 23 NADI-l-TR results interpretation.
NADH-TR 12 12 Ii 10-1
stain
Legend: 0 no staining; 1 light stain; 2 heavy stain.
21.2 Calcineurin and NFA T localization and translocation
I. Immunofluorescence studies: Calcineurin A
Additional sections (thickness 5 pm) reacted with Calcineurin A antibody (1:100
dilution in PBS) (anti-rat CnA raised in mouse, monoclonal obtained by Santa Cruz),
which has been shown to be specific for Calcineui -in A (CnA). A secondary antibody
(1:100 dilution in PBS) anti-mouse, raised in goat, was then bound to the primary
antibody. This was visualised with the FITC conjugated (fluorescein-5-isothiocyanate
with Excitation: 490 and Emission: 520) of the secondary, which is fluorescent green.
The sections were fixed with in 4 % paraformaldehyde for 30 min and goat serum
PANA GIOTISMANOLOPOULOS 55

CHAPTER 2 METHODS
(1:10 dilution in PBS) was used as blocking serum, in order to avoid non-specific
binding. The sections were also treated with 1 % triton X-100 for 1 minute in the
permeabilisation step before the blocking serum addition, while PBS washes of the
following composition NaCI (120mtvL), KCI (2.7mM), NaH2PO 4 (10mM) and
KH2PO4 (1.5 mM), took place in the intervals. Moreover, 1.5 % of blocking serum
was added to the primary antibody as Santa Cruz recommend.
2. Immunofluorescence studies: NFA T
The exact same procedure was used for the NFAT staining. This time NFATcI anti-
rat, raised in goat (provided by Santa Cruz), was the primary antibody used (1:100
dilution in PBS), while the secondary was an anti-goat IgG raised in rabbit (1:100
dilution in PBS). This was visualised with the Cy3 conjugated secondary, which is
fluorescent red. In addition, rabbit serum (1:10 dilution) was used as the blocking
serum, andl.5 % of that blocking serum was added to the primary antibody as Santa
Cruz recommend.
3. Nuclear identification
The investigation ofNFAT translocation to the nucleus was performed with the use of
a DNA stain, DAN (4', 6-diamidine-2'-phenylindole, dihydrochloride, optional, stains
blue) stain (Excitation: 372; Emission: 456). Dilute DAPI stock solution (1:2000 with
distilled water) was applied to the same sections used for CnA or NFAT staining, for
3 minutes. This produced a fluorescent blue stain, which did not effect the other
staining.
PANA GIOTISMANOLOPOULOS 56

CHAPTER 2
METHODS
4. Microscopy
The microscopy set up used constitutes a fluorescent microscope with a special
camera linked to a computer. The software package chosen was SPOT version 3.2.4
for windows. Diagnostic Instruments, Inc. 1997-2001.
5. Western blots
A small piece of muscle (30 mg) was homogenised (on ice) in 0.6 ml of
homogenisation buffer [Tris HCI (50mM), Triton X-100 (0.1%), EDTA (1mM),
EGTA (1mM), NaF (50mM), B-glycerolphosphate (lOmrvI), Sodium pyrophosphate
(5mM), 2-mercaptoethanol (0.1%) and Okadaic acid (100 nI'4)]. The samples were
then rotated for 60 minutes at 4 °C and centrifuged at 13,000g and 4 °C for 10
minutes. The supernatant was measured for protein concentration using Bradford
assay. Additions of 20 gI per lane were used and the protein was adjusted to 1 mg/mI
(or more if the bands are not clear enough) by diluting in SDS sample buffer of the
following composition Tris-HCI 0.5M, glycerol 27mM, SDS (stock) 10%,
bromophenol blue (stock) 0.5% in Deionized water. Moreover, for biotinylated
protein standards BIORAD recommended diluting 1:4 with SDS buffer, heating to 95
°C for 5 minutes and loading 10 xl per well for mini-gels. The samples were run on
10 % SDS-PAGE gel (200 V constant voltage) for approx 40 mm. Moreover, both the
gel and the nitrocellulose membrane were equilibrated in transfer buffer [Tris-base
25mM, glycine 192mM and methanol 20% in deionised water] for 30 minutes. The
gel sandwich was prepared and then the transfer took place for about 1 hour at 100 V
(constant voltage) and 350 mA. Following the completion of transfer, the membrane
was incubated in 30 ml of blocking buffer of the following composition Tris buffer
saline, 0.1% Tween-20 and 5% wlv non-fat dry milk powder with gentle agitation for
PA NA Gb TIS M'l NOLOPO UL OS 57

CHAPTER 2 METHODS
I hour at room temp. After incubating in blocking buffer the membrane was washed 3
times for 5 minutes in 30 ml of wash buffer [Tris buffer saline and 0.1% Tween-20]
again with gentle agitation. In addition, the membrane was incubated with the primary
antibody [SIGMA monoclonal Anti-calcineurin (a- subunit)] overnight at 4 °C with
gentle agitation (for monoclonal antibody in 25 ml of blocking buffer/ for polyclonal
antibody substitute 5% non-fat milk powder with 5% BSA). For the calcineurin blot
anti-CnA at a 1 in 1000 dilution was used. The membrane was again washed in 30 ml
wash buffer with gentle agitation, 3 times for 5 minutes. The secondary antibody was
applied at this state to incubate the membrane for 1 hour at room temp in 30 ml of
blocking buffer with gentle agitation [secondary: (anti-mouse IgG HRP conjugate) at
a 1 in 1000 concentration and streptavidin-HRP conjugate (to detect biotinylated
protein standards) at a concentration of 1 in 200]. The first method used to reveal the
"bands" was by washing the membrane with DAB, which was applied for 15 min to
allow colour development. Finally, excess colour development was prevented by
immersing the membrane in deionised water for 10 mins. The second method, which
had far better results, was the Phototope FIRP Western Blot Detection System. This
method uses LumIGLO Reagent and peroxide. The membrane was incubated with
lumiglo for 1 mm. Lumiglo is a light producing substance, which is attached to the
secondary antibody. The produced light was captured by a film (KODAK scientific
imaging film: X-01vLAT 25 13 xIS cm which in turn was developed.
2.1.3 Investigation of changes on enzyme activities of four metabolic pathways
1. Extraction
The first step for the investigation of enzyme activities is the extraction of enzymes
from the muscle samples tested (Modified protocol from: Cheng et al., 1997). The
PANA GJOTISMANOLOPOULOS 58

CHAPTER 2
METHODS
muscle samples were freeze-dried for about 4 h and were cut to small pieces with
scissors. About I mg of tissue was the homogenised with ice cold phosphate buffer to
yield a 1:49 (w/v) dilution [KHPO 4 (100mM), 13-mercaptoethanol (20mM), EDTA
(2mM) and 0.02% BSA at pH 7.5]. The samples were then sonicated in order to
disrupt all the membranes and then centrifuged for 2 min at 10,000 revolutions mm 1
in a minifuge (Eppendorf: Centrifuge 541 5R). The supernatant was than stored at —80
°C pending analysis.
2. Measurements of enzyme activities for the following enzymes:
Creatine Kinase Assay (CK), Spectroyhotometer
All the enzyme activities were temperature (37 °C) and pH (pH 7) controlled based on
the protocol of Passoneau and Lowry (1993). In contrast to a metabolite assay, the
enzyme under investigation is a "bottle neck" in the pathway. For this reason, a lot of
substrate was added, at least ten times the concentrations of the K. Michaelis
constant. Under these conditions, the reaction rate is maximal and independent of the
substrate concentration.
Table 2.4 The reactions involved in Ceatine Kinase assay and the enzymes, which catalyse them (Passoneau and Lowry, 1993).
P-creatine + ADP -> ATP + creatine Creatine kinase
Glucose + ATP -> glucose-6-pbosphate + Hexokinase
ADP
Glucose-6-phosphate + NADP -, 6-P- Glucose-6-phosphate dehydrogenase
gluconolactone + NADPH +
PANAGIOTISMANOLOPOULOS 59

CHAPTER 2 METHODS
For this assay, 0.01 ml of extract (24 gg skeletal muscle) was used, I ml of creatine
kinase reagent with the following composition [Imidazole base (100mM), Acetic acid
(IN), ADP (1mM), Mg acatate (10mM), Dithiothreitol (5mM), AMP (20mM),
glucose (2mM), NADP (0.1mM) and 0.02% Bovine serum albumin (BSA)], 2.8 U
ml hexokinase dissoved in water, 0.18 U mY' glucose-6-phosphate dehydrogenase
from yeast dissolved in water as well, and 0.01 ml of 2.5 M P-creatine solution,
In all enzyme measurements the room temperature was recorded and each
determination was repeated twice. In addition, a 1 ml cuvette filled with distilled
water was inserted into the spectrophotometer in order to zero the experiment (before
every measurement). For this enzyme measurement 0.01 ml (10 gI) of extract and I
ml of the creatine kinase reagent were added to a cuvette and the absorbance was read
once stability was achieved (Figure 2.2). For all the assays, recordings of the
absorbance for every single minute were obtained, until the reaction started to slow
down. For the analysis: 100 jiM of NADPH yield an absorbance of 0.627 in a 1 cm
light path (c = 6270).
0.01 ml of PCi solution
Hexokinase solution
Glucose-6-Phosphate Dehydogenase solution
I ml buffer
0.01 ml extract
Figure 2.2 The extract and the buffer were added to the cuvette following glucose 6-Phoshate
dehydrogenase and hexokinase solutions. Finally, 0.01 ml (10 p1) of 2.5 M phosphocreatine (PCr) was
added and the cuvette was 'mixed' before any measurements were obtained.
PANA GIOTISMANOLOPOULOS 60

CHAPTER 2 METHODS
Hexokinase Assay (HEX), Spectroyhotometer
For this assay, 0.01ml of extract, 0.98 ml of hexokinase reagent [Tris HCI (50mM),
Tris base (50mM'), MgCl2 (5mM), ATP (5mM), 0.5% Triton-X and 0.05% BSA], and
0.01 ml of glucose solution (200 mmol 1 - 5 were required. The reactions involved in
this enzyme measurement are illustrated in the table 2.5.
Table 2.5 The reactions involved in Hexokinase assay and the enzymes, which catalyse them (Passoneau and Lowly, 1993).
Glucose + ATP 4-> glucose-6-phosphate + Hexokinase (measured)
ADP
Glucose.-6-phosphate + NAN' <-.> 6_P- Glucose-6-phosphate dehydrogenase
gluconolactone + NADPH + H (added)
For this enzyme measurement 10 R1 of extract and I ml of the lactate dehydrogenase
reagent were added to a cuvette and the absorbance was read once stability was
achieved. Moreover, 10 pil of 200 mmol l glucose was added to the cuvette, before
the timer was started.
Lactate Dehydrogenase (LDH) Assay. Spectrophotometer
This assay was designed to obtain measurements of the rate of 0-hydroxyacyl CoA
dehydrogenase. The relative chemical reaction is illustrated in Table 2.6.
Table 2.6 The reaction in Lactate dehydrogenase assay and the enzyme involved. (Passoneau and Lowry, 1993).
Pyruvate + NADH + H <-* lactate + NAD Lactate dehydrogenase
PANAGJOTISMANOLOPOULOS 61

CHAPTER 2 METHODS
This assay requires 0.01 ml of extract and 1 ml of lactate dehydrogenase reagent of the
following composition Imidazole-HCI (50mM), Imidazole-base (50mM) and Sodium
pyruvate (1 mM). For this enzyme measurement 1 ml of the lactate dehydrogenase
reagent was added to a cuvette and the absorbance was read once stability was
achieved and following 0.01 ml (10 pil) of extract.
Malate Dehydrogenase (MDII). Assay Spectroylwtonwter
Measurements were obtained of the rate of 13- hydroxyacyl CoA dehydrogenase,
which requires 0.01 ml of extract and I ml of malate dehydrogenase reagent of the
following composition 2-amino-methyl-1,2-propanediol (50mM), glutamic acid;
sodium salt (10mM), malic acid; monosodium salt (10mM). Malate dehydrogenase
reagent (imI) was added to a cuvette followed by 0.01 ml (10 p1) of extract before
any measurements were obtained. The relevant chemical rections-taking place in the
cuvette are shown in table 2.7.
Table 2.7 The reactions involved in malate dehydrogenase assay and the enzymes, which catalyse them (Passoneau and Lowry, 1993).
Malate + NAD' <-* Oxaloacetate + NADII
Oxaloacetate + glutamate ++ aspartate + Aspartate aminotransferase (or
a- ketoglutarate glutamic-oxalaetic transaminase,
GOT) 0
is mmm'M with astnrtnte aminntmnct'enge hs'iuce nf the iinThvniinhle pniiilihrinm nf
the malate dehydrogenase reaction
PA NA GJO TIS MA NOLOPO UL OS 62
CHAPTER 2 METHODS
2.2 The effect of increased intracellular Ca 2 in NFAT translocation on U
Muscle cell cultures (in vitro study)
2.2.1 L6 muscle cell cultures
Monolayers of L6 cell cultures were prepared by a previously established method
(Hundal et al., 1992). The L 6 cells are preserved (long term) frozen in liquid nitrogen
(-192 °C), while the cryoprotectant DMSO added, protects the cell structures. The
cells which were to be cultured, were removed from the low temperature environment
to 37 °C, while the cryoprotectant DMSO was removed before subsequent, use.
Standard centrifugation (600 rpm) and supernatant removal techniques applied here.
The cells were grown in a Minimal Essential Medium (MEM) to the differentiated
stage of myotubes, in an atmosphere of 5% CO2 and 5% air at 37 T. Once the cell
cultures reached 30% - 50% confluence they were sub-divided using trypsinisation
and sub-culturing techniques. Most of the cells were cryopreserved in liquid nitrogen
using freezing mixture and Mr. Frosty technology. This is an alternative to the
temperature reduction schedule using liquid nitrogen vapour. This approach uses the
thermal characteristics of a special freezing liquid (2-propanol or isopropyl alcohol) to
gradual cool the cells to a point where they may be transferred to liquid nitrogen.
After trypsinisation, trypsin was removed by centrifligation and re-suspension in fresh
a-MEM. The cells were then sub-cultured before they were transferred the same way
to coverslips.
PA NA (JJOTIS MA NOLOPO ULOS 63
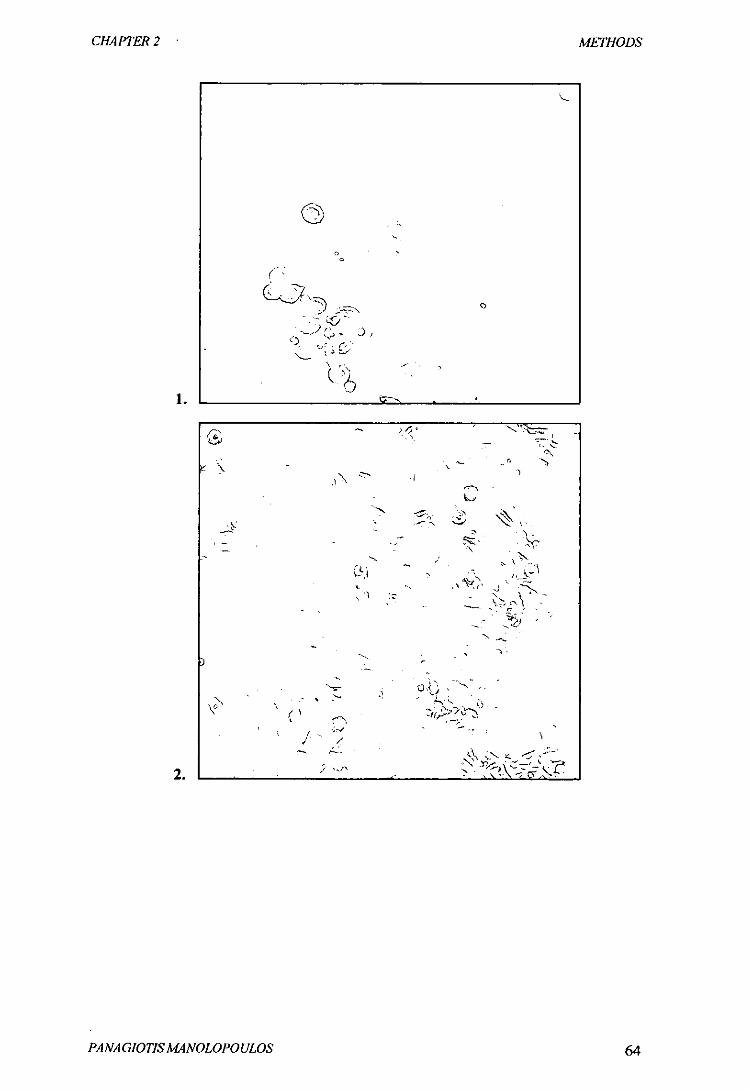
CHAPTER 2
METHODS
km
C)
-
cm
/
H
oL -
- -Th
Q-:--
ci
1.
PANA GIOTISMANOLOPOULOS 64

N
t \\ r '
1)1 'ST4S H -
-' z- ----c
CHAPTER 2
METHODS
3.
t. ;• 9' 1', J
4 n q/ w4
:fé ! •' -t ;i'
--Z- •r-
T -
Al
fcc ' t_
ftui
o/J Stt N
/.1r4 h-- N-------- - •1. - - ,-._- j_ •-C
-t - _-- p
4. — -1 - -- -. -: -
PANA GIOTISMANOLOPOULOS 65

CHAPTER 2
METHODS
-
F C
-i' . ':$t' CL — k
\ 'I
' 1\ 4
J? ( 1 I? '/1 (
- ( 7,
• I 4\C
/(f
5.
Ccat ;ç
': •:
\\
tRt2tV' it
6.
Figure 2.3. L6 muscle cell line photogmphs in different stages of cell growth and confluency (in the flask): 1. 101/o 2. 50% 3. 70% 4. 80% 5.90% 6.95%.
Standard &ass coverslips (size 25 mm x 60 mm) were purchased from SIGMA Ltd.
They were cut to quartz cuvette size using a diamond-tipped glass-cutter. They were
PANA GJOTJSMANOLOPOULOS 66

CI'JA PTER 2 METHODS
stored in absolute ethanol and were flamed before use. Both un-coated and 0.1 %
gelatin-coated coverslips could be used for the culture of L6 myocytes and subsequent
free Ca2 determinations. Preliminary experiments indicated that there was no
difference in the morphology or behaviour of the cells in either situation.
Two flamed coverslips were placed in the bottom of standard 6 cm plastic culture
dishes and covered with 5cm 3 of complete culture medium ((x MEM containing 8 %
FCS). The cells were re-suspended in approximately 10 cm 3 of complete medium and
approximately 1cm 3 of cell-containing medium was gently 'dribbled' over the cut
coverstips. It was inevitable that some of the cells would attach to the plastic dish
rather than the coverslip however this is not important since once the cells had been
allowed to attach the coverslips were moved to fresh Petri dishes.
Once the desired number of dishes had been set up the dishes were moved to the CO2
incubator for a few hours or overnight to allow the cells to hilly attach to the
substrate. Once this had happened fresh dishes were set up using 5 cm 3 of complete
medium. Using alcohol-dipped and flamed forceps the coverslips were then carefully
moved to the new containers and replaced in the CO2 incubator.
The degree of confluence of the culture was monitored daily and if necessary the cells
were fed at required intervals. Once the cells had reached 70-80 % confluency the
coverslips were placed in fresh Petri dishes containing differentiation medium ((x
MEM containing 2 % FCS) (Sato and Miyagi, 1996; Incepri et al., 1995). Myotube
formation occurred and the cells were kept in the incubation for 24 hours until further
analysis took place.
PA NA GIOTIS MA NOLOPO ULOS 67
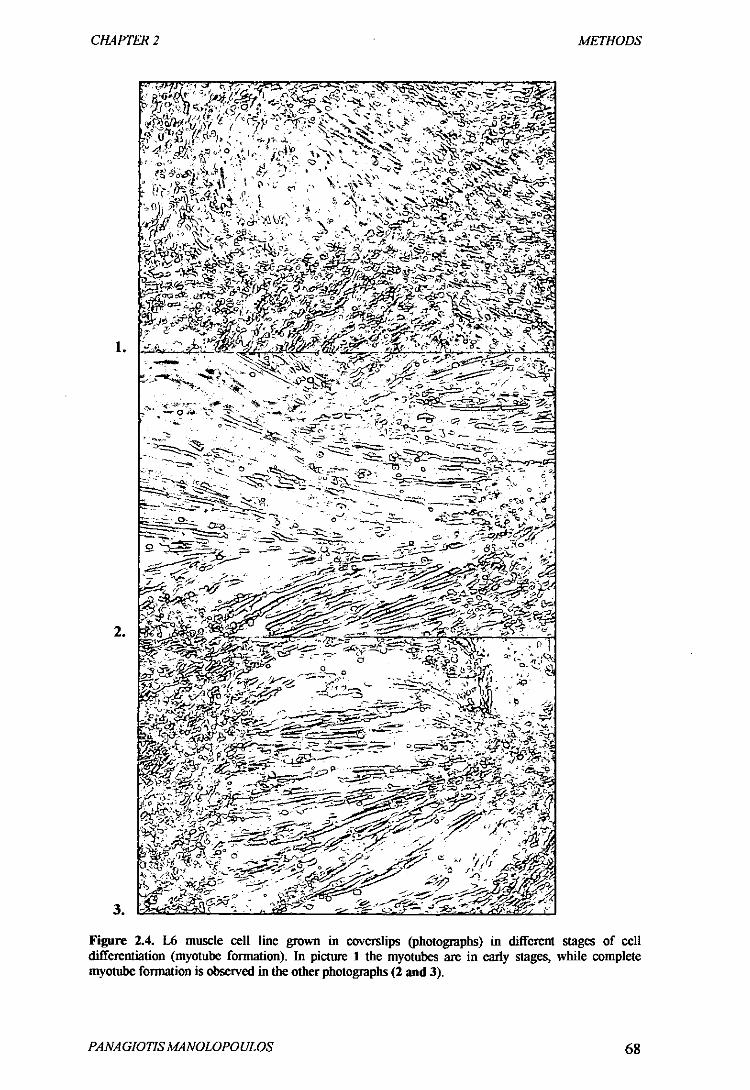
CHAPTER 2
SIL*fl(IJIi
- ,J•r;. 11c, ; (S''
-
eta ciTi ,'
• -. I
I -
(j - • \ ?-. • - 'ic
'I . -;-•. •..-_. 31' •
.L¼.
.,
..
- -•-•- .bo. - -1' - *
-: ' ,.., •3,- -'-n .i-_
- •0. s- - -- -. t-- -. - — . - -
S -c. - -'-2_
tAl-
-c- ---.
-
-- -c-- - - -----i-c- dc =- r— t- -''r.
1.
I- --- -- - -
;
2
-
r-- - -- - -- -
t*~"9
0- -
3.
Figure 2.4. 16 muscle cell line grown in coverslips (photographs) in different stages of cell differentiation (myotube fonnation). In picture I the myotubes are in early stages, while complete myotube formation is observed in the other photographs (2 and 3).
P,4NA GIOTISMANOLOPOULOS 68

CHAPTER 2
METHODS
The myotube formation was verified by an Eosin / Hematoxylin stain which revealed
multi-nuclei myotubes. For this staining the cell were incubated with Hematoxylin for
10 minutes (in 25 °C) and after a wash with Eosin for 2 minutes. The following figure
(Figure 2.5) illustrates pictures of L6 myotudes (multi-nuclei structures).
1.
• •• 7
tt'
3
Figure 2.5. Eosin/Hematoxylin stain in U cells cultured in coverslips. Myotube formation is observed
ithth 3 days after reducing the serum (FES) in the a-MEM from 8% to 2% (pictures 1-3).
2.2.2 Increase intracellular Ca 2 of L6 myocytes using Calcium tonophore 4-
Bromo-A23187
Intracellular calcium changes were investigated in L6 myocytes at the state of
myotubes cultured in coverslips. The calcium measurements were performed using
PANA GIOTIS MANOLOPOULOS 69

CHAPTER 2 METHODS
the antibiotic A23 187, which is only suitable as its halogenated analogue 4-bromo-
A23 187, as native A23 187 exibits autofluorescence at the upper füra-2 wavelength
(Mason, 1993). Addition of the ionophore causes a rapid, sustained rise in
intracellular calcium, which reaches maximum within tens of seconds. This whole
process was measured for about 16 mm (960 see), in order to allow the calcium to
equilibrate (reach a steady plateau phase). A range of 4-bromo-A23 187
concentrations was tested in order to investigate the cell line's response to that range
and finally achieve the 'optimal' intracellular calcium increase: 50 nM, 100 nM, 200
nM, 400 nM, 500 nM, 1000 nM, 2000 nM, 4000 nM, 8000 nM (Meiner et al., 2001;
Halseth et al., 2000; Dolmetsch et al., 1997).
2.2.3 Fura-2 ICa 2 li measurements in L6 myocytes grown on cut glass
coverslips
A modified protocol from Jung, Pfeiffer and Deitmer (2000) was used in order to
investigate free intracellular calcium changes in the L6 cells. The Lt myotubes
cultured in coverslips were removed from the culture medium and washed three times
in 10 ml of washing medium (step 2 in figure 2.6). The coverslips were then placed in
5 ml Fura-2 loading medium [Fura 2 AM (acetoxylmethyl ester) purchased from
Molecular Probe] containing 8 pM of Fura-2 and left for 50 mm (step 3 in figure 2.6),
in the dark. After removing them from the Fura-2 solution they were washed in 10 ml
of washing solution (step 4 in figure 2.6). In addition, the coverslips were placed in a
further 10 ml of washing solution and left for 30 minutes to liberate free Fura 2 inside
the cells (step 5 in figure 2.6). Fura-2 fluorescence was then measured in cell
populations with a Perkin- Elmer fluorescence spectrophotometer, as shown in step 6
in Figure 2.6. This instrument is equipped with a rotating filter wheel, which was used
PANA GIOTISMANOLOPOULOS 70

CHAPTER 2
METHODS
to alternate 340 and 380 nm, excitation. Fura-2 displays emission peak at 510 nm, but
two calcium-dependent absorption maxima, one at 340 nm, which increases with
increasing ionised calcium and a second at 380 nm, which similarly decreases with
arise in ionised calcium. A coverslip was mounted vertically on a 30 deg angle to the
light path in a cuvette, which contained continuously stared washing medium. The
software package used to obtain the measurements was FC WinLab 3.0 (1999: The
Perkin-Elmer corporation), which automatically measures and subtracts background
fluorescence.
3) Incubate for 50 min in 5 ml Fura-2 incubation
medium
I 'm *"m 6) Place covaslip in quartz cuvette and measure 5) Incubate for 30 mm 4) Wash in 10 ml 340, 380 nm 50) am in 10 ml washing washing medium
medium
Figure 2.6. Schematical figure showing the steps involved in IC?]1 measurements in L6 myocytes. Steps 3-6 should be canied out in the dark.
2.2.4 Effects of increased intracellular Ca 2 in NFAT localization and
translocation
The final concentration, which elicited intracellular calcium increase to 'optimal
level' was found to be 10'M of 4-bromo-A23 187. In order to investigate NFAT
1) Take coverslip out of incubator
WIN
2) Wash in 10 ml washing medium
PA NA GJOTIS MANOLOPO UL OS 71

CHAPTER 2 METHODS
translocation immunohistochemical techniques were used. The L cells were cultured
for 24 h 1 0'M concentration before they were fixed with 100% methanol at -20 °C for
10 mm.
Fixed L6 myotubes cultured in glass coverslips were incubated overnight at 4 °C with
NFATcI anti-rat, raised in goat (Santa Cruz) (1:100 dilution in 1% BSA in TBS). A
secondary antibody (1:100 dilution in TBS for 30-45 minutes in room temperature in
the dark) anti-goat IgG raised in rabbit, was then bound to the primary antibody. This
was visualised with the Cy3 conjugated of the secondary, which is fluorescent red.
Moreover, rabbit serum (1:10 dilution in TBS, 0.02% Sodium azide NaN3 and 1%
BSA) was used as blocking serum, in order to avoid unspecific binding. The sections
were also treated with I % triton X-100 for 1 minute in the permeabilization step
before the blocking serum addition, while TBS washes took place in the intervals.
Control slides were used in order to investigate unspecific binding of the secondary
antibody.
The investigation of NFAT translocation to the nucleus was performed with the use of
a DNA stain, DAPI (4', 6-diamidine-2'-phenylindole, dihydrochloride, optional, stains
blue) stain. Dilute DAPI stock solution (1:2000 with distilled water) was applied to
the same sections used for CnA or NFAT staining, for 3 minutes. This produced a
fluorescent blue stain, which did not effect the other staining.
2.3 Statistical analysis
Analysis of variance (A4SNOVA) was performed and statistical significance of
differences was evaluated using students T test. The level of significance was defined
as P<0.05.
PA/VA GIOTISMANOLOPOULOS 72

CHAPTER 3
RESULTS
RESULTS
3.1. Induction of a fast- oxidative phenotype by chronic muscle stimulation
and investigation of the effect of cyclosporin A : histochemical and metabolic
studies
3.1.1 The effect of chronic stimulation on muscle fiber differentiation
3.1.2 Calcineurin content of different muscle fiber types
3.1.3 The effect of chronic stimulation on enzyme activities of four metabolic
pathways
3.2. Investigation of the effect of increased intracellular Ca2 in NFAT
translocation on L6 Muscle cell cultures
3.2. 1 The effect of Br-A89 123 lonophore in intracellular calcium concentration of
L6 myotubes
3.2.2 The effect of increased intracellular calcium in NFAT localization and
translocation
PANA GIOTISMANOLOPOULOS 73
CHAPTER 3
RESULTS
3.1. Induction of a fast- oxidative phenotype by chronic muscle stimulation
and investigation of the effect of cyclosporin A histochemical and metabolic
studies
3.1.1 The effect of chronic stimulation on muscle fiber differentiation:
The sections were stained histochemically for the demonstration of myofibrillar
ATPase, which revealed three (in some cases four: Figure 3.3) distinct fiber type
populations in the rat muscles tested (TA: Tibialis Anterior EDL: Extensor digitorum
longus Sol: Soleus) (Figures 3.1-3.4). In limb muscles of adult rodents, four distinct
fiber types have been recognized, as described by Parry (2001), the slow type I and
fast types ila, Hx and llb that express myosin heavy chains MyHC1, MYHCIIA,
MyHC11x, MyHCHB, respectively (Parry, 2001). In large muscles such as tibialis
anterior and gastrocnemius, there is a heterogeneous distribution of fiber types such
that the superficial regions are composed of largely or exclusively types fib and llx
(about 80:20 %, respectively, in mouse), with types I and ila limited to deeper regions
(Parry, 2001). That is why all the results compared are from the whole muscle, while
the pictures compared are from same region of the muscle. Five samples (10 p.tm
thickness sections) of each group shown in Table 2. 1(see Methods section) were
tested.
Purely histochemical evidence must, however, be interpreted with caution, since
fibers that appear to stain homogeneously may still contain a mixture of myosin
isoforms (Mayne et al., 1996). The ATPase results illustrate a shift towards a slower
phenotype. It seems that 20 days of 10 Hz stimulation was enough to initiate the
change to slow phenotype but not to cause a complete change in the muscle fibers.
PA NA Gb TIS MA NOLOPO ULOS 74

CHAPTER 3 RESULTS
In both control (vehicle only) and control samples, which recieved cyclosporin
treatment muscles, all four types of muscle fibers are visible (Figures 31 and 3.3),
while in stimulated muscle the number of type JIb fiber is starting to reduce because
they change to lix and ha (Figures 3.2 and 3.4). As the results illustrate in Figures
3.1-3.4, cyclosporin A had no blocking effect in the muscle fiber differentiation,
caused by the stimulation. Moreover, after stimulation the fibers appear smaller and
have a more round appearance (Figures 3.2, 3.4, 3.6 and 3.7). During this 3 week
period of 10 Hz continuous stimulation, the proportion of type I fibers did not show a
rise but instead a slight reduction between the control and the stimulated muscles,
which illustrates that a total transition towards a slow phenotype had failed to occur.
These section photographs are representative samples of the results obtained in this
study (n=7). As the tables in figures 3.1 to 3.4 illustrate, there is big increase (10 %-
45%) in the type ha fibers and a reduction in type I (about 10-35 %) and type hlb
fibers (up to 10%). This illustrates that with chronic stimulation we get a mixture of
myosin heavy chain with an amazing in crease mostly in the MHC11 a. The results
illustrate that chronic stimulation at 10Hz for 3 weeks in rat skeletal muscle causes the
formation of an oxidative-glycolytic phenotype. In addition, figures 3.5-3.8 following,
illustrate a marked increased in mitochondrial content in all fiber types. Based on this
staining all fibers are shown to be of the type I (slow-twitch), illustrating incredible
adaptation.
PANAGIOTJSMANOLOPQULOS 75
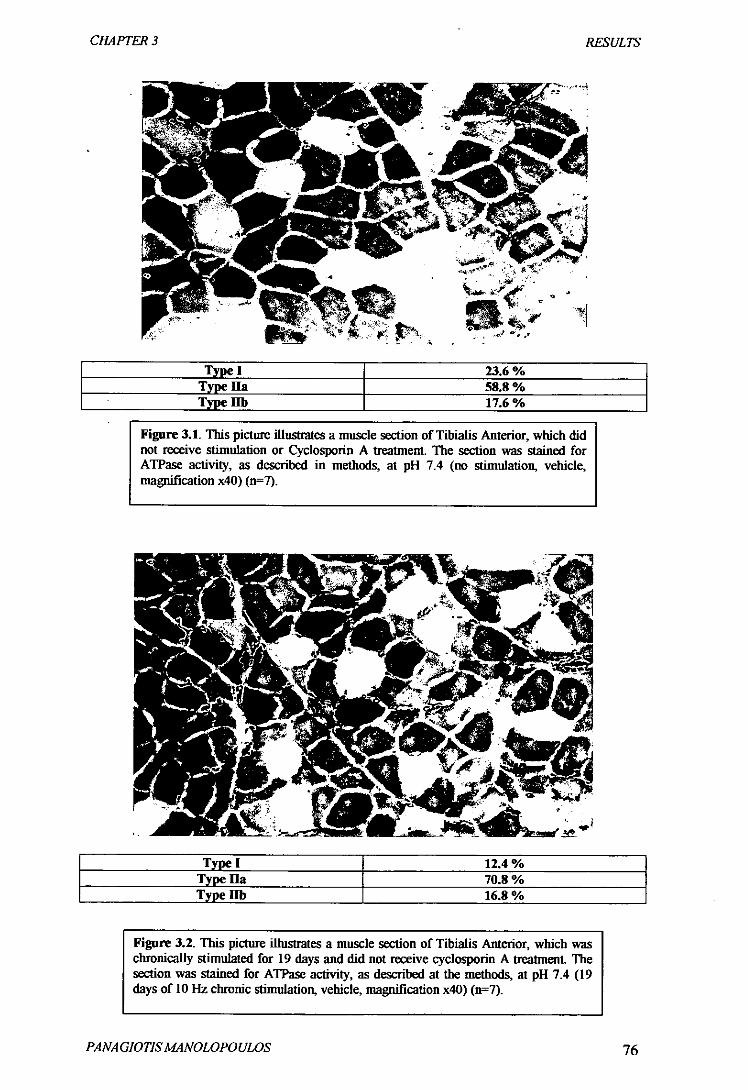
CHAPTER 3
RESULTS
yrrtt
-
Type! 23.6% Type Ha 58.8 % Type llb 17.6%
Figure 3.1. This picture illustrates a muscle section of Tibialis Anterior, which did not receive stimulation or Cyclosporin A treatment The section was stained for ATPase activity, as described in methods, at pH 7.4 (no stimulation, vehicle, magnification x40) (n=7).
[ Type! 12.4% Type Ha 70.8 % Type fib 16.8%
Figure 3.2. This picture illustrates a muscle section of Tibiatis Anterior, which was chronically stimulated for 19 days and did not receive cyclosporin A treatment The section was stained for ATPase activity, as described at the methods, at pH 7.4 (19 days of tO Hz chronic stimulation, vehicle, magnification x40) (1e7).
PANA GIOTIS MANOLOPO ULOS 76

'a.
C!L4PTER 3
RESULTS
' 4
H 6
Typel 40.4%
I Typdlla 36.8% Type fib 22.8 %
Figure 3.3. This picture illustrates a muscle section of Tibialis Anterior, which bid not receive stimulation but received Cyclosporin A treatment for 19 days. The section was stained for ATPase activity, as described in methods, at pH 7.4 (no stimulation, cyclosporin: 19 days cyclosporin A treatment, magnification x40) (n=7).
4
it Type! 4%
Typella 80% Typellb 16%
Figure 3.4. This picture illustrates a muscle section of Tibialis Anterior, which received both stimulation and Cyclosporin A treatment for 19 days. The section was stained for ATPase activity, as described in methods, at pH 7.4. (Stimulation and Cyclosporin: 19 days treatment, magnification x40) (n=7).
PA NA Gb TIS MA NOLOPO ULOS 77

CHAPTER 3 RESULTS
Armstrong and Phelps (1984), based on previous research (e.g.,Gollnick et al., 1983),
suggest that histochemical techniques that differentiate among the different myosin
ATPase isoenzymes (Brooke and Kaiser, 1970; Gollnick et at., 1983) may provide a
more objective means of identifing different fiber types in the muscles, since the
ATPase reaction intensity patterns for the fibers are discrete and are less influenced
by contractile behaviour than are the metabolic enzymes. At this time, however, most
physiological and biochemical studies on rat muscle have used a fiber classification
system based on ATPase after alkaline preincubation and a mitochondrial oxidative
enzyme similar to the one also used in this study. Although it has been proposed that
there is a close correspondence between classifications based on the ATPase system
and on metabolic properties (Spurway, 1981), others have demonstrated there is not a
close correlation between fast fibers identified as ha or llb with a metabolic enzyme
(e.g., NADH-TR) or as type ha or llb, respectively, with the myofibrillar ATPase
teclmique following acid preincubation (Nerneth et al., 1979; Gollnick et at., 1983).
Moreover, NADH-TR stain is a mitochondrial stain (NADH tetrazolium reductase
activity), which has revealed that the mitochondrial content in all the fibers, which
received stimulation, has risen substantially. All the fibers based in their mitocondrial
content appear to be Type I and ha. In comparison to the control situation there
appears to have been a dramatic reduction in Type IN and rIb fiber content.
Furthermore, cyclosporin A does not seem to prevent the change towards slow
phenotype. The pattern of coexpression of various Myosin Heavy chains (MyHC) has
led to general acceptance of the following sequence of changes in fiber type, as cited
in Parry (2001), which agrees with these results:
I i-. I/Ha 4-* Ha - Ha/Hi i-* fix - fix/lb i-* Jib
PANA GIOTISMANOLOPOULOS 78

CHAPTER 3
RESULTS
Type 1 48.8 % Type ila 37.5 % Type lib 13.5%
Figure 3.5. This picture illustrates a muscle section of Tibialis Anterior, which bid not receive stimulation or Cyclosporin A Ireaunent. The section was stained with an NADH-TR stain illustrating mitochondrial content as described in methods (no stimulation, vehicle, magnification x40) ('e7).
Type! 100% Typella - Typellb -
Figure 3.6. This picture illustrates a muscle section of Tibialis Anterior, which was chronically stimulated for 19 days and did not receive cyclosporin A treatment. The section was stained with an NADH-TR stain illustrating mitochondrial content, as described in methods (19 days of 10 Hz chronic stimulation, vehicle, magnification x40) (n7).
PANAGIOTISM4NOLOPOULOS 79

CHAPTER 3
RESULTS
Type! 11.5% Type Ha 27.9% Typellb 66.6%
Figure 3.7. This picture illustmtes a muscle section of Tibialis Anterior, which bid not receive stimulation but received Cyclosporin A treatment for 19 days. The section was stained with an NADH-TR stain illustrating initochondrial content, as described in methods (no stimulation, cyclosporin: 19 days cyclosporin A treatment, magnification x40) (n=7).
Typel 100% Typella -
Typellb -
Figure 3.8. This picture illustrates a muscle section of Tibialis Anterior, which received both stimulation and Cyclosporin A treatment for 19 days. The section was stained with an NADH-TR stain illustnting mitochondrial content, as described in methods (Stimulation and Cyclosporin: 19 days treatment, magnification x40) (n=7).
PANA GIOTISMANOLOPOULOS 80

CHAPTER 3 RESULTS
3.1.2 Calcineurin content of different muscle fiber types:
1. Immunofluorescence studies
Immunofluorescence studies were performed in the muscles investigated, in order to
identif' differences in Calcineurin concentrations in different fiber types. The study
identified differences in concentration between muscle fibers, which were
demonstrated by differences in fluorescence intensity. This is a comparative test and
the study was to identilS' differences in proteins rather than amounts.
The following photographs illustrate Calcineurin stain using FITC conjugate
(Fluorescent green) in Soleus (SOL) and Tibialis Anterior (TA) muscles, control (no
stimulation and no cyclosporin treatment) and stimulated (10 Hz chronic stimulation
for 20 days and no cyclosporin treatment). FITC (fluorescein-5-isothiocyanate) is a
conjugate used to identitS' proteins, which was bound to the secondary antibody. In
addition, DAPI stain was applied to the same section in order to identifS' the location
and the number of the nuclei. DAPI stain attaches specifically to double-stranded
DNA (chromosome Q banding), and is a fluorescent blue stain (Mason, 1993).
The immunohistochemical stain has identified that there are clear differences in
fluorescence among different muscle fibers. These results can be interpreted as
differences in the Calcineurin protein content (figures 3.9-3.12). Because of the
limitations of this technique no results were obtained in terms of which fiber type has
a high or low protein content. The identification of the Calcineurin differences among
fiber types was accomplished with the relation of the previous data with results
obtained by Weststen blotting.
PA NA GIOTIS M4 NOLOPO UL 05 81

CHAPTER 3
RESULTS
Figure 3.9. hnmunohistochemical stain for Calcineurin in a Soleus muscle section. This is a control muscle and has not received stimulation. Clearly identifiable differences in protein concentration among fiber types (no stimulation, vehicle, magnification x 10) (n=5)
Figure 3.10. Immunohistochemical stain for Calcineurin in a Soleus muscle section. This is a control muscle which has not received stimulation (no stiinulalion, vehicle, magnification x 10) (w'S)
PANA GIOTISMANOLOPOULOS 82

CHAPTER 3
RESULTS
FWMI
S.
Figure 3.11. Inununohistochemical slain for Calcineurin in a Tibialis Anterior section. This is a control muscle and has not received stimulation. The protein is concentrated more in different fiber types than others. 'Hot spots' of the protein within selected fibers (no stimulation, vehicle, magnification x 25) (n=5)
Figure 3.12. Inununohistochemical stain for Calcineurin in a Tibialis Anterior section. This muscle has received 10 Hz chronic stimulation for 20 days. Once again identifiable differences in protein concentration among fiber types (10 Hz chronic stimulation for 20 days, vehicle, magnification x 25) (n5)
Differences in relative
Calcineurin concentration
among fiber types interpreted as differences in fluorescence
intensity
Figure 3.13. Calcineurin stain in TA muscle and DAPI stain picture of the same section: overlayed photographs. Calcineurin stain is illustrated with Green fluorescence, while DAPI with blue. Different muscle fibers and the Nuclei (DNA stain) are illustrated. The results identified differences in Calcineurin concentration between fiber types (stimulation, Vehicle: G5= 20 days of stimulation) magnification x25 (n=6).
PANA GJOTJS MANOLOPOULOS 83
CHAPTER 3 RESULTS
2. Western blots
The adaptive ability of the skeletal muscle was further explored in this study where 10
Hz of chronic stimulation was applied in Rat Tibialis Anterior (TA) and Extensor
Digitorum Longus (EDL) for 3 weeks. Western Blots were performed in order to
investigate the relative changes in Calcineurin concentration between the stimulated
and control groups that did not receive any Cyclosporin treatment as shown in Table.
2.1 (G 1-5). In addition, relative study has demonstrated that there is no difference
between the left and right muscles of the lower leg in rat and that is why for all the
experiment this pattern was repeated (right leg = control ; left leg = stimulated)
(Salmons and Sreter, 1976)
The primary antibody used for this experiment is specific for the CnA domain of the
Calcineurin molecule (as described in methods). The molecule was "broken down"
(the molecular weight was identified through the molecular weight markers in the
Western blots) when the samples were boiled at 95 °C (as described in methods), and
the primary antibody bounded to the CnA subunit of the protein. The Calcineurin
heterodimer is composed by the catalytic subunit CnA, which consists of a
calmodulin binding domain and a autoinhibitory domain with a molecular weight of
59 KDa, while the regulatory subunit CnIB has a molecular weight of 19 KDa
(http://www.ensembl.org ; Olson and Williams, 2000).
PANA GIOTISMANOLOPOULOS 84

CHAPTER 3
_ _ B — -e
S.
tn
The mol. weight markas indicate
that the highlighted bands represent the relative calcineurin conc. inthe tested
samples. Calcincurtn A molweight: 59
KDa
Figure 3.14. Western bolt for Calcineurin in EDL control and stimulated muscles. The Calcineurin bands are easily identified and verified with the molecular weight markers.
This technique is used to identilS' differences in Calcineurin concentrations between
the controls (right muscle of the hind limb) and the samples that received 10 Hz
chronic stimulation (left muscle of the hind limb). This is a comparative approach and
the investigation of the exact concentrations was not attempted.
A.
—4
II 6 7 8 II
PANA GIOTIS MANOLOPOULOS 85

CHAPTER 3
RESULTS
B.
LineNo: 1 2 3 4 5 6 7 8 9
Sample: C
EDL
S
EDL
C
EDL
S
EDL
C
EDL
S
EDL
C
EDL
S
EDL
MoLW.
Markers
CS"
right
CS
left
G4
right
CI
left
C2
right
G2
left
CI
right
CI
left
Calcineurin: 17.45 2.05 8.3 3.81 5.67 1.99 31.40 11.17
Figure 3.15. A: Western blot for Calcineurin. In lanes I, 3, 5 and 7 EDL control muscles; lanes 2,
4, 6 and S EDL muscles stimulated at 10 Hz for 3 weeks; and lane 9 the molecular weight markers. B:
Amount values obtained by densitometric scanning of the western blots (software used: UVP
Laboratory imaging and analysis system). The amount in each band, are in relation to amount load in
each lane. II) See methods for the meaning of the Gl-05 codes (Table 2.1).l
The EDL muscle samples of the unstimulated limb have the highest amounts of
calcineurin. In the EDL control muscles the fast fiber types are predominant
(Armstrong and Phelps, 1984). The EDL samples that received 10 Hz stimulation and
the predominant muscle type seems to be Type I or Type Ha, within 3 weeks the
calcineurin concentration has reduced up to 8 times (G5 sample). In other samples
like G4, calcineurin concentration has decreased to a half, while the general marked
decreases are about a third compared to the controls. There is high variability between
the data and an underpowered test because of the low sample size. However, this
nonparametric test is significant at the 5% significance level indicating a positive
outcome (P = 0.050).
PA NA GIOTIS MANOLOPO UL OS 86

CHAPTER 3 RESULTS
3.1.3 The effect of chronic stimulation on enzyme activities of four metabolic
pathways:
The investigation of the metabolic changes, which took place after chronic stimulation
for 20 days (10 Hz, 24 h/day, for 3 weeks), were interpreted as changes in four
enzyme activities belonging to different metabolic pathways. In addition, the assays
for a given muscle were made on a few samples, from different animals all stimulated
for 3 weeks (between 17 and 20 days). This caused some problems in terms of
variation in the results. The skeletal muscles used were composed of a mixture of
different fiber types and as mentioned before these are not necessarily distributed
throughout the muscle. As a result, there was a difference in fiber content for every
part of muscle tested in every repetition. On the other hand, there are differences
among samples tested in regard to content of connective tissue, blood, and interstitial
fluid. In order to keep this variation to a minimum freeze-dried muscle was used for
testing and the same regions for a given muscle were used. Finally, in all the enzymes
investigated, there are no significant changes in enzyme activities after 3 weeks of
stimulation even though the changes occur towards the "expected" direction. These
changes were expected based on the similar published experiments (Henriksson et al.,
1986; Mayne et al., 1996; Chi et al., 1986; Meiner et al., 2001). The best animal
model for investigating changes in enzyme activities is rabbit, but this study was done
on rat skeletal muscle. In this animal model the changes are very hard to show,
because it requires a longer period of stimulation. If the following results were
compared with similar studies done in rabbit it would be seen that for the same period
of chronic stimulation the changes would be much higher and definitely significant
(1-lenriksson et al., 1986; Mayne et al., 1996; Chi et al., 1986; Meif3ner et al., 2001).
PA NA GIOTIS MA NOLOPO Ut OS 87
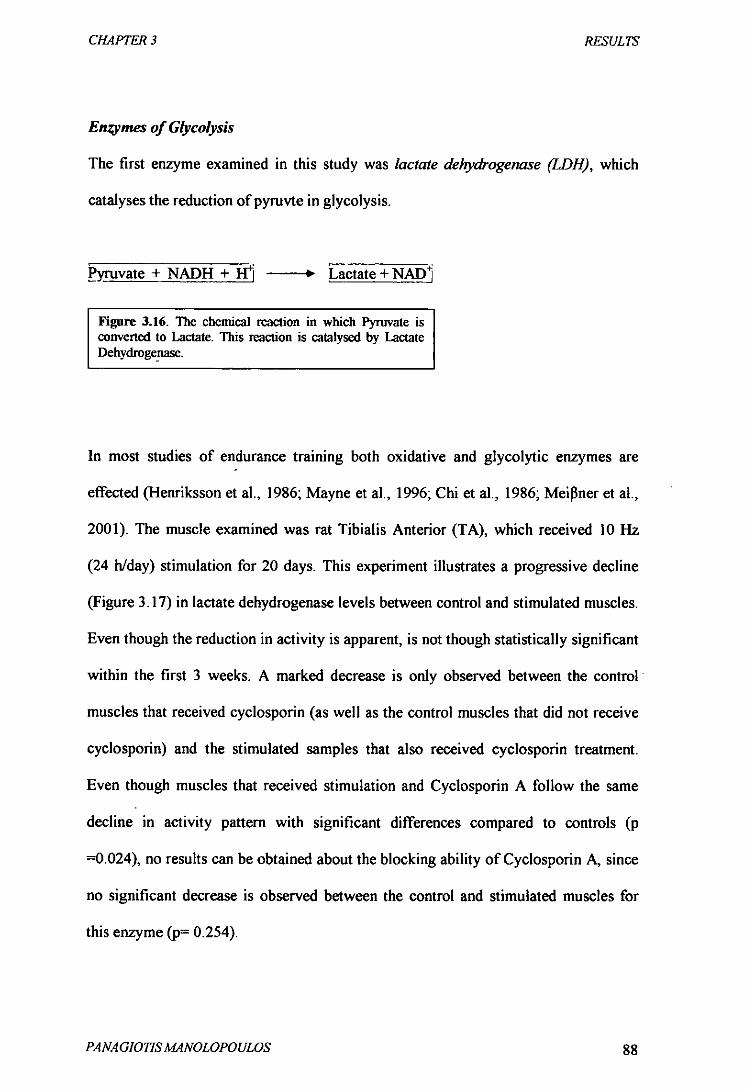
CHAPTER 3
RESULTS
Enzjnses of Glycolysis
The first enzyme examined in this study was lactate dehydrogenase (LDH), which
catalyses the reduction of pyruvte in glycolysis.
Pyruvate + NADH + ' Lactate + NAD1
Figure 3.16. The chemical reaction in which Pyruvate is converted to Lactate. This reaction is catalysed by Lactate Dehydrogeriase.
In most studies of endurance training both oxidative and glycolytic enzymes are
effected (Henriksson et al., 1986; Mayne et al., 1996; Chi et al., 1986; Meij3ner et al.,
2001). The muscle examined was rat Tibialis Anterior (TA), which received 10 Hz
(24 h/day) stimulation for 20 days. This experiment illustrates a progressive decline
(Figure 3.17) in lactate dehydrogenase levels between control and stimulated muscles.
Even though the reduction in activity is apparent, is not though statistically significant
within the first 3 weeks. A marked decrease is only observed between the control•
muscles that received cyclosporin (as well as the control muscles that did not receive
cyclosporin) and the stimulated samples that also received cyclosporin treatment.
Even though muscles that received stimulation and Cyclosporin A follow the same
decline in activity pattern with significant differences compared to controls (p
=0.024), no results can be obtained about the blocking ability of Cyclosporin A, since
no significant decrease is observed between the control and stimulated muscles for
this enzyme (p= 0.254).
PANAGIOTIS MANOLOPOULOS 88
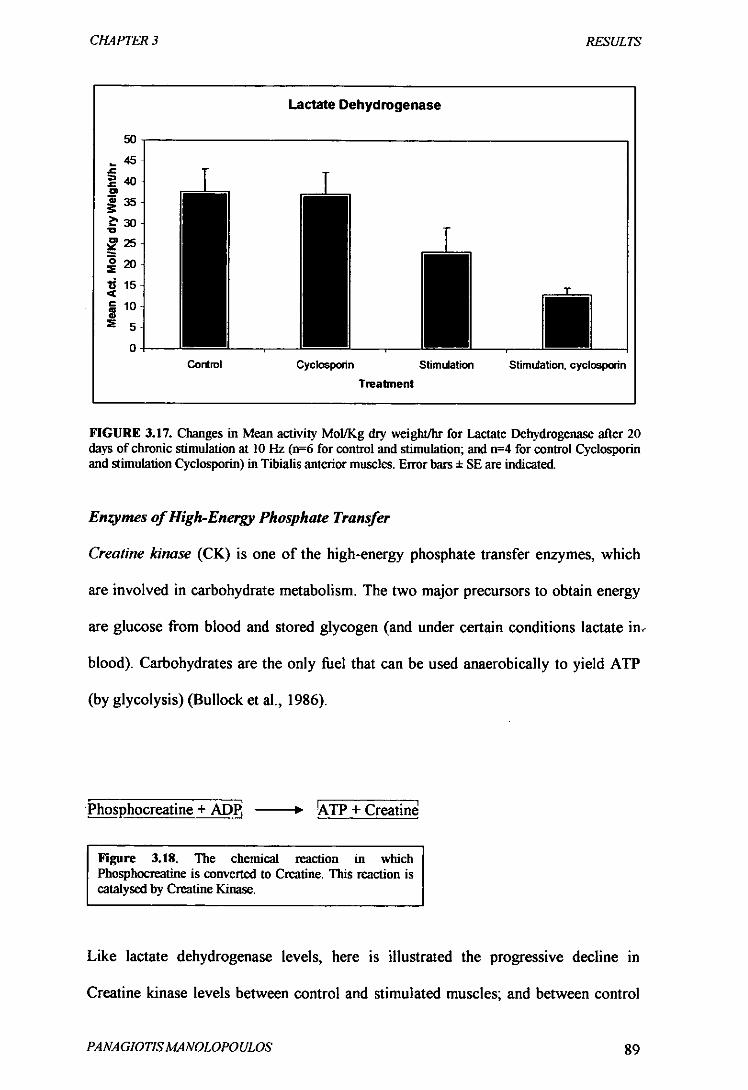
CHAPTER 3
RESULTS
50
Lactate Dehydrogenase
-45 'C
40
35.
.30. V
225
20
t 15
10
5.
0• Control Cyclosponn Stimulation Stimulation, cyclosporin
Treatment
FIGURE 3.17. Changes in Mean activity Mol/Kg thy weight/hr for Lactate Dehydrogenase after 20 days of chronic stimulation at 10 Hz (n=6 for control and stimulation; and n4 for control Cyclosporin and stimulation Cyclosporin) in Tibialis anterior muscles. Error bass ± SE are indicated.
Enzymes of High-Energy Phosphate Transfer
Creatine kinase (CK) is one of the high-energy phosphate transfer enzymes, which
are involved in carbohydrate metabolism. The two major precursors to obtain energy
are glucose from blood and stored glycogen (and under certain conditions lactate in
blood). Carbohydrates are the only fi.iel that can be used anaerobically to yield ATP
(by glycolysis) (Bullock et al., 1986).
Phosphocreatine + AD 0 ATP + Creatine
Figure 3.18. The chemical reaction in which Phosphocreatine is converted to Creatine. This reaction is catalysed by Creatine Kinase.
Like lactate dehydrogenase levels, here is illustrated the progressive decline in
Creatine kinase levels between control and stimulated muscles; and between control
PANAGIOTISMANOLOPOULOS 89

CHAPTER 3
RESULTS
cyclosporin and stimulated cyclosporin muscles. Again the reduction in activity is
obvious, but it cannot be established statistically within the first 3 weeks of
stimulation.
Creatine Kinase
60
20.
10• 5
0 Control Cyclosponn Stimulation Stimulation, cyclospotin
Treatment
FIGURE 3.19. Changes in Mean activity Mol/Kg thy weight/hr for Creatine Kinase after 20 days of chronic stimulation at 10 Hz (n=6 for control and stimulation; and n=4 for control Cyclosporin and stimulation Cyclosporin) in Tibialis anterior muscles. Error bars ± SE are indicated.
Enzymes of TCA cycle (Tricarboxylic Acid cycle)
The final oxidation step of the TCA cycle involves the conversion (oxidation) of
malate to oxaloacetate by ma/ate dehydrogenase (MDH).
1-Malate + NAD1 Øxaloacetate + NADH + H
Figure 3.20. The chemical reaction in which Malate is converted to Oxaloacetate. This reaction is catalysed by Malate Dehydrogenase.
Malate Dehydrogenase was used as a marker for the oxidative activity changes within
the muscle groups tested. To some extent MDH activities, varied in an increasing
PANA GJOTISMANOLOPOULOS 90

CHAPTER 3
RESULTS
fashion towards the stimulated muscles compared to controls. Moreover, no blocking
effect was illustrated when cyclosporin was used in combination to stimulation, but
the lack of significance in the recorded changes make conclusions impossible.
Malate Dehydrogenase
1
2
0
Control Cyclosporin Stimulation Stimulation, cyclosporin Treatment
FIGURE 3.21. Changes in Mean actMty MoI/Kg dry weight/hr for Malate L)ehydrogenase after 20 days of chronic stimulation at 10 Hz (n=6 for control and stimulation; and ie4 for control Cyclosporin and stimulation Cyclosporin) in Tibialis anterior muscles. Error bars ± SE are indicated.
Enzymes of oxidative metabolism
The last enzyme investigated is hexokinase (HJL%) an enzyme of the glycolytic
pathway involved in glycogen metabolism. This enzyme catalyses phosphorylation at
the oxygen attached to C-6 of glucose and the source of the phosphate group is ATP.
Ølucose + Alt P 3lucose-6-phoshate + ADP + Hj
Figure 3.22. The chemical reaction in which glucose is converted to glucose-6-phospate with the use of ATP. This reaction is catalysed by Lactate Hexokinase.
Hexokinase is typically higher in slow- twitch than in fast-twitch muscles (Henriksson
et al., 1986); in this case it was not significantly higher in stimulated samples
PA NA GIOTIS MA NOLOPO ULOS 91
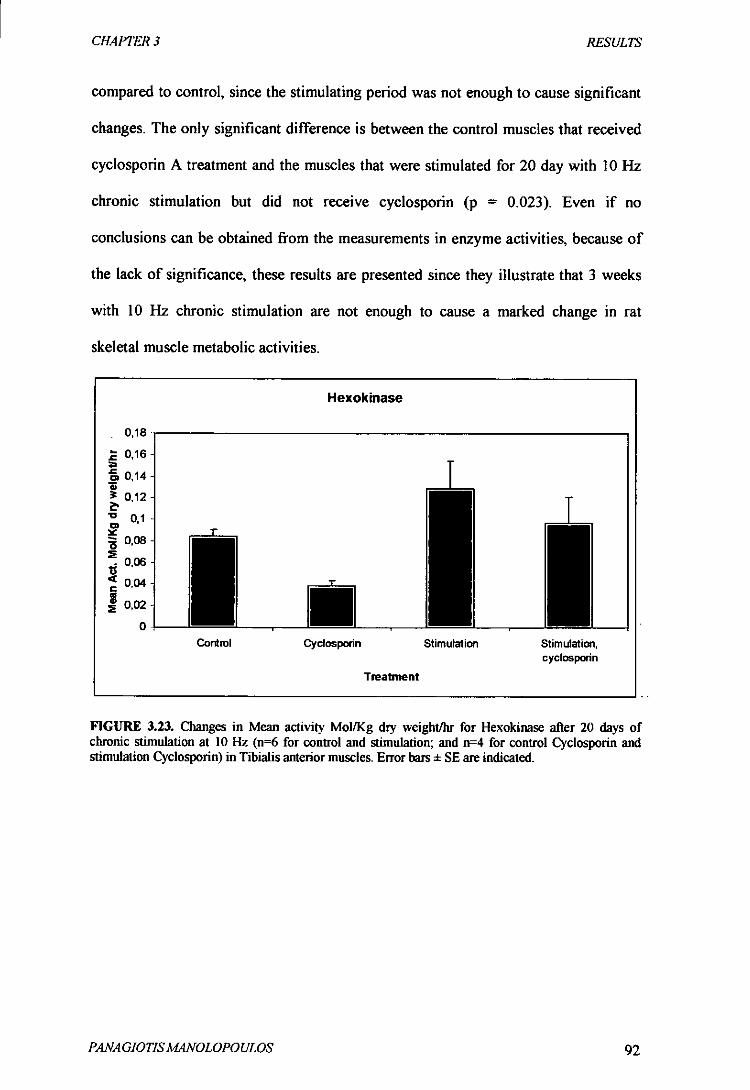
CHAPTER 3 RESULTS
compared to control, since the stimulating period was not enough to cause significant
changes. The only significant difference is between the control muscles that received
cyclosporin A treatment and the muscles that were stimulated for 20 day with 10 Hz
chronic stimulation but did not receive cyclosporin (p = 0.023). Even if no
conclusions can be obtained from the measurements in enzyme activities, because of
the lack of significance, these results are presented since they illustrate that 3 weeks
with 10 Hz chronic stimulation are not enough to cause a marked change in rat
skeletal muscle metabolic activities.
Hexokinase
0,18
0,16
0,14 C
012
0,1
0.08
006 ti
0,04
lio2. 0
Control Cyclospccin Stimulation Stimulation, cyclospodn
Treatment
FIGURE 3.23. Changes in Mean activity Mol/Kg thy weight/hr for Hexokinase after 20 days of chronic stimulation at 10 Hz (n=6 for control and stimulation; and n=4 for control Cyclosporin and stimulation Cyclosporin) in Tibialis anterior muscles. Error bars ± SE are indicated.
PANAGJOTJS/v14NOLOPOULQS 92

CHAPTER 3 RESULTh
3.2. Investigation of the effect of increased intracellular Ca 2 in
NFAT translocation on L6 Muscle cell cultures
3.2.1. The effect of Br-A23187 lonophore in intracellular calcium concentration
of L6 myotubes
The adult skeletal muscle has the ability to respond in changes of physiological
demands. This is achieved by switching from glycolytic to oxidative phenotype and
vice versa (Salmons and Sreter, 1976; Semsarian et al., 1999; Parry, 2001; Chin et al.,
1998; Olson and Williams, 2000). An increased intracellular calcium concentration,
caused by endurance training or chronic stimulation, would be expected to cause a
change towards the oxidative phenotype in a given skeletal muscle. This high degree
of plasticity in differentiated muscles is a remarkable illustration of adaptation.
A skeletal muscle L6 cell culture, after being established and characterised, was used
as a model, in order to investigate the underlying mechanisms that control muscle
plasticity. This was illustrated by observing the NFAT translocation, within the
Calcineurin pathway, as a result of increased intracellular calcium.
The effect of 4-bromo-calcium ionophore was investigated in the L 6 cell cultures.
This type of 4-bromo-calcium ionophore was used because it causes the release of
intracellular calcium from the SR, while it does not interact with the fluorescence of
Fura-2. A range of concentrations between 5 x10 9 - 8 x10⁴ M were tested as
illustrated in Figure 3.25. The results are presented in Ratios (F3401F380) since
FIJRA-2, which was used, displays a single peak at 500 nm, but two calcium-
dependent absorption maxima, one at 340 which increases with increasing ionised
calcium and a second at 380 nm which similarly decreases with a rise in ionised
calcium (Mason, 1993). This fluorometric method is shown in Figure 3.24 below.
PANAGIOTJSM4NOLOPOULOS 93

CHAPTER 3
RESULTS
340 nm
272.2
rtwl
Addition of 5x10 9 M 4 lao! I
r i0noou1
II I 140 I
R I 120
380 nm
S
Figure 3.24. Dual-wavelength photon counting measurements of intracellular calcium in L 6 myotubes stimulated with 5 x IV M 4-bromo-calcium ionophore and loaded with fura-2. Excitation wavelengths 340 and 380 mu, measurements in ratios v seconds.
a)
The effect of different calcium lonophore concentrations In 16 mtubes
6
5 —5OnM
a —1W nM
I: - ZO nM
—400 nM
—500 nM
—lOWnM
—2000nM
0 —4OWnM
—WnM
Time (sec)
I
S S
S 0.
40
ii I
0
IT 10DO 1
LogCcnftEn(nM)
b)
Figure 3.25. a) The cells were loaded for 50 miii at room temperature in the dark with 8 pM fun-?. Alter 10 miii equilibration time, [Ca2lbwk was monitored in a fluorometer and expressed as a ratio of fuorescence intensities at 340 and 380 nm (F 0/F) as described in Methods. The Paces represent the effect of 50 nM to 81LM 4-bromo-calcium ionophore concentrations on intracellular calcium changes. b) Changes in intracellular Calcium as an effect of 4-bromo calcium ionophore; presented as a dose response curve (n=3, error bars ± SD).
PANA G1OTISAL4NOLOPOULOS 94
CHAPTER 3 RESULTS
These results demonstrate that increasing the concentration of the ionophore increased
the intracellular free Ca concentration in a dose-dependent manner.
3.2.2. The effect of increased intracellular calcium in NFAT localization and
translocation
The cell Tine was in differentiation medium (a-MEM) when incubated for 24 hours
with 1 pM ionophore. This ionophore concentration was chosen after a series of
experiments, which revealed that this is the concentration, produced the optimal
intracellular calcium increase. This study revealed that higher ionophore
concentrations cause problems to cell function since cell death was observed in the
cell cultures. However, these observations were in contrast to the work of Meil 3ner
and co-workers (2001) who observed an NFAT translocation to the nucleus in
response to a 4 x io M ionophore concentration. These were pelimenary data and
were not included. When the Ca 2 ionophore (Br-A23 187) (1 jiM) was added to the
medium, a partial fast-to-slow transformation occurred, since NFAT transolocated to
the nucleus (Figure 3.27).
Initially, the localization of NFAT was investigated before ionophore treatment took
place. Immunohistochemical studies for NFAT, as described in the methods, were
performed using a secondary antibody with a Cy3 (fluorescent red) conjugate. The
study revealed that NFAT is almost entirely located in the cytosol in a resting state
(Figure 3.26: 1-3).
PANA GIOTIS MANOLOPO ULOS 95

CHAPTER 3
RESULTS
1.
2.
PA NA GIOTIS MA NOLOPO ULOS 96

CHAPTER 3
RESULTS
3.
Figure 3.26. Immunohistochemical photographs of L 6 myotubes in x40 magnification. 1-3 Cell
cultures were grown (as described in the methods section) for about 9 days on petridishes and then for
5 more days on glass coverslips. They were then fixed and stained for NFAT. Photograph I illusintes
control samples. 2 DAN stain of the section shown in picture 1. 3. Overlay picture of the section
shown in pictures I and 2, which illustrates NFAT and DAY! stain respectively. NFAT is localised
almost entirely in the cytosol. (n=7)
The second part of the study involved the investigation of a possible NFAT
transolocation after incubation for 24 h with I l M 4-bromo-calcium ionophore. A
variety of ionophore concentrations (Figure 3.25), were tested in a pelimenary study
indicating this concentration (I gM) to be the optimal.
PA NA GIOTIS MANOLOPO UL OS 97

CHAPTER 3
RESULTS
A.
1!
PANAGIOTISMANOLOPOULOS 98

CHAPTER 3
RESULTS
C
I. U.
Figure 3.27. Immunohistochemical photographs of 4 myotubes in a x40 magnification. The cell
cultures were grown for about 9 days on peiridishes and then for 5 more days on glass coverslips. They
were then cultured for one more day (24 h) in the presence of Ca 2 ionophore Br-A23 187 (1 1iM) on
glass coverslips, fixed and stained for NFAT. Photographs A and B illustrate NFAT and DAPI stain
respectively for the same section, while C is an overlay picture of the two. NFAT translocation is
demonstrated (n=3) IlL Control culture that did not receive any treatment D.iL Overlay picture of the
control section shown in Figure DL, which illustrates NFAT and DAN stain respectively. NFAT is
localised almost entirely in the cytoplasm. (ir3)
PANA GIOTIS MANOLOPOULOS 99

CHAPTER 3 RESUL7Y
Figures 3.27 A.B,C illustrate that NFAT is localised almost entirely in the nucleus after
the Lonophore treatment. An overly of Figures 3.27 A, B shows (presented as Figure
3.27 c) that NFAT is located were the DNA lays hence in the nucleus.
In conclusion, the experiments performed in myotubes as shown before, have
established the effect of various ionophore concentrations in the intracellular calcium
stores. These changes cause a rise in the cytosolic calcium concentration, activating
the calcineurin pathway (Figure 1.20 in Chapter 1-Introduction) by binding to
calmodulin (Chin et al., 1998). This pathway is thought to switch on slow genes and
cause the production of type I proteins (Olson and Williams, 2000 a,b). In addition,
this hypothesis can be confirmed by investigating the NFAT kinetics within the
myotubes of the L6 cell line. As mentioned before NFAT in phosphorylated by
Calcineurin A (CnA), which exposes its "nuclear localization signal" causing it to
translocate to the nucleus with CnA bound to it, and in turn causing slow gene
activation and hypertrophy in skeletal muscles (in combination with other
transcription factors like MIEF2, GATA2) (Chin et al., 1998; Olson and Williams,
2000; Dunn, Chin, and Michel., 2000). Finally, all the results presented in this study
will be fUrther explained and discussed in the next chapter.
PA NA GIOTIS MA NOLOPO ULOS 100

CHAPTER 4
DISCUSSION
DISCUSSION
4.1. Induction of a fast- oxidative phenotype by chronic muscle stimulation
and investigation of the effect of cyclosporin A : histochemical and metabolic
studies
4.1.1 Effect of chronic stimulation on muscle fiber differentiation
4.1.2 Effect of chronic stimulation in Calcineurin content of different muscle fiber
types
4.1.3 The effect of chronic stimulation on enzyme activities of four metabolic
pathways
4.2. Investigation of the effect of increased intracellular Ca 2 in NFAT
translocation on L6 Muscle cell cultures
PA NA GIOTIS MA NOLOPO ULOS 101

CHAPTER 4
DISCUSSION
DISCUSSION
4.1. Induction of a fast- oxidative phenotype by chronic muscle stimulation
and investigation of the effect of cyclosporin A : histochemical and metabolic
studies
4.1.1 Skeletal muscle Plasticity: Effect of chronic stimulation on muscle fiber
differentiation
Skeletal muscle has the ability to adapt specifically to chronic exercise. Olson and
Williams (2000) have suggested that "skeletal myofibers exhibit highly specialized
characteristics with respect to size, metabolism, and contractile function" (Olson and
Williams, 2000). These changes, when it comes to protein isoforms and quantities,
have been established in the past (Saltin and Gollnick, 1983).
Skeletal muscle makes up 71% of the total hindlimb mass of the rat. Of this, 76% was
occupied by fast-twitch glycolytic (type 11A) fibers, 19% by fast-twitch oxidative
glycolytic (type Jib) fibers, and 5% by slow-twitch oxidative (type I) fibers
(Armstrong and Phelps, 1984). Thus, the fast-twitch glycolytic (type hA) fiber type is
clearly the predominant fiber type in the rat hindlimb in terms of muscle mass. The
results of this study taken from the TA muscle samples agree with the Armstrong and
Phelps study outcomes, since type ila fibers cover the 70% of the muscle, while type I
and type JIb cover about 15% and 15% respectively (Figures 3.1-3.4). The following
table illustrates the percentage of the three different fiber types in some specific
muscles of the rat (Armstrong and Phelps, 1984). Figure 100 (which is located in
PANAGIOTISMANOLOPOULOS 102

CHAPTER 4 DISCUSSION
Appendix 1) illustrates the anatomy of the muscles located in the lateral surface of the
lower leg and the extensor surface of the rat foot (which were used for
experimentation) (Greene, 1959).
Table 4.1 The percentage of the three different fiber types in some specific muscles of the nit (as cited in Annstrong and Phelps, 1984).
Soleus 13±4 0 87±4 TA red 57±8 38±9 5±1
TA white 27±6 72±6 1±1 EDL 42±7 56±8 2±1
The majority of mammalian muscles contain muscle fibers with a mixture of myosin
(myosin heavy chain MHC and light chain MLC) isoforms (Mayne et al., 1996; Jarvis
et al., 1996). Some of the clearly identifiable fiber types though, demonstrate
intermediate properties, so they sometimes might appear to be of the fast or the slow
type but they share qualities. These fibers have been shown to be the type ha fibers,
which have both a fast contractile speed and a well-developed oxidative metabolism.
Every muscle fiber type has its own type of innervation. Type I fibers are innervated
by the type I motor neurons with postural activity, while fast type rIb fibers are
innervated by the high frequency burst motorneurons. On the other hand, fast ha
fibers have a different type of innervation than the two since they have mixed
properties (Jarvis et al., 1996; Olson and Williams, 2000). When stimulating a muscle
is very important to know that it is not just the frequency but also the duration and the
aggregate number of impulses delivered to the muscle that can determine that level of
differentiation (Jarvis et al., 1996).
This study, among other things, is investigating the role of the Calcineurin signalling
pathway in the adaptive capacity of fast rat skeletal muscle when stimulated
PANAGIOTISMANOLOPOULOS 103

CHAPTER 4 DISCUSSION
chronically with 10 Hz for a period of 3 weeks. Histochemical evidence illustrate that
the small population of type I fibers normally found in the control muscles showed no
marked increase after 3 weeks of stimulation, instead they decreased about 20% in
average. On the other hand, the fast fiber population had the histochemical appearance
of type ila fibers, which increased about 30 1/o, with a marked decline in fast type JIb
(1 O%)and IN fibers (Figures 3.1 and 3.2). Mitochondrial stain revealed a marked
increase in mitochondrial content (Figures 3.5 and 3.6). The fibers which were
chronically stimulated with 10 Hz could be classified as slow type I fibers. The other
histochemical results obtained from the ATPase stain argue with the previous
observation since they show no increase of slow fibers, even though they illustrate
(Figures 3.1 and 3.2) a lack of fast type lIb fibers. This indicates that the first aspect
influenced by chronically stimulating muscle fibers (10 Hz) is the mitochondrial
content. Stimulating the rat skeletal muscle for 3 weeks seems to be inadequate to
cause a marked increase in the slow fiber population. Even though there was not a big
increase in type I fiber population, based on these histochemical data cyclosporin A
(CsA) was not able to prevent neither the decrease of the fast fibers (type lIb) (Figures
3.3 and 3.4) nor the increase in the mitochondrial content of all the fibers in the
stimulated muscles (Figures 3.7 and 3.8). Another important observation is reduction
of the muscle fiber size as well as the changes in the shape, which are thought to be
caused by endurance exercise (Figures 3.2, 3.4, 3.6 and 3.8). It has also been observed
that there is a difference in the muscle fiber composition, especially in the Tibialis
Anterior muscle samples, between the central and peripheral parts of the rat muscle.
For this reason, the results presented are from the same part of the muscle (Figures
3.1-18). Purely histochemical data can be misleading (Mayne et al., 1996) and for
PANAGIOTISM4NOLOJ'OULQS 104

CHAPTER 4 DISCUSSION
this reason further immunohistochemical as well as metabolic studies were
performed.
Furthermore, similar (mostly in rabbit muscle) studies have illustrated that after
continuous stimulation at a frequency of 10 Hz for a period more than 10 weeks, the
properties acquired by the fast-twitch fibers of these muscles are more closely related
to those of slow-twitch, or type I, fibers (typical slow muscle isoform composition). In
addition, they have slow contractile speed; they show remarkable resistance to
fatigue, have well-developed blood supply and predominately oxidative metabolism
(Mayne et al., 1996; Pette and Vrbovã, 1992; Salmons and Henriksson, 1981).
4.1.2 Effect of chronic stimulation in the Calcineurin content of different
muscle fiber types
The first part of the study involved the investigation of muscle adaptation. This type
of study though does not provide any data that help explain the signaling processes in
molecular level, which link contraction patterns to specific gene regulation. This
second part investigates the calcineurin pathway involved in muscle fiber
differentiation (Chin et al., 1998) and more specifically the differences in calcineurin
concentration between slow and fast fibers.
Calcineurin is a serin-threonine protein phosphatase that has been shown to be
activated by increased intracellular free calcium levels (Chin et al., 1998; Olson and
Williams, 2000). When calcineurin is activated dephosphorylates the nuclear factor of b
activated T cells (NFAT). This dephosphorylation results in the exposure of NFATs
nuclear localization sequence and its nuclear translocation (Meij3ner et al., 2001).
Nuclear NFAT binds DNA at the specific NFAT enhancer sequences located in the
regulatory regions of the "slow" skeletal muscle genes (Chin et al., 1998).
PANAGIOTISM4,VOjLOpQULOS 105

CHAPTER 4 DISCUSSION
The combination of immunohistochemical staining and western blotting for
Calcineurin A, has revealed a marked difference in concentration between slow and
fast fibers (Figures 3.9- 3.15). For the immunohistochemical technique, a specific
primary antibody for CnA and a specific secondary antibody for the primary
mentioned before were used. Differences in the fluorescence among fibers (as a result
of the fluorescent secondary antibody) were interpreted as differences in the
Calcineurin content among the different fiber types. In turn Western blot technique
was used in order to identify whether type I-slow fibers or type lI-fast fibers contain a
higher amount of the Calcineurin protein. Western blotting was proven to be very
useibI and consistent technique, since substantial difficulties were experienced when
muscle fiber were to be identified through a combination of immunohistochemical
and ATPase staining in order to justify which fiber type contains more of the protein.
As illustrated in Figure 3.1 &B , there is up to 8 times more calcineurin (relative
concentrations) in the control muscles than in the stimulated. This indicates that fast
fiber types contain a higher concentration of the protein. Calcineurin pathway seems
to be down regulated in the muscle samples that received 10 Hz chronic stimulation
for 3 weeks. The maintenance of a high intracellular calcium concentration, which we
would expect as a result of chronic stimulation (chronic stimulation imitates the slow-
glycolytic motor neuron firing) (Olson and Williams, 2000), in turn results in a
constantly activated calcineurin pathway. It seems that a homeostatic mechanism
causes the down-regulation of the calcineurin pathway, which is interpreted as a
reduction of the calcineurin concentration.
A very important study by Chin et al. (1998) identified that fiber type specific gene
expression in skeletal muscles is controlled by the calcineurin signaling pathway. This
PANA GIOTIS MANOLOPO ULOS 106

CHAPTER 4 DISCUSSION
pathway was shown to selectively up-regulate slow fiber specific gene promoters. The
transcription factors identified, that mediate the transcriptional activation involving
the slow genes, were of the NFAT and MEF2 families. Finally, this study investigated
the inhibitory effect of Cyclosporin A on the calcineurin pathway, and revealed that
the drug prevents the slow-to-fast transformation (Chin et al., 1998). Swoap and
coworkers (2000), in contradiction to Chin et al.'s hypothesis, have presented data
showing that apart from the slow gene activation the calcineurin pathway could
increase the expression of some fast genes (Swoap et al., 2000). Additional evidence
illustrates that the calcineurin pathway is involved in IGF-1 induced skeletal muscle
hypertrophy (Semsarian et al., 1999), which are in contradiction to the Swoap et al.
(2000) study. All these studies show that the actual role of Calcineurin in skeletal
muscle plasticity is yet to be clarified. In addition, investigating the activation of other
pathways, also caused by a potential calcium increase, is essential and has to be taken
under consideration. There has been clear evidence for connections between signal
transduction pathways, known as "cross-talk," which have been shown to effect
muscle fiber differentiation. Some of these pathways "switch on" at the same with the
calcineurin pathway since they are also calcium activated and obviously can either
contribute or resist the fast-to-slow conversion of a chronically stimulated fast skeletal
muscle. An important category of pathways, which are also thought to be calcium
activated and cause slow gene transcriptional activation, is the MAPK/ERK kinase
(MEK1) pathways (Perry et al., 2001; Cox, Quinn and McDermott, 2000; Cruzalegui
and Bading, 2000; Treisman, 1996). There are three distinct classes of MAPKs the
extracellular signal regulated kinases (ERKs), the c-Jun NH2- terminal Kinases/stress
activated protein kinases (INK SAPKs), and the p38 MAPKs (Cox, Quinn and
McDermott, 2000). These different MAPK pathways have been characterized, based
PA NA GJOTJS MANOL OPO UL OS 1 107

CHAPTER 4 DISCUSSION
on their initial receptors, to be responsive to mitogein (ERKs) or to cellular stress,
such as p38 and JNK MAPKs, which are all calcium related responses (Cox, Quinn
and McDermott, 2000; Cruzalegui and Bading, 2000; Treisman, 1996). In addition,
there is MyoD family (Parry, 2001; Cox, Quinn and McDermott, 2000), which
consists of four members: MyoD, Myf-5, myogenin, and MRF4 and are all expressed
exclusively in skeletal muscle cells. There has been evidence that an up-regulated
expression of MyoD causes a slow-to-fast differentiation, since it translocates to the
secondary myonuclei and induces transcription of MHC lIb (Parry, 2001). Moreover,
there is also evidence for cross-talk between the insulin and p38 signaling pathways
(Blair et al., 1999). All these and more signaling pathways have been shown to induce
gene expression and interact with each other (Cross-talk) in heart muscle, which
unfortunately is not comparable to skeletal muscle (Molkentin and Dorn II, 2001).
Finally, it is essential to identify the stimulating patterns that cause different calcium
responses in the skeletal muscle cells, which in turn trigger different signal
transduction pathways. It is therefore clear that muscle fiber differentiation is not just
controlled by calcineurin pathway but instead is mediated by an interlinked network
of several contraction-responsive signal transduction pathways.
4.1.3 The effect of chronic stimulation on enzyme activities of four metabolic
pathways
Glycolysis is the chain of chemical reactions involved in the breaking down of the
sugars. In the first stage of cellular respiration, occurring with or without the presence
of oxygen, glucose is converted to two molecules of pyruvic acid. The final energy
gain from the glycolysis occurs in the hydrolysis of phosphoenolpyruvate to pyruvate
and the concomitant phosphorylation of ADP to ATP. For every molecule of hexose
PANAGIOTISMANOLOPOULOS 108

CHAPTER 4 DISCUSSION
phosphate consumed, two molecules of ATP are produced to flnall' bring the net
yield of ATP to two molecules for each molecule of glucose (Zubay et al., 1995).
In order for glycolysis is to continue the pyruvate produced must be fbrther
metabolised. A molecule of NAD is reduced for every molecule of
phosphoglyceraldehyde that is oxidized and this procedure is essential for its
regeneration. Because equimolar amounts of NADH and pyruvate are produced in
glycolysis, a simple way to reoxidize the NADH is by transfer of electrons to
pyruvate, forming lactate. Skeletal muscle tissue uses this strategy in times of exertion
when the oxygen supply is not enough in order to keep up with the energy
requirements of the tissue. The reduction of pyruvate is catalysed by the enzyme
lactate dehydrogenase (LDH) (Zubay et al., 1995). Moreover, carbohydrate
metabolism is controlled in part by creatine Idnase (CK) one of the high energy
phosphate transfer enzymes. On the other hand, other enzymes investigated were
malate dehydrogenase and hexokinase, which are involved in the final oxidation step
of the TCA cycle and glycogen metabolism respectively.
The observations made in this study involved the continuous stimulation of rat
skeletal muscle for a period of 3 weeks. The investigation of the metabolic changes,
were interpreted as changes in four enzyme activities belonging to different metabolic
pathways (as mentioned before). In all the enzymes investigated in this study, there
are no significant changes in enzyme activities after stimulating for 3 weeks at 10 I-Ia,
even though the changes occur towards the 'expected' direction, based on the similar
published experiments (Henriksson et al., 1986; Mayne et al., 1996; Chi et al., 1986;
Meij3ner et al., 2001). Henriksson and co-workers (1986) have suggested that " a
transformation takes place within individual muscle fibers and not through a process
PANAGIOTISM4NOLOpOULOS 109

CHAPTER 4 DISCUSSION
of degeneration and regeneration that would affect the relative proportions of fiber
types but not their terminal state of differentiation" (Henriksson et al., 1986).
Both oxidative and glycolytic enzymes have been shown to be affected in other
studies of endurance training, where the muscle were chronically stimulated at low
(2.5 Hz) and high (10 Hz) frequencies for up to 10 weeks (1-Ienriksson et al., 1986;
Mayne et al., 1996; Chi et al., 1986; Meif3ner et al., 2001). This study illustrates a
progressive but insignificant decline both in Lactate Dehydrogenase and Creatine
kinase levels between control and stimulated muscles. Even though the reduction in
activity can be concluded from figures 3.17 and 3.19, is not though statistically
significant within the first 3 weeks. On the other hand, Ma/ate Dehydrogenase (MDII)
and Hexoidnase (HE%7 activities, varied in an increasing but still insignificant fashion
towards the stimulated muscles compared to controls (Figures 3.21 and 3.23). In
addition, no marked changes, apart from lactate dehydrogenase, were detected when
cyclosporin was used in combination to stimulation.
The study by Henriksson and co-workers (1986) illustrated the effect of 10 Hz
chronic stimulation in many enzyme activities, among which are the ones investigated
in this study. The study presented marked changes in all the above enzymes within the
first 3 weeks. The reason for this difference might be explained by the fact that rabbit,
which Henriksson and co-workers used, is very different animal model compared to
rat skeletal muscle. In this last animal model (Rat) it is very difficult to get any
changes in enzyme activities within 3 weeks, because it requires a longer period of
stimulation (Jarvis et at., 1996). Any attempt to compare the results obtained in this
study with similar studies performed in rabbit would be impossible, since for the same
period of chronic stimulation the changes would be much higher and definitely
significant (Henriksson et al., 1986; Mayne et al., 1996; Chi et al., 1986; Mefl3ner et
PANAGIOTISMANOLOPOULOS 110

CHAPTER 4 DISCUSSION
al., 2001). Finally, the lack of significance in the recordings of the enzyme activities
for this study makes conclusions impossible. Even though a rise in the mitochondrial
content has been established (Figures 3.5- 3.8) the only conclusion is that the 3 weeks
stimulation period was insufficient, in order to cause a marked change in the
metabolism of the muscles investigated although the techniques demonstrated here
have shown to be the valid approach to the study of transformations.
4.2. Investigation of the effect of increased intracellular Ca 2 ' in NFAT
translocation on L Muscle cell cultures
Motorneurons and their activity play an essential role in muscle fiber determination
and differentiation. It has been shown that muscle fiber differentiation and fast-to-
slow transformation can be triggered by cross-innervation or chronic stimulation
(Salmons and Sreter, 1976; Pette, 1984; Henriksson et aL, 1986; Mayne et al., 1996;
Chi et al., 1986). In addition, data demonstrating the importance of [Ca211 changes,
were presented in studies using muscle cell cultures as a model of investigation
(Seigneurin et al., 1996). Calcium ionophore treatment has been shown to lead to a
reversible fast-to-slow transformation in cultured muscle cell lines (Mei3ner et al.,
2001; Friday, Horsley, and Pavlath, 2000; Kubis et al., 1997). It has also been shown
the ionophore treatment induces fiber transformation and not a hypertrophic response
(Meij3ner et al., 2001). This ionophore-induced transformation is comparable to
chronic low frequency stimulation (Salmons and Sreter, 1976). Friday, Horsley, and
Pavlath (2000), in their study present data suggesting that at least three distinct steps
require calcium, based on their differing requirements for extracellular calcium:
commitment to differentiation, phenotypic differentiation, and cell fusion (Friday,
Horsley, and Pavlath, 2000). A different study by Dolmetsch and co-workers (1997)
PA NA GIOTIS MA NOLOPO ULOS 111

CHAPTER 4 DISCUSSION
suggests that changes in intracellular calcium differing in amplitude and duration
result in differential activation of transcription factors in lymphocytes (Dolmetsch et
al., 1997). In addition, it has been shown that a low sustained plateau in the level of
[Ca2 '] leads to the activation of NFAT, while large a large transient rise lead to the
activation of a different transcription factor NFkB (Meiner et al., 2001). Finally,
Chin and co-workers has shown that similar mechanisms are involved in the
regulation of fiber type specific gene expression in skeletal muscle (Chin et al., 1998).
The molecular mechanisms though, which initiate differentiation of myoblasts are not
well understood.
There is evidence illustrating that calcium -calmodulin-regulated serine-threonine
phosphatase calcineurin plays a key role in calcium dependent signalling in rabbit
skeletal muscle cell culture (Meij3ner et al., 2001). A calcium ionophore addition of
lx 10 M has been shown to produce a steady but not unphysiologically high
intracellular calcium plateau increase (Figure 3.25). This study presents data showing
the effect of this intracellular calcium plateau increase on the calcineurin pathway and
muscle fiber differentiation. Immunohistochemical results presented on Figures 3.26
1-3. and 3.27: Di,ii. , illustrate that in a resting state of the L5 myotubes NFAT is
localised almost entirely in the cytosol. The increase in intracellular calcium caused
by the ionophore addition (I x I0 M) in the cell line, resulted in the activation of the
calcineurin pathway. The elevated calcium bound to the calmodulin domain of
calcineurin causing its activation. Calcineurin in turn phosphorylated NFAT exposing
its nuclear localization sequence and resulting in its translocation to the nucleus. The
NFAT translocation was immunohistochemically detected using a fluorescent
secondary antibody (Figures 3.27: A, B and Q. Moreover, Abbott et al. (1998) have
suggested that in muscle cells (in contrast to lymphocytes) each NFAT isoform (as
PANAGIOTISMANOLOPOULOS 112

CHAPTER 4 DISCUSSION
described in the introduction) undergoes nuclear translocation only at specific stages
of myogenesis, which suggests that they may regulate distinct subsets of genes
necessary for muscle cell physiology (Abbott et al., 1998).
Furthermore, in L6 cell cultures like in skeletal muscle research, all the possible
interactions of the calcineurin pathway with other signalling pathways have to be
taken under consideration. This means that other transcription factors mentioned
before like MEF2, or GATA2 (during IGF-induced skeletal muscle hypertrophy) are
involved in the calcineurin pathway and muscle fiber differentiation in muscle cell
cultures (Abbott et al., 1998; Mei0ner et al., 2001; Musaro, et al., 1999), but their
exact relationship is yet to be determined.
CONCLUSION
In summary, this study has defined a calcium-dependent pathway that regulates the
commitment of both skeletal muscle and myoblasts to the differentiation pathway.
Calcineurin activity is both necessary and sufficient to induce differentiation in the
presence of adequate extracellular calcium environment. In rat skeletal muscle, 10 Hz
of chronic electrical stimulation for 3 weeks resulted in a marked reduction of the fast
fiber type family. In addition, the same stimulation patter caused a marked increase in
the mitochondrial content of the fibers but still was not able to elicit a significant
metabolic change. The calcineurin pathway was down regulated as a result of chronic
stimulation indicating adaptation. Moreover, there is strong evidence concerning the
calcineurin content of different fiber types, since it appears to be significantly higher
in fast fibers. Even though the time period for this stimulations pattern was
insufficient to cause marked changes in the metabolism of the skeletal muscles of the
PANAGIOTISA'L4NOLOPOULOS 113

CHAPTER 4
DISCUSSION
rat, histological studies revealed that cyclosporin A was unable to prevent the fast-to-
slow transformation. In L6 myocytes evidence support the relation between the
increased intracellular calcium and NFATcI translocation and possibly DNA binding
through the calcineurin pathway. Finally, further studies will identify and clarif' the
upstream signals that regulated calcium changes and trigger the activation of different
signalling pathways as well as the downstream targets of calcineurin in skeletal
muscle.
Scope for further studies
I. Histochemical and metabolic studies in rat skeletal muscle after the effect of
10 Hz chronic stimulation for 10 weeks. Investigation of the effect of
cyclosporin A under these conditions.
2. Investigate the involvement of calcineurin-dependent signalling pathways in
controlling the expression of MHCI, MHCIIa and MHCITh under the effect of
chronic stimulation in rat skeletal muscle. Investigate the effect of cyclosporin
A under this treatment.
3. Investigate the NFAT kinetics under the effect of various intracellular calcium
changes in Ls skeletal muscle cells.
4. The effect of different intracellular calcium changes on a range of
transcription factors such as NFkB, ERKs, c-jun, p38 kinetics and Jak/STAT
in L6 skeletal muscle cells. In this study, western blots can be used in order to
identif' the protein in the skeletal muscle and secondly investigate if there are
differences in relative concentration between fast and slow muscle. In
addition, by using cytosolic and nuclear extractions of fast and slow muscle is
PANAGIOTISMANOLOPOULOS 114

CHAPTER 4
DISCUSSION
possible to investigate the kinetics of the mentioned proteins if they indeed
translocate to the nucleus as a results of calcium changes. Different patterns of
calcium increases (plateau or spiking patterns) and a variety of intracellular
concentrations can be investigated using the same model. Additional and more
accurate information could be obtained by using Northern blotting techniques
for RNA.
5. Finally, with the given technology it possible to investigate the activity of
every single gene in a given sample by using Microarrays. This technique
enables us to investigate whether genes involved in skeletal muscle
hypertrophy or fiber differentiation are activated after a given treatment. It is
also possible to block gene activity ("knocking out genes") and investigate the
importance of a certain gene in muscle fiber differentiation.
PANAGIOTISMANOLOPOULOS 115

REFERENCES
Abbott, K.L., Friday, BR., Thaloor, D., Murphy, T.J., and Pavlath, O.K. (1998).
Activation and cellular localization of the Cyclosporin A-sensitive transcription factor
NFAT in skeletal muscle cells. Molecular Biology of the Cell. 9: 2905-29 16.
Airey, J.A., Baring, M.D., and Sutko, J.L. (1991). Ryanodine receptor protein is
expressed during differentiation in the muscle cell lines BC3H1 and C2C12. Dev.
Biol. 148: 365-374
Allen, D.G., Lee, J.A., and Westerblad, H. (1989). Intracellular calcium and tension
during fatigue in isolated single muscle fibres from Xenopus laevis .J.PhysioL (Lond.)
415:433-458
Aramburu, J., Azzoni, L., Rao, A., Perussia, B. (1995). Activation and expression of
the nuclear factor of activated T cells, NFATp and NFATc, in human natural killer
cells: regulation upon CD16 ligand binding. J. Exp. Med 182: 801-10
Armstrong, R.B., Phelps, R.O. (1984). Muscle fiber type composition of the rat
hindlimb. The Amer. J. ofAnat. 171: 259-272
Baechle, TB., (1994). Essentials of strength training and conditioning. Creightón
University, Omaha, Nebraska. National strength and conditioning association.
PANAGIOTISMANOLOPOULOS 116

REFERENCES
Balogh, S., Naus, C.G., Merrifield, P.A. (1993). Expression of gap junctions in
cultured rat L6 cells during myogenesis. Dev. Blot 155: 35 1-360
Barford, D. (1996). Molecular mechanisms of the protein serine/ threonine
phosphatases. Trends Biochem. Sd. 21: 407-412.
Bennett, A.M., Tonks, N.K. (1997). Regulation of distinct stages of skeletal muscle
differentiation by mitogen-activated protein kinases. Science. 278(5341): 1288-91
Berridge, M.J. (1993). Inositol trisphosphate and calcium signalling. Nalure 316: 315-
325
Blair, A. S., Hajduch, E., Litherland, G. J., and Hundal, H. S. (1999). Regulation of
glucose transport and glycogen synthesis in L6 muscle cells during oxidative stress.
Evidence for cross-talk between the insulin and SAPK2/p38 mitogen-activated
protein kinase signaling pathways. J.BiotChem. 274, 36293-36299.
Boss, V., Talpade, D.J., Murphy, T.J. (1996). Induction of NFAT-mediated
transcription by Gq coupled receptors in lymphoid and non-lymphoid cells. I. Blot
Chein. 271: 10429-32
Brooke, M.H., and Kaiser, K.K. (1970). Three "myosin adenosine triphosphatase"
systems: The nature of their pH lability and sulfhydryl dependence. J. Histochem.
Cytochem., 18: 670-672
PA NA GIOTIS MA NOLOPO ULOS 117

REFERENCES
Brooke, M.H., Kaiser, K.K. (1970). Muscle fiber types: How many and what kind?
Arch.Neurol. 23: 369-3 79.
Bullock et al., (1986). Energy for movement-muscle function. The open university
press. Biochemist,y and cell biology.
Burkitt, H.G., Young, B., Haeth, J.W. (1993). Wheater's Functional Histology: A text
and colour atlas. Third edition. Edited by Churchill Livingstone.
Cantrell D. (1996). T cell antigen receptorsignal transduction pathways. Annu. Rev.
Immunol. 14: 259-74
Catterall, W.A. (1991). Excitation-contraction coupling in vertebrate skeletal muscle:
a tale of two calcium channels. Cell 64: 871-874
Chen, W., Steenbergen, C., Levy, L.A., Vance, J., London, RE., and Murphy, E.
(1996). Measurement of free Ca 2 in sarcoplasmic reticulum in perfused rabbit heart
loaded with I ,2-bis(2-amino-5,6-ditlurophenoxy)ethane-N,N,N',N'-tetraacetic acid
by ' 9F NMR. I Biol. Chem. 271: 7398-7403
Cheng, B., Karamizrak, 0., Noakes, T.D., Dennis, S.C., Lambert, E.V. (1997). Time
course of the effects of a high-fat diet and voluntary exercise on muscle activity in
long-evans rats. Physiol. Behav. 61(5):701-5
PANAGJOTISMJ4NOLOPOULOS 118

REFERENCES
Chi, M.M.-Y., Hintz, C.S., Henriksson, J., Salmons, S., Hellendahl, R.P., Park, J.L.,
Nemmeth, P.M., and Lowry, O.H. (1986). Chronic stimulation of mammalian muscle:
enzyme changes in individual fibers. Amer. Physiol. Soc. C633-C642
Chin, E.R., and Allen, D.G. (1996). Changes in intracellular free Ca +2 concentration
during constant 10 Hz stimulation of mouse single skeletal fibers. Physiologist 39: A-
75
Chin, E.R., Olson, E.N., Richardson, J.A., Yang, Q., Humphries, C., Shelton, J.M.,
Wu, H., Weiguang, Z., Bassel-Duby, R., and Williams, R.S. (1998). A calcineurin-
dependent transcriptional pathway controls skeletal muscle fibre type. Genes and
Development 12: 2499-2509
Choi, M.S.K., Brines, RD., Holman, M.J., Klaus, G.G.B. (1994). Induction of NFAT
in normal B lymphocytes by anti-immunoglobulin or CD40 ligand in conjunction
with IL-4. Immunity!: 179-87
Chow, C.-W., Rincon, M., Cavanagh, J., Dickens, M., and Davis, Rj. (1997). Nuclear
accumulation of NFAT4 opposed by the iNK signal transduction pathway. Science,
278: 1638-1641.
Chytil, M., Verdine, G.L. (1996). The Rel family of eukaryotic, transcription factors.
Curr. Opin. Struct Riot 6: 91-100
PANAGIOTISMANOLOPOULOS 119

REFERENCES
Clipstone, N.A., Crabtree, G.R(1992). Identification of calcineurin as a key signalling
enzyme in T-lymphocyte activation. Nature 357: 695-697
Cockerill, G.W., Bert, A.G., Ryan, G.R., Gamble, J.R., Vadas, MA., Cockejill, P.N.
(1995). Regulation of granulocyte-macrophages colony-stimulating factor and
E-selectin expression in endothelial cells by cyclosporin A and the T-cell transcription
factor NFAT. Blood. 86: 2689-98
Cohen, P., Cohen, P.R.W. (1989). Protein phosphateses come of age. .1. Biol. Chem.
264(36): 21435-21438
Cox, D.M., Quinn, Z.A., McDermott, J.C. (2000). Cell signaling and the regulation of
muscle-specific gene expression by myocyte enhancer-binding factor 2. Exercise and
Sports Science reviews. 28: p33-3 8.
Crabtree G.R. (1989). Contingent genetic regulatory events in T lymphocyte
activation. Science. 243: 355-61
Crabtree, G.R. (1999). Generic signals and specific outcomes: signalling through
Ca2t calcineurin, and NF-AT. Cell 96: 611-614
Crabtree, G.R. (2000). Calcium, Calcineurin and the control of transcription. J. Biol.
Chem. Minireview
PJ4NAGIOTJSMANOLOPOULOS 120
REFERENCES
Crabtree, G.R., Clipsione, N.A. (1994). Signal transmission between the plasma
membrane and nucleus of T-lymphocytes. Aiim,. Rev. Biochem. 63: 1045-83
Cruzalegul, F.H., and Bading, H. (2000). Calcium-regulated protein kinase cascades
and their transcription factor targets. Cell Mol. Life Sc!. 57: 402-410
Cruzalegul, F.H., and Bading, H. (2000). Calcium-regulated protein kinase cascades
and their transcription factor targets. Cellular and Molecular Life Sciences. 57: 402-
410.
David, J.D., See, W.M., Higginbotham, C.A. (1981). Fusion of chick embryo skeletal
myoblasts: role of calcium influx preceding membrane union. Dev. BioL 82: 297-307
Desai, D.M., Newton, M.E., Kadlecek, T., Weiss, A. (1990). Stimulation of the phos-
phatidylinositol pathway can induce T-cell activation. Nature 348: 66-69
DiMario, J.X., S.E. Fernyak, and F.E. Stockdale. (1993). Myoblasts transferred to the
limbs of embryos are committed to specific fibre fates. Nature 362: 165-167.
Dirk, P. (1984). Activity- induced fast to slow transition in mammalian muscle.
Medicine and science in sports and exercise 16: 517-528
Dolmetsch, RE., Lewis, R.S., Goodnow, CC., and Healy, J.1. (1997). Differential
activation of transcription factors induced by Ca2+ response amplitude and duration.
Nature. 386: 855-858.
PA NA GIOTJS MA NOLOPO ULOS 121

REFERENCES
Dunn, SE., Bums, iL., Michel, R.N. (1999). Calcineurin is required for skeletal
muscle hypet-ti-ophy. J. Blot Chem. 274: 21908-21912
Dunn, SE., Chin, E.R., Michel, R.N. (2000). Matching of calcineurin activity to
upstream effectors is critical for skeletal muscle fiber growth. .1. Cell BIoL 151: 663-
672
Eisenberg, B. R., and S. Salmons. (1981). The reorganization of subcellular structure
in muscle undergoing fast- to- slow type transformation. Cell tissue Res. 220:449471
Ensembi e! Project: http://www.ensembl.org
Entwistle, A., Zalin, R.G., Bevans, S., Warner, A. (1988). The control of chick
myoblast fusion by ion channels operated by prostaglandins and acetylcholine. J. Cell
Riot 106: 1693-1702
Etzkorn, F.A., Chang, Z.Y., Stolz, L.A., and Walsh, C.T. (1994). Cyclophilin residues
that affect noncompetitive inhibition of the protein serine phosphatase activity of
calcineurin by the cyclophilin- cyclosporine A complex. Biochemistry. 33: 2380-2388
Fiering, S., Northrop, J.P., Nolan, UP., Mattila, P.S., Crabtree, G.R., Herzenberg,
L.A. (1990). Single cell assay of a transcription factor reveals a threshold in
transcription activated by signals emanating from the T-cell antigen receptor. Genes
Dev. 4: 1823-34
PANA GIOTIS MANOLOPO ULOS 122

REFERENCES
Fitts, RH., and Balog, E.M. (1996). Effect of intracellular and extracellular ion
changes on E-C coupling and skeletal muscle fatigue. Ada. Physiot Scand 156: 169-
181
Fosset, M., Jaimovich, E., Delpont, E., Lazdunski, M. (1983). [31-]nitrendipine
receptors in skeletal musclei. Blot Chem. 258: 6086-6092
Franzini-Amstrong, C. (1970). Natural variability in the length of thin and thick
filaments in single fibres from a crab, Portunus .1 Cell Blot 47: 488-499
Friday, B.B., Horsley, V., and Paviath, G.K. (2000). Calcineurin activity is required
for the initiation of skeletal muscle differentiation. I Cell Blot 149: 657-665
Ghosh, A., and Greeberg, M.E. (1995). Calcium signalling in neurons: molecular
mechanisms and cellular consequences. Science 268: 239-247
Ghosh, G., 'Van Duyne, G., Ghosh, S., Sigler, P.B. (1995). Structure of the NF-icB p50
homodimer bound to a icB site. Nature 373: 303-10
Ginty, D.D. (1997). Calcium regulation of gene expression: isn't that spatial? Neuron
18:183-186
PANAGJOTISM4NOLOPOULOS 123

REFERENCES
Goldberg, J., Huang, H., Kwon, Y., Greengard, P., Naim, A.C, Kurlyan, J. (1995).
Three dimentional structure of the catalytic subunit of protein serine/Threonine
phosphatase-1. Nature 376: 745-753.
Golinick, RD., Parsons, D., and Oakley, C.R. (1983). Differentiation of fiber types in
skeletal muscle from the sequential inactivation of myofibrillar actomyosin ATPase
during acid preincubation. Histochemistry 77: 543-555
Gonzalez-Serratos, H., Somlyo, A.V., McClellan, 0., Shuman, H., Borrero, L.M., and
Somlyo, A.P. (1978). Composition of vacuoles and sarcoplasmic reticulum in fatigued
muscle: electron probe analysis. Proc. Nail. Acad Sci. USA 75: 1329-1333
Greene, E.C. (1959). Anatomy of the rat. The American Physiological Soc. Hafner
Publishing Co., New York.
Griffith, J.P., Kim, J.L., Kim, E.E., Sintchak, M.D., Thomson, J.A., Fitzgibbon, M.J.,
Fleming, M.A., Caron, P.R., Hsiao, K., and Navia, M.A. (1995). X-Ray structure of
calcineurin inhibited by the immunophilin- immunosuppressant FKBPI2-FK506
complex. Cell 82: 507-522
Guyton, C. (1991). Textbook of medical physiology. 8th edition W.B. Saunders
company.
PI4NI4GJOTISMANOLOPOULOS 124

REFERENCES
Halseth, A.E., O'Doherthy, R.M., Printz, R., Bracy, D.P., Granner, D.K., and
Wasserman, D.H. (2000). Role of Ca 2 fluctuations in L6 myotubes in the regulation
of the hexokinase II gene. J. ApI!. Physiol. 88: 669-673
Hemenway, CS., and Heitman, J. (1999). Calcineurin: Strucure, Function and
Inhibition. Cell Biochem. And Biophys. 30: 115-51
Hennig, R., and Lomo, T. (1985). Firing patterns of motor units in normal rats.
Nature. 314: 164-166
Henriksson, J., M. M.-Y. Chi, C. S. Hintz, D.A. Young, K. K. Kaiser, S. Salmons, and
0. H. Lowry. (1986). Chronic stimulation of mammalian muscle: changes in enzymes
of six metabolic pathways. Am. J. Physiol. 251 (Ce!! physio! 20):C614-C632.
Ho, A.M., Jam, J., Rao, A., Hogan, P.G. (1994). Expression of the transcription factor
NFATp in a neuronal cell line and in the murine nervous system. J. BioL Chem. 269:
28,181-86
Ho, SN., Thomas, D.J., Timmerman, L.A., Li, X., Francke, U., Crabtree, G.R.
(1995). NFATc3, a lymphoid-specific NFATc family member that is
calcium-regulated and exhibits distinct DNA binding specificity. I BioL Chem. 270:
19898-907
PANAGIOTISMANOLOPOULOS 125

REFERENCES
Hoey, T., Sun, Y-L, Williamson ,K., Xu, X. (1995). Isolation of two new members of
the NFAT gene family and functional characterization of the NFAT proteins.
Immunity. 2: 461-72
Holloszy, JO. and E.F. Coyle. (1984). Adaptations of skeletal muscle to endurance
exercise and their metabolic consequences. I. App!. Physiol. 56: 83 1-838.
Http://attila. stevens-tech.edu/chebio/mjipping/structword.htm#references
Huang, C., Flucher, B.E., Schmidt, M.M., Stroud, S.K., and Schmidt, J. (1994).
Depolarization- transcription signals in skeletal muscle use calcium flux through L-
channels, but bypass the sarcoplasmic reticulum. Neuron 13: 167-177
Human Genome Project Working Draft (UCSC): http://genome.cse.ucsc.edu
Hundal, H.S., Ramall, T., Reyes, R., Lawerence, A.L., Klip, A. (1992). Cellular
mechanism of metformin involves glucose transporters translocation from an
intracellular pool to the plasma membrane in L muscle cells. EndocrinoL 131: No.3
1165-1173.
Hutchinson, L.E., McCloskey, M.A. (1995). FczRI-mediated induction of nuclear fac-
tor of activated T-cells. J. Biol. Chem. 270: 16333-38
lanuzzo, C.D., N. Hamilton, and B. Li. (1991). Competitive control of myosin
expression: Hypertrophy vs. Hyperthyroidism. J. AppL PhysioL 70:2328-2830
PA NA Gb TIS MANOLOPO UL OS 126

REFERENCES
Incerpi, S., Dc Vito, P., Luly, P., Rufini, S. (1995). Effect of ammodytin L from
Vipera ammodytes on L-6 cells from rat skeletal muscle. Bloc/i/mica et Biophysica
Acta 1268: 137-142
Jam, J., Burgeon, B., Badalian, TM., Hogan, P.G., Rao, A. (1995). A similar
DNA-binding motif in NFAT family proteins and the Rel homology region. 2 BioL
Chem. 270: 4138-45
Jam, J., Loh, C., Rao, A. (1995). Transcriptional regulation of the interleukin 2 gene.
Curr. Op/n. lmmunol. 7:333-42
Jam, J., McCaffrey, P.G., Miner, Z., Kerppola, T.K., Lambert, J.N., Verdine, G.L.,
Curran, 1., Rao, A., (1993). The T-cell transcription factor NFATp is a substrate for
calcineurin and interacts with Fos and Jun. Nature. 365: 352-55
Jarvis, J.C., and S.Salmons. (1991). A family of neuromuscular stimulators with
optical transcutaneous control. J. Med Eng. TechnoL 15:53-57.
Jarvis, J.C., H. Sutherland, C.N. Myane, S.J. Gilroy, and S.Salmons. (1996).
Induction of a fast- oxidative phenotype by chronic muscle stimulation; mechanical
and biochemical studies. Am. 2. Physiol. 270 (Cell physiol. 39): C306-C3 12.
Jarvis, J.C., Mokrusch, T., Kwende, M.M., Sutherland, H., Salmons, S. (1996). Fast-
to-slow transformation in stimulated rat muscle. Muscle Nerve. 11:1469-75
PA NA GIOTIS MA NOLOPO ULOS 127

Jung, S., Pfeiffer, F., and Deitmer, J.W. (2000). Histamine-induced calcium entry in
rat cerebellar astrocytes: evidence for capacitative and non-capacitative mechanisms.
J. Physiol. 527 (3) 549-561
Kamm, K.E., Stull, J.T. (1985). The function of myosin and myosin light chain
kinase phosphorylation in smooth muscle. Annu.Rev.Pharmacol. Toxicol. 25: 593
Karen DJ, Klaine SJ, Ross PE. (2001). Further considerations of the skeletal system
as a biomarker of episodic chlorpyrifos exposure. Aqua! Toxicol. 52:285-96
Karen, L.A., Friday, B.B., Thaloor, D., Murphy, T.J., and Pavlath, U.K. (1998).
Activation and cellular localization of the cyclosporine A-sensitive transcription
factor NF-AT in skeletal muscle cells. Molecular Biology of the Cell. 9: 2905-2916
Kawamura, A., Su, M.S-S. (1995) Interaction of FKBPI 2-FK506 with calcineurin A
at the B subunit-binding domain. J.Biol. Chem. 270(26): 15463-15466
Kelly, K., Siebenlist, U. (1995). Immediatearly genes induced by antigen receptor
stimulation. Curr. Opin. Immunol. 7: 327-32
Kissinger, CR., Parge, H.E., Knighton, D.R, Lewis, C.T., Pellertier, L.A.,
Tempozyk, A., Kalish, V.J., Tucher, K.D., Showalter, R.E., Moomaw, E.W., Gastinel,
L.N., Habuka, N., Chen, X., Maldonado, F., Barker, J.E., Bacquet, R., and Villifranca,
PANAGJOTJSMANOLOPOULOS 128

REFERENCES
J.E. (1995). Crystal structure of human calcineurin and the human FKBPI2- FK506-
calcineurin complex. Nature 378: 64 1-644
Klee, C.B. and krinks, M.H. (1978). Purification of cyclic 3', 5'-nucleotide
phosphodiesterase inhibitory protein by affinity chromatography on activator protein
coupled to sepharose. Biochemistry 17:120-126
Klee, C.B., Crouch, T.H., and Krinks, M.H. (1979). Calcineurin: a calcium-
calmodulin- binding protein of the nervous system. Proc.NalLAcacLSci. USA 76:
6270-6273
Klee, C.B., Ren, H., Wang, X. (1998) Regulation of calmodulin-stimulated protein
phosphatase calcineurin. .1. BIoL Chem. 273: 13367-13370
Klip, A., Li, G., Logan, W.J. (1984). Role of calcium ions in insulin action in hexose
transport in L6 muscle cells. Am. .1 PhysioL 247: 297-304
Kubis, H-P., HaIler, E-A., Wetzel, P., and Gros G. (1997). Adult fast myosin pattern
and Ca2 - induced slow myosin pattern in primary skeletal muscle culture. Proc.
•NatL Acad Sc!. USA. 94: 4205-4210.
Kyselovic, J., Leddy, J.J., Ray, A., Wigle, J., and Tuana, B. (1994). Temporal
differences in the induction of dihydropyridine receptor subunits and ryanodine
receptors during skeletal muscle development. .1 BioL C/tern. 269(34): 21770-21777
PANAGJOTISM4NOLOPOULOS 129

REFERENCES
Li, L., Helter-Harrison, R., Czech, M., and Olson, E.N. (1992). Cyclic AMP-
dependent protein kinase inhibits the activity of myogenic helix-loop-helix proteins.
MoL Cell Biol. 12: 4478-4485
Li, X., Ho, S.N., Luna, J., Giacalone, J., Thomas, D.J., Timmerman, L.A., Crabtree,
G.R., Francke, U. (1995). Cloning and chromosornal localization of the human and
murine genes for the T-cell transcription factor NFATc and NFATp. Cytogenet. Cell
Gene:. 68: 185-91
Liu, J., Albers, M.W, Wandless, T.J., Luan, S., Alberg, DO., Belshaw, P.J., Cohen,
MacKintosh, C., Klee, C.B., and Schreiber, S.L. (1992). Inhibition of T cell signaling
by immunophilin-ligand complexes correlates with loss of calcineurin phosphatase
activity. Biochemistry 31: 3896-3901
Lodish, H., Berk, A., Zipursky, S.L., Matsudaira, P., Baltimore, D., Darnell, J. (2000).
Molecular cell biology. Fourth edition. Media connected: W.H. Freeman and
company.
Loh, C., Carew, J.A., Kim, J., Hogan P.O., Rao, A. (1996 a). T-cell receptor
stimulation elicits an early phase of activation and a later phase of deactivation of the
transcription factor NFATI. Mol. CelL Riot 16: 3945-54
Loh, C., Shaw, K.T-Y., Carew, J., Viola, J.P.B., Loh, C., Perrino B.A., Rao, A. (1996
b). Calcineurin binds the transcription factor NIFATI and reversibly regulates its
activity..! BioL Chem. 271: 10884-91
PA NA GIOTIS MA NOLOPOULOS 130

REFERENCES
Lui, L.N., Dias, P., and Houghton, P.J. (1998). Mutation of Thri 15 in myoD
positively regulates function in murine fibroblasts and human rhabdomyosarcoma
cells. Gel/growth Differ. 9: 699-711
Luo, C., Burgeon, E., Carew, J.A., Badalian, T.M., McCaffrey, PG., Lane, W.S.,
Hogan, PG., Rao, A. (1996 a). Recombinant NFATI (NFATp) is regulated by
calcineurin in T cells and mediates the transcription of several cytokine genes. Mo!.
CelL B1oL 16: 3955-66
Luo, C., Edelhoff, S., Disteche, C., Copeland, N.G., Jenkins, N.A., Hogan, P.G., Rao,
A. (1996 b). Normal function of the transcription factor NFAT I in wasted mice:
chromosome localization of NFATI gene. Gene. In press
Marty, I., Robert, M., Villaz, M., De Jongh, K.S., Lai, Y., Catterall, W. A., and
Ronjat, M. (1994). Biochemical evidence for a complex involving dihydropyridine
receptor and ryanodine receptor in triad junctions of skeletal muscle. Proc. NatL
Acad. Sc!. USA 91: 2270-2274
Mason, W.T. (1993). Fluorescent and Luminescent Probes for Biological Activity: A
practical guide to technology for quantitative real-time analysis. Edited by Mason,
W.T.
Massie, B.M., M. Conway, B. Rajagopalan, R. Yonge, S. Frostick, J. Ledingham, P.
Sleight, and G. radda. (1988). Skeletal muscle metabolism during exercise under
PA NA GIOTIS MA NOLOPO ULOS 131

REFERENCES
ischemic condition in congestive heart failure: evidence for abnormalities unrelated to
blood flow. Circulation 78:320-326.
Masuda, E., Naito, Y., Tokumitsu, H., Campbell, D., Saito, F., Hannum, C., Arai,
K-i., Arai, N. (1995). NFATx, a novel member of the NFAT family that is expressed
predominantly in the thymus. MoL CelL Blot 15: 2697-706
Mayne, C.N., H. Sutherland, J. C. Jarvis, S. J. Gilroy, A. J. Craven, and S. Salmons.
(1996). Induction of a fast- oxidative phenotype by chronic muscle stimulation:
histochemical and metabolic studies. Am. I Physiol. 270 (Cell Physiol. 39): C3 13-
320.
Mayne, C.N., J.C. Jarvis, and S. Salmons. (1991). Dissociation between metabolite
levels and force fatigue in the early stages of stimulation- induced transformation of
mammalian skeletal muscle. Basic AppL Myol. 1: 63-70.
McCaffirey, PG., Luo, C., Kerppola, T.K., Jam, J., Badalian, T.M., Ho, A.M.,
Burgeon, E., Lane W.S., Lambert, J.N., Curran, T., Verdine, G.L., Rao, A., Hogan,
P.G. (1993). Isolation of the cyclosporin-sensitive T cell transcription factor NFATp.
Science. 262: 750-54
McComas, A.J.. (1996). Skeletal muscle. Form and Function. McMaster University,
USA.
PA NA GIOTIS MANOLOPO UL OS 132
REFERENCES
McKinsey, T.A., Zhang, C.-L., Lu, J., and Olson, E.N. (2000). Signal-dependent
nuclear export of a histone deacetylase regulates muscle differentiation. Nature 408:
106-111
McPherron, A.C., Lawler, A.M., Lee, S.J. (1997). Regulation of skeletal muscle mass
in mice by a new TOF-beta superfamily member. Nature 387: 83-90
Mege, R-M., Goudou, D., Glaume, C., Nicolet, M., Rieger F. (1994). Is intercellular
communication via gap junctions required for myoblast fusion? Cell Adhes. Commun.
2: 329-343
Meil3ner, J.D., Gros, G., Scheibe, R.J., Scholz, M., and Kubis, H-P. (2001).
Calcineurin regulates slow myosin, but not fast myosin or metabolic enzymes, during
fast-to-slow transformation in rabbit skeletal muscle cell culture. Journal of
Physiology. 533.1: 215-226.
Memorias do Instituto Oswaldo Cruz-on line: http://iris.dbbm.fiocruz.br/www -
mem/index.html
Merat, D.L., Hu, Z.Y., Carter, T.E., Cheung, W.Y. (1985). Bovine brain calmodulin-
dependent protein phosphatase. Regulation of subunit A activity by calmodulin and
subunit B. .1. Biol. C/tern. 15;260(20): 11053-9
PANAGIOTISMJ4NOLOPOULOS 133

REFERENCES
Molkentin, J. D. and Dorn II, G. W. (2001). Cytoplasmic signaling pathways that
regulate cardiac hypertrophy:Annu.Rev.Physlol 63, 391-426.
Muller, C.W., Rey, F.A., Sodeoka, M., Vardine, G.L., Harrison, S.C. (1995).
Structure of the NF-icB p50 homodimer bound to DNA. Nature 373: 311-17
Murgia, M., Serrano, A.L., Calabria, B., Pallafacehina, Cl., Lømo, T., and Schiaffino,
S. (2000). Ras is involved in nerve-activity-dependent regulation of muscle genes.
Nature Cell Blot 2: 142-147
Musaro, A., McCullagh, K.J.A., Naya, F.J., Olson, EN., and Rosenthal, N. (1999).
JGF-1 induces skeletal myocyte hypertrophy through calcineurin in association with
GATA-2 and NFATc1. Nature. 400: 581-585.
National Center for Biotechnology Information (NDBI):http://www.ncbi.nlm.nih.p-ov
Navia, M.A. (1996). Protein-drug complexes important for immunoregulation and
organ transplantation. Curr. Op. Struct. Bio. 6: 838-847
Nemeth, P., Hoffer, H.W., and Pette, D. (1979). Metabolic heterogeneity of muscle
fibers classified by myosin ATPase. Histochemistry 63: 191-201
Nolan, G.P. (1994). NF-AT-AP-1 and Rel-bZIP: hybrid vigor and binding under the
influence. Cell 77: 795-98
PANAGJOTISM4NOLOPOULOS 134

REFERENCES
Northrop, J.P., Hot, S.N., Chen, L., Thomas, Di., Timmerman, L.A., Nolan, OP.,
Admon, A., Crabtree, OR. (1994). NF-AT components define a family of
transcription factors targeted in T-cell activation. Nature. 369: 497-502
Novikoff, A. B., Shin, W-Y., and Drucker, J.(1961).Mitochondrial localisation of
oxidative enzymes: staining results with two tetrazolium salts. J. Biophys. Biochem.
CytoL 9: 47-61.
Olson, E.N., Williams R.S. (2000) a. Remodeling muscles with calcineurin.
BloEssays 22: 510-519
Olson, E.N., Williams R.S. (2000) b. Calcineurin signalling and muscle remodelling.
Cell 101: 689-692
Ontell, M.P., M.M. Sopper, G. Lyons, M. Buckingham, and M. Ontell. (1993).
Modulation of contractile protein gene expression in fetal murine crural muscles:
emergence of muscle diversity. Dev. Dynm. 198: 203-2 13.
Osawa, H., Printz, R.L., and (iranner, D.K. (1993). Hormonal regulation of HK II
mRNA in adipose and muscle cell lines (Abstract). Diabetes 42, SuppL 1: 35A
Park, J., Takeuchi, A., Sharma, S. (1996). Characterization of a new isoform of the
NFAT (nuclear factor of activated T cells) gene family member NFATc. J. BioL
Chem. 34: 29014-21
PI4NAGJOTISMANOLOPOULOS 135
REFERENCES
Parry, D.J. (2001). Myosin heavy chain expression and plasticity: rple of myoblast
diversity. Exerc. Sport ScL Rev. 29: 175-179
Passoneau, J.V. and Lowry, O.H. (1993) Enzymatic Analysis: A practical guide.
Totowa, NJ, USA: Humana press.
Pette, D. (1984). Activity-induced fast to slow transitions in mammalian muscle.
Medicine and science in sports and exercise. 16: 517-528.
Pette, D., and Vrbova, G. (1992). Adaptation of mammalian skeletal muscle fibers to
chronic electrical stimulation. Rev. PhysioL Biochem. Phannacol. 120: 115-202
Pette, D., Staron, R.S. (1997). Mammalian skeletal muscle fiber type transcriptions.
International Review of Cytology. 170: 143-223.
Politino, M., King, M.M. (1990). Calcineurin-phospholipid interactions: identification
of the phospholipid binding subunit and analyses of two-stage binding process. J.BioL
Chem. 265(13): 1622-7619,
Prieschl, E.E., Gouilleux-Gruart, V., Walker, C., Harrer, N.E., Baumruker T. (1995).
A nuclear factor of activated T cell-like transcription factor in mast cells is involved
in IL-S gene regulation after lgE plus antigen stimulation. J. Immunol. 154: 6112-19
Rao, A., Luo, C., and Hogan, P.G. (1997). Transcription factors of the NFAT family:
Regulation and function. Annu. Rev. ImmunoL 15: 707-747
PANAGJOT/SM4NOLOPOULQ5 136

REFERENCES
Rash, J.E., and Fambrough, D. (1972). Dcv. Rio!. 30:166-186
Robert, V., Giorgi, F.D., Massimino, ML., Cantini, M., and Pozzan, T. (1998). Direct
monitoring of the calcium concentration in the sarcoplasmic and endoplasmic
reticulum of skeletal muscle myotubes. .J.BioiChem. 273: 30372-30378
Romey, G., Garcia, L., Dimitriadou, V., Pingon-Raymond, M., Rieger, R, Lazdunski,
M. (1989). Ontogenesis and localization of Ca 2 channels in mammalian skeletal
muscle in culture and role in excitation-contraction coupling. Proc. NatL Acad. Sct
USA 86: 2933-2937
Rothermel, B., Vega, RB., Yang, J., Wu, H., Bassel-Duby, R. (2000). Protein
encoded within the Down Syndrome Critical Region is enriched in striated muscles
and inhibits calcineurin signalling. J. Rio!. C/tern. 275: 8719-8725
Ruff, V.A., Leach, K.I. (1995). Direct demonstration of NFATp dephosphorylation
and nuclear localization in activated HT-2 cells using a specific NFATp polyclonal
antibody. J. Riot C/tern. 270: 22602-7
Rusnak, F., and Mertz, P. (2000). Calcineurin: Form and Function (Review). Amer.
Physiol. Soc. 80: 1483-1521.
PANAGJOTISMANOLQpQULQS 137

REFERENCES
Ruwhof, C., Van der Laarse, A. (2000). Mechanical stress-induced cardiac
hypertrophy: mechanisms and signal transduction pathways. Cardiovascular
Research 47: 23-37.
Sabbah, H.N., F. Hansen-Smith, V.G. Shaov, T. Kono, M. Lesch, P.J. Gengo, R.P.
Steffen, T.B. Levine, and S. Goldstein. (1993). Decreased proportion of type I
myofibers in skeletal muscle of dogs with chronic heart failure. Circulation 87:17-
29-1737.
Salmons, S., and J. Henriksson. (1981). The adaptive response of skeletal muscle to
increased use. Muscle and Nerve 4:94-105.
Salmons, S., and Sreter, F.A. (1976). Significance of impulse activity in the
transformation of skeletal muscle type. Nature 263:30-34
Saltin, B. and Gollnick, P. D. (1983). Skeletal muscle adaptatbility: Significance for
metabolism and performance. In Skeletal Muscle, eds. Peachey, L. D., Adrian, R. H.,
and Geiger, S. R., pp. 555-631. American Physiological Society, Bethesda, MD.
Sato, K., and Miyagi, T. (1996). Involvement of an endogenous sialidase in skeletal
muscle cell differentiation. Biochem. And Biophys. Res. Commun. 221: 826-830
PA NA GIOTIS MA NOLOPOULOS 138

REFERENCES
Schneider, M.F., Simon, B.J., and Szucs, G. (1987). Depletion of calcium release
from the sarcoplasmic reticulum during calcium release in frog skeletal muscle. J.
Physiol. 392: 167-192
Seigneurin-Venin, S., Parrish, E., Marty, I., Rieger, F., Romey, G., Villaz, M., and
Garcia, L. (1996). Involvement of the dihydropyridine receptor and internal Ca 2
stores in myoblast fusion. Exper. Cell Res. 223: 301-307
Semsarian, C., Wu, M.-J., Ju, Y.-K., Marcinieot, T., Yeoh, 1., Allen, D.G., Harvey,
R.P., Graham, R.M. (1999). Skeletal muscle hypertrophy is mediated by a Ca 2+ -
dependent calcineurin signalling pathway. Nature 400: 576-580
Serfling, E., Avots, A., Neumann, M. (1995). The architecture of the interleukin-2
promoter: a reflection of T lymphocyte activation. Biochem. Biophys. Ac/a. 1263:
18 1-200
Shaw, K.T-Y., Ho, A.M., Raghavan, A., Kim, J., Jam, J., Park, J., Sharma, S., Rao,
A., Hogan P.G. (1995). Immunosuppressive drugs prevent a rapid dephosphorilation
of the transcription factor NFAT1 in stimulated immune cells. Proc. Nail. Acad. ScL
USA. 92: 11205-9
Shin, K.S., Park, J., Kwon, H., Chung, C.H., and Kang, M. (1997). Opposite effect of
intracellular Ca2 and protein kinase C on the expression of inwardly rectifying K
channel 1 in mouse skeletal muscle. J. Biol. Chem. 272: 21227-21232
PANA4GJOTISM4NOLOPOULOS 139

REFERENCES
Spurway, N.C. (1981). Interrelationship between myosin-based and metabolism-based
classifications of skeletal muscle fiber. .1. Histochem Cytochem. 29: 87-88
Stockdale, F.E. (1997). Mechanisms of formation of muscle fibre types. Cell Struct.
Funct. 22:37-43
Stoddard, B.L., Flick, K.E. (1996). Calcineurin-immunosupressor complexes. Curr.
OpEn. Struct. Blot 6: 770-775.
Swoap, S. J., Hunter, R. B., Stevenson, B. J., Felton, H. M., Kansagra, N. V., Lang, J.
M., Esser, K. A., and Kandarian, S. C. (2000). The calcineurin-NFAT pathway and
muscle fiber-type gene expression. Am.J.Physiol Cell Physiol 279, C915-C924.
Thomas, A.P., Bird, 0.5., Hajnoczky, G, Robb-Caspers, L.D., anct Putney, J.W., Jr.
(1996). Spatial and temporal aspects of cellular calcium signaling. FASEB .J 10:
1505-15 17.
Timmerman, L.A., Clipstone, N.A., Ho, S.N., Northrop, J.P., and Crabtree, G.R.
(1996). Rapid Shuttling of NFAT in discrimination of Ca 2t signals and
immunosuppression. Nature. 383: 837-840
Treisman, R. (1996). Regulation of transcription by MAP kinase cascades. Current
Option in Cell biology. 8: 205-2 15.
PANAGIOTISMANOLOPOULOS 140

REFERENCES
Tunell, G. L., Hart, M. N.(1977). Simultaneous determination of skeletal muscle fibre,
type I, hA, and 1TB by histochemistry. Arch. Neurol. 34: 171-173.
Vander, A.J., Sherman, J.H & Luciano, D.J (1994). Human physiology 6th edition.
McGraw Hill, London.
Venkataraman, L., Francis, D.A., Wang, Z., Liu, J., Rothstein, T.L., Sen, R. (1994).
Cyclosporin A-sensitive induction of NF-AT in routine B cells. Immunity 1: 189-96
Wang, D.Z., McCafltey, P.O., Rao, A. (1995). The cyclosporin-sensitive transcription
factor NFATp is expressed in several classes of cells in the immune system. Ann. N.
V. Acad. Sc!. 766: 182-94
Wang, J.H. and Desai, R. (1976). A brain protein and its effect on the Ca 2 - and
protein modulator- activated cyclic nucleotide phosphodiesterase. Biochem. Biophys.
Res. Comm. 72: 926-932.
Wang, J.H. and Desai, R. (1977). Modulator binding protein. I Blot Chem. 252:
4175-4 184.
Wasserstrom, J.A. (1998). New evidence for similarities in excitation- contraction
coupling in skeletal and cardiac muscle. Ada. Physiol. Scand. 162: 247-252.
PAN14GJOTJSM4NOLQPOULQS 141

REFERENCES
Watanabe, Y., Pen-mo, BA., Chang, B.H., Soderling, T.R. (1995). Identification in
the calcineurin A subunit of the domain that binds the regulatory B subunit. 2 Blot
C/tern. 270: 456-460.
Wei, Q., Lee, E.Y.C. (1997). Mutagenesis of the L7 loop connecting beta strands 12
and 13 of calcineurin: evidence for a structural role in activity changes. Biochemistry
36: 7418-7424
Weiss, A., Littman, DR. (1994). Signal transduction by lymphocyte antigen
receptors. Cell. 76: 263-74
Weiss, D.L., Hural, J., Tan, D., Timmerman, L.A., Henkel, G., Brown, M.A. (1996).
Nuclear factor of activated T cells is associated with a mast cell interleukin 4
transcription complex. Mol. CelL Blot 16: 228-35
Westerblad, H., and Alien, D.G. (1991). Changes in myoplasmic calcium
concentration during fatigue in single mouse muscle fibres. J. Gen. PhysioL 98: 615-
635
Williams, R.S. and P.D. Neufer. (1996). Regulation of gene expression in skeletal
muscle by contractile activity. In the handbook of Physiology: Integration of motor,
circulatory, respiratory and metabolic control during exercise (ed. L.B. Rowell and
J.T. Shepard), pp. 1124-1150. American Physiology Society, Bethesda, MD.
PA NA GJOTIS MA NOLOPO ULOS 142

REFERENCES
Wu, J., Katzav, S., Weiss, A. (1995). Functional T-cell receptor signalling pathway is
required for p95vav activity. MoL CelL BIoL 15: 4337-46
Yaffe, D., and Fachs, S. (1967). Autobiographic stubby of the incorporation of 3H
during myogenesis in tissue culture. Develop. Blot 15: 33-50
Yaseen, N.R., Maizel, A.L., Wang, F., Sharma, S. (1993). Comparative analysis of
NFAT (nuclear factor of activated T cells) complex in human T and B lymphocytes.
.1. Blot ('hem. 268: 14285-93
Zetser, A., Gredinger, F., Bengal, E.(1999). p38 mitogen-activated protein kinase
pathway promotes skeletal muscle differentiation. Participation of the Mef2c
transcription factor. JBiolChem 274(8):5193-200
Zhu, J., Shibasaki, F., Price, R., Guillemot, J.C., Yano, T., Dotsch, V., Wagner, G.,
Ferrara, P., and McKeon, F. (1998). Intramolecular masking of nuclear import signal
on NF-AT4 by casein kinase I and MEKKI Cell 93(5): 851-861
Zhuo, S., Clemens, J.C., Stones, R.L., Dixon, J.E. (1994). Mutation analysis of
Ser/Thr phosphatase: Identification of residues important in phosphoesterase substrate
binding and catalysis. J. Blot ('hem. 269(42): 26234-26238
Zubay, G.L., Parson, W.W., Vance, D.E. (1995). Principles of Biochemistry.
Wm.C.Brown, Oxford.
,
PANAGJOTJSMANOLOPOULOS 143

APPENDIX I
All figures (Fig. 100; Fig. 187; Fig. 188; Fig.320) in this appendix have been taken
from Greene, 1959.
ANATOMY OF THE RAT
lie
a,
' >0 I-
. T
Q4.aJ S — 8'— •
-r ...0 ifA4IfflV
• rnI 1F15T4 yr cJ a
V
'it El:
14'4!: ittt \ .i Iq
'LTJ- J ------ 'U , •' .— .-

NERVOUS SYSTEM
head
cf the lh)9ti
tThtfice tbze qiukus mcxunu--- common I..
adducloy rncortus-vastul
bTnnch-. '7
ii;i;;'cf scklic stoi CXICTIUIS
'0mm tus famous
3005 oils
Iemnfrrarlosu5 femoil axesnj head
biancb
' I—iiflnon beTanEal, division cf sciotic
bkp Icmatis
lAnai t4ecl of the lef I thigh dissccicd to sKu dv,sions ef the sciofic ue;ye,
rifctot 9bAc&. ; - lie! 10Tft1119 aithn€cw
s1Jfrnoi qlukmil.
tZ'j; / AiJ1 ii: Ibivetia-Fermis, anIoy head
?tic€jo fcrnn sSt,bi hS cflida1èmnoiis Inc lh;h
-jicuneal
rnternjs rrcxItiiiu otus emouis GCI feiaoua, cesspiij hea'
it
eetecI;cn of k'[I Iatnal h' ;e3in, skwng ne11c5 [TCI-Ii the atrS Pimis
gIu1is rithhi

f tmots
iUr I/V/LA h ~ft.JLJU I i,\:H ((I:
•j
II iT'!
3StOCfltffluIr,IdkTCI
esletniji
lot
tiboI nètve...i.fl
sn&l scnobfj2 sa!eL1s . 1J c p?nTi IA
- - qreal supIieIIous tMIl
.sapenous biuncáiuf [enardIaletq
.
--pohtI ailerij nd vein
.1 k%. --add'jctot
lihial
cur1tflv crcaJ ne,vc (ul. IpcaO.t
sinai btanch-
-
--i&cJdlc qcnicvlar
bbiii
ii 1' ii '-bo JAuICt1_S
lb y f j,P •/+"y' fleto tcIluKi onus
1y lco1 longu5 diqltorun
- hi / - ------ qasiucrcnu&Lteó& Itad
5! I Liii dl ar ki Li- Qa*trur CVlflUU$,DT curanc
rnuIi ihtnou vein -
Thctu;SQtf tt y t!I 105'lcnaL's veil
or Itauuds lOi1Ji5
us pa1icu
lorgus diqihurum
rnelleolus
laletci picnict
?!cntaT ne;e
FJ2G Blood Ve3seb of the lowel I.eq. AxiIIciy View