the response of circular composite plates to underwater ... · 1 the response of circular composite...
TRANSCRIPT

1
The Response of Circular Composite Plates to Underwater Blast:
Experiments and Modelling
A. Schiffer a,*
and V.L. Tagarielli b
a Department of Mechanical Engineering, Khalifa University of Science, Technology and
Research (KUSTAR), Abu Dhabi, UAE
b Department of Aeronautics, Imperial College London, SW7 2AZ, UK
Abstract
We present a new experimental technique to allow laboratory-scale observation of underwater
blast loading on circular plates, including dynamic deformation and failure of the plates as
well as the sequence of cavitation events in water. The apparatus is used to measure and
compare the responses of a quasi-isotropic glass/vinylester composite and of a woven
carbon/epoxy plate. Dynamic explicit FE simulations are conducted and their predictions are
found in good agreement with experiments. Measurements and FE predictions are used to
validate a recently developed theoretical model for the response of elastic orthotropic plates to
underwater blast. The validated theoretical model was used to compare the blast performance
of both types of laminate and the results suggest that glass-fibre composites withstand higher
blast pressures than carbon-fibre composites of equal mass for the structural dimensions
considered here.
Keywords: carbon fibre, glass fibre, impact testing, fluid-structure interaction, cavitation
Revised version submitted to Journal of Fluids and Structures, July 2014
* Corresponding author, e-mail: [email protected]

2
1. Introduction
A major concern in the design of naval composite structures is their ability to withstand
intense dynamic loading consequent to an explosion in water. Underwater explosions give
rise to spherical pressure waves propagating in the water at approximately sonic speed (Cole,
1948); at sufficient distance from the detonation point, such shock waves† can be taken as
planar and their history can be approximated by an exponentially decaying pressure versus
time pulse
0expp t p t (1)
where peak pressure 0
p and decay time depend on the mass and type of explosive material
as well as on the stand-off distance (Swisdak, 1978).
1.1 Review of theoretical and numerical work on underwater blast loading
The loading applied on submerged structures in the vicinity of the blast can cause severe
deformation and failure and is strongly affected by fluid-structure interaction (FSI). The first
theoretical studies on FSI in underwater blast date back to the early 1940s; Taylor (1963) first
analysed the response of a free-standing rigid plate subject to loading by an underwater shock
wave, as given in eq. (1), and concluded that the momentum transmitted to the plate is
reduced by decreasing the plate’s mass, promoting early cavitation in water.
Great insight into the cavitation process triggered by pressure waves propagating in a bi-linear
elastic fluid is given in Kennard (1943). He found that cavitation zones spread by propagation
of a ‘breaking front’ (BF) emanating from the point of first cavitation and forming an
expanding pool of cavitated fluid. Such breaking front can arrest and invert its direction of
motion, thus becoming a ‘closing front’ (CF) and reducing the volume of cavitated fluid.
Several numerical and theoretical studies on FSI have focused on the response of metallic
monolithic and sandwich structures (Deshpande and Fleck, 2005; Hutchinson and Xue, 2005;
Liang et al., 2007; McMeeking et al., 2007). Schiffer and Tagarielli (2014a) investigated
theoretically the response of circular elastic composite plates subject to underwater blast, by
† Shock waves are intended here as discontinuities in the pressure distribution, propagating at sonic speed.

3
extending previously developed 1D FSI models (Schiffer et al., 2012). These predictions will
be validated by the experiments reported in this study.
1.2 Review of experimental work on underwater blast loading
Early experimental research in underwater blast loading is published by the US Office of
Naval Research (1950). During the last decades several studies focused on dynamic
deformation and failure modes exhibited by real-size naval composite and steel structures
consequent to blast loading in explosive test facilities (Hall, 1989; Mouritz et al., 1994;
Ramajeyathilagam and Vendhan, 2004). However, such experiments are time-consuming,
cost-intensive and require extensive control and safety measures. Because of these issues
recent advances in experimental methods have concentrated on simulating underwater blast
loading in a laboratory environment (Deshpande et al., 2006; Espinosa et al., 2006; Latourte
et al., 2011; Mori et al., 2007; Mori et al., 2009; Wadley et al., 2008). Deshpande et al. (2006)
developed an experimental apparatus able to simulate realistic underwater blast loading in a
water-filled metallic shock tube, and used it to probe the 1D blast response of free-standing
monolithic plates and sandwich panels, concluding that the sandwich construction offers
remarkable benefits in terms of the impulse imparted to a structure in a blast event.
Due to their high specific stiffness and strength, composites are a candidate material to
replace metallic alloys in blast-resistant components; this is due to FSI: lighter and softer
materials, deforming rapidly upon blast loading, promote early fluid cavitation and in general
reduce the impulse transmitted to the structure. On the other hand, these materials possess a
relatively low ductility when compared to metals, which limits their range of application.
The dynamic response of composite plates is dominated by elastic deformation up to
catastrophic, brittle failure. It is necessary to measure this elastic response, which entails
transient propagation of radial flexural waves. Only a few authors have provided detailed
deflection histories for to metallic or composite plates subjected to underwater blast, due to
the complexity of the measurements. Espinosa et al. (2006) designed a divergent steel shock
tube to investigate 3D dynamic deformation of circular clamped composite plates subject to
underwater blast. Exponentially decaying shock waves were generated by firing a projectile at
a sliding water piston, as in Deshpande et al. (2006). Plate deformation histories were

4
measured by observing shadow Moiré fringes with a high-speed camera. LeBlanc and Shukla
(2010) also used a water-filled shock tube to examine underwater blast loading of clamped
composite plates but with the shock wave generated via internal detonation of an explosive
charge. An alternative experimental method to perform blast loading on submerged sandwich
plates was developed by Wadley et al. (2008). They designed an underwater explosive test rig
comprising a water-filled cardboard cylinder placed on a recessed steel plate in which the
sandwich specimen was located. Shock waves were generated in the water cylinder by
detonation of a sheet of explosive and the load transmitted to the supports in the dynamic tests
was measured.
The experimental techniques above did not allow observation of cavitation in water, which
deeply affects the structural loading history. Specifically, cavitation breaking and closing
fronts act as partially reflective interfaces for pressure waves; the structural response is highly
sensitive to the location and time at which breaking fronts and closing fronts develop as well
as to their speed of propagation. Recently, Schiffer and Tagarielli (2012) developed a
transparent shock tube capable of reproducing blast loading in water and to allow
simultaneous observation of structural motion and fluid cavitation. This apparatus was then
employed to examine the 1D response of sandwich plates to blast in deep water (Schiffer and
Tagarielli, 2013) and to investigate the response of water-filled double hulls subject to
underwater blast (Schiffer and Tagarielli, 2014b).
1.3 Scope and outline of study
In this study we employ a modified version of the apparatus developed by Schiffer and
Tagarielli (2012) in order to examine the response of fully clamped circular composite plates
subject to underwater blast. The main objectives of this paper are
to present a new technique to measure the dynamic deformation of composite plates
subject to underwater shock in a laboratory setting while allowing, for the first time, the
simultaneous direct observation of the sequence of cavitation events in the fluid;
to perform fully-coupled, detailed 3D dynamic FE simulations of the plate response and
compare to experiments;
to validate the predictions of a recently developed theoretical model (Schiffer and
Tagarielli, 2014a) by measurements and FE predictions; and

5
to compare the blast response of two candidate composite materials for design of light-
weight naval components subject to the threat of an explosion in water (glass-fibre and
carbon-fibre reinforced composites).
The outline of the paper is as follows: in Section 2 we describe the composite specimens and
the laboratory setup, while details on the FE simulations are provided in Section 3. In Section
4 we summarise the framework of the theoretical model (Schiffer and Tagarielli, 2014a).
Results obtained from the experiments, FE simulations and analytical calculations are
presented and discussed in Section 5.
2. Underwater blast experiments
2.1 Dimensional analysis and scaling in underwater blast loading
The pioneering work of Taylor (1963) suggests that the response of a free-standing rigid plate
to underwater blast loading is dictated by a single non-dimensional parameter
w wc
(2)
where w
is the density of water, is the areal mass of the plate and is the decay time of
the blast wave, which is intended as exponentially decaying and travelling at sonic speed, ,w
c
in water. Although the parameter has been widely used in experimental studies to relate the
responses of scaled-down specimens to those of full-scale components (Deshpande et al.,
2006; Espinosa et al., 2006; Wadley et al., 2008), the underlying theory is only valid for 1D
underwater blast loading and not fully representative of the 3D case.
A more detailed FSI model was recently proposed by Schiffer and Tagarielli (2014a) who
found that the deformation response of a fully-clamped elastic isotropic plate is governed by
the following set of non-dimensional parameters
0
0/ ; ; ; ; .
w wc pR
h h R R pE EE E
(3)
Here, h and R are the thickness and radius of the circular plate, E and are the Young’s
modulus and density of the linear-elastic plate material, h represents the areal mass of

6
the plate and 0
p and are the peak pressure and decay time of the exponentially decaying
blast wave (1). Note that the parameter is related to eq. (2) via / . Finite element
simulations conducted by Schiffer and Tagarielli (2014a) on composite plates of different size
confirmed that these scaling relations (eq. (3)) are adequate.
Assuming that the relevant properties of the plate material, E and , are homogeneous and
independent of size, and focusing the attention on the elastic plate response, the problem
under investigation can be regarded as scale-independent. It follows that the blast response of
large naval components can be measured at laboratory scale by employing a scaled-down
experimental setup, with a set of non-dimensional parameters (3) identical to that of full-size
structures. For the case of full-scale naval components exposed to the threat of a non-contact
explosion in water, typical ranges of the non-dimensional parameters (3) are
5
00.04 0.1; 0.001 2.5 ; 0.003 0.4 ; 0.04 0.4 ; 5 10 0.025h R p
. (4)
In this study, the choice of specimen geometry, materials and loading parameters was such to
reproduce real blast scenarios on a smaller scale.
2.2 Materials
Two different types of composite are considered in this study and details on fabrication and
constituent materials are given below.
(i) Carbon fibre/epoxy composite (CRP)
The laminate was manufactured by stacking three layers of plain woven prepregs with
identical orientations and autoclave curing in a vacuum bag. The layup was therefore similar
to a [0,90]3 laminate with total thickness of 0.75 mmh , density -31500 kgm and mass
per unit area -21.125 kgmh .
(ii) Glass fibre/vinylester composite (GRP)
The GRP composite comprised a quasi-isotropic E-glass cloth infiltrated by vinylester resin
via vacuum infusion. The laminte had a stacking sequence [0,45,90,-45], final thickness
0.85 mmh , density -31550 kgm and areal mass -2
1.32 kgmh .

7
Mechanical properties of fibres and resin used for the GRP and CRP, as obtained by the
manufacturers and from previous studies (Tagarielli et al., 2010; Tagarielli et al., 2004), are
listed in Table 1.
2.3 Laboratory setup and instrumentation
The experimental apparatus developed by Schiffer and Tagarielli (2012) was employed in this
study to simulate realistic underwater blast loading of the composite specimens described in
Section 2.2. The apparatus is sketched in Fig. 1 and consists of a shock tube made from a
transparent material in order to allow observing water cavitation by means of high-speed
photography. The shock tube, of length 2 mL , was closed at one end by the circular
composite specimen of diameter D = 70 mm by adhesive bonding of the specimen to the
annular tube face. The tube was then filled with filtered tap water, in vertical position, and
closed at the opposite end by a sealing nylon piston of mass 6 gP
M (fitted with two O-
rings); a bleed valve was included in the piston to allow evacuating air bubbles in the water
column prior to the dynamic experiment (preliminary experiments had shown that such
bubbles can lead to significant wave attenuation and distortion). Note that the length of the
tube, L, was sufficient to ensure that the structural response had finished before pressure
waves reflected at the tube’s front piston could reach the specimen and lead to a false
secondary loading phase.
The back (dry) face of the composite specimen was supported by a transparent clamping ring,
loaded with a compressive axial force F ; such force was applied using a screw-driven
loading device. The clamping ring was machined from a transparent acrylic rod to a diameter
25 mmd , and honing of the bore provided a glossy finish to enable clear observation of
dynamic plate deflection using a high-speed camera (Vision Research, type v.7.1).
The loading pressure pulses were generated by firing a steel striker of mass S
M and velocity
Sv at the nylon piston. It can be shown theoretically (Deshpande et al., 2006) that the shape of
the pressure pulse emanated from the wet face of the water piston is represented by an
exponentially decaying shock wave according to eq. (1), with decay time and peak pressure
given by

8
,
0 0, ,
S P
w w
w w
mp c v
c
(5)
respectively, where ,/
S P S P Pm M M A is the areal mass of the striker-piston system
related to the cross section of the shock tube, Ap, and 0
v is the initial system velocity governed
by conservation of linear momentum, 0/
S S S Pv M v M M . This method is convenient
because the decay time and the peak pressure 0
p can be independently adjusted by
tweaking mass and velocity of the projectile, and is widely used, see e.g. (Deshpande et al.,
2006; Espinosa et al., 2006; Latourte et al., 2011; Schiffer and Tagarielli, 2012, 2013, 2014b).
Numerical values of S
M and S
v used in the experiments are listed in Table 3.
The incident pressure wave was measured using a piezoelectric pressure gauge (PCB
Piezoelectronics Inc., type 113B23) mounted flush to the bore hole at a distance of 120 mm
from the front end. It should be noted that mechanical coupling between the tube and the
water column reduces the speed at which pressure pulses propagate in the fluid, w
c
(Korteweg, 1878). Moreover, pressure waves attenuate and distort progressively as they
propagate in a compliant tube. In order to quantify these effects, a second pressure transducer
of same type was fitted on the tube at a distance of 1 m from the first one. Measurements
provided 11055 m s
wc
, significantly lower than the speed of sound in open water. The
observed attenuation of the pressure amplitude was on the order of 5% and the rise time of the
pressure wave increased by approximately 15%. It merits comment that such coupling
phenomenon also affects the values of peak pressure 0p and decay time of the generated
shock wave (eq. (1)); therefore all numerical and theoretical calculations were performed here
using the measured wave speed 11055 m s
wc
.
3. Finite element models
In order to examine the details of the plate’s deformation response and to provide further
insight into the ensuing cavitation processes, 3D FE simulations were performed in
ABAQUS/Explicit. In these simulations, attention was focused on exploring the elastic
regime of the structural response as well as the ensuing cavitation phenomena; failure

9
processes were not modelled. The details of the numerical models are described in the
following.
The FE models were based on a 3D Lagrangian FE formulation and consisted of two
domains: a water column of length 2 mL and radius 12.5 mmR and a circular plate of
and equal radius and thickness h , according to the dimensions of the CRP and GRP laminates
given in Section 2.2. Due to the orthotropy of the plate, only a quarter of the system was
modelled, and appropriate boundary conditions were applied on on the planes of symmetry.
The plate was discretised using four-noded quadrilateral shell elements (S4R) with reduced
integration as well as three-noded triangular elements (S3R) for the central portion; it was
meshed in ABAQUS/Explicit with a structured mesh comprising 14 elements in radial
direction and 10 elements in circumferential direction.
The constitutive response of the composite materials considered in this study was taken as
purely elastic and the details of the material models are described in the following. Although
the CFRP laminate was obtained from three woven [0,90] prepregs, in the FE simulations it
was modelled as a stack of unidirectional laminae with layup [0,90]3. In ABAQUS, the
[0,90]3 laminate was defined by prescribing a composite shell section onto the plate domain.
This method is convenient because it allows specifying material response and orientation of
each lamina without the need of calculating the laminate’s stiffness matrix. Note that the same
procedure was used to model the GFRP laminate (stacking sequence was [0,45,90,-45] in this
case). In all simulations performed, each lamina was taken to be transversely isotropic and
the elastic constants 1 2 12 21 23 12 23 13, , , , , , ,E E G G G were obtained from the properties of the
constituent materials (Table 1) using classical rules of mixture; numerical values of the
calculated CFRP and GFRP properties are listed in Table 2.
The water column was discretised using a combination of eight-noded hexahedral brick
elements (C3D8R) with reduced integration and six-noded triangular wedge elements
(CRD6). Appropriate seeding was employed to ensure that the composite plate and the water
column had matching nodes at the fluid-structure interface, and a ‘tie’ constraint between the
two domains was imposed at this interface. Following Espinosa et al. (2006) and Schiffer et
al. (2012), the constitutive response of water ( -21000 kgm
w , 1
1055 m sw
c
) was modelled

10
by using a Mie-Gruneisen equation of state with a linear Hugoniot relation; the parameters
were chosen to give a linear-elastic relationship between fluid pressure p and volumetric
compressive strain V , with vanishing shear modulus. In order to capture the effects of
cavitation, it was imposed that the water is unable to sustain any tension, i.e. 0c
p p for
0V , in line with previous studies in this field (Deshpande and Fleck, 2005; Liang et al.,
2007; McMeeking et al., 2007; Schiffer et al., 2012); such nonlinearity in the constitutive
response of water was modelled by setting the material stiffness to zero when a positive
volumetric strain was detected.
Due to the inability of the FE method to represent discontinuities in the pressure and velocity
fields, a very fine mesh is necessary in the direction of shock wave propagation, in order to
approximate the shock with adequate accuracy. In all simulations, a mesh size of 0.15 mm
was chosen in longitudinal direction of the water column, resulting in a minimum rise time of
the shock of approximately 150 ns (recall wave speed in fluid 11055 m s
wc
) which is
negligible in comparison to the decay time of a typical blast events ( typically ranging
from 0.1 to 0.5 ms). Numerical damping tends to smear the shock across several elements; the
associated damping parameters (linear and quadratic bulk viscosities) were chosen
sufficiently small to guarantee an adequately sharp shock front.
Details on the boundary conditions are as follows. The plate was taken as fully clamped
along its circular boundary with all degrees of freedom constrained to zero. To model the tube
wall, radial displacements of the nodes on the lateral area of the fluid column were forced to
vanish. Loading was performed by imposing an exponentially decaying pressure boundary
condition according to eq. (1) at the free end of the water column. Peak pressure 0
p and
decay time were chosen to match the values used in the experiments, see Table 3. The bulk
viscosity parameters were decreased to 30% of their default values in order to reduce artificial
energy dissipation associated to volumetric straining of the fluid.
A set of preliminary FE simulations were conducted with the setup described above but with
the clamped boundary conditions on the plate removed. These simulations therefore examined
the approximately 1D response of elastic plates loaded by exponentially decaying shock-
waves in water. For this particular problem exact analytical solutions for rigid plates exist, as

11
given by Taylor (1963); for a wide range of blast pressures, these FE simulations reproduced
Taylor’s predictions with an error smaller than 0.1%. This reassured us on the accuracy of the
simulations and showed that the through-thickness deformation of the thin plates has
negligible effect on the plate response to blast.
4. Summary of the theoretical model employed
In this study we compare measurements and FE predictions to those obtained from the
theoretical models of Schiffer and Tagarielli (2014a); here we briefly summarise the
theoretical framework on which the model is based. The model aims at predicting the
deflection versus time history of circular clamped elastic orthotropic plates subject to loading
by exponentially decaying shock waves in water. In order not to lose generality, the
predictions account for coupled fluid-structure interaction, propagation of flexural waves in
the plate, for stretching and bending forces in the composite, for the orthotropic response of
the material, and for the presence of shear-induced plate deflections.
With reference to Fig. 2, plate deformation is split in two phases: in the Phase 1 response (
10 t t , see Fig. 2b), plate deflection is by propagation of a flexural wave, emanating from
the clamped boundary and travelling towards the plate centre, at velocity , while in Phase 2
(1
0t , see Fig. 2c), plate deceleration commences and flexural wave propagation is
neglected, hence R (see Fig. 2c). In each phase, an axisymmetric, polynomial deflection
profile is imposed, accounting for both shear and bending deflections, and satisfying
compatibility:
2 3 2
0 0, 3 2 2 .
B S
R r R r R r R rw r t w t w t
t t t t
(6)
Here, 0Bw t and 0S
w t are the centre point deflections due to bending and shear
deformations, respectively.
Introducing eq.(6) a-priori reduces the dimension of the problem to three DOFs in Phase 1,
namely central deflections due to bending and shear, 0Bw t and 0S
w t , respectively, and

12
wave-front position t . In Phase 2, the system further simplifies to two DOFs, 0Bw t and
0Sw t , as R .
The plate is assumed to be made from a symmetric and balanced laminate comprising n
transversely isotropic composite laminas stacked at arbitrary orientations k
1, 2, ,k n .
Introducing a reference system in cylindrical coordinates, , ,r z , for the laminate, the
relationship between in-plane forces i
N (per unit width) and the corresponding in-plane
strains i
can be written as
T T
r t rt r t rtN N N A (7)
where A denotes the in-plane stiffness matrix of the laminate. Likewise, for the bending and
twisting moments i
M (per unit width) we write
T T
r t rt r t rtM M M D (8)
with D the bending stiffness matrix of the laminate and i
the bending/twisting curvatures.
Adopting the concept of axisymmetric deformation (6) and assuming that radial and
tangential displacements of material points are negligible, i.e. ,u w v w , the in-plane
strains, bending curvatures and transverse shear deformations can be written as
2
0 01
; 0 ; 0 ;2
B S
r t rt
w w u
r
(9)
2
2
1; ; 0 ;B B
r t rt
w w
r r r
(10)
; 0 .S
rz tz
w
r
(11)
Underwater blast loading was modelled by prescribing a pressure versus time history on the
fluid-structure interface; at any time t > 0, the pressure distribution at this interface is given by
0, 2 exp , .
f w wp r t p t c w r t (12)
It follows from eq. (12), that the interface pressure, f
p , is strongly affected by the transverse
velocity field of the plate, ,w r t , and can drop to the value of the cavitation pressure of the

13
fluid, 0c
p , below which the fluid cannot sustain any further tensile loading and can take up
arbitrarily large strains.
The occurrence of the cavitation phenomenon introduces nonlinearities in the fluid response
and renders the full analytical treatment of 3D underwater blast problems impossible.
Therefore, Schiffer and Tagarielli (2014a) deduced the pressure history at the fluid-structure
interface from 1D analytical FSI models developed by the same authors (Schiffer et al.,
2012); such models account for the emergence and motion of cavitation breaking and closing
fronts and for the partial reflection of pressure waves at such fronts.
The equations of motion of the system can be obtained by employing the priciple of
conservation of linear and angular momentum, utilizing eqs. (6)-(12), as detailed in Schiffer
and Tagarielli (2014a). This results in a system of three nonlinear ODEs in Phase 1 and two
ODEs in Phase 2, which were integrated numerically by imposing the initial conditions
0
0 0 0
0 0 ; 0 0 ; 0 0 ;
0 0 ; 0 0 ; 0 0 .
S
S B B
t t w t
w t w t w t
(13)
The total centre deflection 00,w t w r t follows from eq. (6) and is given by
0 0 0
.B S
w t w t w t (14)
5. Results and discussion
We proceed to present experimental observations as well as quantitative comparisons with FE
and theoretical predictions. The details of the experiments performed are listed in Table 3,
which includes a non-dimensional measure of the peak blast pressure, 0 0
/p p E , as given
by eq. (3). It is important to note that the in-plane stiffness of a composite laminate changes
with respect to the direction of loading, but can be averaged by adopting the concept of
engineering stiffness of laminates (Gibson, 1994), which states that the stiffness of a laminate
subject to uniaxial tension can be approximated by 111 /E hA , hence
0 0 11p p hA . Here,
the quantity 11
A represents the first element of the inverse of the laminate’s in-plane stiffness
matrix, inv(A), which can be obtained from classical laminate theory using the properties
listed in Table 2.

14
Note that only in experiments 2 and 3, performed on CRP plates with incident waves of peak
pressure 0
9.4 M Pap , a shear-off plate failure was observed, as seen from Table 3.
However, due to the limited strength of the material used for the shock tube (maximum
allowable internal pressure was estimated to be 15 MPa), plates made from the more ductile
GRP could not be tested to failure and the corresponding damage mechanisms could not be
observed. Therefore the current study focuses on the elastic deflection of the composite plates
rather than on their failure mechanics.
5.1 Fluid and structural response
In this section high-speed photographs obtained from selected experiments are compared with
contours of pressure in water obtained via 3D FE simulations. Experiment 1 was performed
on a CRP specimen with 0
7.2 M Pap and 0.12 ms . A sequence of high-speed
photographs recorded in this experiment is presented in Fig. 3 together with fluid pressure
contour plots, obtained from the corresponding FE simulation, showing a pressure range
0 7.2MPap and only half of the water column, due to symmetry. The black regions in
these contour plots represent cavitation zones where pressure vanishes.
At 0t the incident shock wave, travelling from right to left in Fig. 3a, reaches the wet
surface of the specimen. Figure 3b shows that, soon after the plate has started to deform,
cavitation bubbles appear in the water at a distance 150 mmc
z from the fluid-structure
interface, and two breaking fronts (BF) emerge and propagate in opposite directions at
supersonic speed, forming an extending pool of cavitated water, as predicted by Kennard
(1943). In Fig. 3c, the BF propagating away from the structure has advanced beyond the field
of observation while the opposite BF has inverted its direction of motion and has become a
closing front (CF), propagating into the cavitated water at subsonic speed and forcing collapse
of cavitation bubbles. This CF continues propagating and after sufficient time has elapsed the
cavitated region has entirely disappeared from the field of observation and elastic plate
deformation has partially recovered, as seen in Fig. 3d.
It can be seen from Fig. 3 that the observed cavitation processes are in good agreement with
the corresponding FE predictions. The contour plots also provide insight into the evolution of

15
the fluid pressure field in the uncavitated water. In particular, the contour plot of Fig. 3b
shows that the cavitation zone separates the fluid column into a low pressure zone, just ahead
of the BF, and a high pressure zone located in the water between the cavitated region and the
fluid-structure interface. We also observe that, for the case shown here, the fluid pressure in
the high pressure zone locally exceeds the peak pressure of the incident wave (indicated by
light grey patches in Fig 3b), owing to pressure wave reflections at the propagating cavitation
front.
This mechanism is schematically illustrated in Fig. 4 for a 1D scenario. The pressure field in
the fluid can be thought of as a superposition of two wave trains, one travelling towards the
plate and the other one away from it. Figure 4a illustrates the fluid pressure associated to the
incident wave train as a function of the coordinate z for an instant immediately after the
caviation process has initiated (at distance zc) by propagation of two BFs (recall Fig. 3b). The
conditions in the fluid layer located between the plate and the expanding cavitation zone can
force the leftgoing BF to arrest, invert motion and become a CF (recall Fig. 3c). Since the CF
always propagates at subsonic speed (Kennard, 1943), the wave train emanated from the
fluid-structure interface will approach the CF and eventually reflect back to the fluid-structure
interface as a positive pressure pulse, resulting in additional loading of the plate at a later
time, see Fig. 4b. Note that, in the absence of cavitation, the incident pressure wave follows
the original exponential shape, as indicated by the dashed curve in Fig. 4b. As time
progresses, the CF continues propagating away from the structure, expanding the volume of
uncavitated water between the plate and the CF, and leading to attenuation of fluid pressure
within this water layer, see Figs. 3c and 3d.
For comparison, in Fig. 5 we present high-speed photographs for experiment 2 conducted
with 0
9.4 M Pap and 0.12 ms ; in this experiment the plate failed by shearing off at the
supports. In frame (a) the incident shock wave impinges on the wet surface of the composite
and leads to rapid elastic deformation (see Fig. 5b). In Fig. 5c we observe plate failure and
emergence of two cavitation zones in the water: the first one, appearing at distance
150 mmc
z , is a consequence of elastic plate deformation prior to failure, similar to that
observed in experiment 1 (Fig. 3). The emergence of an additional cavitation zone at distance
35 m mc
z can be explained as follows: the fracture process causes a sudden increase in
velocity of the fluid particles contiguous to the structure and this increases the amplitude of
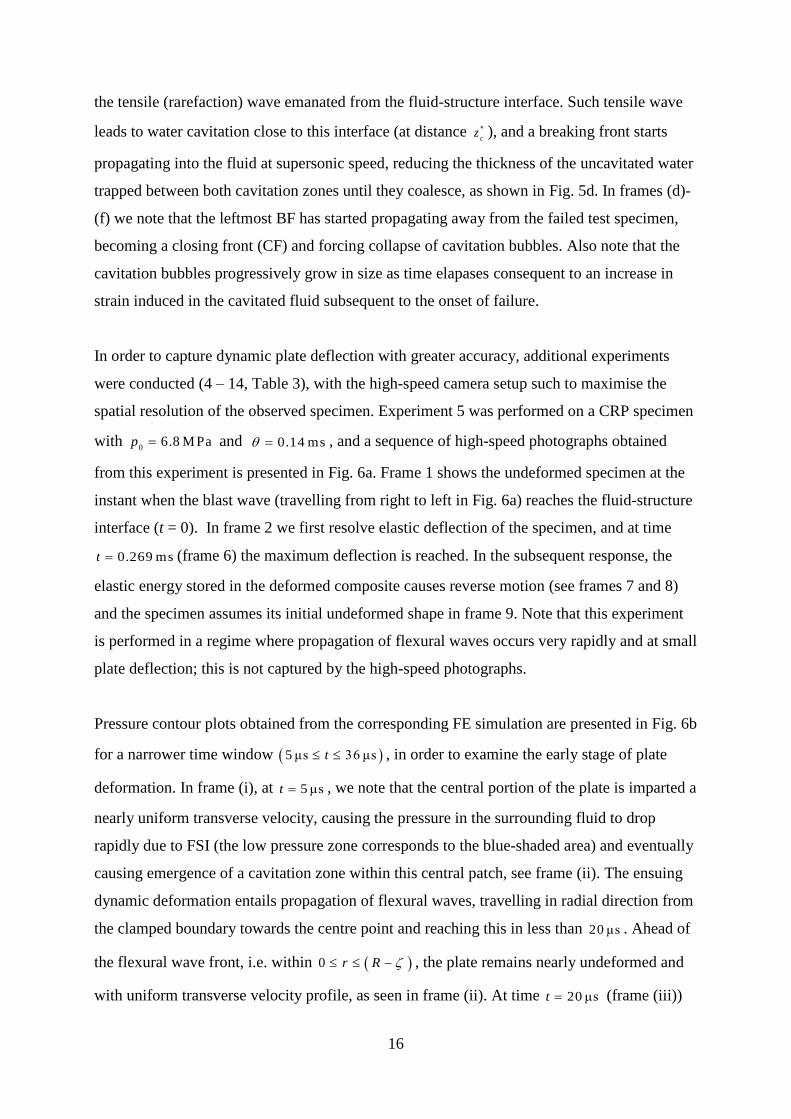
16
the tensile (rarefaction) wave emanated from the fluid-structure interface. Such tensile wave
leads to water cavitation close to this interface (at distance ), and a breaking front starts
propagating into the fluid at supersonic speed, reducing the thickness of the uncavitated water
trapped between both cavitation zones until they coalesce, as shown in Fig. 5d. In frames (d)-
(f) we note that the leftmost BF has started propagating away from the failed test specimen,
becoming a closing front (CF) and forcing collapse of cavitation bubbles. Also note that the
cavitation bubbles progressively grow in size as time elapases consequent to an increase in
strain induced in the cavitated fluid subsequent to the onset of failure.
In order to capture dynamic plate deflection with greater accuracy, additional experiments
were conducted (4 – 14, Table 3), with the high-speed camera setup such to maximise the
spatial resolution of the observed specimen. Experiment 5 was performed on a CRP specimen
with 0
6.8 M Pap and 0.14 ms , and a sequence of high-speed photographs obtained
from this experiment is presented in Fig. 6a. Frame 1 shows the undeformed specimen at the
instant when the blast wave (travelling from right to left in Fig. 6a) reaches the fluid-structure
interface (t = 0). In frame 2 we first resolve elastic deflection of the specimen, and at time
0.269 mst (frame 6) the maximum deflection is reached. In the subsequent response, the
elastic energy stored in the deformed composite causes reverse motion (see frames 7 and 8)
and the specimen assumes its initial undeformed shape in frame 9. Note that this experiment
is performed in a regime where propagation of flexural waves occurs very rapidly and at small
plate deflection; this is not captured by the high-speed photographs.
Pressure contour plots obtained from the corresponding FE simulation are presented in Fig. 6b
for a narrower time window 5 μs 36 μst , in order to examine the early stage of plate
deformation. In frame (i), at 5μst , we note that the central portion of the plate is imparted a
nearly uniform transverse velocity, causing the pressure in the surrounding fluid to drop
rapidly due to FSI (the low pressure zone corresponds to the blue-shaded area) and eventually
causing emergence of a cavitation zone within this central patch, see frame (ii). The ensuing
dynamic deformation entails propagation of flexural waves, travelling in radial direction from
the clamped boundary towards the centre point and reaching this in less than 20 μs . Ahead of
the flexural wave front, i.e. within 0 r R , the plate remains nearly undeformed and
with uniform transverse velocity profile, as seen in frame (ii). At time 20 μst (frame (iii))
cz

17
the central patch of the plate is still in contact with cavitated water; however, this cavitation
zone soon collapses (frame (iv), ) and the ensuing response produces pressure spikes
in the water adjacent to the specimen, as illustrated by the grey areas ( 6.8 M Pap ) in
frame (iv). The observed sequence of events in Fig. 5b is in line with the assumptions and
predictions of the theoretical models of Schiffer and Tagarielli (2014a).
Continued plate loading for 36 μst causes further elastic deformation by plate bending and
stretching (referred to in the following as Phase 2 response), giving rise to a secondary
cavitation event at a distance 150 mmc
z from the fluid-structure interface (not shown in
Fig. 6b), similar to what observed in experiment 1 (see Fig. 3). While the ‘early cavitation’
event is triggered by plate motion within the flexural wave propagation phase (also denoted as
Phase 1), the ‘secondary cavitation zone’ owes its emergence to elastic plate deformation
within the ensuing Phase 2 response.
This double-cavitation phenomenon has not been observed in previous experimental studies,
nor considered in modelling studies; it can be attributed to the large discrepancy between the
durations of Phase 1 and Phase 2 responses, denoted as 1
t and 2
t , respectively. It is clear
from the observations presented in Figs. 5a and 5b that, for the plate geometries and loading
conditions considered here, Phase 2 clearly dominates the response, and such behaviour
suppresses ‘early cavitation’ and promotes ‘secondary cavitation’. If the structural dimensions
and loading conditions were such to increase the duration of Phase 1, ‘early cavitation’ would
become more significant and both cavitation zones would eventually link up to form a large
pool of cavitated liquid spreading from the fluid-structure interface, as observed in the
simulations reported in Schiffer and Tagarielli (2014a). Accordingly, we define two regimes
of behaviour in underwater blast loading of elastic plates, as sketched in Fig. 7:
- double-cavitation regime (Fig. 7a): dominant when 2 1
t t , and
- bulk cavitation regime (Fig. 7b): dominant when 2 1
t t .
5.2 Dynamic plate deflection
High-speed photographs, such as those shown in Fig. 6a, allow measuring time histories of
the plate’s centre deflection consequent to blast loading. Such measurements are presented in
36 μst

18
this section and are compared with dynamic FE results as well as with analytical predictions
of Schiffer and Tagarielli (2014a). The analytical models are then employed to examine the
dependence of the normalised peak centre deflection m ax m ax
0 0w w R upon the governing
parameters of the problem.
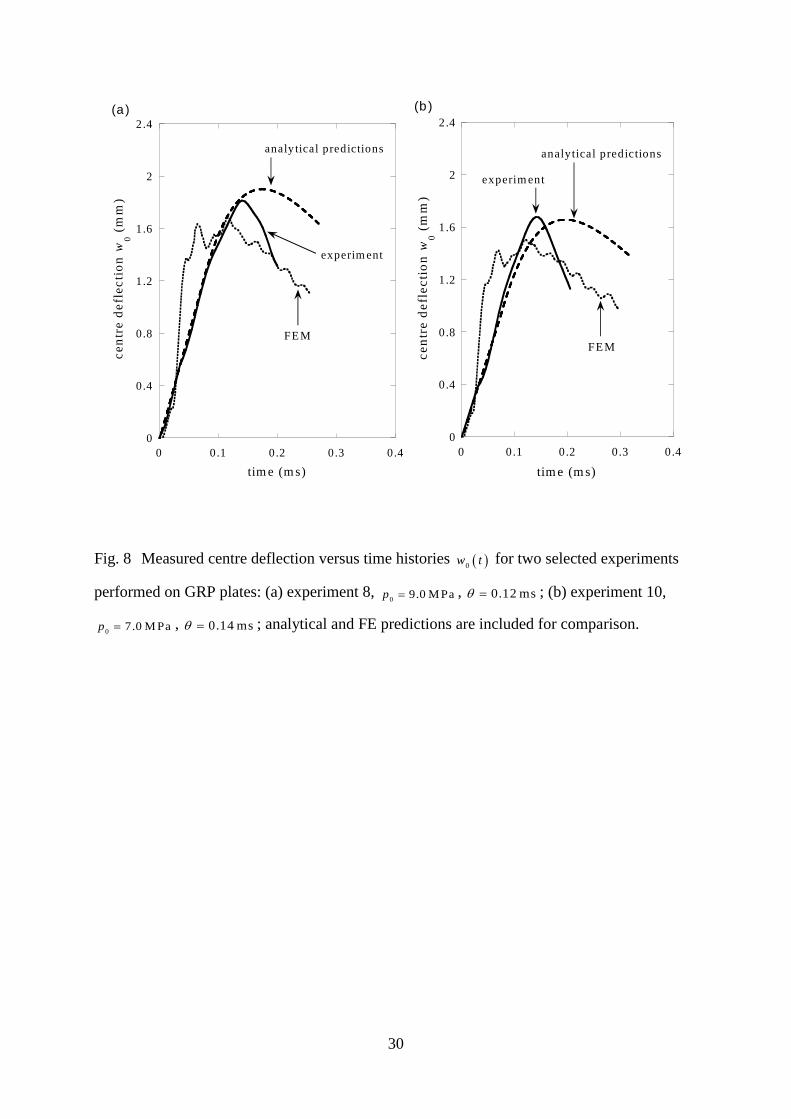
Figure 8a presents measurements of centre deflection versus time histories for experiment 8
performed on a GRP specimen with 0
9.0 M Pap and 0.12 ms , together with analytical
and FE predictions. It can be seen that analytical models accurately predict the measured
deflection versus time history for max
0 t t , with max
t the time when the maximum centre
deflection is reached, max
0 0 maxw w t .
In the initial phase of the response, 0 20 μst , the FE predictions also coincide with the
experimental results (and analytical predictions); subsequently, the FE simulations predict a
rapid increase in transverse plate velocity at 20 μst which is not observed in the
measurements and analytical predictions. Analysis of FE simulations shows that this is due to
reflections of flexural waves when these coalesce at the centre of the plate at around 20 μst
(recall the flexural wave propagation mechanism of Fig. 6b); this event is not included in the
theoretical models and it is also not captured by the experiments. Similar trends can be
observed for experiment 10, performed on a GRP specimen with 0
7.0 M Pap and
0.14 ms , as shown in Fig. 8b.
A possible explanation for this discrepancy is that material viscosity and air damping, not
modelled in FE simulations, may have suppressed or attenuated this mechanism. While a
more detailed analysis would be required to investigate this aspect, it is clear from Fig. 8 that
the theoretical models are able to capture peak deflection and response time of elastic
composite plates loaded by a shock-wave in water.
Having built some confidence on the validity of the analytical models in predicting the peak
central plate deflection 0
w , we proceed to examine the predicted dependence of the
normalised deflection m ax
0 0w w R upon geometrical and loading parameters (
0p , and
/h h R ) and to compare with the experimental results. Figure 9 presents measurements and

19
analytical predictions of m ax
0w as functions of
0p ; predictions are obtained for values of
and /h R corresponding to those used in experiments 4-14 (see Table 3). The analytical
predictions are in reasonably good agreement with measurements for all experiments.
The non-dimensional central deflection of the plate is strongly linked to the magnitude of the
elastic tensile strains experienced by the plates. In our experiments GRP specimens sustained
normalised centre deflections up to m ax
00.2w without failure, while CRP plates failed at
m ax
00.12w . This can be mapped to the higher tensile ductility of GRP (on the order of 3%)
compared to that of CRP ( 1%f
).
A direct comparison of the blast performance of the two materials examined in this study is
not possible on the basis of experimental results, due to the plates having slightly different
areal mass and thickness; in order to make a logical comparison, we employ the validated
analytical models and the observation that GRP plates have higher m ax
0w at failure. In Fig. 10
we present predictions of the non-dimensional peak plate deflection as a function of the peak
incident blast pressure. Predictions are obtained for both GRP and CRP plates of identical
areal mass and identical time decay constant , such to have the same value of the non-
dimensional FSI parameter /w wc . The aspect ratio of the CRP plate is chosen to be
identical to that employed in the experiments, / 0.06h R , while the aspect ratio of the GRP
is inevitably lower for a same-mass comparison ( / 0.058h R ), however it is not too different
from that used in the experiments ( / 0.068h R ).
The predictions for CRP are shown as a solid line up to the deflection at which failure was
observed in the experiments, denoted by a cross. For GRP plates, predictions are shown as a
solid line up to the highest deflection observed in the experiments (denoted by a square); as
failure was not observed in the GRP tests, it is natural to expect that this will occur at higher
deflections, as indicated schematically in the figure. For a given peak blast pressure 0
p , CRP
plates always deflect less than GRP plates of equivalent mass if failure does not occur.
However, the higher tensile ductiliy of the glass-based composite results in the fact that, for a
given mass, GRP plates resist without failure a higher pressure than that sustained by CRP
plates. Here it is important to note that when the structural dimensions are scaled up to the
size of full-scale military vessels, the failure mechanism may change, and the above statement
20
on the blast performance may have to be amended accordingly. Therefore, more experiments
on larger plates are necessary for a complete examination of failure modes accross all relevant
length scales, and to guide material and structural design of full-scale naval components.
6. Conclusions
Underwater shock experiments were performed on circular carbon-fibre and glass-fibre
composite plates by using a transparent shock tube. Dynamic specimen deformation as well as
water cavitation was observed via high-speed photography. The conclusions of the study are
the following:
Measurements of the peak deflection and time response of the plates were found in
agreement with 3D coupled FE simulations and served to validate recently developed
theoretical models (Schiffer and Tagarielli, 2014a).
It was observed that the early, wave-dominated deformation response results in the
emergence of a localised cavitation zone at the fluid-structure interface and in the
central portion of the plates; this zone then quickly collapses upon coalescence of the
flexural waves in the centre. Subsequent plate deflection induces an additional
cavitation zone at a finite distance from the plate; expansion and subsequent collapse
of such zone affects significantly the loading on the plate. The occurrence of the above
double-cavitation event was observed here for the first time, thanks to the
experimental technique employed, concluding that this mechanism is promoted when
the flexural wave propagation period is short compared to the overall structural
response time.
The validated theoretical models by Schiffer and Tagarielli (2014a) were used to
compare the response of CRP and GRP plates of equal mass and the blast resistance of
the GRP plates was found to be higher than that of CRP plates due to the higher tensile
ductility of the GRP material.
Although the current study gives great physical insight into the fundamental FSI processes
associated with the elastic response of fiber-reinforced composites, the failure mechanisms

21
observed here for the small-scale specimens may change when the structural dimensions of
are scaled up to the size of full-scale naval structures. Therefore, more experiments on larger
plates are necessary in order to obtain a full set of failure modes accross all relevant length
scales and to inspire development of more detailed damage and failure models, which can be
used to guide material selection and structural design of full-scale naval components subject
to the threat of an explosion in water. This topic is left as a future study.
Acknowledgements
The authors are grateful for financial support of EPSRC and DSTL under grant number
EP/G042586/1.
References
Cole, R.H., 1948. Underwater Explosions. Princeton University Press, Princeton, NJ, USA.
Deshpande, V.S., Fleck, N.A., 2005. One-dimensional response of sandwich plates to
underwater shock loading. J. Mech. Phys. Solids 53, 2347-2383.
Deshpande, V.S., Heaver, A., Fleck, N.A., 2006. An underwater shock simulator. P. Roy. Soc.
Lond. A Mat. 462, 1021-1041.
Espinosa, H.D., Lee, S., Moldovan, N., 2006. A novel fluid structure interaction experiment
to investigate deformation of structural elements subjected to impulsive loading. Exp.
Mech. 46.
Gibson, R.F., 1994. Principles of composite material mechanics. McGraw Hill, Inc., New
York, US.
Hall, D.J., 1989. Examination of the effects of underwater blasts on sandwich composite
structures. Compos. Struct. 11, 101-120.
Hutchinson, J.W., Xue, Z., 2005. Metal sandwich plates optimized for pressure impulses. Int.
J. Mech. Sci. 47, 545-569.
Kennard, E.H., 1943. Cavitation in an elastic liquid. Phys. Rev. 63, 172-181.
Korteweg, D.J., 1878. Uber die Fortpflanzungsgeschwindigkeit des Schalles in elastischen
Rohren. Ann. Phys. 5, 525-542.
Latourte, F., Gregoire, D., Zenkert, D., Wei, X., Espinosa, H.D., 2011. Failure mechanisms in
composite panels subjected to underwater impulsive loads. J. Mech. Phys. Solids 59, 1623-
1646.
LeBlanc, J., Shukla, A., 2010. Dynamic response and damage evolution in composite
materials subjected to underwater explosive loading: An experimental and computation
study. Compos. Struct. 92, 2421-2430.

22
Liang, Y., Spuskanyuk, A.V., Flores, S.E., Hayhurst, D.R., Hutchinson, J.W., McMeeking,
R.M., Evans, A.G., 2007. The response of metallic sandwich panels to water blast. J. Appl.
Mech. 71, 81-99.
McMeeking, R.M., Spuskanyuk, A.V., He, M.Y., Deshpande, V.S., Fleck, N.A., Evans, A.G.,
2007. An analytical model for the response to water blast of unsupported metallic
sandwich panels. Int. J. Solids Struct. 45, 478-496.
Mori, L.F., Lee, S., Xue, Z.Y., Vaziri, A., Queheillalt, D.T., Dharmasena, K.P., Wadley,
H.N.G., Hutchinson, J.W., Espinosa, H.D., 2007. Deformation and fracture modes of
sandwich structures subjected to underwater impulsive loads. J. Mech. Mater. Struct. 2,
1981-2006.
Mori, L.F., Queheillalt, D.T., Wadley, H.N.G., Espinosa, H.D., 2009. Deformation and failure
modes of I-core sandwich structures subjected to underwater impulsive loads. Exp. Mech.
49, 257-275.
Mouritz, A.P., Saunders, D.S., Buckley, S., 1994. The damage and failure of GRP laminates
by underwater explosion shock loading. Composites 25, 431-437.
ONR, 1950. Underwater explosion research: a compendium of British and American reports,
Washington, DC, USA.
Ramajeyathilagam, K., Vendhan, C.P., 2004. Deformation and rupture of thin rectangular
plates subjected to underwater shock. Int. J. Impact Eng. 30, 699-719.
Schiffer, A., Tagarielli, V.L., 2012. The response of rigid plates to blast in deep water: fluid-
structure interaction experiments. P. Roy. Soc. Lond. A Mat. 468, 2807-2828.
Schiffer, A., Tagarielli, V.L., 2013. One-Dimensional Response of Sandwich Plates to
Underwater Blast: Fluid-Structure Interaction Experiments and Simulations. Int. J. Impact
Eng. 71, 34-49.
Schiffer, A., Tagarielli, V.L., 2014a. The dynamic response of composite plates to underwater
blast: theoretical and numerical modelling. Int. J. Impact Eng. 70, 1-13.
Schiffer, A., Tagarielli, V.L., 2014b. The One-Dimensional Response of a Water-Filled
Double Hull to Underwater Blast: Experiments and Simulations. Int. J. Impact Eng. 63,
177-187.
Schiffer, A., Tagarielli, V.L., Petrinic, N., Cocks, A.F.C., 2012. The Response of Rigid Plates
to Deep Water Blast: Analytical Models and Finite Element Predictions. J. Appl. Mech. 79.
Swisdak, M.M., 1978. Explosion effects and properties: part II - explosion effects in water.
Naval surface weapons centre, Dahlgren, VA, USA.
Tagarielli, V., L., Deshpande, V.S., Fleck, N.A., 2010. Prediction of the dynamic response of
composite sandwich beams under shock loading. Int. J. Impact Eng. 37, 854-864.
Tagarielli, V.L., Fleck, N.A., Deshpande, V.S., 2004. Collapse of clamped and simply
supported composite sandwich beams in three-point bending. Compos. Part B-Eng. 35,
523-534.
Taylor, G.I., 1963. The pressure and impulse of submarine explosion waves on plates, in:
Batchelor, G.K. (Ed.), The scientific papers of G.I. Taylor, Vol III. Cambridge University
Press, Cambridge, UK, pp. 287-303.
Wadley, H., Dharmasena, K., Chen, Y., Dudt, P., Knight, D., Charette, R., Kiddy, K., 2008.
Compressive response of multilayered pyramidal lattices during underwater shock loading.
Int. J. Impact Eng. 35, 1102-1114.

23

24
Figures
Fig. 1 Schematic of the experimental apparatus used in this study to perform underwater
blast experiments on circular composite plates.
Fig. 2 Sketch of the theoretical description by Schiffer and Tagarielli (2014a): initial
configuration (a), propagation of a flexural wave at velocity (b) and arrival of the flexural
wave at the plate centre (c).

25
Fig. 3 Illustration of high-speed photographs for experiment 1 (0
7.2 M Pap , 0.12 ms )
performed on a CRP specimen, together with fluid pressure contour plots obtained from the
corresponding FE simulation: (a) pressure wave reaches the specimen; (b) elastic deformation
of the specimen and emergence of a cavitation zone, expanding by propagation of two
breaking fronts (BF); the leftgoing BF inverts its direction of motion and becomes a closing
front (CF); (c) the CF propagates away from the structure and forces collapse of cavitation
bubbles; (d) complete collapse of the cavitation zone.

26
Fig. 4 Schematic illustration of the loading mechanism produced by emergence and collapse of a
cavitation zone at distance zc from the fluid-structure interface: (a) incident wave pressure, pin, as a
function of the z-coordinate, at an instant shortly after the cavitation process has initiated, by
propagation of two breaking fronts (BF); (b) the leftgoing BF has inverted motion and become a
closing front (CF), causing an increase in pin due to reflection of pressure waves impinging on the CF;
the dashed curve represents the incident wave pressure in absence of cavitation.

27
Fig. 5 Sequence of high-speed photographs for experiment 2 (0
9.4 M Pap , 0.12 ms )
performed on a CRP specimen: (a) pressure wave reaches the specimen; (b) specimen
deforms elastically; (c) onset of plate failure and emergence of two cavitation zones, both
expanding by propagation of breaking fronts (BF); (d) coalescence of both cavitation zones
and emergence of a closing front (CF); (e)-(f) collapse of cavitated water by propagation of
the CF.

28
Fig. 6 (a) High-speed photographic sequence for experiment 5 showing dynamic deflection
of the CRP specimen consequent to underwater shock loading (0
6.8 M Pap , 0.14 ms );
(b) fluid pressure contour plots obtained from the corresponding FE simulations for four
selected time frames.

29
Fig. 7 Two regimes of response in underwater blast loading of elastic plates: (a) double-cavitation
regime, dominant when the duration of the flexural wave propagation phase, t1, is much shorter than
the structural response time, t2, and (b) bulk cavitation regime, dominant when t1 ≈ t2 . The present
experimental study has investigated case (a).
30
0
0.4
0.8
1.2
1.6
2
2.4
0 0.1 0.2 0.3 0.4
ce
ntr
e d
efl
ec
tio
n w
0 (
mm
)
tim e (m s)
(a )
analy tical predictions
experim ent
FEM
0
0.4
0.8
1.2
1.6
2
2.4
0 0.1 0.2 0.3 0.4
ce
ntr
e d
efl
ec
tio
n w
0 (
mm
)
tim e (m s)
(b )
analytical predictions
experim ent
FEM
Fig. 8 Measured centre deflection versus time histories 0w t for two selected experiments
performed on GRP plates: (a) experiment 8, 0
9.0 M Pap , 0.12 ms ; (b) experiment 10,
07.0 M Pap , 0.14 ms ; analytical and FE predictions are included for comparison.

31
Fig. 9 Analytical predictions of the normalised peak centre deflection m ax m ax
0 0w w R as a
function of shock wave peak pressure 0
p for underwater blast loading of the circular CRP and
GRP plates under investigation; contours of shock wave decay time , as measured for
experiments 4 – 14, are included; measurements obtained from these experiments are
indicated by markers.

32
0
0.05
0.1
0.15
0.2
0.25
2 4 6 8 10 12 14 16
w0
m ax
p0 (M Pa)
h / R = 0 .058
h / R = 0 .06
G R P
C R P
CR P fa ilure
= 1.125 kgm-2
= 1.125 kgm-2
Fig. 10 Analytical predictions of the normalised peak centre deflection m ax m ax
0 0w w R as a
function of the peak shock-wave pressure 0
p for CRP and GRP plates of equal areal mass, .

33
Tables
Table 1: Properties of the constituent materials
carbon fibre epoxy resin E-glass fibre vinylester resin
Tensile modulus (GPa) 225 4.2 76 3.4
Shear modulus (GPa) 15 1.57 31 1.3
Poisson’s ratio 0.2 0.34 0.22 0.35
Density (kg m-3
) 1790 1265 2540 1050
Table 2: Elastic constants of the laminae used to model CRP and GRP plates
E1 E2 = E3 ν12 = ν23 ν21 G12 G13 G23
(GPa) (GPa) (GPa) (GPa) (GPa)
CRP 103 7.5 0.28 0.020 2.62 2.62 2.93
GRP 27.8 5.0 0.30 0.055 1.86 1.86 1.92
Table 3: Details of experiments performed in this study
test specimen h MS vS p0 θ 0p
failure
material (mm) (g) (ms-1
) (MPa) (ms) 10-3
mode
1 CRP 0.75 64 7.5 7.2 0.12 0.131 0.017 -
2 CRP 0.75 64 9.8 9.4 0.12 0.182 0.017 shear-off
3 CRP 0.75 78 11.1 10.8 0.14 0.196 0.015 shear-off
4 CRP 0.75 78 9.3 9.0 0.14 0.164 0.015 -
5 CRP 0.75 78 7.0 6.8 0.14 0.124 0.015 -
6 CRP 0.75 64 8.2 7.8 0.12 0.142 0.017 -
7 CRP 0.75 64 6.8 6.5 0.12 0.118 0.017 -
8 GRP 0.85 64 9.4 9.0 0.12 0.692 0.036 -
9 GRP 0.85 78 10.3 10.0 0.14 0.769 0.031 -
10 GRP 0.85 78 7.2 7.0 0.14 0.538 0.031 -
11 GRP 0.85 92 10.0 9.8 0.163 0.754 0.026 -
12 GRP 0.85 92 9.8 9.7 0.163 0.746 0.026 -
13 GRP 0.85 105 9.9 9.8 0.185 0.754 0.023 -
14 GRP 0.85 105 10.2 10.1 0.185 0.777 0.023 -
R