the relationship between firm size and financial leverage
TRANSCRIPT

THE RELATIONSHIP BETWEEN FIRM SIZE AND FINANCIAL
LEVERAGE OF FIRMS LISTED AT NAIROBI SECURITIES
EXCHANGE
DOREEN MARETE
D61/72334/2011
A RESEARCH PROJECT SUBMITTED IN PARTIAL
FULFILLMENT OF THE REQUIREMENTS FOR THE AWARD OF
THE DEGREE OF MASTER OF BUSINESS ADMINISTRATION,
SCHOOL OF BUSINESS, UNIVERSITY OF NAIROBI
OCTOBER 2015

ii
DECLARATION
This research project is my original work and has not been presented to any other university
or college for an award of a certificate, diploma or degree.
Signature ………………………………… Date………………………
Doreen Marete
D61/72334/2011
This research proposal has been submitted for examination with my approval as the
University of Nairobi supervisor
Sign ………………….…………….. Date………………….……..
Dr. Kennedy Okiro
Department of Finance and Accounting
Lecturer, University of Nairobi

iii
DEDICATION
This research project is dedicated to my loving parents for laying a strong foundation for
my life. I am forever grateful.

iv
ACKNOWLEDGEMENT
Special thanks to my Heavenly Father for His goodness throughout this journey and for
granting me all the resources, good health and the zeal to accomplish this study.
My sincere gratitude to my supervisor Dr. Kennedy Okiro for the great guidance, support,
constructive suggestions and inspiration throughout this research project. God bless you.
For all those who contributed directly or indirectly to the accomplishment of this project,
You have my sincere appreciations.

v
TABLE OF CONTENTS
DECLARATION............................................................................................................... ii
DEDICATION.................................................................................................................. iii
ACKNOWLEDGEMENT ............................................................................................... iv
LIST OF TABLES ........................................................................................................ viii
LIST OF FIGURES ......................................................................................................... ix
ABBREVIATIONS AND ACRONYMS ........................................................................ ix
ABSTRACT ..................................................................................................................... ixi
CHAPTER ONE: INTRODUCTION ............................................................................. 1
1.1Background of the Study ............................................................................................... 1
1.1.1 Firm Size ............................................................................................................ 2
1.1.2 Financial Leverage ............................................................................................. 3
1.1.3 The relationship Between the Firm Size and Financial Leverage ...................... 4
1.1.4 Nairobi Securities Exchange .............................................................................. 5
1.2 Research Problem ......................................................................................................... 6
1.3 Objective of the Study .................................................................................................. 8
1.4 Value of the Study ........................................................................................................ 8
CHAPTER TWO:LITERATURE REVIEW ............................................................... 10
2.1 Introduction ................................................................................................................. 10
2.2 Theoretical Framework ............................................................................................... 10

vi
2.2.1 Modigliani and Miller ...................................................................................... 10
2.2.2 Trade off Theory .............................................................................................. 11
2.2.3 Pecking Order Theory ...................................................................................... 13
2.3 Determinants of Financial Leverage ........................................................................... 14
2.3.1 Profitability ....................................................................................................... 15
2.3.2 Reserve Capacity .............................................................................................. 15
2.3.3 Firm Size .......................................................................................................... 16
2.3.4 Financial Leverage ........................................................................................... 16
2.4 Empirical Review........................................................................................................ 17
2.5 Summary of the Literature Review ............................................................................. 21
CHAPTER THREE: RESEARCH METHODOLOGY ............................................. 22
3.1 Introduction ................................................................................................................. 22
3.2 Research Design.......................................................................................................... 22
3.3 Population and Sampling ............................................................................................ 22
3.4 Data Collection ........................................................................................................... 23
3.5 Data Analysis .............................................................................................................. 23
3.5.1 Analytical Model .............................................................................................. 24
3.5.2 Tests of Significance ........................................................................................ 25
CHAPTER FOUR:DATA ANALYSIS, FINDINGS AND DISCUSSION ................ 26
4.1 Introduction ................................................................................................................. 26
4.2 Descriptive Statistics ................................................................................................... 26

vii
4.2.1 Financial Leverage ........................................................................................... 28
4.2.2 Return on Assets ............................................................................................... 29
4.2.3 Sales Volume .................................................................................................... 30
4.3 Correlation Analysis ................................................................................................... 32
4.5 Interpretation of the Findings...................................................................................... 35
CHAPTER FIVE:SUMMARY, CONCLUSION AND RECOMENDATIONS ....... 37
5.1 Introduction ................................................................................................................. 37
5.2 Summary ..................................................................................................................... 37
5.3 Conclusion .................................................................................................................. 39
5.4 Recommendations for Policy and Practice ................................................................. 40
5.5 Limitations of the Study.............................................................................................. 40
5.6 Suggestions for Further Research ............................................................................... 41
REFERENCES ................................................................................................................ 42
APPENDIX 1: LIST OF FIRMS LISTED AT NSE ........................................................ 46
APPENDIX II: FINANCIAL DATA FOR LISTED COMPANIES ................................ 50

viii
LIST OF TABLES
Table 4.1: Descriptive statistics results of the main variables ...................................... 27
Table 4.2 Financial Leverage ........................................................................................ 28
Table 4.3 Return on Assets ........................................................................................... 29
Table 4.4 Average Sales Volume per Year ................................................................... 30
Table 4.5 Pearson Product Correlation Coefficients (r) ................................................ 32
Table 4.6 Model Summary ............................................................................................ 33
Table 4.8 Analysis of Variance ..................................................................................... 34
Table 4.9 Regression model .......................................................................................... 34

ix
LIST OF FIGURES
Figure 4.1: Financial Leverage...................................................................................... 28
Figure 4.2: Returns on Assets ....................................................................................... 30
Figure 4.3: Average Sales Volumes .............................................................................. 31
x
ABBREVIATIONS AND ACRONYMS
CMA-Capital Markets Authority
NSE-Nairobi Securities Exchange
QR-Quintile Regression
R&D-Research and Development
ROE-Return on Equity
ROI-Return on Investment

xi
ABSTRACT
The purpose of the study was to establish the relationship between firm size and financial
leverage of companies listed at the Nairobi Securities Exchange. Specifically the study
sought to establish the effect of firm size, profitability and sales volume on financial
leverage of companies listed Nairobi Securities Exchange. Based on the trade off and
pecking order theory this study builds a comprehensive framework to answer the research
question on whether firm size affects financial leverage of firms listed at Nairobi Securities
Nairobi. A census survey was carried out on all the 64 listed companies between 2010 and
2014 in Nairobi Securities Exchange. The financial leverage was measured using
debt/equity. The variables were tested using regression analysis and Pearson’s Product
Moment Correlation analysis. Descriptive statistics were computed for the listed
companies and the main characteristics of the study variables. The findings revealed that
the relationship between firm size and financial leverage was statistically significant.
There was a significant positive relationship between firm size and financial leverage. The
study also confirmed that there is a negative significant relationship between profitability
(ROA) and financial leverage. It was also established that there is a negative significant
relationship sales volume and financial leverage. The study not only contributes to
understanding the link between firm size and financial leverage but at the same time
confirms the findings of previous studies that have found a significant link between firm
size and financial leverage.

1
CHAPTER ONE: INTRODUCTION
1.1Background of the Study
The size of a firm plays an important role in determining the kind of relationship the firm
enjoys within and outside its operating environment. The larger a firm is, the greater the
influence it has on its stakeholders. Again, the growing influences of conglomerates and
multinational corporations in today's global economy are indicative of what role size plays
within the corporate environment.
Kumar (2001) argue that an interesting aspect of economic growth is that much of it takes
place through the growth in the size of existing organizations. Large and stable firms make
huge investments that positively impact on the economy in terms of job creation and
payment of taxes. This is in line with the findings by Rajan and Zingales (1995) who
studied a sample of 43 countries show that two‐thirds of the growth in industries over the
1980s, was found to come from the growth in the size of existing establishments, while
only one‐third trickled in from the creation of new ones.
One of the most popular areas where the influence of firm size has been much queried is
the area of practice of corporate finance. The debate on whether firm size has any
relationship with use of financial leverage has received growing attention. Diverse views
from different scholars have triggered interest to investigate this relationship. Graham and
Harvey (2002), for instance, through their survey, sort the views of about 392 chief
financial officers from about 4,440 firms on the current practice of corporate finance.
Results of the survey show that firm size significantly affects the practice of corporate

2
finance. Kumar (2007) puts more emphasis that profit interacts with size; large firms are
less susceptible to bankruptcy because they tend to be more diversified than smaller
companies. Therefore, low levels of bankruptcy enable large firms to take on more debts.
The larger firms can reduce the level of information asymmetries in the market and obtain
financial resources more easy which in turns leads to financial performance of a firm.
1.1.1 Firm Size
Pandey (2004) defines firm size in terms of total assets held by an organization. Dittmar
(2004) emphasized that profit interacts with size; large firms are less susceptible to
bankruptcy because they tend to be more diversified than smaller companies. Therefore,
low levels of bankruptcy enable large firms to take on more debts. The larger firms can
reduce the level of information asymmetries in the market and obtain financial resources
more easily which in turn leads to financial performance of a firm (Gonenc, 2005).
It is worth noting that larger firms are more diversified than smaller firms. Large firms
have higher capacity to meet up with interest payments (Cazorla‐Papis, 2001). Such
companies are also found to be enjoying higher degree of information disclosure (Rajan
and Zingales, 1995), and they have higher collateral values and lesser bankruptcy risks.
This creates more opportunities for large firms to qualify for financial leverage as opposed
to smaller firms.
Large firms supposedly ought to have higher investment opportunities and so they have
higher need for cash than smaller firms (Dittmar, 2004, p. 12). As a firm grows in size, its

3
ability to borrow increases, and so, its debt‐equity ratio increases concurrently. Within the
circuit of small firms, need for funds may be limited by the fact that their scales of
operations are also limited. Banks and investors are afraid of committing funds in the
projects of small businesses. Small firms themselves may be indisposed to expose
themselves to risks associated with distress and bankruptcy, as well as loss of ownership.
The size of the firm is measured using the logarithm of total assets which is fixed assets
plus current assets. Asset turnover is also a measure of firm size which is average sales
divided by total assets of the firm (Kumar, Rajan and Zingales, 2001).
1.1.2 Financial Leverage
According to Huyghebaert (2006) financial leverage is the use of fixed cost financing. It is
always a choice item. No firm is required to have any long-term debt. Firms can instead
finance operations and capital expenditures from internal sources and the issuance of
common stocks. Financial leverage is employed in the hope of increasing the return to
common shareholders. Tongurai (2015) favorable or positive leverage is said to occur when
the firm uses funds obtained at a fixed cost to earn more than the fixed financing costs paid.
Any profits left after meeting the fixed financing costs then belong to common
shareholders. Unfavorable or negative leverage occurs when the firm does not earn as much
as the fixed financing costs.
Graham (2000) argue that the greater the amount of debt, the greater the financial leverage.
Financial leverage is the extent to which interest on debt magnifies changes in operating
income into even greater proportionate changes in earnings after taxes. It increases earnings

4
per share during period of rising operating income but adds significant risks for
stockholders and creditors because of added interest obligations. Dittmar (2004) indicate
that debt is one of the tools used by firms to leverage their capital and enhance profits. One
of the best ways in which company increases its profit is through financial leverage.
Financial leverage uses debt instruments so that the anticipated level return on the
company's equity would increase. The level of financial leverage of a certain company is
determined by getting the total value of debt and the equity and the ratio of debt.
1.1.3 The relationship Between the Firm Size and Financial Leverage
Firm size has been one of the variables most commonly used in explaining a company's
level of debt. Many studies have made it clear that the size of a firm is positively related to
its use of debt as a source of financing. The larger a firm is, the more information is
expected to be available about it, which reduces the level of information asymmetries in
the market, making it possible to obtain financial resources from lenders. The tangible
assets of a firm can be considered representative of the real guarantees that it can offer its
creditors. Therefore, the importance of those assets among total assets influences its level
of debt, which rises with the increase of warranties offered by the firm to satisfy its
obligations arising from contracted debt (Gregory and Tenev, 2001).
Gonenc (2005) have argued that the size of the firm and financial leverage are positively
correlated. Large firms may favor equity financing than debt financing due to the relativity
of the cost of equity financing owing to asymmetric information which is small for such
firms. Such firms may also be enjoying some reputation advantage among prospective
investors especially, as a result of their consolidation in the market. Therefore, they may

5
prefer to exploit this opportunity instead of approaching commercial banks. Other
supporters of the negative linear relationship between size and leverage are Cooley and
Quandrini (2001), find that smaller and younger firms pay fewer dividends, take on more
debt, and comparatively invest more than relatively large firms. Others are Mat Nor and
Ariffi (2006) and Berger and Udell (1994) whose studies reveal that small firms do fall
back heavily on bank loans for their financing requirements and become heavily indebted
than larger companies.
1.1.4 Nairobi Securities Exchange
The Nairobi Securities Exchange is licensed and regulated by the Capital Markets
Authority (CMA). It has the mandate of providing a trading platform for listed securities
and overseeing its Member Firms. The Capital Markets Authority is the Government
Regulator charged with licensing and regulating the capital markets in Kenya. It also
approves public offers and listings of securities traded at the Nairobi Stock Exchange.
There is currently 64 licensed firms under the Nairobi securities Exchange.
In Kenya large listed firms favor equity financing than debt financing due to the relativity
of the cost of equity financing. Large and reputable firms are more advantaged here in
Kenya especially among investors. This has been driven by the realization of the
importance of consolidation to increase synergy among listed firms in Kenya. The local
investors prefer consolidation of firms rather than lending from a commercial bank. In the
local setting growth of small firms is more sensitive to internal finance than that of larger

6
firms. Small firms are more likely to face financial constraints; this prevents them to gain
access to finances from banks (Njoroge, 2014). These firms are prepared to pay higher
interest rates for additional loans and thus fail to consider issuing external equity in order
to stay in control. Large and stable firms can predict the future due to access of information
as compared to smaller firms. This makes it easier for them to access debt since they easily
plan for their future.
1.2Research Problem
When a firm becomes larger, it enjoys economics of scale and its average cost of production
is lower and operational activities are more efficient. Abel (2008) opines that large firms
face less difficulty in getting access to credit facilities from financial institutions for
investment. This is because they have broader pools of qualified human capital, and may
achieve greater strategic diversification. Akbas and Karaduman (2012) stated that larger
firms have some advantages such as greater possibility of taking advantage of scale of
economies which can enable more efficient production, a greater bargaining power
over both suppliers and distributors or clients, exploiting experience curve effects and
setting prices above the competitive level.
In the Kenyan market the size of the firm is highly influenced by financial markets
development. Li (2005) pinpointed that the effect firm size has on leverage depends equally
on the level of financial markets development within an economy. Li (2005) make clearer
the implications of this condition. The results of their work interestingly demonstrate that
large economies benefit firms of different sizes, especially small firms, to access long‐term

7
borrowing. Fast‐growing economies only increase the access of large and medium firms to
long‐term debt.
Studies have been done on firm size: Gupta (1969) investigated the effect of size on growth
of manufacturing companies. The results showed that firm size was positively related to
growth of manufacturing firms. Symeou (2012) examined the relationship between the firm
size and financial performance. The results of the analysis revealed that there was a
statistically significant relationship between firm size and financial performance. Ezeoha
(2008) studied the relationship between firm size and corporate financial‐leverage choice
in a developing economy. The findings revealed that there was a positive relationship
between firm size and corporate financial-leverage.
Kithuka (2013) did a study on the relationship between firm size and financial innovation
of firms listed at the Nairobi Securities Exchange. The study found that the firm size
influenced financial innovation. Njoroge (2014) studied the effect of firm size on financial
performance of pension schemes in Kenya. The results indicated that there was significant
market volatility as evident from the NSE index, Treasury bill rate movement and offshore
indices. Tale (2014) investigated the relationship between capital structure and
performance of non-financial firms. The results of the control variable: the size of the firm
showed a positive relationship with financial performance of non-financial firms.
From the above studies, none has focused on the relationship between firm size and
financial leverage of listed firms at Nairobi Security Exchange. This study seeks to find an

8
answer to the following research question: what is the effect of firm size on financial
leverage of firms listed at Nairobi Securities Exchange?
1.3 Objective of the Study
To determine the effect of firm size on financial leverage of firms listed at Nairobi
Securities Exchange.
1.4 Value of the Study
The empirical findings might be useful to policy makers; like Capital Markets Authority
(CMA) in setting policies that encourage listed firms to use debt in order to benefit from
tax deductions and improve performance. This study will notify the importance of
effectively balancing the capital structure to prevent cases of financial distress by firms.
Other firms will learn the benefits of utilizing financial leverage and how its impacts on
performance of listed firms. The findings of the study might be used as a guide by large
and small firms when making deciding whether to finance their firm through debt or equity.
The study will contribute to the existing literature. It will add more information on the
theories and the relationship between firm size and financial leverage of listed firms.
Researchers interested in this field of research might use the findings of this study as a
point of reference for further research.

9

10
CHAPTER TWO
LITERATURE REVIEW
2.1 Introduction
This chapter covers the theoretical framework, the determinants of financial leverage,
empirical review and the summary of the literature review.
2.2 Theoretical Framework
This section will cover the theories that support the relationship between the size of the
firm and financial leverage. These theories are: Modigliani Miller Orr Model, Tradeoff
Theory and Pecking Order theory as follows:
2.2.1 Modigliani and Miller
Miller and Modigliani's (MM) important contribution to capital structure theory of 1958,
which showed that, given a company's investment policy, and not taking taxes and
transaction costs into account, the choice of financial policy does not affect the current
market value of the company. However, because real markets are far from the so‐called
perfect capital markets on which MM based their work; numerous studies have shown the
interdependence among investment decisions, financing decisions, and firm value
(Modigliani and Miller, 1963).

11
There are certain factors, such as taxes, that favor a company's use of debt, but others, such
as the cost of bankruptcy, that limit that tax advantage. Along these lines, it may be said
that agency and signal theories offer considerable help in understanding a company's use
of debt. Specifically, the use of debt may reduce managerial discretion and mitigate
conflicts of interest between management and the contributors of funds to the company
(Haugen and Baker, 2006).
Moreover, as a consequence of separating ownership and management, shareholders have
less information about the company than do managers. Ovtchinnikov (2010) puts forth that
the value of debt as an information signal and a mechanism to control agency conflicts is
the reason why companies sometimes increase their debt, even when there are no fiscal
reasons for doing so. The benefits of issuing debt come from both tax shield and non-tax
shield effects. Use of debt enables tax saving as a result of tax deduction. The higher a
firms’ leverage is, the higher the bankruptcy cost will be, and thus creditors will charge a
higher interest rate. Moreover, the risk for a creditor is relatively high in this situation,
which will lead to agency problems. When a firm’s leverage remains at a low level, the tax
shield benefits will surpass the cost, but as the debt rises, the cost will also rapidly increase.
Therefore, the leverage generally has a negative effect on firm size.
2.2.2 Trade off Theory
Jensen and Meckling (1976) postulated that the specific costs of capital criterion ignore
risk and impact on equity value and costs. The impact of financing decision on the overall
cost of capital should be emulated and the criterion should be to minimize the overall cost

12
of capital or to maximize the value of the firm. Tax shield advantage of debt on account
of interest tax deductibility leads to a favorable impact on value and would help reduce the
overall cost of capital. It should however, be realized that a firm cannot continuously
minimize its overall cost of capital by employing debt. A point or range is reached beyond
which debt becomes more expensive because of the increased risk of excessive debt to
creditors as well as the shareholders (Burgman, 2006).
According to Rajan and Zingales (1995) when the degree of leverage increases, the risk of
creditors increases and they demand a higher interest rate which might inhabit the firm to
access credit once the debt has accumulated to a certain level. Further, excessive use of
financial leverage risk’s the shareholders position. This has the effect of increasing the cost
of equity. Thus, to a point that the overall cost of capital decreases with debt, but beyond
that point the cost of capital would start increasing and, therefore, it would not be
advantageous to employ debt further. There is a combination of debt and equity which
minimizes the firm’s average cost of capital and maximizes the market value per share.
Deis and Guffey (2005) posit that financial distress arises when the firm is not able to meet
its financial obligation as and when the fall due. The firm’s continuous failure to make
payment to debt-holders can ultimately to the insolvency of the firm. For a given level of
operating risk, financial distress exacerbates with higher debt. With higher business risk
and higher debt the probability of financial distress is much greater. The degree of business
risk of a firm depends on the degree of operating leverage. It is worth noting that firms
operating in a highly competitive environment are exposed to higher operating risk which

13
is further aggravated if the firms are highly capital intensive and high proportion of fixed
costs. Matured firms in relatively stable market conditions have lesser operating risk.
Similarly, diversified firms with unrelated businesses are in better position to face
fluctuating market conditions (Friend and Lang, 2008).
2.2.3 Pecking Order Theory
The pecking order theory was postulated by Myers (1984). This theory is based on the
assertion that managers have more information about their firms than investors. This
disparity of information is referred to as asymmetric information. Other things being equal,
because of asymmetric information, managers will issue debt when they are positive about
their firm’s future prospects and will issue equity when they are unsure. A commitment
pay to fixed amount of interest and principal to debt-holders implies that the company
expects steady cash flows (Myers, 2001).
Frank and Goyal (2003) argue that an equity issue would indicate that the current share
price is overvalued. Therefore, the manner in which managers raise capital gives a signal
of their belief in their firm’s prospect to investors. This also implies that firms always use
internal finance when available, and choose debt over new issue of equity when external
financing is required. Myers has called it the pecking order theory since there is not a well-
defined debt-equity target, and there are two kinds of equity, internal and external, one at
the top of the pecking order and one at the bottom. Debt is cheaper than the costs of internal
and external equity due to interest deductibility. Internal equity is cheaper and easier to use

14
than external equity because no transactional costs and no taxes are paid on retained
earnings.
Myers (2001) argued that, because of management's preference for internal financing,
companies with a higher volume of internal financing resort to leverage less frequently
than those with a lower level of internally generated resources. In this sense, the
relationship between the level of debt and resources must be inverse (Haris and Raviv,
2003). The cost of debt is another factor to be considered when analyzing a company's
level of debt. In addressing this factor, the actual interest rate on debt must not be taken
into account, but also the overall amount of financial expense that the company sustains
for the total volume of assumed debt, which is a fixed cost for the firm. Therefore, it is to
be expected that this factor presents a negative aspect of debt (Baskin, 2002).
2.3 Determinants of Financial Leverage
Financial leverage is significantly related to firm size, profitability, and the uniqueness of
the firm’s line of business. Using international data, Rajan and Zingales (1995) report that
the factors that are significant leverage determinants for US firms for example profitability,
market-to-book ratio and sales, are similarly important in other developed countries. In a
more recent study, Frank and Goyal (2003) the findings depicted that profitability, market-
to-book ratio, and firm size, among others, are the most reliable factors in determining the
financial leverage of the firm.

15
2.3.1 Profitability
Penman (2007) defines profitability as the ability to make profit from all the business
activities of an organization, company, firm, or an enterprise. Maheshwari (2001) defined
profitability as the final measure of economic success achieved by a company in relation
to the capital invested. Firm which has high profitability will not depend excessively on
external funding for its development, because profitability has a negative effect on
leverage. Shaw (2003) argued that internal funds do not need to bear the issue cost and
prevent the double taxation. For these reasons, using internal funds is better than relying
on external capital.
2.3.2 Reserve Capacity
The flexibility of the capital structure also depends on the firm’s debt capacity. The greater
the debt capacity, the greater the availability of unused debt capacity and the greater the
degree of flexibility. If a firm borrows to the limit of its capacity, it will not be in a position
to borrow additional funds to finance unforeseen and unpredictable demands except at
restrictive and unfavorable terms. Therefore a company should not borrow to the limit of
its capacity, but keep available some unused capacity to raise funds in future to meet some
sudden demand for finances (Schuster and O'Connell, 2006).
Although flexibility is most desirable, it is achieved at a cost. A company trying to obtain
loans on easy terms will have to pay interest at a higher rate. Also, obtain the right of
refunding; it may have to compensate lenders paying a higher interest. Therefore, the

16
company should compare the benefits and costs of attaining the desired degree of flexibility
and balance them properly (Verrecchia, 1999).
2.3.3 Firm Size
Small firms, managers want to remain in control of their companies because they obtain
private benefit over the financial return on their investment. They need to forgo some
growth opportunities if the opportunities are too extensive to be realized and rely more on
debt. The growth of small firms is more sensitive to internal finance than that of larger
firms. Small firms are more likely to face financial constraints; this prevents them to gain
access to finances from banks. These firms are prepared to pay higher interest rates for
additional loans and thus fail to consider issuing external equity in order to stay in control
(Shaw, 2003).
The size of the firm will determine its leverage (Hol and Wijst, 2008). Rajan and Zingales
(1995) found that large firms are more diversified than small ones, and face lower risk. In
addition, large firms have a low bankruptcy cost and are well known, which makes it easier
to enter the stock market. When firms have the same profitability, the larger firm will have
a relatively low level of debt. The problem of in-formation asymmetry is not as severe in
big firms, and the information cost is also lower than for small firms. Moreover, large firms
prefer to use equity capital rather than debt capital (Schuster and O'Connell, 2006).
2.3.4 Financial Leverage
Financial leverage affects the level and variability of the firm's after tax earnings and hence,
the firm's overall risk and return. Operating leverage depends on fixed operating costs;

17
larger fixed operating costs indicates higher degree of operating leverage and thus, higher
operating risk of the firm. High operating leverage is good when sales are rising but risky
when the sales are falling (Kumar, 2007).
Kumar (2007) puts forward that total assets and sale turnover are commonly used as a
substitute for the size of the firm. Larger firms not only enjoy a higher turnover and but
also generate higher income. This is because they have better access to capital markets and
lower cost of borrowing. Large firms are more likely to manage their working capitals more
efficiently than small firms. Most large firms enjoy economies of scale and thus they are
able to minimize their costs and improve on the profitability of the firm.
2.4 Empirical Review
Abdussalam (2006) examined the relationship of firm structure and profitability. The study
considered major characteristics such as firm size, firm age, and debt ratio and ownership
structure of 48 Jordanian industrial companies listed in Amman Stock Exchange for a
period of one decade (1995 to 2004). The study employed two model specifications in
order to test the hypotheses, using the profitability measurement of Rate of Return on
Equity (ROE) and Rate of Return on Investment (ROI). The empirical findings suggest that
firm structure emerges as an important factor affecting profitability. The results indicate
that there was a positive relationship between firm size and profitability.
Abel (2008) investigated the nature and significance of firm size as a determinant of
corporate financial leverage. The study used panel data fixed‐effects regression model to

18
estimate the relationship between financial leverage and firm size, while controlling also
the effects of other acclaimed determinants like asset tangibility, profitability and firm age.
The dataset used covered 71 firms quoted in the Nigerian stock markets over a 17‐year
period (1990‐2006). The study found that firm size is negatively and significantly related
to financial leverage.
Li (2011) investigated the effects of firm size, financial leverage, and R&D expenditures
on firm earnings. Using the quantile regression (QR) approach, the study analyzed S&P
500 firms from 1996 to 2005. The study found that the effects of firm size, financial
leverage and R&D expenditures on firm earnings differ considerably across earnings
quantiles. The study concluded that there exists a positive relationship between firm size
and financial leverage.
Pouraghajan and Bagheri (2012) investigated on the impact of capital structure on the
financial performance of companies listed in the Tehran Stock Exchange. The study tested
a sample of 40 firms among the companies listed in the Tehran Stock Exchange. Results
suggest that there is a significant negative relationship between debt ratio and financial
performance of companies, and a significant positive relationship between asset turnover,
firm size, asset tangibility ratio, and growth opportunities with financial performance
measures.
Kithuka (2013) did a study on the relationship between firm size and financial innovation
of firms listed at the Nairobi Securities Exchange. The study used a descriptive survey

19
research design. The study did a sample of 40 firms which were chosen using stratified
random sampling. A regression model was used for analysis and the results showed that
there was a positive relationship between the firm size and financial innovation of firms
listed at the Nairobi Stock Exchange.
Mahfoudh (2013) studied the effect of selected firm characteristics on financial
performance of firms listed in the agricultural sector at the Nairobi securities exchange.
The study used a descriptive survey to find out the relationship between the variables. The
study used sampled firms and a regression model was adopted for data analysis. The results
of the analysis showed that there was a positive relationship between firm characteristics:
size, age and growth with financial performance.
Mwangi (2014) investigated effect of capital expenditure on financial performance of firms
listed at the Nairobi securities exchange. The study did a census study comprising of a total
of 53 listed companies. A five year period was used (2009-2013) by way of a desk review
of published company annual financial statements. A linear regression model was used to
establish the relationship between capital expenditure and financial performance. The study
concluded that capital expenditure, leverage and size of the firm positively and
significantly affect financial performance.
Njoroge (2014) studied the effect of firm size on financial performance of pension schemes
in Kenya. The study did a descriptive survey between the variables under investigation.
The target population for this study was 30 occupational pension schemes in Kenya. The

20
research was carried out using secondary data. The data was collected from annual reports
and financial statements. The analysis showed that there was a positive relationship
between the firm size and financial performance. Further the results indicated that there
was significant market volatility as evident from the NSE index, Treasury bill rate
movement and offshore indices.
A study by Tale (2014) investigated on the relationship between capital structure and
financial performance of non-financial firms listed at the Nairobi securities exchange in
Kenya. The study used a descriptive survey. The population of the study consisted of all
the 40 nonfinancial firms listed and duly registered with capital market authority of Kenya.
Secondary data used was obtained mainly from the annual audited and published books of
accounts, financial statements and the NSE. Data analysis was done by use of regression
analysis model. However, the results showed that there was a negative relationship between
financial performance and the size and growth of the firm.
Vithessonthi (2015) surveyed the effect of firm size on the leverage–performance
relationship during the financial crisis of 2007–2009 in Thailand. From a data set of
496,430 firm-year observations of a sample of 170,013 mostly private firms, the study
found that the magnitude of the effect of leverage on operating performance is non-
monotonic and conditional on firm size. Panel regression results indicate that leverage has
a negative effect on performance across firm size subsamples, year-by-year while cross-
sectional regression results show that the effect of leverage on performance is positive for

21
small firms and is negative for large firms. Further, the findings observed that about 75%
of Thailand firms have managed to get through the global financial crisis on the basis that
they do not have to simultaneously deleverage and liquidate their assets.
2.5 Summary of the Literature Review
The literature shows that firm size influences use of financial leverage by firms. This is
because large firms enjoy tax deduction and reputational advantage among prospective
investors. Large firms are stable and thus can easily diversify their assets and enhance their
capacity to qualify for debt by minimizing their risks. Most of the empirical studies have
confirmed that there exists a positive relationship between firm size and use of financial
leverage for example; Mahfoudh (2013), Li (2011), Abdussalam (2006), Njoroge (2014)
and Mwangi (2014) among others. This conforms to the theories that support this study on
the existence of a positive relationship between firm size and financial leverage of firms.
Although studies have examined the relationship between firm size and financial leverage;
none of them have investigated the effect of firm size on financial leverage of firms listed
in the Nairobi Securities exchange. This study therefore finds the need to investigate this
relationship by finding an answer to the question: what is the effect of firm size on financial
leverage of firms listed in the Nairobi Securities Exchange?

22
CHAPTER THREE
RESEARCH METHODOLOGY
3.1 Introduction
This chapter provides that methodology that will be used in this study. It provided a plan
of the research design, target population, the sample size and the sampling techniques, the
data collection techniques and tools as well as the techniques that were used to analyze the
data to be collected.
3.2 Research Design
The study used a descriptive survey of listed firms at Nairobi Securities exchange in Kenya.
The study adapted a descriptive research design because it provides clear and detailed
description about a phenomenon that provided assistance in the refinement of the statement
of the problem, construction of the hypothesis, data collection and analysis procedures
(Singh and Nath, 2010). The design was useful in establishing the relationship between
firm size and financial leverage of listed firms at Nairobi Securities Exchange.
3.3 Population and Sampling
Population refers to an entire group of individuals, events or objects having common
characteristics that can be observed and measured (Yin, 2003). Currently there are 64 firms
listed in the Nairobi Securities Exchange (See Appendix I). No sampling was carried out
in the study. The study considered all the companies listed at NSE, expect for the financial

23
service firms because they are highly regulated by CBK and other regulatory bodies.
Therefore their leverage is highly regulated.
3.4 Data Collection
The study used secondary data since the nature of the data is quantitative. Data collection
is gathering empirical evidence in order to gain new insights about a situation and answer
questions that prompt undertaking of the research (Kothari, 2004). The data was collected
from audited financial statements of the listed firms at the Nairobi Securities Exchange for
a period of five years (2010-2014). The period was considered sufficient for establishing
the relationship between firm size and financial leverage of listed firms. Accessibility and
availability of data within this period is appropriate for the researcher taking into account
time and cost constraints.
3.5 Data Analysis
Mugenda and Mugenda (2005) indicate that data should be cleaned, coded and properly
analyzed in order to obtain an accurate analysis. The data collected was sorted and
organized before capturing it in Statistical Packages for Social Sciences (SPSS) for
analysis. The accurately measure the parameters and accurately get data from the financial
statements; financial leverage which is the dependent variable was measured using total
debt, firm size which is the independent variable was measured using total assets,
profitability which is a control variable was measured using return on asset and sales which
is also a control variable was determined by obtaining the figure for sales from the profit
and loss statements.

24
3.5.1 Analytical Model
A multiple regression model was used to determine the relationship between firm size and
financial leverage of listed firms in the Nairobi Securities Exchange in Kenya. The study
will make inferences from the previous works of Peterson and Rajan (1995) who adopted
a regression model in establishing the relationship between the variables.
Y = a + b1X1 + b2X2+ b3X3+ e
Y is financial leverage which is the dependent variable which will be measured using total
debt
a =Y-intercept
b1, b2, b3, bn are the regression coefficients or parameters
X1 is firm size which is an independent variable. This variable will be measured using
logarithm of total assets.
Control variables are as follows;
X2 is profitability which is a control variable. This variable will be measured using net
income divided by total assets.
X3 is sales which is a control variable. This variable will be determined by obtaining the
sales turnover figure directlyfrom the profit and loss statement.
b is the slope of the regression; it measures the unit change in y associated with a unit
change in x
e is the error term within a confidence interval of 5%

25
3.5.2 Tests of Significance
T-test was used to test the hypothesis that firm size is positively related to financial leverage
of listed firms in Kenya. In this test, the null hypothesis assumes there is no relationship
between firm size and financial leverage of listed firms in Kenya. The alternative
hypothesis assumes that there is a positive relationship between firm size and financial
leverage of listed firms in Nairobi securities Exchange. The level of significance will be
expressed using p-values from the tests of coefficients. If the p-value(s) is more than 5%
then the null hypothesis is true since this means that there is no statistically significant
relationship between firm size and financial leverage of listed firms in Kenya.
Similarly, if the p-value is more than 5% then the alternative hypothesis is considered true
since this means that there is a positive relationship between the variables. Coefficient of
determination (R2) was used to provide a measure of how well the observed outcome was
replicated by the model, as the proportion of total variation of outcomes explained by the
model. The correlation coefficient (R) varied from -1 to +1.A -1indicating that a perfect
negative correlation and 1 indicates perfect positive correlation. The tests were performed
at 95% degree of confidence.

26
CHAPTER FOUR
DATA ANALYSIS, FINDINGS AND DISCUSSION
4.1 Introduction
The chapter presents the outcome of data analysis and findings in line with the objectives
of the Study. The general objective was to assess impact of firm size on the financial
leverage of companies listed the NSE. The data were analyzed using the Statistical Program
for Social Sciences (SPSS) version 20, by use of both descriptive and inferential statistics.
Descriptive statistics such as minimum, maximum mean and standard deviation were used.
4.2 Descriptive Statistics
Descriptive measures involved mean, maximum, minimum, standard error of estimate,
skewness and kurtosis. Mean is a measure of central tendency used to describe the most
typical value in a set of values. The standard error is a statistical term that measures the
accuracy within a set of values. Skewness is a measure of symmetry, or more precisely, the
lack of symmetry. A distribution, or data set, is symmetric if it looks the same to the left
and right of the center point. Kurtosis is a measure of whether the data are peaked or flat
relative to a normal distribution (Cooper and Schindler 2008).
The pertinent results are presented in Table 4.1

27
Table 4.1: Descriptive statistics results of the main variables
N
Mea
n
Std
.
Dev
iati
o
n
Min
imu
m
Max
imu
m
Valid
Leverage 300 0.394364 0.211611 0.001 1.5844
Log of
Assets
300 15.6151 1.99841 .0000 19.060
Return on
Assets
300 0.192051 0.122210 -0.3404 0.5017
Sales(log) 300 1.334533 0.868506 1.1255 5.7723
Source: Research findings
The descriptive statistic in table 4.1 shows that the mean leverage for the listed companies
was 0.3947364 and the maximum and minimum were .001 and 1.5844 respectively. The
mean for return on assets was 0.192051 with a minimum and maximum of 0.5017 and -
0.3404 respectively. The standard deviation for the return on assets was 0.12210. The mean
for sales was 1.3345 with a minimum and maximum of 1.1255 and 5.7723 respectively.
The standard deviation for the sales was 0.868506.The mean for assets was 2.050914 with
a minimum and maximum of 1.0121 and 5.3218 respectively. The standard deviation for
the assets was 1.042809.

28
4.2.1 Financial Leverage
Table 4.2: Financial Leverage
Year Leverage
2010 0.263101
2011 0.276251
2012 0.29713
2013 0.354941
2014 0.421531
From (table 4.2) it is evident that financial leverage for the companies listed at NSE has
been on the rise since 2010 to 2014. In 2010 the debt equity ratio was 26.31%, 2011 the
debt equity ratio was 27.251%, in 2012 it was 29.713%, in 2013 the financial leverage ratio
was 35.49% and in 2014 it was 42.153%.
Figure 4.1: Financial Leverage
0
50
100
150
200
250
2011 2012 2013 2014

29
According to figure 4.1 above it is evident that financial leverage for the companies listed
at NSE has been on the rise since 2010 to 2014. In 2010 the debt equity ratio was 26.31%,
2011 the debt equity ratio was 27.251%, in 2012 it was 29.713%, in 2013 the financial
leverage ratio was 35.49% and in 2014 it was 42.153%.
4.2.2 Return on Assets
Table 4.3Return on Assets
Year Return on Assets
2010 1.2591
2011 2.2512
2012 1.1156
2013 0.9912
2014 1.9981
The analysis from Table 4.3 shows that the ROA of the companies listed at the NSE varies
from year to year. In the 2013 the average ROA was at the lowest at 0.9912 and in 2011
the average ROA was the highest at 2.2512.

30
Figure 4.2 Returns on Assets
From the above figure it is evident that the return on assets for the companies listed at the
NSE from 2010 to 2014 with the highest average return of assets being in 2011 and the
lowest average ROA being in 2013.
4.2.3 Sales Volume
Table 4.4: Average Sales Volume per Year
Year Sales Volume Kshs Billions
2010 111.45
2011 152.11
2012 178.12
2013 193.40
2014 212.01
0
0.5
1
1.5
2
2.5
2010 2011 2012 2013 2014

31
From the analysis above it is evident that the sales volumes for the companies listed at the
NSE varies between Kshs 111.45 billion in 2010 to Kshs 212.01 billion in 2014. There has
been a steady increase in sales volumes from 2010 to 2014. In 2010 the sales volume was
Kshs 111.45 billion, Kshs 152.11 billion, Kshs 178.12 billion, Kshs 193.40 billion and
Kshs 212.11.
Figure 4.3: Average Sales Volumes
From the above figure it is evident that the sales volumes for the companies listed at the
NSE varies between Kshs 111.45 billion in 2010 to Kshs 212.01 billion in 2014. There has
been a steady increase in sales volumes from 2010 to 2014. In 2010 the sales volume was
Kshs 111.45 billion, Kshs 152.11 billion, Kshs 178.12 billion, Kshs 193.40 billion and
Kshs 212.11.
0
50
100
150
200
250
2011 2012 2013 2014

32
4.3 Correlation Analysis
Pearson correlation was performed to determine the degree of relationship between the
study variables.
Table 4.5 Pearson Product Correlation Coefficients (r)
Leverage Log of Assets ROA Sales Volume
Leverage 1
Log of Assets 0.578 1
ROA -0.466 0.325 1
Sales Volume -0.388 0.258 0.398 1
*Correlation is significant at the 0.05 level (2-tailed)
Source: Research findings
There was a significant negative relationship between leverage and firm size as measured
by log of assets(r= 0.578, P-value < 0.05). The results also indicate a significant negative
relationship between ROA and leverage (r=-0.466, P-value<0.05). This is an indication
that if the firm use a lot of debt then there performance gets affected. Positive relationship
between leverage and sales volume (r=0.388, P-value<.05). There is a negative relationship
sales volume and leverage (r=-0.388, P-value<.05). The Pearson correlation coefficient
above indicates the following relationships; there was a significant positive relationship
between leverage and firm size. This implies that firm size determines the amount of

33
leverage the firm can take. The bigger the firm the higher the amount of debt they can be
given by the financial institutions. The Pearson correlation coefficient above showed that
there was a positive significant relationship between leverage and sales volume and that
implies that this firm are able to utilize better the investments they have to sell more.
4.4 Regression Analysis
Regression analysis was used to determine the effect of firm size on the financial structure
of firms listed at NSE.
Table 4.6 Model Summary
Model R R Square Adjusted R Square
Std. Error of the
Estimate
1 .719a .615 .467 .00251
a. Predictors: (Constant), Log of Assets, ROA, Sales Volume
The model summary (Table 4.4) indicated that there was a strong positive relationship
between the dependent and the independent variables. The value of R Square was 0.615
indicating that 61.5 % of the changes in financial leverage (debt / equity) could be
explained by the independent variables for the study (Firm size, profitability and Sales
Volume).

34
Table 4.8 Analysis of Variance
Model
Sum of
Squares Df Mean Square F Sig.
1 Regression .367 3 .118 4.582 .025a
Residual .530 297 .011
Total .897 300
a. Predictors: (Constant), ROA, Sales Volume
b. Dependent Variable: Financial Leverage
The Analysis of Variance (ANOVA) reveal that composite effect of the three variables
(firm size and sales volume) on the financial leverage of firms listed at NSE is significant
as indicated by the P values (0.025) i.e. less than 0.05 and F value (4.582).
Table 4.9 Regression model
Model
Unstandardized
Coefficients
Standardized
Coefficients
T Sig. B Std. Error Beta
1 (Constant) 0.065 0.225 1.303 0.000
Log of Assets 0.417 0.073 0.477 3.434 0.031
ROA -0.324 0.052 0.281 1.293 0.014
Sales Volume -0.224 0.052 0.281 3.392 0.017
a. Dependent Variable: Financial Performance (ROA)
The regression model becomes:

35
𝐘 = 𝟎. 𝟎𝟔𝟓 + 𝟎. 𝟒𝟏𝟕𝐗𝟏 − 𝟎. 𝟑𝟐𝟒𝐗𝟐-𝟎. 𝟐𝟐𝟒𝐗𝟑 + 𝛜𝐭
From the regression analysis Constant = 0.065, shows that if all the independent variables
are all rated as zero, the leverage of listed companies at NSE. The level of confidence for
the analysis was set at 95%. Therefore, the P- value less than 0.05 imply that the
independent variable is significant. The regression results show that financial leverage of
listed companies at NSE. However, the regression analysis shows that the firm size is
positively impacted leverage (B=-0.417).Similarly, there was significant negative
relationship between leverage and ROA.
The above analysis was conducted at 5% significance level. The criteria for comparing
whether the predictor variables were significant in the model was done by comparing the
corresponding probability value obtained; α=0.05. If the probability value was less than α,
then the predictor variable was significant. From the model coefficients logarithm of assets
and liquidity were found to be statistically significant in the model. This is because its p-
value was less than 5%. These findings are consistent to the hypothesis of the study which
predicted the existence of a statistically insignificant relationship between financial
leverage and profitability of listed firms at Nairobi Securities Exchange.
4.5 Interpretation of the Findings
The descriptive results found that most listed firms utilized financial leverage because most
listed firms had a stable asset base. However, the findings concluded that financial leverage
did not contribute to profitability of listed firms; the financial performance of listed firms
was 46.6% which is a moderate score.

36
The results of the Pearson’s correlation concluded that there was a correlation between
financial leverage and profitability of listed firms. The correlation score was found to be R
is -.466. Similarly, it was discovered that there was a correlation between leverage and firm
size of listed firms. The correlation score was found to be .578. There was a moderate
correlation between sales volume and leverage of listed firms. The correlation score is -
.388.
The regression results found that there was an inverse relationship between financial
leverage and profitability of listed firms in the Nairobi Securities Exchange. Results
suggest that there is a significant negative relationship between debt ratio and financial
performance of companies. The findings depict that the logarithm of assets and sales
volume were found to be statistically significant in the model. This is because its p-value
was less than 5%. The results were as follows p=0.014 and p=0.017.

37
CHAPTER FIVE
SUMMARY, CONCLUSION AND RECOMENDATIONS
5.1 Introduction
The chapter provides the summary of the findings from chapter four, and it also gives the
conclusions and recommendations of the study based on the objectives of the study. The
objectives of this study were to investigate the effects of firm size on the financial leverage
of listed companies at NSE.
5.2 Summary
The study investigated three dimensions of a firm’s profitability, namely, financial
leverage, firm size and sales volume. The descriptive results indicated that most listed firms
utilized financial leverage as most listed firms had a stable asset base. However, the
findings concluded that financial leverage did not contribute to profitability of listed firms.
This was an indication that financial leverage did not contribute to profitability of listed
firms. These findings are however consistent with Padron and Santana (2005) who assert
that if a firm borrows more money from its creditors then the firm has to pay more amount
of cost of debt to the creditor in terms of interest and this leads to less net income for the
firm and hence lower profitability.
The findings of the Pearson’s correlation concluded that there was no correlation between
financial leverage and profitability of listed firms. The correlation score was found to be R
is -.107. Similarly, it was discovered that there was no correlation between liquidity and

38
profitability of listed firms. The correlation score was found to be -.212. These findings are
consistent to a study by Yuan and Kazuyuki (2011) who found that there was an inverse
relationship between total debt and profitability of Chinese listed companies. It was also
found that there was a moderate correlation between logarithm of assets and profitability
of listed firms. The correlation score is -.547.
The regression results found that there was an inverse relationship between financial
leverage and profitability of listed firms in the Nairobi Securities Exchange. These findings
are consistent with a study by Pouraghajan and Bagheri (2012) who investigated the impact
of capital structure on the financial performance of companies listed in the Tehran Stock
Exchange. Results suggest that there is a significant negative relationship between debt
ratio and financial performance of companies. The findings depict that the logarithm of
assets and liquidity were found to be statistically significant in the model.
This is because its p-value was less than 5%. The results were as follows p=0.000 and
p=0.001. These findings are consistent with Pouraghajan and Bagheri (2012) who found
that there was a statistically significant relationship between asset turnover and liquidity of
companies listed in the Tehran Stock Exchange. On the other hand, financial leverage was
found to be statistically insignificant because its p-value at 0.512 was above 5%. These
findings are consistent with a study conducted by Nduati (2010) that examined the
relationship between leverage and financial performance of companies quoted at the
Nairobi Securities Exchange. The findings concluded that leverage did not contribute to
financial performance of firms quoted at the NSE. These findings are also consistent with

39
Adongo (2012) who studied the effect of financial leverage on profitability and risk of
firms listed at the Nairobi Securities Exchange. The findings concluded that there was a
significant relationship between returns adjusted by risk and financial leverage.
5.3 Conclusion
The findings revealed that firm size was correlated with financial leverage of listed firms
in Kenya. The study therefore concludes that firms should consider enhancing their asset
base so that they will be able to get debt financing. The assets were used as collaterals. On
the other hand the study found out that financial leverage is negatively correlated with
profitability of the firms listed at NSE. This is an indication that as the firms borrow more,
financial distress comes into play therefore the firms’ needs to consider using alternative
methods of financing their projects other than relying on financial leverage. Financial
leverage might lead to poor performance of firms due to excessive costs of financing debt
that might override the returns obtained from investing in projects.
The results of the model coefficients estimates of the independent variables, found an
inverse relationship with profitability of listed firms. The results indicated that liquidity
and financial leverage depicted a negative relationship with profitability apart from the
logarithm of assets that showed a positive relationship with profitability of listed firms in
the Nairobi Securities Exchange. These findings are consistent with the hypothesis of this
study which predicted a negative relationship between financial leverage and profitability
of listed firms. It can therefore be concluded that financing firms using debt is costly and
might expose the firm to financial difficulties.

40
From the regression model, the coefficient of determination was 27.4% showing the extent
to which the variance of profitability was explained by the independent variables. This is
an indication that the model used was a moderate predictor in explaining the relationship
between financial leverage and profitability of listed firms in the Nairobi Securities
Exchange.
5.4 Recommendations for Policy and Practice
The study recommends that listed firms should look for alternative ways of financing their
projects other than using financial leverage. This is because from the results obtained it is
evident that financial leverage does not contribute to profitability of the firm. There is a
proportionate increase in the cost of debt represented by the interest rate payable to a firm’s
borrowing. This leads to less net income for the firm and hence lower profitability.
The study showed a positive relationship between the firm size and financial leverage. That
implies the size of the firms do matter when it comes to debt financing. The listed
companies should be concerned more with the quality or value added the assets they are
acquiring.
5.5 Limitations of the Study
One of the limitations of this study is that it utilized secondary data sources and might not
necessarily reflect the exact needs of the study. This might negatively affect the accuracy
and reliability of the results and impact negatively on the findings drawn in this study.

41
Another limitation of this study is that it was limited to four variables only; financial
leverage, firm size, profitability and liquidity. It is imperative to note that profitability is
affected by many factors other than the ones confounders discussed in this study that have
a bearing on profitability. Other factors considered, it would be important to establish
whether the findings will hold or not after which conclusive results can be drawn.
5.6 Suggestions for Further Research
Although the study targeted to study 64 firms, only 58 firms were active in the NSE for the
period under study. Due to time and cost constraints, only 47 firms were investigated in
the study. The study recommends that future researchers interested in this field of research
might consider investigating all the firms and increase the period of study to ten years. This
will increase the scope of study and the findings obtained will be more conclusive. The
results obtained can be compared with the findings obtained in this study then conclusions
can then be drawn based on more concrete facts.

42
REFERENCES
Abdussalam, M. A. (2006). An Empirical Study of Firm Structure and Profitability
Relationship: The Case of Jordan, Journal of Economic and Administrative
Sciences, 22, 11, 41 – 59
Abel, E. E. (2008). Firm size and corporate financial‐leverage choice in a developing
economy: Evidence from Nigeria, The Journal of Risk Finance, 9, I, 4,351 – 364
Akbas, H. E. & Karaduman, H.A. (2012). The effect of firm size on profitability: an
empirical investigation on Turkish manufacturing companies, European Journal
of Economics, Finance and Administrative Sciences, 55:21-27.
Baskin, J. (2002). An empirical investigation of the pecking order hypothesis, Financial
Management, 18, 26-34.
Berger, A.N. & Udell, G.F. (1994).Lines of credit and relationship lending in small firm
finance, The Wharton School, Financial Institutions Centre Working Paper, 94‐
11.
Burgman, T.A. (2006). An empirical examination of multinational corporate capital
structure, Journal of International Business Studies, 27, 553-570.
Cooley, T.F. & Quandrini, V. (2001).Financial markets and firm dynamics, The American
Economic Review, 91, 5, 286‐310
Deis, D., D. & Guffey, & W. (2005).Further Evidence on the Relationship between
Bankruptcy Costs and Firm Size, Quarterly Journal of Business & Economics, 69-
79.
Dittmar, A. (2004). Capital structure in corporate spin‐offs, Journal of Business, 77 1, 9‐
43.
Ezeoha, A. E. (2008). Firm size and corporate financial‐leverage choice in a developing
economy: Evidence from Nigeria, The Journal of Risk Finance, 9 4, 351 - 364
Frbbank, M.Z. & Goyal, V.R. (2003). Testing the pecking order theory of capital structure,
Journal of Financial Economics, 67 (2), 217-248.

43
Friend, I. & Lang, A. (2008). An empirical test of the impact of managerial self-interest on
corporate capital structure, Journal of Finance, 43 (2), 271-281.
Gonenc, H. (2005). Comparison of debt financing between international and domestic
firms, International Journal of Managerial Finance, 1 1, 49‐68.
Graham, J.R. &Harvey, C.R. (2002). How do CFOs make capital budgeting and capital
structure decisions, Journal of Applied Corporate Finance, 15(1), 8‐23?
Graham, J.R. (2000). How big are the tax benefits of debt, The Journal of Finance, Vol.
55, pp. 1901‐41.
Gregory, N. & Tenev, S. (2001). The financing of private enterprises in China, IMF
Finance &Development, 38, 1, 14‐17.
Gupta, M.C. (1969). The effect of size, growth, and industry on the financial structure of
manufacturing companies, The Journal of Finance, 24, 517‐29.
Haugen, R.A. & Baker, N.L. (2006). Commonality in the determinants of expected stock
returns, Journal of Financial Economics, 41, 401-439.
Hol, S. & Wijst, N.V. (2008). The financial structure of nonlisted firms, Applied Financial
Economics, 18 (7), 559-568.
Huyghebaert, N. (2006). The determinants and dynamics of trade credit use: empirical
evidence from business start‐ups, Journal of Business Finance & Accounting, 33
1/2, 305‐28.
Jensen, M.C. & Meckling W.H. (1976). Theory of the firm: managerial behavior, agency
costs and ownership structure, Journal of Financial Economics, 3,350-360.
Kithuka, A. (2013) .The relationship between firm size and financial innovation of firms
listed at the Nairobi Securities Exchange, Unpublished MBA Project, University
of Nairobi
Kithuka, M. (2013). The relationship between firm size and financial innovation of firms
listed at the Nairobi Securities Exchange, Unpublished MBA Project, University
of Nairobi
Kothari, C. R. (2005). Research methodology: Methods & techniques. New Delhi: New
Age International (P) Ltd.

44
Kumar, K. (2007). The determinants of capital structure choice: Evidence from Polish
Companies, International Atlantic Economic Society, 13, 495-514.
Kumar, K.B., Rajan, R.G. & Zingales, L. (2001). What determines firm’s size, Working
Paper Series 496, University of South California (USC) Finance and Business
Economics
Kumar, P.C. (2004). Bid‐ask spreads in U.S. equity markets, Quarterly Journal of Business
and Economics, 43 3/4, 85‐111.
Li, Y. L. & Hwang, C. R. (2011). Effects of firm size, financial leverage and R&D
expenditures on firm earnings: an analysis using Quantile regression approach,
Abacus, 47: 182–204. doi: 10.1111/j.1467-6281.2011.00338.
Li, Z. (2005).The SME promotion policies in china, in private sector development and
poverty reduction from developing countries, in Dornberger and Fromm, I. (Eds),
Small enterprises promotion and training (SEPT), Working Paper, No. 20.
Mahfoudh, O. (2013).Effect of selected firm characteristics on financial performance of
firms listed in the agricultural sector at the Nairobi securities exchange,
Unpublished MBA Project, University of Nairobi
Modigliani, F. & Miller M.H. (1958). The cost of capital, corporation finance and the
theory of investment, American Economic, 48 (3), 261-297.
Modigliani, F. & Miller M.H. (1963). Corporate income taxes and the cost of capital: a
correction, American Economic Review, 53,433-443.
Mwangi, W. (2014). The effect of capital expenditure on financial performance of firms
listed at the Nairobi securities exchange, Unpublished MBA Project, University of
Nairobi
Mugenda, O. & Mugenda, A. (2005). Research methods: Quantitative and qualitative
approaches.2nd. Rev. Ed. Nairobi: Act press
Myers S.C. (2001). Testing static tradeoff against pecking-order model of capital structure,
Journal of Financial Economic, 51 (2), 219-245.
Myers, S.C. (1984). Determinants of capital borrowing, Journal of Finance Economics, 5,
5147-5175.

45
Njoroge, N. (2014). The effect of firm size on financial performance of pension schemes
in Kenya, Unpublished MBA Project, University of Nairobi
Ovtchinnikov, A.V. (2010). Capital structure decisions: evidence from deregulated
industries, Journal of Financial Economics, 95, 249-274.
Pandey, M. (2004).Capital structure, profitability and market structure: evidence from
Malaysia, Asia Pacific Journal of Economics and Business, 8, 2
Pouraghajan, A., & Bagheri, M. (2012). The Relationship between capital structure and
firm performance evaluation measures: Evidence from the Tehran Stock
Exchange, International Journal of Business and Commerce, 1(9): 166-181.
Rajan, G.R. & Zingales, L. (1995). What do we know about capital structure? Some
evidence from international data, The Journal of Finance, 50, 1421‐60
Schuster, P. and O'Connell, V. (2006).The trend toward voluntary corporate disclosures,
Management Accounting Quarterly, 7 2, 1‐9.
Shaw, K.W. (2003). Corporate disclosure quality, earnings smoothing, and earnings’
timeliness, Journal of Business Research, 56 12, 1043‐50.
Singh, Y. K., & Nath, R. (2010). Research methodology. New Delhi: A. P. H. Publishing
Corporation
Symeou, P.C. (2012). The firm size performance relationship: an empirical examination
of the role of the firm’s growth potential, Institute for Communication Economics,
Department of Management, University of Munich (LMU); Judge Business
School, University of Cambridge
Tale, W. (2014). Relationship between capital structure and performance of non-financial
firms listed at the Nairobi securities exchange, Unpublished MBA Project,
University of Nairobi
Verrecchia, R.E. (1999). Disclosure and the cost of capital: a discussion, Journal of
Accounting and Economics, 26, 1/3, 271‐83
Vithessonthi, C. & Tongurai, J. (2015). The effect of firm size on the leverage–
performance relationship during the financial crisis of 2007–2009, Journal of
Multinational Financial Management, 29, 1-9

46
APPENDIX 1: LIST OF FIRMS LISTED AT NSE
AGRICULTURAL
1. Eaagads Ltd
2. Kakuzi Ltd
3. Kapchorua Tea Co. Ltd
4. The Limuru Tea Co. Ltd
5. Rea Vipingo Plantations Ltd
6. Sasini Ltd
7. Williamson Tea Kenya Ltd
AUTOMOBILES & ACCESSORIES
8. Car & General (K) Ltd
9. Marshalls (E.A.) Ltd
10. Sameer Africa Ltd
BANKING
11. Barclays Bank of Kenya Ltd
12. CFC Stanbic of Kenya Holdings Ltd
13. Diamond Trust Bank Kenya Ltd
14. Equity Bank Ltd

47
15. Housing Finance Co.Kenya Ltd
16. I&M Holdings Ltd
17. Kenya Commercial Bank Ltd
18. National Bank of Kenya Ltd
19. NIC Bank Ltd
20. Standard Chartered Bank Kenya Ltd
21. The Co-operative Bank of Kenya Ltd
COMMERCIAL AND SERVICES
22. Express Kenya Ltd
23. Hutchings Biemer Ltd
24. Kenya Airways Ltd
25. Longhorn Kenya Ltd
26. Nation Media Group Ltd
27. Scangroup Ltd
28. Standard Group Ltd
29. TPS Eastern Africa Ltd
30. Uchumi Supermarket Ltd
CONSTRUCTION & ALLIED
31. ARM Cement Ltd
32. Bamburi Cement Ltd

48
33. Crown Paints Kenya Ltd
34. E.A.Cables Ltd
35. E.A.Portland Cement Co. Ltd
ENERGY & PETROLEUM
36. KenGen Co. Ltd
37. KenolKobil Ltd
38. Kenya Power & Lighting Co Ltd
39. Kenya Power & Lighting Ltd 4% Pref 20.00
40. Kenya Power & Lighting Ltd 7% Pref 20.00
41. Total Kenya Ltd
42. Umeme Ltd
INSURANCE
43. British-American Investments Co.(Kenya) Ltd
44. CIC Insurance Group Ltd
45. Jubilee Holdings Ltd
46. Kenya Re Insurance Corporation Ltd
47. Liberty Kenya Holdings Ltd
48. Pan Africa Insurance Holdings Ltd

49
INVESTMENT
49. Centum Investment Co Ltd
50. Olympia Capital Holdings Ltd
51. Trans-Century Ltd
INVESTMENT SERVICES
52. Nairobi Securities Exchange Ltd Ord 4.00
MANUFACTURING & ALLIED
53. A.Baumann & Co Ltd
54. B.O.C Kenya Ltd
55. British American Tobacco Kenya Ltd
56. Carbacid Investments Ltd
57. East African Breweries Ltd
58. Eveready East Africa Ltd
59. Kenya Orchards Ltd
60. Mumias Sugar Co. Ltd
61. Unga Group Ltd
TELECOMMUNICATION & TECHNOLOGY
62. Safaricom Ltd
GROWTH ENTERPRISE MARKET SEGMENT (GEMS)

50
63. Flame Tree Group Holdings Ltd Ord 0.825
64. Home Afrika Ltd
Source: NSE (2014)
APPENDIX II: FINANCIAL DATA FOR LISTED COMPANIES
KAKUZI - 1 2010 2011 2012 2013 2014

51
Financial Leverage
effect(TL/TA) 0.34 0.31 0.28 0.22 0.22
ROA(NI/TA) 0.12766003 0.0412346 0.33035058 0.15361 0.361367
Firm size effect(LNTA) 14.87 14.98 15.16 15.09 15.13
EAAGADS - 02
Financial Leverage
effect(TL/TA) 0.25 0.3 0.25 0.16 0.2
ROA(NI/TA) 0.13931136 0.1376066 0.05629291 0.013908 0.038333
Firm size effect(LNTA) 12.47 12.53 12.78 13.26 13.12
KAPCHORUA TEA - 03
Financial Leverage
effect(TL/TA) 0.41 0.45 0.38 0.42 0.38
ROA(NI/TA) 1.01068056 4.340312 0.16021744 0.318189 0.038333
Firm size effect(LNTA) 13.97 14.22 14.27 14.49 14.55
LIMURU TEA-04
Financial Leverage
effect(TL/TA) 0.34 0.25 0.22 0.24 0.16
ROA(NI/TA) 0.07376946 0.1052401 0.14861985 0.038031 0.171714
Firm size effect(LNTA) 11.35 11.97 12.16 12.68 13.26
REA VIPINGO - 05
Financial Leverage
effect(TL/TA) 0.31 0.42 0.36 0.28 0.25
ROA(NI/TA) 0.06411035 0.2417681 0.0511335 0.039721 0.011016
Firm size effect(LNTA) 14.16 14.35 14.64 14.68 14.84
SASINI - 06
Financial Leverage
effect(TL/TA) 0.29 0.28 0.29 0.28 0.3

52
ROA(NI/TA) 0.03506332 0.1418446 0.22574588 0.117973 0.106374
Firm size effect(LNTA) 15.89 16.02 16.06 16 16.02
WILLIAMSON - 07
Financial Leverage
effect(TL/TA) 0.33 0.35 0.29 0.32 0.27
ROA(NI/TA) 0.06520726 0.0085179 0.04709468 0.202253 0.054975
Firm size effect(LNTA) 15.18 15.49 15.61 15.8 15.9
CAR&GENERAL - 08
Financial Leverage
effect(TL/TA) 0.59 0.6 0.65 0.62 0.64
ROA(NI/TA) 0.07583452 0.0897654 0.045673 0.08605 0.038333
Firm size effect(LNTA) 14.98 15.17 15.53 15.56 15.75
CMC HOLDINGS - 09
Financial Leverage
effect(TL/TA) 0.6 0.63 0.65 0.56 0.53
ROA(NI/TA) 0.10877572 0.0918055 0.05885937 0.081555 0.036607
Firm size effect(LNTA) 16.4 16.5 16.5 16.38 16.32
MARSHALLS E.A. - 10
Financial Leverage
effect(TL/TA) 0.67 0.88 0.63 0.31 0.45
ROA(NI/TA) 0.10877572 0.0918055 0.05885937 0.081555 0.036607
Firm size effect(LNTA) 14.18 13.93 13.89 13.25 13.15
SAMEER GROUP - 11
Financial Leverage
effect(TL/TA) 0.24 0.28 0.32 0.27
ROA(NI/TA) 0.0980098 0.10425597 0.066812 0.095582
Firm size effect(LNTA) 14.92 14.86 14.95 15.04 15.12

53
EXPRESS KENYA LTD - 12
Financial Leverage
effect(TL/TA) 0.68 0.71 0.46 0.6 0.59
ROA(NI/TA) 0.07717125 0.093799 0.54786 -0.10948 -0.20948
Firm size effect(LNTA) 14.08 14.11 13.55 13.11 13.08
KQ - 13
Financial Leverage
effect(TL/TA) 0.77 0.73 0.71 0.7 0.75
ROA(NI/TA) 0.07526565 0.0424968 0.05473956 0.052365 0.038333
Firm size effect(LNTA) 18.13 18.11 18.18 18.16 18.63
LONGHORN - 14
Financial Leverage
effect(TL/TA) 0.34 0.43 0.43 0.6 0.44
ROA(NI/TA) 0.07965084 0.0535708 0.28445326 0.021438 0.038333
Firm size effect(LNTA) 12.97 13.17 13.47 13.4 13.44
NATION MEDIA - 15
Financial Leverage
effect(TL/TA) 0.28 0.32 0.31 0.31 0.28
ROA(NI/TA) 0.19058894 0.2679858 0.17894718 0.036336 0.061016
Firm size effect(LNTA) 15.7 15.89 15.99 16.18 16.25
SCAN GROUP - 16
Financial Leverage
effect(TL/TA) 0.4 0.55 0.49 0.43 0.36
ROA(NI/TA) 0.05381389 0.0281204 0.02403531 0.045591 0.069792
Firm size effect(LNTA) 15.18 15.9 15.95 15.94 16.36
STANDARD GROUP - 17
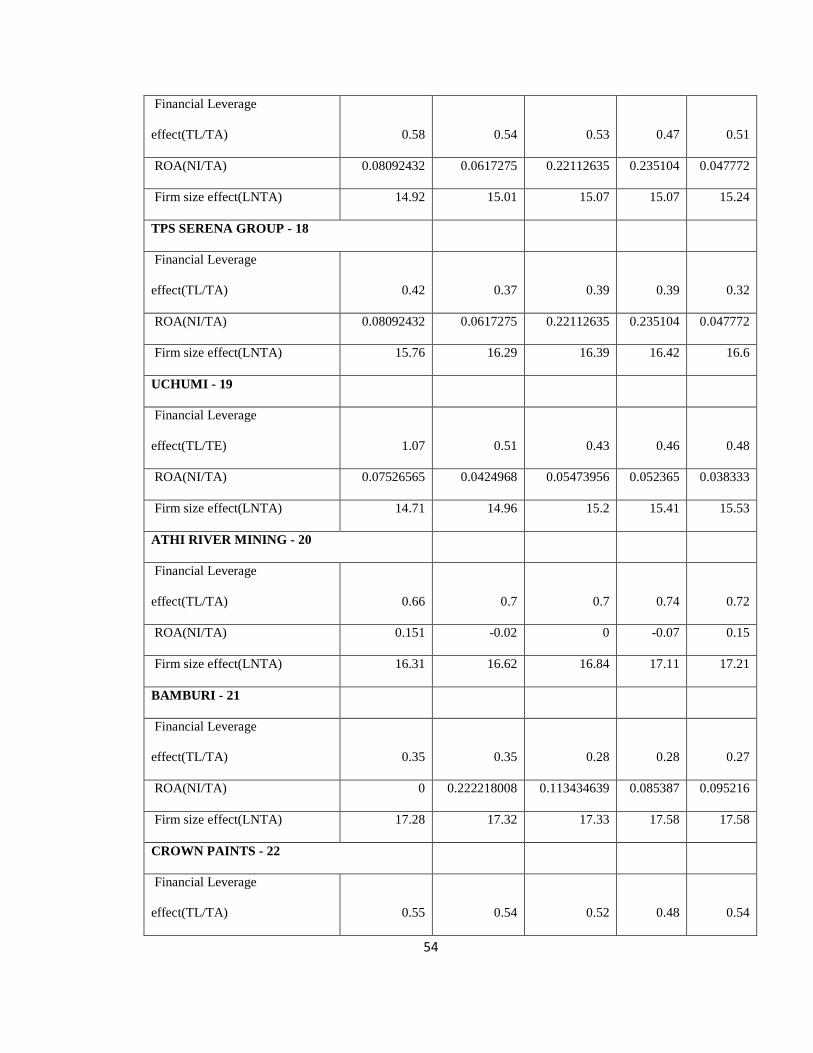
54
Financial Leverage
effect(TL/TA) 0.58 0.54 0.53 0.47 0.51
ROA(NI/TA) 0.08092432 0.0617275 0.22112635 0.235104 0.047772
Firm size effect(LNTA) 14.92 15.01 15.07 15.07 15.24
TPS SERENA GROUP - 18
Financial Leverage
effect(TL/TA) 0.42 0.37 0.39 0.39 0.32
ROA(NI/TA) 0.08092432 0.0617275 0.22112635 0.235104 0.047772
Firm size effect(LNTA) 15.76 16.29 16.39 16.42 16.6
UCHUMI - 19
Financial Leverage
effect(TL/TE) 1.07 0.51 0.43 0.46 0.48
ROA(NI/TA) 0.07526565 0.0424968 0.05473956 0.052365 0.038333
Firm size effect(LNTA) 14.71 14.96 15.2 15.41 15.53
ATHI RIVER MINING - 20
Financial Leverage
effect(TL/TA) 0.66 0.7 0.7 0.74 0.72
ROA(NI/TA) 0.151 -0.02 0 -0.07 0.15
Firm size effect(LNTA) 16.31 16.62 16.84 17.11 17.21
BAMBURI - 21
Financial Leverage
effect(TL/TA) 0.35 0.35 0.28 0.28 0.27
ROA(NI/TA) 0 0.222218008 0.113434639 0.085387 0.095216
Firm size effect(LNTA) 17.28 17.32 17.33 17.58 17.58
CROWN PAINTS - 22
Financial Leverage
effect(TL/TA) 0.55 0.54 0.52 0.48 0.54

55
ROA(NI/TA) 0.046440801 0.046349584 0.058230927 0.059135 0.072602
Firm size effect(LNTA) 14.44 14.49 14.61 14.63 14.9
EAST AFRICAN CABLES - 23
Financial Leverage
effect(TL/TA) 0.53 0.5 0.54 0.53 0.55
ROA(NI/TA) 0.083545301 0.040688777 0.063033844 0.083548 0.091756
Firm size effect(LNTA) 15.08 15.32 15.42 15.65 15.73
EAST AFRICAN PORTLAND - 24
Financial Leverage
effect(TL/TA) 0.49 0.53 0.58 0.67 0.56
ROA(NI/TA) 0.15238116 0.032655358 0.017843436 0 0.065922
Firm size effect(LNTA) 16.3 16.3 16.41 16.45 16.6
KENGEN - 25
Financial Leverage
effect(TL/TA) 0.41 0.53 0.57 0.57 0.61
ROA(NI/TA) 0.018335553 0.021827426 0.01292055 0.017301 0.027827
Firm size effect(LNTA) 18.54 18.83 18.9 18.91 19.06
KENOL/KOBIL - 26
Financial Leverage
effect(TL/TA) 0.67 0.63 0.75 0.8 0.76
ROA(NI/TA) 0.09680441 0.0264158 -0.0291893 0.060904 0.016998
Firm size effect(LNTA) 17.2 17.23 17.64 17.3 17.15
KPLC - 27
Financial Leverage
effect(TL/TA) 0.62 0.64 0.67 0.68 0.73
ROA(NI/TA) 0.018335553 0.021827426 0.01292055 0.017301 0.027827
Firm size effect(LNTA) 18.09 18.2 18.6 18.71 18.99

56
TOTAL KENYA - 28
Financial Leverage
effect(TL/TA) 0.72 0.68 0.74 0.57 0.62
ROA(NI/TA) 0.02 0.03 0 -0.01 0.03
Firm size effect(LNTA) 17.27 17.23 17.38 17.31 17.5
CENTUM - 29
Financial Leverage
effect(TL/TA) 0.04 0.05 0.22 0.13 0.28
ROA(NI/TA) 0.11968666 0.1654789 0.1406176 0.046215 0.222479
Firm size effect(LNTA) 15.7 15.93 16.33 16.26 16.76
OLYMPIA - 30
Financial Leverage
effect(TL/TA) 0.29 0.39 0.4 0.43 0.43
ROA(NI/TA) 1.09034822 1.7388818 2.79678248 0.117786 0.038333
Firm size effect(LNTA) 13.58 13.79 13.89 14.44 14.46
TRANSCENTURY- 31
Financial Leverage
effect(TL/TA) 0.6 0.53 0.7 0.66 0.66
ROA(NI/TA) 0.14606199 0.2729494 0.23476437 0.099206 0.103232
Firm size effect(LNTA) 15.98 16.23 16.93 16.9 16.99
NSE-32
Financial Leverage
effect(TL/TA) 0.13 0.15 0.1 0.44 0.36
ROA(NI/TA) 0.20033039 0.1667232 0.16333995 0.03455 0.124608
Firm size effect(LNTA) 12.62 12.91 13.07 13.69 13.95
BOC KENYA-33

57
Financial Leverage
effect(TL/TA) 0.24 0.26 0.27 0.27 0.21
ROA(NI/TA) 0.077402395 0.039279437 0.082895063 0.099206 0.076957
Firm size effect(LNTA) 14.44 14.46 14.41 14.51 14.78
BAT-34
Financial Leverage
effect(TL/TA) 0.56 0.54 0.53 0.53 0.55
ROA(NI/TA) 0.140093067 0.158901794 0.225282343 0.24616 0.219222
Firm size effect(LNTA) 16.17 16.22 16.44 16.54 16.65
CARBACID-35
Financial Leverage
effect(TL/TA) 0.15 0.14 0.16 0.18 0.13
ROA(NI/TA) 0.186269054 0.20327927 0.173676785 0.193404 0.215724
Firm size effect(LNTA) 14.13 14.23 14.37 14.52 14.61
EABL-36
Financial Leverage
effect(TL/TA) 0.35 0.38 0.46 0.84 0.86
ROA(NI/TA) 0.02682845 0.0143603 0.15530312 0.409461 0.026276
Firm size effect(LNTA) 17.39 17.46 17.72 17.82 17.89
EVEREADY-37
Financial Leverage
effect(TL/TA) 0.6 0.66 0.73 0.7 0.58
ROA(NI/TA)
Firm size effect(LNTA)
KENYA ORCHARDS-38
Financial Leverage
effect(TL/TA) 1.02 1.01 1 1 0.96

58
ROA(NI/TA) -0.02 -0.01 0 0 0.04
Firm size effect(LNTA) 18.18 18.13 18.07 18.05 18.07
MUMIAS-39
Financial Leverage
effect(TL/TA) 0.38 0.43 0.51
ROA(NI/TA) 0.02166631 0.083548 0.048276
Firm size effect(LNTA) 16.95 17.13 17.12
UNGA LTD-40
Financial Leverage
effect(TL/TA) 0.43 0.34 0.34 0.38 0.47
ROA(NI/TA) 0.14964667 0.0823855 0.22545921 0.348471 -0.08312
Firm size effect(LNTA) 15.53 15.44 15.56 15.67 15.91
SAFARICOM-41
Financial Leverage
effect(TL/TA) 0.44 0.4 0.41 0.41 0.38
ROA(NI/TA) 0.10685473 0.0934247 0.08246009 0.026287 0.190102
Firm size effect(LNTA) 18.33 18.46 18.55 18.62 18.67
Barclays Bank-42
Total Debt 0.82 0.51 0.82 0.83 0.84
ROA 0.036943139 0.06147377 0.048572404 0.047293 0.036873
Size 24 26 26 26 26
Cooperative Bank-43
Total Debt 0.86 0.87 0.88 0.85 0.84
ROA 0.026816531 0.029674936 0.031881268 0.038507 0.039393

59
Size 18.52 18.85 18.94 19.12 19.26
Diamond Trust Bank-44
Total Debt 0.88 0.88 0.89 0.86 0.86
ROA 0.020312743 0.029690966 0.027807955 0.030031 0.031412
Size 18.01 18.24 18.49 18.72 18.93
Equity-45
Total Debt 0.77 0.82 0.83 0.82 0.81
ROA 0.041998953 0.049863089 0.0526005 0.049678 0.047808
Size 25.33 25.69 26 26.21 26
HFCK-46
Total Debt 0.78 0.85 0.85 0.87 0.87
ROA 0.012839048 0.012962834 0.019524949 0.018149 0.021
Size 23 24 24 24 24
KENYA REINSURANCE CORPORATION-47
Total Debt 0.61 0.61 0.61 0.38 0.64
ROA 0.088589862 0.089403013 0.100258682 0.117786 0.106313
Size 23 23 23 23 24