the relationship between a school district's
TRANSCRIPT

Seton Hall UniversityeRepository @ Seton HallSeton Hall University Dissertations and Theses(ETDs) Seton Hall University Dissertations and Theses
Fall 9-12-2018
The Relationship Between a School District'sAdministrative Information Technology Budget asProportion of the Overall UndistributedExpenditures Budget and New Jersey 2016-2017PARCC PerformancePeter S. [email protected]
Follow this and additional works at: https://scholarship.shu.edu/dissertations
Part of the Educational Leadership Commons, and the Education Economics Commons
Recommended CitationLutchko, Peter S., "The Relationship Between a School District's Administrative Information Technology Budget as Proportion of theOverall Undistributed Expenditures Budget and New Jersey 2016-2017 PARCC Performance" (2018). Seton Hall UniversityDissertations and Theses (ETDs). 2590.https://scholarship.shu.edu/dissertations/2590

THE RELATIONSHIP BETWEEN A SCHOOL DISTRICT’S ADMINISTRATIVE
INFORMATION TECHNOLOGY BUDGET AS PROPORTION OF THE
OVERALL UNDISTRIBUTED EXPENDITURES BUDGET AND
NEW JERSEY 2016-2017 PARCC PERFORMANCE
PETER S. LUTCHKO
Dissertation Committee
Gerard Babo, EdD
Christopher Tienken, EdD
Michael Kuchar, PhD
Submitted in partial fulfillment of the requirements for the degree of
Doctor of Education
Department of Education Leadership, Management, and Policy
Seton Hall University
2018

© 2018 by Peter Lutchko
All rights reserved

ii

iii
ABSTRACT
The purpose of this relational, nonexperimental, explanatory, cross-sectional study with
quantitative methods was to explain the relationship, if any, between the administrative
information technology budget as a proportion of the overall undistributed expenditure account
on PK-12 and K-12 New Jersey public school districts’ student achievement in English language
arts (ELA) and mathematics, as measured by the high-stakes New Jersey standardized test
entitled Partnership for Assessment of Readiness for College and Careers (PARCC), during the
2016–2017 school year. The administrative information technology budget refers to networking,
technology infrastructure, and support, rather than hardware. Additionally, the study included
examination of the influence of other student, district, and staff variables such as student
absenteeism, percentage of students with disabilities, socioeconomic status, district enrollment
size, percentage of faculty with advanced degrees, and faculty attendance on the PARCC 2016–
2017 in both ELA and mathematics.
The target variable of interest, the administrative information technology budget as
proportion of the overall undistributed expenditure account, was not found to be a significant
predictor of achievement on PK-12 or K-12 New Jersey school districts PARCC scores in ELA
or mathematics. The results of this study indicated that no statistically significant relationship
exists between the proportion of the administrative information technology budget and
proficiency percentages on PK-12 or K-12 New Jersey school districts PARCC scores in ELA or
mathematics. Of the variables included in this study, student absenteeism, percentage of faculty
with advanced degrees, and enrollment size were deemed statistically significant predictors when
PARCC ELA was the dependent variable. When PARCC mathematics was the dependent

iv
variable, student absenteeism and socioeconomic status were the identified statistically
significant predictor variables.
Keywords: PARCC, standardized test, student achievement, school finance, technology
budget

v
DEDICATION
First and foremost, this study is dedicated to my mother, Julie Lutchko. This project would not
have come to fruition without her love and support through all these years. Since I was a little
kid getting help with long division, to the completion of my doctoral degree, my mom has been
there every step of the way, making sure I had everything I needed and being my biggest
supporter. Mom, every day I strive to make you proud and live by the example you have set for
me and our family. This degree and project is something I never thought was possible and
without my mom’s encouraging words, it may not have been. My mom has told me from as far
back as I can remember that anything is possible and whether it be completing this degree or
traveling the world, my mom has been there every step of the way, making sure that all my
dreams come true, no matter what obstacle the world may throw my way.

vi
ACKNOWLEDGEMENTS
I am blessed to have a large family that consists of four siblings and 15 amazing nieces
and nephews. Whether it be your encouraging words, lending a lap top to complete my
dissertation, or providing much needed time away from this project, I need to personally thank
Tracy, Julie, Bobby, Tara, Ashley, Taylor, Laryn, Lindsay, Brent, Connor, Aryana, Jayce,
Mackenzie, Maddy, Logan, Ryan, Sarah, Nilah, and Gabby. To my best friend, Colleen, thank
you for believing in me on the days I did not even believe in myself. Not many people are lucky
to find their forever friend at such an early age and I am lucky to have you. I would be remiss if
I did not mention my late father, Wayne Lutchko, who initially fueled my endless pursuit of
education and drive for success in school. Dad, achieving this level of education is something
you always dreamed for me and part of me knows that I inherited this dream not only from, but
for you.
I would like to acknowledge my dissertation committee: Dr. Gerard Babo, Dr.
Christopher Tienken, and Dr. Michael Kuchar for all their guidance and support throughout this
dissertation process. I remember how excited I was when Seton Hall provided me the names of
Dr. Babo and Dr. Tienken as the initial committee members because of the distinguished
professionalism and reputation I had experienced in earlier degree courses. Eventually after
completing my administrative internship and serving under additional graduate classes under Dr.
Kuchar, I knew he was the right choice to complete my committee. My committee members
provided me the guidance, advice, and tools that I needed to reach this end goal. I am forever
grateful for the dedication you have given my study throughout this process. Thank you for
helping this project become the greatest work of academia I have succeeded in completing.

vii
TABLE OF CONTENTS
ABSTRACT .................................................................................................................................. III
DEDICATION ............................................................................................................................... V
ACKNOWLEDGEMENTS .......................................................................................................... VI
LIST OF TABLES ........................................................................................................................ IX
CHAPTER 1–INTRODUCTION ................................................................................................... 1
Background ......................................................................................................................... 1
Statement of the Problem .................................................................................................... 4
Purpose of the Study ........................................................................................................... 6
Research Questions ............................................................................................................. 6
Null Hypotheses .................................................................................................................. 7
Theoretical Framework: Input–Output Theory ................................................................... 8
Independent Variables: District Published Budgets and the NJ School Performance
Report .................................................................................................................................. 8
Dependent Variables ........................................................................................................... 9
Significance of the Study .................................................................................................. 11
Limitations, Delimitations, and Assumptions ................................................................... 12
Limitations ............................................................................................................ 12
Delimitations ......................................................................................................... 12
Assumptions .......................................................................................................... 13
Definition of Terms........................................................................................................... 13
Organization of the Study ................................................................................................. 15
CHAPTER 2–LITERATURE REVIEW ...................................................................................... 17
Methodological Issues ...................................................................................................... 18
Inclusion and Exclusion Criteria for Literature Review ................................................... 18
NJ School Performance Report ......................................................................................... 19
Literature Review Procedures ........................................................................................... 19
The Theoretical Framework .............................................................................................. 20
History of School Finance and Technology ...................................................................... 21
Variables of Interest .......................................................................................................... 25
School Finance ...................................................................................................... 28
Technology ........................................................................................................... 30
Student Variables .................................................................................................. 35
Staff Variables ...................................................................................................... 40
Conclusion ........................................................................................................................ 42
CHAPTER 3–METHODOLOGY ................................................................................................ 44
Organization of the Chapter .............................................................................................. 44
Purpose of the Study ......................................................................................................... 44
Research Questions ........................................................................................................... 45
Null Hypotheses ................................................................................................................ 46

viii
Research Design................................................................................................................ 46
Sample Population and Data Source ................................................................................. 47
Data Collection ................................................................................................................. 49
Dependent Variables ......................................................................................................... 52
Reliability and Validity ..................................................................................................... 53
Data Analysis .................................................................................................................... 55
Conclusion ........................................................................................................................ 56
CHAPTER 4–ANALYSIS OF THE DATA ................................................................................ 57
Procedure .......................................................................................................................... 57
Descriptive Statistics ......................................................................................................... 59
Research Question 1 ......................................................................................................... 60
Simultaneous Multiple Regression: ELA ............................................................. 61
Hierarchical Linear Regression: ELA ................................................................... 63
Research Question 2 ......................................................................................................... 68
Simultaneous Multiple Regression: Mathematics ................................................ 68
Hierarchical Linear Regression: Mathematics ...................................................... 70
Conclusion ........................................................................................................................ 74
CHAPTER 5–CONCLUSION AND RECOMMENDATIONS .................................................. 76
Organization of the Chapter .............................................................................................. 76
Purpose of the Study ......................................................................................................... 77
Research Questions and Answers ..................................................................................... 77
Research Question 1 ............................................................................................. 78
Null Hypothesis 1 ................................................................................................. 79
Research Question 1: Answer ............................................................................... 79
Research Question 2 ............................................................................................. 80
Null Hypothesis 2 ................................................................................................. 80
Research Question 2: Answer ............................................................................... 81
Conclusions and Discussion ............................................................................................. 82
Recommendations for Policy ............................................................................................ 84
Recommendations for Practice ......................................................................................... 87
Recommendations for Future Research ............................................................................ 91
Conclusions ....................................................................................................................... 92
REFERENCES ............................................................................................................................. 94
APPENDIX ................................................................................................................................. 101

ix
LIST OF TABLES
Table
1. District-Level Variables ............................................................................................................. 9
2. Number of Districts by County in New Jersey ......................................................................... 48
3. Variables and Descriptors ....................................................................................................... 50
4. Descriptive Statistics Table for Overall Population ................................................................ 60
5. ELA Model Summary ............................................................................................................... 61
6. English Language Arts ANOVA Table ..................................................................................... 61
7. English Language Arts Coefficients Table .............................................................................. 63
8. ELA Hierarchical Regression Model Summary Table............................................................. 65
9. ELA ANOVA Results Table ...................................................................................................... 66
10. ELA Hierarchical Regression Coefficients ............................................................................ 67
11. Mathematics Model Summary................................................................................................ 69
12. Mathematics ANOVA Table ................................................................................................... 69
13. Mathematics Coefficients Table ............................................................................................. 70
14. Mathematics Hierarchical Regression Model Summary ....................................................... 72
15. Mathematics ANOVA Results Table ...................................................................................... 72
16. Mathematics Coefficients and VIF Table .............................................................................. 74

1
CHAPTER 1
INTRODUCTION
Background
The debate over whether money really matters in relation to student achievement has
been controversial, with conflicting literature and studies on the topic. The Coleman Report is
the first large piece of literature that indicated school finance did not really matter (Coleman et.
al, 1966). Hanusek (1996, 2016) completed several studies since this report that back up the
claims submitted by Coleman et al. (1966). Coleman et al. and Hanusek (1996, 2016) have been
challenged by other researchers that argue that money does matter (Greenwald, Hedges, & Laine,
1996a, 1996b; Hedges, Laine & Greenwald, 1994).
Technology and its impact on student achievement has also been debated by researchers
and practitioners alike. For example, using a pretest–posttest method, Huang (2015) showed that
the intervention of technology positively influenced student achievement in certain groups. This
is in contrast to Shapley, Sheehan, Maloney, and Caranikas-Walker (2011), who studied a wide
scale 1:1 immersion program in Texas and showed no influence on student achievement.
Few studies exist on the direct link between expenditures on technology and student
achievement. DeLuca and Hinshaw (2013) grouped technology with instruction when
comparing expenditures to student achievement. Other models are similar, but limited research
exists on technology budget specifically and a possible relationship with student achievement.
Coleman et al. (1966) first initiated claims that other factors did not matter when
socioeconomic status is taken into account, such as school finance, and claimed that
socioeconomic factors had such a big impact that other factors, such as a budget, would have
minimal impact. Hoy, Tarter, and Hoy (2006) challenged this with the construct of academic

2
optimism. They created this construct based on the variables of academic emphasis on schools,
collective efficacy, and faculty trust in parents and students; and demonstrated how they work
together to influence student achievement. This provides evidence that other variables can still
affect student achievement even after socioeconomic status is controlled for.
Prior to the No Child Left Behind Act (NCLB, 2002), standardized testing existed, but
the Act was the first formal legislative push by the federal government in regard to standardized
testing and what comes out of schools. Prior to this, standardized testing was handled at the state
level. The NCLB mandated that certain data be collected in a data warehouse to be decided by
each state and mandated an annual standardized test in mathematics and English language arts
(ELA) in Grades 3–8. The NCLB left the decision to develop the specific test at the state level.
The American Recovery Reinvestment Act (ARRA) signed by former president Barrack Obama
in 2009 amended this by mandating the Common Core standards that were previously developed
by state commissioners.
The development of the Common Core standards led to the birth of the Partnership for
Assessment of Readiness for College and Careers (PARCC) examination. According the State
of New Jersey Department of Education (NJDOE, 2014) website, PARCC was first adopted in
New Jersey during the 2014–2015 school year. This examination is primarily administered
online and is based on the federal Common Core standards. During its first school year of
implementation in 2014–2015, 98% of the students took the PARCC examination online
(Heyboer, 2015). After New Jersey adopted the federal Common Core, the current New Jersey
Student Learning standards lists technology explicitly as Standards 8.1 and 8.2. According to the
NJDOE (2017c),
Readiness in this century demands that students actively engage in critical thinking,
communication, collaboration, and creativity. Technology empowers students with real-

3
world data, tools, experts and global outreach to actively engage in solving meaningful
problems in all areas of their lives. The power of technology discretely supports all
curricular areas and multiple levels of mastery for all students. (Standard 8, Technology
section, para. 4)
New Jersey further pushed the need for technology in schools and possible reorganization
and infrastructure of current technology allotment with the adoption of the PARCC standardized
test. According to the NJDOE (2015) frequently asked questions on PARCC, “Most students
take the PARCC on the computer” (p. 1). The timeframe for PARCC administration is a
relatively small window of about two months. This can place increased demands on the
available technology within a school district or require the purchase of additional technology.
Recently, the Every Student Succeeds Act (ESSA) signed into law by President Obama in
December 2015 specifically offers grant money for districts to use for digital learning. In a
memo sent out by the U.S. Department of Education, the government specifically spells out how
flexibility can be used to tailor technology investments to meet an individual district’s needs:
“Yet many schools, particularly high-need schools, lack the connectivity, resources, and support
for teachers and leaders needed to implement digital learning strategies as a means to improve
student achievement” (South, 2017, p. 1). The federal government is aware of the connectivity
and digital learning divide that exists, yet it supports the federal Common Core standards and
standardized PARCC examination that is administered online. Meanwhile, there is limited
research on how money spent on technology infrastructure affects student achievement. The
money that is spent on technology infrastructure could allow for a smooth administration of the
examination and, in turn, have an impact on student achievement.
A school budget is derived from the money that a school district has to allocate. The
money primarily comes from taxpayers at the local government level. Additional monies can
come from state funding. Like most other states, New Jersey’s funding formula is made up of
4
several components. In New Jersey, the state first determines a base rate that a school needs in
order to educate a child at the elementary level and increases from there. Then, additional
factors such as free-and-reduced-lunch populations, special education populations, and English
language learners (ELLs) are taken into account and additional monies are provided based on the
school district’s special populations. It is then determined based on money coming from
property taxes and local government what can be provided to schools. The difference between
what comes locally and what the state standard is comes from state aid. The district can apply
for certain additional grants for specific programs through the federal, state, and local
governments as well as the private sector. Donations through local education foundations can
also contribute to a district’s budget (Jones, 2014). Budgets are known to be changed and
adjusted based on increased needs or changes in the way money is allocated. A district can then
develop the budgets to the needs of the district following certain budgetary limitations from the
state. Certain budgetary lines and categories must be reported to the NJDOE and these are
published on the NJDOE website, which includes the administration information technology
budget used in the present study.
Statement of the Problem
Legislation such as the ESSA (2016) and the NCLB (2002) has increased funding in the
area of technology. There are also several grants that are available in the area of technology
education in New Jersey (NJDOE, 2017b). More specifically, since the online state-mandated
test PARCC came into existence, many have questioned whether computer-based testing could
implicate student achievement on the PARCC examination. Those that took the PARCC in
2014–2015 tended to score lower than those that took the paper version of the test. For example,
5
in Illinois, 43% of students that took the ELA examination on paper scored proficient or above
versus 36% of the students who took the computer-based test (Herold, 2016).
PARCC testing has also driven increases in technology budgeting in districts. As noted
previously, the test is mostly administered online. This means that districts must build the
technology infrastructures of their schools to meet these demands. This often means increased
funding. It is unclear whether this increase in technology budgeting and spending really benefits
students in the end. According to Herold (2016), the online application of the test potentially
hurt students in Illinois.
Studies exist that do claim that technology in education does in fact make a difference on
student achievement (Huang, 2015; Kiger, Herro, & Prunty, 2012; Storz & Hoffman, 2013).
However, there are many studies that challenge these findings (Harris, Al-Bataineh, & Al-
Bataineh, 2016; Shapley et al., 2011; Williams & Larwin, 2016). There are also studies and
reports that state money does matter in relation to student achievement (Coleman et al., 1966;
Hanushek 1996, 2016). There are also studies that suggest contrary results (Greenwald et al.,
1996a, 1996b; Hedges et al., 1994). Few studies exist in which technology budgets were
compared to student achievement. For example, DeLuca and Hinshaw (2013) did not look at
technology budget alone, but instead grouped it with other components identified as instruction.
I found no peer-reviewed studies in New Jersey regarding the possible relationship between a
school district’s technology budget and student achievement, let alone the system and network
infrastructure budgets. Consequently, with the existence of a state-mandated, high-impact online
examination, now more than ever there is a compelling need to expand research in this area.
There is no denying that technology is an important component in today’s society and real-world
applications. However, identifying how much a district should spend on technology

6
infrastructures and systems to adequately meet student needs could be critical to how school
districts budget and fund technology overall.
Purpose of the Study
The purpose for this study was to explain the influence, if any, of the percentage of the
district’s administrative information technology budgets on a New Jersey K-12 district’s student
achievement in mathematics and ELA as measured by the 2016–2017 PARCC examination. In
addition, the study was aimed to determine the amount of variance that could be explained by
administration information technology budgets when controlling for additional factors that
influence student achievement, such as the school district’s percentages of special education,
ELL students, student attendance, and of students receiving free and reduced lunch. The results
of the study could help policy makers and administrators identify appropriate administration
information technology budgets for maintaining student achievement on the PARCC, save
district resources by eliminating unnecessarily high administration information technology
budgets, and/or increasing technology budgets to result in increased student achievement on the
PARCC. In this study, the administrative information technology budget refers to networking,
technology infrastructure, and support rather than hardware as defined by the NJDOE (2017d).
Research Questions
This study encompassed the following overarching research question:
What is the nature of the relationship between a New Jersey PK-12 or K-12 school
district’s administration information technology budget in relation to the overall budget
on the percentage of students who perform at a Level 4 (L4) or level 5 (L5) on the 2016–
2017 Partnership for Assessment of Readiness for College and Careers (PARCC)
examination when controlling for district, student, and staff variables?

7
There were also two subsidiary research questions:
Research Question 1: What is the nature of the relationship between a New Jersey PK-12 or K-
12 school district’s administration information technology budget in relation to the
overall undistributed expenditures budget on the percentage of students who perform at a
Level 4 (L4) or Level 5 (L5) on the 2016–2017 English Language Arts (ELA)
Partnership for Assessment of Readiness for College and Careers (PARCC) examination
when controlling for district, student, and staff variables?
Research Question 2: What is the nature of the relationship between a New Jersey PK-12 or K-
12 school district’s administration information technology budget in relation to the
overall undistributed expenditures budget on the percentage of students who perform at a
Level 4 (L4) or level 5 (L5) on the 2016–2017 Mathematics Partnership for Assessment
of Readiness for College and Careers (PARCC) examination when controlling for
district, student, and staff variables?
Null Hypotheses
Null Hypothesis 1: No statistically significant relationship exists between a New Jersey PK-12 or
K-12 school district’s percentage of the administration information technology budget in
relation to the overall budget on the percentage of students who perform at a Level 4 (L4)
or Level 5 (L5) on the 2016–2017 English Language Arts (ELA) Partnership for
Assessment of Readiness for College and Careers (PARCC) examination when
controlling for staff, student, and district variables.
Null Hypothesis 2: No statistically significant relationship exists between a New Jersey PK-12 or
K-12 school district’s percentage of the administration information technology budget in
relation to the overall budget on the percentage of students who perform at a Level 4 (L4)

8
or Level 5 (L5) on the 2016–2017 Mathematics Partnership for Assessment of Readiness
for College and Careers (PARCC) examination when controlling for staff, student, and
district variables.
Theoretical Framework: Input–Output Theory
The theoretical framework used to guide the study was the input output theory, also
known as the production function theory. Originally, the theory is routed in economics and its
base meaning is that inputs produce outputs. In education, one area would be the resources (i.e.,
financial, human, organizational, etc.) that go into schools with the expectations for producing
certain outcomes. Regarding this theory, Hanushek (2008) explained, “The common inputs are
things like school resources, teacher quality, and family attributes, and the outcome is student
achievement. The area is, however, distinguished from many because the results of analyses
enter quite differently into the policy process” (p. 2). Drawing upon input–output theory, I used
the administrative technology budget as the input that potentially influences student achievement
as an outcome, which was measured by PARCC scores.
Independent Variables: District Published Budgets and the NJ School Performance Report
The unit of analysis for this study was school district. The independent variables in this
study were retrieved from K-12 district budgets that are published annually on the NJDOE
website and from the annually published New Jersey School Performance Reports. The NJDOE
collects data on various aspects of a school and district and publishes them annually by school
and possible district in 2017–2018 in a performance report. The variables used in this study
were based on the literature regarding what potentially influences student achievement as shown
in Table 1.

9
Table 1
District-Level Variables as determined by Peter Lutchko
Variables (at the district level)
Staff variables Student variables District variables
Staff attendance rate Percentage of students
classified as ELLs
Administration information
technology budget as
percentage of overall budget
Faculty and administrators
with a master’s degree or
higher
Percentage of students
receiving free or reduced
lunch
Overall district size
Percentage of students with
disabilities
Student attendance
Dependent Variables
The PARCC examination has been used as the state assessment in New Jersey since the
2014–2015 school year, replacing the New Jersey Assessment of Skills and Knowledge (NJ
ASK) assessment (NJDOE, 2015). The PARCC examination is aligned to the federal Common
Core Standards. The examination is aimed to test students in ELA and mathematics curriculum
components of the Common Core.
According to the NJDOE Frequently Asked Questions (2015), the PARCC exam
improved the NJ ASK and the even earlier High School Proficiency Assessment (HSPA) exam
by providing parents and educators with more information on students for improved instruction
by schools receiving “more comprehensive data that can help improve overall instructions and
can be used to develop personalized support for individual students” (p. 1). The NJDOE (2015)
also stated the following about the online use of technology to administer the test:
Most students take the PARCC exams on computer, which is becoming common among
other tests (for instance, the GED test is now computer-based, and the SAT college-
entrance exams will be). Schools will benefit because, as the test progresses, results will

10
be returned to schools far more quickly–allowing schools to immediately address
academic issues. (pp. 1–2)
However, NJDOE (2015) failed to identify possible challenges.
PARCC is going to become even more high-stakes and important to students as the years
progress. According to the NJDOE (2018), New Jersey uses the PARCC exam as one of several
paths to graduation. Currently, students can take an Accuplacer exam for college entrance, use
SAT or ACT scores, or create a portfolio appeal if the student cannot meet any of the test cut-
offs from the tests listed above. This is true for the classes of 2017–2019. Beginning in 2020,
students can only take the second pathway (alternative test) or third pathway (portfolio appeal) if
they have taken all of the required PARCC examinations for the classes in which they are
enrolled. Beginning in 2021, there will be no alternative test option (NJDOE, 2018). The
PARCC cannot, at this time, be used for class placements or other high impact decisions,
although there is no data on how policy and actual practice differ on this regulation.
New Jersey is one of seven states, including the District of Columbia, using the PARCC
examination as a measure of student achievement. At one point, this number was over 20
schools (Clark, 2016). The test is used to score students in the areas of ELA and mathematics.
There is a 5-point scoring system with Level 1 (L1) indicating not yet meeting expectations,
Level 2 (L2) indicating partially meeting expectations, Level 3 (L3) indicating approaching
expectations, Level 4 (L4) indicating meeting expectations, and Level 5 (L5) indicating
exceeding expectations. In order for a student to get an L1, they must score between 650–700,
L2 is 700–725, L3 is 725–750, L4 is 750–790, and L5 is 790–850. Each content area or subject
matter has performance indicators that determine where a student must be to make each cutoff.
Those scoring below an L4 are considered not on track for their grade and may require additional
help to meet standards (PARCC, 2018b).

11
Significance of the Study
Online, state-mandated testing has brought about many changes in school districts in
regard to the delegation of funds and technology. There is varied and limited research both on
how technology effects student achievement, if at all, and if overall money really matters in
relation to student achievement. The literature indicates that what is spent actually does not
matter because once other factors such as socioeconomic status are controlled for, school finance
is invalidated (Coleman et al., 1966). Currently, there is debate over whether online
administration of tests such as the PARCC examination effects student achievement (Herold,
2016). Many of the previous studies on school finance and its relation to student achievement
were focused on the school level. The present study expanded upon this by using district-level
data.
Policy makers and school practitioners could benefit from additional research in the area
of how technology budgets and, more specifically, the administration information technology
budget, and student achievement relate to each other. This is due largely to research suggesting
that the online administration of tests can actually hurt students as well as the limited research on
the topic of technology budgets and student achievement (Herold, 2016). For the current study, I
found no published studies in New Jersey in the area of school budgets and student achievement
or school technology budgets and student achievement. With this new kind of testing bringing
about new questions for school districts, including how to budget for administration information
technology, there is a need for this type of study. If the results of the study show a high
correlation between the percent of administration information technology budget and PARCC
examination scores, New Jersey districts may try to raise funding in these areas. If the results of
the study reflect a low correlation between the percentage of administration information

12
technology budget and PARCC examination scores, implications would be conveyed to those
generating district and technology budgets, including those at the state level, as well as those
administrators who implement and apply budgets.
Limitations, Delimitations, and Assumptions
Limitations
True pure experimental studies can rarely be implemented within the educational field.
This causes researchers to use the correlational design that allows discussion of observed
relationships between the variables; however, cause and effect cannot be determined.
This study was limited by the variables that the bureaucrats of the NJDOE determined
important enough to collect and report out annually, either on its website or through the New
Jersey School Performance Report. Two variables that have been known to affect student
achievement, as indicated in the literature review, are student mobility and attendance which are
no longer reported annually.
In addition, the standardized tests themselves contain limitations. Tienken and Wilson
(2005) listed the limitations by questioning content validity, low reliability of cluster scores, and
a lack of score precision.
The results might also have been limited by the reporting of the data on the NJDOE
websites and the accuracy of those results. Finally, I used the revised 2016–2017 school year
budgets as a measure of expenditures instead of the actual dollars spent.
Delimitations
The data collection was limited to K-12 public school districts in New Jersey. Therefore,
data may not be projected to other school district types or locations in other states. Data were
collected from schools from varying district factor groups A–J within the entire state of New

13
Jersey. Data were aggregated at the district level and not done by school building. Data are only
reflective of PARCC examination scores from the 2016–2017 school year. The data were
collected for only one point in time, which was the 2016–2017 school year. A final delimitation
was using the broad budget line of the administrative information technology budget without
knowing how that money was used and implemented.
Assumptions
It was assumed that the data available on the New Jersey website overall budgets and
administration information technology budgets were accurate. It was assumed that the data
presented in the New Jersey School performance reports were also accurate. Finally, it was also
assumed that the data were accurately transferred into the Statistical Package for the Social
Sciences (SPSS).
Definition of Terms
Achievement Gap: The difference or disparities in student achievement scores between different
groups of students.
Administration Information Technology Budget: Used to assess how school districts are
budgeting for the various technology infrastructure budgets. Included in this budget are
costs associated with the administration and supervision of technology personnel,
systems planning and analysis, systems application development, systems operations,
network support services, hardware maintenance and support, and other technology
related administrative costs (NJDOE, 2017e).
District Factor Group (DFG): Classification system previously used to compare school districts
with similar socioeconomic status within New Jersey by the DOE. They were then
placed in one of eight groupings: A, B, CD, DE, FG, GH, I, and J, with J being the

14
highest on the economic scale. Factors used to determine classification were percentage
of adults with no high school diploma, percent of adults with some college education,
occupational status, unemployment rate, percent of individuals living in poverty, and
median family income. It was published every 10 years with the last one published in
2000 (NJDOE, 2011).
English Language Learner (ELL) Students: The percentage of ELL students in a district is
determined by taking the total number of students who are eligible for, but not
necessarily receiving, ELL services and dividing it by the entire population (NJDOE,
2011).
New Jersey School Performance Report; Report published annually the NJDOE that highlights
student achievement, enrollment, and demographic totals based on various state report
submissions (NJDOE, 2017d).
Partnership for Assessment of Readiness for College and Careers (PARCC): The statewide
standardized examination currently used to test students in the state of New Jersey. The
PARCC is based on the federal Common Core standards and tests students on the
curriculum goals for each respective grade, including the areas of ELA and mathematics
in Grades 3–11 (NJDOE, 2015).
Student Achievement: In this study, the PARCC district scores from the 2016–2017 school year
were used to define student achievement. Student achievement is considered to be met
when scores are within the meeting or exceeding expectations levels on this examination.
Student Attendance Rate: District-level totals are calculated by dividing the total days of possible
attendance of all students in a district by the total number of students’ days present in a
district for the 2016–2017 school year (NJDOE, 2011).

15
Students With Disabilities: The percentage of students determined to be eligible for special
education and related services based on an eligibility assessment. This is calculated by
taking the total enrollment of students eligible for special services and dividing it by the
total number of students in a district (NJDOE, 2011).
Student to Faculty Ratio: Calculated using the total student enrollment in a district as of the
October snapshot by the total full-time equivalencies (FTEs) of classroom teachers and
educational support services (NJDOE, 2011).
Organization of the Study
Chapter 1 encompassed the background of the study and a presentation of the problem
between the PARCC examination scores in K-12 districts and the administration information
technology budget. Further investigation is needed in this area with the emergence of the new
high-impact state standardized test that is now administered online.
Chapter 2 includes a literature review to present a theoretical framework that links school
and district budgets with student achievement. The literature review also covers the various
student, staff, and district variables that were controlled for in this study.
Chapter 3 includes discussion of the research design and methods used in the study. The
data for the independent, dependent, and control variables were collected from the NJ School
Performance Report and the NJDOE website.
Chapter 4 is a detailed presentation of the data and the results of the statistical findings of
the study, while Chapter 5 includes the statistical summary and data implications on policy and
practices as well as suggestions for future research. In addition, Chapter 5 contains conclusions
based on the primary research question: What is the nature of the relationship between a New
Jersey PK-12 or K-12 school district’s administration information technology budget in relation

16
to the overall budget on the percentage of students who perform at a Level 4 (L4) or level 5 (L5)
on the 2016–2017 Partnership for Assessment of Readiness for College and Careers (PARCC)
examination when controlling for district, student, and staff variables?

17
CHAPTER 2
LITERATURE REVIEW
My purpose in conducting the study was to explain the strength and direction of the
relationships between the administration information technology budget and other identified
control variables found through an extensive literature review as well as PARCC examination
scores in New Jersey K-12 districts or PK-12 districts in the area of ELA and mathematics. As a
guide to the review of the literature, I used the overarching research question: “What is the
nature of the relationship between a New Jersey PK-12 or K-12 school district’s administration
information technology budget in relation to the overall budget on the percentage of students
who perform at a Level 4 (L4) or level 5 (L5) on the 2016–2017 Partnership for Assessment of
Readiness for College and Careers (PARCC) examination when controlling for district, student,
and staff variables? The literature review includes the current literature, legislation, and relative
literature on the relationship between school budgets and student achievement. The objective of
this review was to identify studies that show statistical significance, if any, in relation to student,
school, and teacher variables on student achievement in K-12 districts as measured by the New
Jersey PARCC examinations in ELA and mathematics.
The Coleman Report is a pivotal work on factors that influence student achievement,
suggesting that student achievement is most influenced by socioeconomic factors and that little
else matters once this is taken into account (Coleman et al., 1966). However, researchers
continue to challenge this belief. In their study on academic optimism Hoy et al. (2006) created
a construct consisting of academic emphasis on schools, collective efficacy, and faculty trust in
parents and students work together to significantly influence student achievement. Studies of
this kind lend themselves to other factors also impacting student achievement.

18
Standardized tests are becoming more high impact today. In New Jersey, changing
graduation requirements have become more of a focus on the PARCC exam. As years progress,
the NJDOE will offer fewer and fewer alternatives to taking the PARCC for a pathway to
graduation (NJDOE, 2018). With the new standardized test being administered online, questions
of whether this will have an impact on student achievement arise. Illinois has already noticed a
difference in student achievement based on the test application (Herold, 2016). As an extension
of this, the present study served to question whether the amount that a school district spends on
administration information technology budget is related to student success on the PARCC
examination.
Methodological Issues
The literature review process uncovered many issues in relation to the studied variables,
particularly in terms of the technology budget’s effect on student achievement. Very little
literature exists about these variables together. Even the literature that exists on the subject
groups technology with other variables (De Luca & Hinshaw, 2013). In addition, early 2018 was
the first time that the New Jersey bureaucrats released school report card data at the district level.
This meant that this study was reliant on their processes for calculating the data and limiting the
amount of district-level studies that could be conducted prior to this one. The variables
presented were based on empirical research, but limited to what New Jersey bureaucrats deemed
important enough to collect and report to the public via the NJ School Performance Reports.
Inclusion and Exclusion Criteria for Literature Review
Studies that were completed in the United States involving technology, budgets, and their
effect on student achievement were included in this study. Studies that were done in other
countries were not included in the study. Most of the research was culled from the years 2005–

19
2017. However, due to the fact that there is such limited literature on technology budgets and
student achievement, but considerable research exists from outside the date range on school
finance and student achievement, some literature from before 2005 was used in this review.
Current studies, peer-reviewed articles, scholarly works, government reports, books, and relevant
current legislation, as well as seminal works that included background information of the studies
variables were used.
NJ School Performance Report
The NJDOE publishes the annual NJ School Performance Report, which replaces the old
NJ School Report Card. The NJ School Performance Report informs the public and local school
districts on their progress for accountability purposes. This is required since the NCLB and state
legislation mandated it to see how well schools are performing and determine college and career
readiness. Many of the variables utilized in this study were extracted from the 2016–2017 school
year NJ School Performance Report. The Report is broken into several sections that include
overview, demographic data, academic achievement, student growth, college and career
readiness, climate and environment, staff, accountability and narrative (NJDOE, 2017d).
Literature Review Procedures
The literature reviewed for this chapter was accessed via online databases including
EBSCO host, ProQuest, ERIC, JSTOR, and Academic Search Premier. In addition, online and
print versions of legislation, relative news articles, peer-reviewed educational journals,
dissertations, books, and reports were utilized.
A variety of search terms were used when conducting the literature review including
standardized testing, high stakes testing, school finance, student achievement, school/district
budgets, technology, technology infrastructure, school variables, socioeconomic status, students

20
with disabilities, English proficiency, student variables, and teacher variables as determined by
literature and the 2016–2017 NJ School Performance Report.
This review includes current and relative literature on the relationship between school
budgets and student achievement scores on the 2017 PARCC examination. In addition, the
review also includes an overview on student, district, and teacher variables and how they relate
to student achievement. Bibliographies were used to identify other important works of scholarly
literature on the subject matter.
Most of the studies examined were quasi-experimental or correlational. The variables
that are studied are difficult in the sense that they do not really lend themselves to a true
experimental design.
The Theoretical Framework
The theoretical framework of this study was based on the economic input–output theory,
also referred to as the production function theory (Beggs, 2018). Put simply, this theory suggests
that whatever one puts into something will affect what comes out of it. From an economic
perspective Raa (2010) described it as an “important quantitative economic technique that shows
the interdependencies between various branches of a national economy and even between the
various branches of different, possibly competing economies” (p. xiii). According to Raa, this
theory in economics went away for some time, but is making a return due to globalization and
increased competition. Schools are constantly competing for resources, which oftentimes comes
in the form of money. This is why this theory still applies in education today. High-impact
standardized test scores only increase the competition between schools and districts by creating
rankings and assigning numbers to them.

21
In the present study, the input variables would be the various independent variables
including percentage of administrative information technology budget to the overall general
expense budget, school size, percentage of students identified as being chronically absent,
percentage of economically disadvantaged students, percentage of students eligible for ELL
services, and percentage of students with disabilities; faculty attendance, and the percentage of
faculty with a master’s degree or higher. These would be all the variables that would have an
impact of effect on the outcome or dependent variable, based on current literature and available
data. The dependent variable was student achievement and was measured as those students that
are labeled in the L4 or L5 category of the PARCC examination and therefore labeled as meeting
or exceeding expectations and standards on the test during the 2016–2017 school year.
History of School Finance and Technology
The ongoing debate that still exists today in terms of school finance is focused on
adequacy and equity, which are two sides of the same coin. School finance equity is defined and
described as “fairness in the treatment of students. . . . Equity and equality are not synonyms.
Although some degree of inequality will exist, it should be minimized” (Brimley, Verstegen, &
Garfield, 2012, p. 8). According to Park (2011), school equity should close the gap between
school districts’ abilities to provide funds. Park then described adequacy as, “the principle that
states should provide enough funding for all students to be able to meet academic expectations”
(para. 1). There has been a trend lately to move away from focusing so much on financial equity
and toward reaching economic adequacy (Hanushek, 2016). This is the move away from the
inputs that a school provides, such as funding, and toward the outputs that a school produces,
such as student achievement. This ongoing discussion has prompted many legal cases and state
law reforms to address what makes a school equitable and adequate as well as what minimum

22
funding requirements are needed to allow a student successful achievement. The federal and
state mandates that resulted from these reforms shifted much of the power from the local level to
the federal and state governments in order to bridge these equity and adequacy gaps.
An example of this was demonstrated in a study by Chung (2013) in Maryland after their
school finance reforms. Under their new state funding formula identified groups such as free-
and-reduced-lunch students, special education students, and ELLs received a larger proportion of
funding. The results of the study showed increased spending for these groups and shifted the
power from local funding to state funding (Chung, 2013). Chung used student dropout rates as a
measure of student achievement and compared it to the new funding formula to measure the
level of funding adequacy. Although the results and finding of this study were negative, they
were not significant. This leads to the conclusion that the reform helped to make funding more
equitable, but not necessarily adequate.
The history of finance change started with the Coleman Report (Coleman et al., 1966).
The Department of Education funded a report about school equality, which resulted in the
Coleman Report. The study showed that funding had little effect on student achievement, while
student background and socioeconomic status were more predictive of student achievement than
were school funding amounts (Coleman, 1966). At the time, there were larger implications such
as the support for desegregated schools.
In terms of federally funding technology, the NJDOE (2014) technology website lists E-
Rate program as being in effect today. This program came out of The Telecommunications Act
of 1996. The Universal Science Fund (USF), also known as the E-Rate program, provided $2.25
billion annually to provide schools and libraries across the nation with discounts on
telecommunications services such as Internet access and internal connections. This was the

23
federal government’s responding to the growth of the Internet, allowing for the continued growth
and equitable access of it.
The NCLB (2002) signed by President George W. Bush substantially increased the role
of the federal government in public education and school finance. The purpose of the NCLB is
“distributing and targeting resources sufficiently to make a difference to local educational
agencies and schools where needs are the greatest . . . to ensure that all children have a fair,
equal, and significant opportunity to obtain a high-quality education” (sec. 1001). This meant
that the federal government would be providing additional monies through grants for states and
local governments that followed certain set guidelines and for identified groups such as special
education students, ELLs, and free-and-reduced-lunch students.
Another component of the NCLB (2002), later amended by the ARRA (2009) is the
development of state tests. The NCLB federally mandated that states develop a test in ELA and
mathematics in Grades 3–8 to test on progress annually. Although the NCLB prohibited any
nationally developed standardized test, the ARRA amended the NCLB with the Common Core
standards and resulted in the development of PARCC testing, which was focused on criterion-
referenced questions that would align with Common Core standards.
Part D of the NCLB is particularly related to technology; its primary goal is to improve
student achievement through access to technology. This includes pushing states and local
governments to use and implement technology effectively in elementary and secondary schools
through professional development, evaluation of programs, increasing access to technology,
technology expansion, and integration of technology into the curriculum. The funding for these
programs from the federal government includes 50% from a federal formula and 50% from grant
programs.

24
The ARRA of 2009 signed by Barack Obama was implemented as an economic stimulus
package. Included in these programs was the Race to the Top program of 2011, which provided
$4.35 billion for education. The Race to the Top initiative included designing assessments and
standards to help students become more college-ready, creating data systems to track student and
teacher progress for improved instruction, recruiting and maintaining teachers and school
administrators, and helping to fix the lowest performing schools. Race to the Top provided
funds to those schools that followed these guidelines and showed improvements by being
awarded points. As a part of this program, Priority 2 of the Race to the Top Executive Summary
(p. 1) addresses science, technology, engineering, and math (STEM) research and requires that
all schools, in order to be eligible for the grant, provide higher-level curricula in STEM. Schools
must also work with STEM experts and partners to integrate STEM content across all subjects
and grade levels and prepare students for careers and STEM-related studies beyond secondary
schooling. Race to the Top reinforces the federal government’s role in prioritizing technology in
secondary schools.
In addition to all of the federal government initiatives, programs, and grants, there have
been several New Jersey-specific grants. Grants that are directly related to New Jersey and listed
on the NJDOE website are Assistive Technology Grants, Star-W Students Using Technology to
Achieve Reading-Writing, Matrix or Math Achievement to Realize Individual Excellence, the
Access-Collaboration-Equity Plus (ACE+) grant, Pairing and Sharing, Technology Fellowship,
Implementing New Curricular Learning with Universally Designed Experiences (INCLUDE),
and Teaching & Learning with Essential New Technologies in the 21st Century (Talent 21).
These grants are available through the federal programs outlined above and state mandates such
as the addendum to Common Core State Standards and the New Jersey Core Curriculum Content
25
Standards (NJCCS), entitled 21st Century Learning Skills. An additional grant named the Future
Ready NJ Grant Program is aimed to provide money to schools to enable them to support the
technology and digital learning infrastructure of the PARCC examination. The maximum award
for this program is $250,000 and the project period ran from March 1, 2016 to August 31, 2016.
It was open to local education authorities (LEAs) as well as charter and renaissance schools, and
showed the state’s commitment to the federally designed Common Core standards, PARCC
examination, and technology.
Variables of Interest
As mentioned, the Coleman Report (Coleman et al., 1966) was one of the first large-scale
published studies that suggested student achievement and funding were not really related. Since
then there have been numerous studies that were focus on the subject. Hanushek (1989, 1997;
Hanushek & Benson, 1994) conducted multiple studies that all show there is little relationship
between funding and student achievement. Hanushek (1989) first proposed the idea of moving
away from the input-directed approach that was institutionalized at the time. In this approach,
schools were measured by what was put into the school, such as money, teacher quality, and
class sizes. Beginning with the NCLB, we have moved away from this model and more to an
output approach in measuring school quality. In this approach, schools are measured by
standardized test scores and, in New Jersey, by student growth objectives (SGOs). Hanushek
(1989) proposed to policymakers that a performance, incentive-driven approach was the best to
improve student achievement based on his analysis of the studies at that time. Hanushek (1989)
maintained that when one controls for family background, the strong positive correlations that
exist between student achievement and funding disappear. Based on prior research in many
different educational settings, Hanushek (1989) found there is strong evidence that does not

26
systematically link expenditures and student achievement. Furthermore, Hanushek (1989) posed
questions that had no answers, such as the limited pressure for the efficient use of resources and
what incentives or motivating factors will help schools increase their outputs and results. Many
of these factors remain unidentified today.
Despite conducting more studies and writing articles, Hanushek and Benson (1994) did
not go without criticism (see Greenwald et al., 1996a, 1996b; Hedges et al., 1994). Hedges et al.
(1994) and Greenwald et al. (1996a) conducted meta-analyses of previous studies by Hanushek
using combined significance tests and in 1994 utilized different samples at the school district
level or smaller. They found that there were significant positive effects in these studies and
relatively few negative results. Greenwald et al. (1996a) directly criticized Hanushek’s work,
claiming that Hanushek changed his views to a more liberal view on the subject and that
resources, particular financial resources, can matter; it just depends under what circumstances.
Greenwald et al. (1996a) claimed Hanushek would analyze the same data multiple times rather
than individual data sets. Additionally, Greenwald et al. (1996a) claimed that he was merely
concerned with vote counting whether a study result is significant or not, rather than the power
and direction of the statistical analysis. Hanushek (1996) rejected these claims, stating that
Greenwald et al.’s (1996b) work and analysis were systematically flawed and biased toward
significant results. Hanushek (1996) claims they only used studies that demonstrated significant
results to skew their meta-analysis and also raised concerns over these results, comparing data
across states when he believed it should be done state by state. Finally, Hanushek (1996)
criticized Greenwald et al. (1996b) using a quasi-longitudinal design because true longitudinal
designs would result in negative resource effects.

27
The one thing all the researchers discussed in this debate agree on is that schools should
not just be given money without incentive or direction on what to do with that money.
Hanushek’s (2016) review of the Coleman Report included this very issue. Hanushek (2016)
stated that the research does not show that money matters or that it never matters and further
claimed that giving money to schools without incentives or rules for the funding will not lead to
increased achievement. Spending in U.S. schools has quadrupled since the 1970s, but student
achievement rates remain mostly unchanged (Hanushek, 2016). Hanushek (2016) maintained
the findings of the Coleman Report that student achievement is much more closely related to
family, neighborhood, and peer environment. He stated that based on real state funding changes,
the historical data from the last half century show that changes in state spending per pupil is
uncorrelated with fourth grade changes in reading, with similar findings in ELA and eighth grade
ELA and mathematics (Hanushek, 2016). Finally, Hanushek (2016) proclaimed that no one, to
date, has found what level of funding is necessary, adequate, or sufficient in improving student
achievement.
Odden, Goetz, and Picus (2008) devised a minimum, per-pupil expenditure on the
national level that would ensure adequate funding. They did this by using a prototype district
based on national averages of ELL students, free-and-reduced-lunch students, and special
education students (Odden et al., 2008). Based on their research, Odden et al. concluded that the
minimum funding is $9,391 per pupil, but pointed out that this amount was based on the best
available data at the time and that states would have to analyze separately using individual
demographic data. They included further research recommendations of more randomized trials,
more studies on districts that were highly successful in raising student achievement, studies of
what constitutes an adequate teacher salary; and studies on how technology affects student

28
achievement and, in turn, reduces personnel requirements of schools (Odden et al., 2008). The
present study was an examination of technology funding and student achievement, to reveal
more about technology funding adequacy.
School Finance
There is no doubt that Hanushek (1989, 1996, 1997, 2008, & 2016) has contributed vastly
to the research findings on student resource allocation and student achievement, although his
research methodology has faced much criticism. There are several studies today that continue
the debate about if and when money matters in schools. Cullen, Polnick, Robles-Piña, and Slate
(2015) conducted a statewide analysis of student instructional expenditure ratios to student
achievement test scores of all districts in Texas from 2005–2006 thru 2009–2010. They found
significant positive relationships between increases in instructional spending and student
achievement in the areas of reading, math, writing, science, and social studies passing rates for
all five school years, with a particularly strong relationship in math and science. A pairwise
groups analysis demonstrated that those in the 55–57.49% ratio group scored lower than the
other groups for all 5 years (Cullen et al., 2015). This study shows that there is the potential for
a strong relationship between instructional expenditures and student achievement.
Another study that links student achievement and expenditures was done in Georgia by
James et al. (2011). This study included 2 years of data from 180 Georgia school districts; the
examination encompassed the Grade 8 Criterion-Referenced Competency Test (CRCT) in
mathematics and reading and the 11th grade Georgia High School Graduation Test (GHSGT) in
mathematics and ELA. James et al. compared the results on these assessments using forward
multiple regressions to seven different financial expenditure categories on student achievement
variables. The predictor variables were teacher salaries and benefits, instruction, pupil services,

29
improvement of instructional services, media services, technology, and other. Overall, it was
determined that financial expenditures had a significant, although small, effect on student
achievement (James et al., 2011). Interestingly, improvement of instructional services had a
significant effect on every student achievement variable. Technology, teacher salary and
benefits, and improvement of instructional services predicted 18.8% of the variance in the ELA
GHSGT. For every 1% increase in technology funding, the 11th grade ELA GHSGT assessment
went down by .107 percentage points. James et al. pointed out that the literature and other
potential benefits of technology did not agree with their findings.
Papke (2005, 2008) found that “Proposal A” school finance reform in Michigan increased
spending in previously lower-spending and higher-spending districts, but average-spending
districts did not spend quite as much after the Proposal when compared to lower-spending
districts. Papke (2005, 2008) also found that the reform and increases in spending significantly
influenced student achievement in fourth grade math standardized test scores. Papke’s 2008
study replicated his 2005 study, but included district-level instead of school-level data and
allowed a longer “lag” time for the after-effects of Proposal A. The results were particularly
strong for those districts that initially demonstrated below-average pass rates on the test. The
results were presented using fixed-effects instrumental variable estimates. Papke’s (2008)
conclusion was that, on average, a 10% increase in real spending for the current and previous 3
years increased students performing satisfactorily by 2.5 percentage points. By allowing for the
longer lag time and taking the dramatic increase in funding that occurred, Papke (2008) was able
to control for some of the traditional effects of school input research in which unobserved
variables such as economic and demographic variables can affect student outcomes. Therefore,
sometimes high spending can be linked to student achievement when it is, in reality, linked to

30
some other unobserved variable. In the present study, I allowed this by using the population of
the desired districts and hierarchical regression to check for strength of impact and influence of
the variable of interest.
In addition to the Coleman Report (Coleman et al., 1966) and the multiple Hanushek
(1989, 1996, 1997, 2008, & 2016) articles previously mentioned, not all contemporary studies
indicate significant relationships between funding and student achievement. De Luca and
Hinshaw (2013) studied student achievement and school expenditures in 607 of 613 Ohio school
districts. The other districts were left out because they were outliers due to small enrollment and
incomplete data. The data were based on the 2009–2010 student achievement data from state
assessments and were grouped by the three different levels identified as highest, continuous
improvement, and lowest. Expenditure categories were grouped into the following categories:
administration, building operations, instruction, pupil support, and staff support. Most
technology was grouped in the instruction category. The stepwise regression analysis showed
weak and inconclusive results between instructional expenditures and student achievement (De
Luca & Hinshaw, 2013). Interestingly, after residual tests were run, De Luca and Hinshaw
found that income might have more to do with student achievement than did classroom
instructional expenditures.
Technology
Technology and student achievement do not have a clearly defined relationship, and
every researcher defines technology differently. For the present study, it was defined as the
administrative information technology budget as a percentage of the overall general expense
budget. Shapley et al. (2011) conducted an experimental design study in the Texas school
systems that received grants for the 1:1 technology immersion program. A Likert scale survey

31
was used to gain insight into technology proficiency, classroom activities, and small-group work.
Attendance measures and disciplinary measures were taken from the Texas educational data
warehouse, PEIMS. Experimental schools were paired with control groups that were not a part
of the program. It is important to note that these control schools still had access to technology;
they just were not in the 1:1 laptop immersion program. The technology immersion program had
significant positive effects on technology proficiency, frequency of technology-based instruction,
and small-group interactions. Discipline rates declined, but control group students tended to
attend school somewhat less frequently than did the experimental groups. There were no
significant effects on reading or math scores, but they were significantly positive across cohorts
and most significant in Cohort 1 math scores when poverty was taken into effect. The leaders in
the treatment group stressed the importance of technology and improving 21st century skills for
students. Shapley et al. stressed the need to not just throw computers and software at school
districts; instead, there is professional development, technology factors, and a myriad of other
factors that go into helping a school successfully implement technology.
A study by Harris et al. (2016) showed that 1:1 technology could have an impact on
student achievement. In their study, Harris et al. used fourth grade elementary students in a Title
I school. The data used to assess student achievement included the Pearson enVision Math series
with topic tests, Discovery Education Assessment results, and attendance records. The study was
quantitative in nature and utlized one elementary classroom that was piloting a 1:1 laptop
program and another that was still using traditional teaching methods. The study did not identify
any instances that would indicate that technology and, more specifically, a 1:1 program have an
effect on student achievement or motivation. Harris et al. used descriptive statistics such as
mean scores to compare the districts and ultimately concluded that it did not appear that

32
technology had a high impact on student achievement, but noted that scores on Discovery Tests
A and B did appear to be higher in the experimental group. The study utilized a small sample
size of 25 in the experimental classroom and 22 students in the traditional classroom. The small
sample size and very limited setting were very large limitations of the study.
Williams and Larwin (2016) conducted a study in Ohio schools using data from the Ohio
Graduation Test (OGT) as a measure of student achievement and matched control schools that
did not have 1:1 computing with an experimental school that did. They measured on multiple
subjects including math, science, reading, social studies, and writing (Williams & Larwin, 2016).
In order to gather the data, Williams and Larwin administered a survey to all high schools in
Ohio asking whether a 1:1 program was used, if students were able to take the laptops home, and
for how long the 1:1 program had been implemented. Schools that did not meet the guidelines
for the study were excluded. Schools were paired on based on Ohio’s Department of Education
webpage for year 2013 based on factors related to average daily membership, median income,
population density, student demographic data for minority enrollment and poverty, and adult
demographic percentages for college degrees and professional jobs. Ultimately, 24 high schools
were identified as meeting the criteria set forth by Williams and Larwin. The data were analyzed
for 5 to 8 years based on when the 1:1 program was introduced and, additionally, an interrupted
time series method was utilized to analyze student achievement scores before the 1:1 program
was introduced and compare it to years after the deployment of the program. Individual student
scores were analyzed for research questions that required full sample or individual scaled scores.
Williams and Larwin found that, overall, no significant differences occurred between the control
and treatment schools of the 48 schools utilized. However, it is important to note as schools are
broken down into smaller clusters, such as longevity of 1:1 programs, inconsistent significant

33
results do start to emerge. It is also interesting that schools using netbooks rather than laptops or
iPads showed significantly greater gains in all five content areas. As demonstrated by other
studies, there were five treatment schools that showed consistently positive and five treatment
schools that showed consistently negative trends across multiple content areas when compared to
control schools (Williams & Larwin, 2016). This trend cuts across devices used and deployment
or implementation time, which indicates other factors that are related to the deployment of a 1:1
program and its relationship to student achievement.
A similar study was conducted by Huang (2015), using a mixed-method approach and
focusing on a Southern U.S.-based second grade class. Huang used a similar design setup where
there was one experimental group and one control group. For the quantitative side, Huang
administered the Expressive Vocabulary Test-2 for pretest and posttest tracking. The
experimental group utilized technology in the instruction such as E-PowerPoints, rhymes, simple
sentences, and short stories accompanied by voiceovers, sound, and animations. The control
group used pen-pencil, textbook, and other traditional methods. The experimental group still had
access to these methods as well. The population was economically disadvantaged, and between
the two classes, there were 40 students in the study. For the qualitative portion of the study,
Huang interviewed students on their perceptions of literacy learning and the technology aspects
of it. Observations were conducted before and during treatment. The experimental group
showed significant changes in pre- and posttest scores based on the dependent sample t test that
was run between the scores, while the control group demonstrated no changes (Huang, 2015).
The experimental group was shown to be more engaged in class. However, the study utilized a
small sample size, which invites criticism. In addition, only two vocabulary software programs
were utilized in the experimental group, which could limit generalizability.

34
Kiger, Herro, and Prunty (2012) compared the effects of a mobile learning intervention
on third grade students in mathematics at a Midwestern elementary school. There were four
classrooms observed in total, two were an experimental group and two were a control group. In
total there were 87 students, which was 97% of the third grade class. The control group utilized
Everyday Math and practiced multiplication using flashcards, while the experimental group used
Everyday Math and web apps for the IPod touch. Several factors were controlled for, including
teacher’s master’s degree in educational technology, student demographics (free-and-reduced
lunch, and ethnicity), student absences during intervention, student math effort and attitude
during intervention, state third grade math test before intervention, multiplication pretest, and the
previous teacher. The results showed that there was a significant difference between
experimental students’ postintervention test results and those of the comparison students. There
was a single-step regression analysis conducted and 68.1% of the variance was explained by
Kiger et al.’s model. Other than the pretest score, the mobile learning intervention was the
biggest predictor of performance on the posttest. The medium-sized performance advantage for
the experimental group was significant at the .01 alpha level. This could have implications to
encourage districts to purchase devices and apps that could help students learn multiplication.
Major limitations were the amount of time over which the study was conducted that could make
the learning device new or novelty, the sample size was small and hence could yield larger
results, there could be confounding pretreatment group differences, and the Kiger et al. did not
evaluate the teacher’s role in the treatment groups.
A qualitative study was conducted by Storz and Hoffman (2013) in which Grade 8
students and teachers were interviewed before and after the implementation of a 1:1 initiative in
a Midwestern urban middle school. Storz and Hoffman interviewed 47 students, representing

35
about half of the eighth grade class as well as eight teachers. The school had a large (85%)
African American population and more than half (65%) were economically disadvantaged. The
school had not met the adequate yearly progress designated by the state for the previous 3 years.
The teachers indicated the range of students interviewed were representative of the eighth grade
class in terms of technology ability levels and personalities. The interviews were semistructured
in design and the postintervention interviews were conducted about two months after the rollout
of the program. The themes that emerged from the analysis of the transcripts were changes in
teacher pedagogy, student learning changes, impact on classroom behavior and management,
need for better communications, and need for additional professional development (Storz &
Hoffman, 2013). Students of different ability levels reported having learning benefits even
though there was now the added distraction potential of communication and online gaming via
the computers. The technology-based instruction allowed students to learn in differentiated and
creative ways; however, increased demands were placed on teachers. With the varied level of
experience and preparedness for a 1:1 initiative, teachers reported being unprepared and
frustrated, although they offered suggestions for professional development moving forward
beyond the initial implementation of the program.
Student Variables
Student socioeconomic status. Socioeconomic status in this current study was defined
by the percentage of students on free and reduced lunch as recorded by the New Jersey
bureaucrats and reported annually on the NJ School Performance Report. The importance of
socioeconomic status as it relates to student achievement was stressed by Coleman et al. (1966)
in the Coleman Report. The Report included data collected from 640,000 superintendents,
principals, teachers, and students. The intent of the Report was to understand the inequality or

36
segregation of schools. Coleman et al. found that schools remained segregated and unequal, but
the critical finding was that schools do not really have an impact on student achievement. As
discussed previously, Coleman et al (1966) concluded that school funding does not greatly affect
student achievement, and socioeconomic status has the highest impact.
Other researchers also have concluded the importance of socioeconomic status on student
achievement. Emphasizing the importance of student achievement, Tienken (2012) discussed
that economically disadvantaged students have never been reported as scoring higher than
middle class or more affluent peers, regardless of state or grade. The Organization for Economic
Co-operation and Development (OECD, 2012) reported that more than other OECD countries, in
the United States, two students from different socioeconomic backgrounds will vary greatly.
The OECD (2012) also reported that as much as 17% of the variation in student performance can
be explained by differences in socioeconomic status.
A study to examine the Florida Comprehensive Assessment Test (FCAT) mathematics
scores confirmed what Ravitch concluded: the schools with the lowest socioeconomic standing
scored the worst on the exam and scores got better as poverty decreased (as cited in Lumpkin,
2016). This is one of the strongest predictors of student achievement (Lumpkin, 2016).
English language learners (ELLs). ELLs are also required to take the PARCC
examination. The NJDOE reported that for the 2016–2017 school year, 6.2% of the student
population was classified as ELLs. Under the NCLB (2002), students that are classified as ELL,
unless new to the school, were mandated to take the annual standardized assessment required
under NCLB within reasonable accommodation. ELL learners is a broad category and thus the
various ethnicities and languages that make up the ELL population carry specific characteristics
and challenges. Nationally, the population of ELL students is increasingly on the rise, as evident

37
from the National Center for Education Statistics (NCES, 2018) report that in the 2014–2015
school year, 4.6 million or 9.4% of students were considered ELL. This was up from the 2004–
2005 school year that had 4.3 million or 9.1% of students considered ELLs (NCES, 2018).
In one study completed by using the publicly available data in the state of Texas, Flores
and Drake (2014) evaluated the likelihood of an ELL student to need remedial services when
entering college. Flores and Drake determined that some precollege characteristics that impacted
Latino or Hispanic families have no impact on Asian students. One interesting factor that
impacted both groups is the negative impact of segregation in the high school setting (Flores &
Drake, 2014).
In Tennessee, Miley and Farmer (2017) conducted a study to compare ELL and non-ELL
students’ performance on the Tennessee Comprehensive Assessment Program (TCAP) and ELL
student’s performance on the WIDA ELL exit examination and performance on the TCAP. The
WIDA examination measures English proficiency and an ELL student’s ability to exit the
program. The study consisted of 302 elementary and middle schools from the 2015 school year.
After independent t tests were run, Miley and Farmer determined that there was a significant
difference between ELL students’ performance on the TCAP examination and non-ELL
students’ performance. Non-ELL students’ achievement levels in both ELA and mathematics
were higher than those of students that passed the WIDA exit examination (Miley & Farmer,
2017).
Students with disabilities. In 2004 the Individuals with Disabilities in Education Act
(IDEA) was passed, mandating that students aged 3–21 be provided a free and appropriate
education. The NCES (2017) reported that as of 2014–2015, the number of special education
students was 6.6 million or 13% of the total public-school education population. The NJDOE

38
(2018) reported in the School Performance report for the 2016–2017 school year that 16.9% of
students were classified as students with disabilities and served with an Individualized Education
Plan (IEP).
There are various ways to educate students with disabilities and there is a wide array of
studies on the different programs and their effects on student achievement. In one study,
Packard, Hazelkorn, Harris, and McLeod (2011) looked at ninth grade students with IEPs in a
southern state. Of the 28 students with IEPs, who had a learning disabled (LD) classification, 14
were studied. Some of those students were assigned to a resource room and some were assigned
to a coteaching classroom based on the recommendation in their IEPs. The scores were
compared using analysis of covariance (ANCOVA) and chi-squared analysis. Although there
were no significant differences, students appeared to make greater gains on the state standardized
test in the resource room classroom then did those in the cotaught classroom (Packard et al.,
2011).
Gage, Adamson, MacSuga-Gage, and Lewis (2017) looked at the academic achievement
of students with emotional-behavioral disorders and compared it to characteristics of highly
qualified teachers such as teachers’ education, certification status, and years of experience.
Then, Gage et al. examined the data in the Special Education Elementary Longitudinal Study
(SEELS) nationally and, using a weighted sample of 39,561 students, analyzed those students in
three waves based on age. Using hierarchical linear modeling, Gage et al. found low academic
achievement for students with emotional-behavioral disorders, a null effect for change in
academic achievement over time, and a null effect for the relationship between characteristics of
highly qualified teachers (identified above) and student academic achievement.

39
In another study, Gronna, Jenkins, and Chin-Chance (1998) used data collected in Hawaii
on students that took the Stanford Achievement Test 8th edition (Stanford 8) and compared
performance of students that have disabilities and those that do not. At the time testing was
completed in grades 3, 6, 8, and 10. The study used three longitudinal cohorts in grades 3 to 6, 6
to 8, and 8 to 10 and ANOVA were run to determine the differences between disabled and
nondisabled students that took the exam. The study found significant differences in performance
between students classified and specific learning disabled, emotional impairment, and mild
mental retardation and their nondisabled counterparts.
Student attendance. In the present study, attendance was controlled for by the district’s
percentage of chronic absenteeism as reported on the NJ School Performance Report. In New
Jersey, the district rate of chronic absenteeism statewide was 10.3% during the 2016–2017
school year. This rate was 11.2% for ELLs and 16.2% for students with disabilities.
A study of Ohio schools showed a statistically significant relationship between student
attendance averages and student achievement on their fourth, sixth, ninth, and 12th grade Ohio
Proficiency Tests (Roby, 2004). A total of 3,171 schools were selected from publicly available
data on the Ohio Department of Education’s website. The study used the Pearson r statistic to
determine the strength and relationship of the variables. Due to the large sample size, Roby
(2004) were able to calculate the Pearson r at the .01 confidence level. Roby (2004) found the
strongest positive correlation in Grade 9 with a Pearson r value of .78 and explained 60% of the
variance, while 32% of the variance was explained in Grade 4 and 29% of the variance in Grades
six and 12.
Gershenson (2016) compared teacher effectiveness and its relation to student
achievement and student absences using longitudinal data from North Carolina’s public schools

40
for students who attended during the 2005–2006 and 2009–2010 school years in Grades 3
through 5. The North Carolina year-end criterion referenced, state-mandated test was used as the
measure of student achievement. In total, 446,244 student-year observations were used in
27,943 unique classrooms that consisted of 13,391 unique teachers (Gershenson, 2016). Based
on the results, Gershenson reported similar magnitudes in standard deviation (SD) for teacher
absences related to teacher effectiveness as for teacher effectiveness in student achievement.
There were strong, negative, and significant relationships identified by teacher effectiveness and
student achievement. The adjusted R2 value to report the amount of absences based on teacher
effectiveness was .38. According to Gershenson, teacher effectiveness mattered more in the
subject of mathematics than in reading.
Staff Variables
Percentage of faculty with advanced degrees. In the Coleman Report, Coleman et al.
(1966) looked at teacher quality and determined, especially as related to minority children, that
verbal acumen scores and educational background had the highest correlation to student
achievement in relation to staff variables. Coleman et al. noted that teacher education will matter
more to a student who does not typically experience a highly educated teacher than one who is
used to this type of teacher. Due to reporting by the bureaucrats, especially in New Jersey, up
until recently, limited data analysis was available for teacher experience based on graduate
degrees or licensing (Hanushek, 1997; Hedges et al., 1994). Today, the state reports the
percentage of faculty that hold bachelor’s, master’s, or doctoral degrees by district, school, and at
the state level. In the 2016–2017 year the NJ School Performance Report indicated that
statewide there were 57% bachelor’s, 42% master’s, and 1% doctoral degreed teachers.

41
Clotfelter, Ladd, and Vigdor (2007) looked at teacher characteristics and their
relationship to student achievement in North Carolina, using the year-end examination as the
measure of student achievement and looked at whether advanced degree, teaching experience,
quality of undergraduate institution, licensure type, and score on licensure examination affected
student achievement. While teaching experience, competitiveness of undergraduate institution,
licensure type, and score on licensure examination all seemed to have an effect on student
achievement, the graduate degree status did not (Clotfelter et al., 2007). In the study, Clotfelter
et al. (2007) determined that if the graduate degree is sought after 5 years of teaching, there tends
to be a negative effect on student achievement. Similar results were found by Clotfelter et al.
(2012), except in this later study, they found a small positive coefficient of .004 that is
significant at the 10% level in their regression analysis. This study was also conducted using
North Carolina end-of-course content examinations. In this later study, Clotfelter et al. (2012)
also found a negative effect with teachers that possess a Ph.D., but it is important to note the
small sample size. Graziano (2012) confirmed that “faculty mobility and MA + are statistically
significant predictors for HSPA performance (F change= 6.968; df = 2.236; and p <.001)” (p.
140). Graziano (2012) further reported that schools tend to perform better when there are more
teachers with advanced degrees.
Faculty attendance. There is limited research on the relationship between faculty
attendance and student achievement, but from the research that exists, there is a relationship. In
a study conducted by Clotfelter et al. (2007) conducted a longitudinal study of students in North
Carolina and “were able to control for time-invariant skill and effort levels of teachers and
provided causal evidence that teacher absences negatively affect student achievement” (p. 184).

42
Miller (2012) highlighted the recent focus on teacher absenteeism. The Civil Rights Data
Collection is a report collected on the national level and the 2012 school year was the first time
that teacher absenteeism was collected a part of the submission. Miller pointed out the cost of
teacher attendance as a scarce resource and emphasized its importance: “Teachers are the most
important school-based determinant of a students’ academic success. It’s no surprise researchers
find that teacher absence lowers student achievement” (p. 1).
This report was a follow-up to a study by Miller, Murnane, and Willet (2007), in which
they examined a large urban school district to look at teacher absence and mathematics and ELA
student achievement on year-end tests. The comparison showed that 10 days of absence by
teachers can reduce achievement 3.3% of a standard deviation. The achievement differences had
a negative relationship on both the math and ELA sections, but the disparities were greater in
terms of mathematics (Miller et al., 2007).
A study conducted by Tingle et al. (2012) in an urban school district in the Southwestern
United States produced mixed results on the relationship between teacher absences and student
achievement. This study resulted from a question by the accountability office and the school
board and utilized both school-level and teacher-level data to predict student achievement.
Interestingly, Tingle et al. found that in schools where teacher absences were low, there was a
negative relationship between teacher absences and student achievement. However, where
teacher absences were identified as high, there was no relationship between the two variables or
a “wash-out” occurred (Tingle et al., 2012).
Conclusion
Data are often not published at the district level and, therefore, there are no seminal
works on how the percentage of certain line-item school budgets relate to student achievement.

43
Electronic standardized testing is on the rise with PARCC examination, so it is crucial to look at
the percentage of money being spent on technology infrastructure and its relationship, if any, to
student achievement on these new, online, high-stakes tests.
Since the publication of the Coleman Report (Coleman et al., 1966), there has been
extensive conflicting literature on whether school budgets really matter in relationship to student
achievement. Extensive literature shows that other factors controlled for in the present study do
influence student achievement, including socioeconomic status, special education status, ELL
status, student attendance, faculty attendance, and percentage of faculty with advanced degrees.
Therefore, by controlling for these factors, this study will add to the current literature on school
finance and technology’s influence on student achievement.
44
CHAPTER 3
METHODOLOGY
I conducted a quantitative research study to explain the possible relationship between
student, staff, and school district variables on student achievement and used New Jersey school
districts’ administration information technology budget as a percentage of the overall total
undistributed expense funds as a variable of interest. Due to the limited lack of existing
quantitative research on technology school finance and student achievement, I explored the
administration information technology budget as percentage of overall undistributed expense
funds to K-12 and PK-12 districts’ student achievement in New Jersey school districts. This was
measured by the results from the PARCC exam grades for the 2016–2017 school year in ELA
and mathematics. This study adds to the existing literature providing policymakers and
administrators with data they need to help better understand the nature of the relationship
between school district spending on technology infrastructure and student achievement.
Organization of the Chapter
The chapter is organized starting with the purpose of the study, followed by discussion of
the research questions. The second half of this chapter encompasses the research design,
including discussion of the sample, variables, and data collection. Finally, the chapter concludes
with a discussion of the reliability and validity of the study and the data analysis procedures.
Purpose of the Study
The purpose of this study was to explain the influence, if any, of the percentage of
districts’ administrative information technology budgets on a New Jersey K-12 or PK-12
district’s student achievement in mathematics and ELA as measured by the 2016–2017 scores on
the PARCC examination. I also included the amount of variance that could be explained by

45
administration information technology budgets when controlling for additional factors that
influence student achievement, such as the school district’s percentage of special education,
percentage of ELL students, student attendance, faculty attendance, percentage of faculty with
advanced degrees, district size, and percentage of students on free and reduced lunch. The
results of the study may help policy makers and administrators identify appropriate
administration information technology budgets for maintaining student achievement on the
PARCC, save district resources by eliminating unnecessarily high administration information
technology budgets, and/or increasing technology budgets to increase student achievement on the
PARCC.
Research Questions
Research Question 1: What is the nature of the relationship between a New Jersey K-12 or PK-
12 school district’s administration information technology budget in relation to the
overall undistributed expenditures budget on the percentage of students who perform at a
Level 4 (L4) or Level 5 (L5) on the 2016–2017 English Language Arts (ELA)
Partnership for Assessment of Readiness for College and Careers (PARCC) examination
when controlling for district, student, and staff variables?
Research Question 2: What is the nature of the relationship between a New Jersey K-12 or PK-
12 school district’s administration information technology budget in relation to the
overall undistributed expenditures budget on the percentage of students who perform at a
Level 4 (L4) or Level 5 (L5) on the 2016–2017 Mathematics Partnership for Assessment
of Readiness for College and Careers (PARCC) examination when controlling for
district, student, and staff variables?

46
Null Hypotheses
Null Hypothesis 1: No statistically significant relationship exists between a New Jersey K-12 or
PK-12 school district's percentage of the administration information technology budget in
relation to the overall undistributed funds budget on the percentage of students who
perform at a Level 4 (L4) or level 5 (L5) on the 2016–2017 English Language Arts
(ELA) Partnership for Assessment of Readiness for College and Careers (PARCC)
examination when controlling for staff, student, and district variables.
Null Hypothesis 2: No statistically significant relationship exists between a New Jersey K-12 or
PK-12 school district’s percentage of the administration information technology budget
in relation to the overall undistributed funds budget on the percentage of students who
perform at a Level 4 (L4) or Level 5 (L5) on the 2016–2017 Mathematics Partnership for
Assessment of Readiness for College and Careers (PARCC) examination when
controlling for staff, student, and district variables.
Research Design
I used a quantitative, nonexperimental, correlational, cross-sectional, explanatory
research design to explain the relationship that potentially exists between a New Jersey K-12 or
PK-12 school district’s administration information technology budget as a percentage of the
overall undistributed funds budget and student achievement on the ELA and mathematics
sections of the 2016 PARCC examination.
I first used simultaneous multiple regression to explain the influence of the independent
variable on the dependent variables. This was used to determine the overall impact of the
variables. Based on the results of the simultaneous multiple regression models, I developed
hierarchical regression models and used them to determine if the variable of interest, percent of

47
administrative information technology budget, adds value to explaining the relationship between
all of the predictor variables and the outcome variable of 2016–2017 PARCC scores (Leech,
Barrett, & Morgan, 2011). I used the following student variables: overall percentage of special
education students in the district, overall percentage of ELLs in the district, overall percentage of
student chronic absenteeism for the district, and the overall percentage of students on free and
reduced lunch in the district. I also used the following staff variables: overall staff attendance
rate and percentage of teachers with advanced degrees for the district. Finally, the following
district variables were utilized in the study: district size determined by overall enrollment,
administration information technology annual budget as percentage of overall undistributed
expenditure annual budget, and the percentage of students receiving an L4 or L5 on both the
mathematics or ELA portions of the 2016–2017 PARCC examination. These scores identify
students who have met or exceeded expectations on both the mathematics and ELA portions of
the 2016–2017 PARCC. I was able to determine the strength and significance of the relationship
between the variables through the use of simultaneous multiple regression and hierarchical
multiple regression analyses.
Sample Population and Data Source
The sample for this study consisted of all public K-12 and PK-12 school districts within
20 of the 21 counties of New Jersey. None of the districts listed in Salem County were classified
as either PK-12 or K-12, so they were excluded from the study. Table 2 shows the breakdown
with number of districts from each county.

48
Table 2
Number of Districts by County in New Jersey Utilized in Present Study as Calculated by Peter
Lutchko
County Number of districts
Atlantic 5
Bergen 30
Burlington 8
Camden 11
Cape May 2
Cumberland 3
Essex 15
Gloucester 6
Hudson 9
Hunterdon 1
Mercer 9
Middlesex 17
Monmouth 12
Morris 13
Ocean 8
Passaic 7
Somerset 8
Sussex 1
Union 11
Warren 2
Grand total 178
The study excluded school districts that maintained magnet schools, vocational schools,
charter schools, and special education schools. The school districts that were included in the
sample met the following criteria:
• The school districts were classified as public.

49
• The schools were classified as either a K-12 or PK-12 district.
• The school districts reported all testing, budget, and demographic information to the
NJDOE.
The number of school districts that had complete data for each subject for K-12 and PK-12
districts included the following:
• Mathematics (n = 178)
• ELA (n = 178)
The rationale for the PK-12 and K-12 district selection was that these district types
encapsulate all grades that would take the PARCC examination in the 2016–2017 school year.
Any district serving schools Grades 3–11 must take the PARCC exam. The enrollment in the
districts ranged from 738 to 40,802 students served.
Data Collection
The data for this study were retrieved from the NJDOE’s (2017a, 2017d) website. The
2016–2017 District Performance Report Excel spreadsheet was downloaded and saved in a data
file. Data from all public K-12 and PK-12 school districts that tested students in Grades 3–11 on
the PARCC examination were used in this study. The Excel file from the NJ School
Performance Reports and budget file for the 2017–2018 school year obtained from (NJDOE,
2017d) and imported into Microsoft Access. The 2017–2018 file was used because the revised
2016–2017 budget is included in this file, which is the same year as the testing data. Queries
were designed to create a table using identified variables, and this table was then exported into
Excel. Various sorting options served to remove data that did not meet the study criteria.
Districts that had incomplete or missing data were also removed from the study. The remaining

50
districts were organized in Microsoft Excel alphabetically. The data retrieved from the NJDOE
and utilized in the Excel spreadsheet using the variables and descriptors shown in Table 3.
Table 3
Variables and Descriptors as Created and Determined by Peter Lutchko
Data element Level of measurement Definition
County code Nominal Unique code used by state to
determine which county a school
district is in
District name Nominal The formal district name
Grade span Nominal The grades served by each district
District code Nominal Unique code used by state to
determine specific district
Faculty attendance Ratio The percentage of days that faculty
were marked present during the
school year
Percentage of faculty with
a master’s degree
Ratio Percentage of faculty that hold a
master’s degree from an accredited
university
Percentage of faculty with
a doctoral degree
Ratio Percentage of faculty that hold a
doctoral degree from an accredited
university
Combined percentage of
faculty with master’s
degree or higher
Ratio Manually combined column of
total faculty with master’s and
doctoral degrees
Overall district enrollment Ratio Total number of students served in
a district
Percentage of students
eligible for ELL services
Ratio Percentage of students eligible to
receive ELL support
Percentage of students
with disabilities
Ratio Percentage of students served by
an IEP
Percentage of students
labeled economically
disadvantaged
Ratio Percentage of students receiving
free and reduced lunch in a district
(continued)

51
Table 3 (continued)
Data element Level of measurement Definition
Percentage of students
marked chronically absent
Ratio Percentage of students marked
chronically absent, determined by
ESSA as a student missing more
than 10% of the days enrolled in a
district
Percentage of students
receiving an L4 or L5 of
meeting or exceeding
standards on the PARCC
examination in ELA
literacy
Ratio Percentage of students that
received either an L4 or L5 on the
ELA portion of the PARCC
examination in 2016–2017 testing
year
Percentage of students
receiving an L4 or L5 of
meeting or exceeding
standards on the PARCC
examination in
mathematics
Ratio Percentage of students that
received either an L4 or L5 on the
Mathematics portion of the
PARCC Examination in 2016–
2017 testing year
Undistributed expenditure
budget total
Ratio The total funds allocated to the
undistributed expenditure funds
budget. These are funds that are
not readily assignable to a specific
program.
Undistributed
administrative information
technology budget
Ratio A specific undistributed account
that is a support services account
and includes administration of
supervision of technology
personnel, systems planning and
analysis, systems application
development, systems operations,
network support services,
hardware maintenance and
support, and other technology
related administrative costs.
Undistributed
administrative information
technology budget as a
percentage of the overall
undistributed expenditure
budget total
Ratio This is a manually manipulated
field that covers the administrative
information technology budget as a
percentage of the overall
undistributed expenditure budget.

52
The overall percentage of faculty with a master’s degree or higher was determined by
combining the columns of faculty with master’s degrees and doctoral degrees. This was done in
Excel by creating a formula for the sum of the percentages of the two columns.
The percentage of administrative technology and overall undistributed expense budgets
for the districts were added to the spreadsheet and percentage was calculated. This was
calculated by taking the administrative information technology budget and dividing it by the
overall undistributed expense budget and then taking the value and turning it into a percent. One
column represented the total undistributed expenditure budget, one represented the undistributed
administrative information technology budget, and the third represented a formula of the
administrative information technology budget column divided by the total undistributed
expenditure budget. The values in the third column were then converted to a percent in Excel
(see Appendix for spreadsheet layout). The data were retrieved from the NJDOE (2017a) for the
2016–2017 school year.
Dependent Variables
The percentage of students that were rated as meeting or exceeding expectations on the
2016–2017 PARCC examination in ELA and mathematics were the dependent variables. The
PARCC examination is used to evaluate students in both the areas of ELA and mathematics.
There is a 5-point scoring system, including L1 (not yet meeting expectations), L2 (partially
meeting expectations), L3 (approaching expectations), L4 (meeting expectations), and L5
(exceeding expectations). In order for a student to get an L1, he or she must score between 650–
700, L2 is 700–725, L3 is 725–750, L4 is 750–810, and L5 is 810–850. Each content area or
subject matter has performance level indicators (PLIS) that determine where a student must be to
make each cutoff. Those scoring below an L4 are considered not on track for their grade and

53
may require additional help to meet standards. The test is aligned with the federal Common
Core standards (PARCC, 2018b).
The test serves various uses. In New Jersey, it is used to meet high school graduation
pathway requirements. By the high school graduation class of 2021, the only pathway to
graduation will be to pass the PARCC ELA Grade 10 and PARCC Algebra I. The only other
option will be to do a portfolio appeal that is only available if all required PARCC exams have
been taken (NJDOE, 2018). The tests can also be used to identify districts, schools, or students
that need remedial help.
Reliability and Validity
Every year following the administration of the PARCC examination, Pearson releases the
technical report on the reliability and validity of the previous year’s examination. The test was
created, scored, and dispersed (most electronically) by Pearson. Pearson has conducted several
studies in addition to the technical report to ensure reliability and validity. This includes a field
test during test development, automated scoring research studies, accessibility studies,
benchmarking studies (to ensure their performance level descriptors were on target), device
comparability (tablet, laptop, desktop), quality of items, and cognitive complexity studies
(PARCC, n.d.).
The PARCC (2018a) Technical Report for the 2016–2017 administration of the PARCC
examination was published in March 2018. To ensure reliability, Pearson published stratified
reliability alpha rather than the more common Cronbach’s reliability coefficient because the
PARCC examination is a mixed-method type including dichotomous and polytomous items. The
reliability score will range from 0 to 1, with 1 indicating the most reliable test or indicating a
student’s likelihood to achieve the same score under similar testing situations. For computer-

54
based administration of the ELA PARCC test for Grades 3–11, the reliability alpha ranged from
.962 to .970. For the paper-based administration, the scores ranged from .958 to .970. The
standard error of measurement (SEM) ranges from 8.394 to 11.773 for computer-based testing
and between 8.064 and 11.838 for paper-based administration.
In terms of mathematics the average reliability alpha ranges from .919 to .943 for
computer-based testing and .909 and .944 for paper-based assessments in Grades 3–11. For high
school assessments, the range is .923 to .942 for computer-based assessments and .927 to .943
for paper-based assessments. In terms of SEM, there was a range of 9.590 to 13.466 for
computer-based administration and 9.716 to 14.460 for paper-based administration in Grades 3–
11. For high school assessments, the scale score ranges for SEM were 9.855 to 14.479 for
computer-based administration and 9.787 to 15.160 for paper-based administration.
The PARCC Technical Report (2018a) affirmed that construct validity is obtained
through the internal test design by including hundreds of educators in the test and item design.
The federal Common Core standards are used as a measure to determine item inclusion. There
are also several studies, such as the one discussed below, that confirm the test’s validity.
Doorey and Polikoff (2016) compared the ACT Aspire test, PARCC, Smarter Balanced,
and the Massachusetts Comprehensive Assessment System to check for the quality, reliability,
and validity of these standardized tests. In the areas of ELA content and depth they claimed
PARCC has an excellent match and for mathematics content and depth, PARCC received a good
match (Doorey & Polikoff, 2016). The scale ranged from excellent match, good match,
limited/uneven match, to weak match. Doorey and Polikoff stated, “PARCC and Smarter
Balanced are a better match on the CCSSO criteria, which is not surprising, given they were both
developed with common core in mind” (p. 3). Doorey and Polikoff also noted that in developing

55
a test there will be tradeoffs, but that the PARCC does a good job at measuring what it is
supposed to measure.
Standardized tests that have high-impact decisions such as the PARCC examination do
not go without criticism. Tienken (2008) stated,
The technical characteristics for the test results and the inherent social justice issues
cannot justify the possible negative consequences attached to their use in a high-stakes
manner. The confluence of sub-domain reliability estimates, relationships between
District Factor Group and student test results, and sizeable standard error of measurement
creates a conundrum for educators. (p. 58)
The tests continues to be supported by New Jersey bureaucrats through its continued use and by
Pearson through its multiple studies and publications on the test, including the PARCC (2018a)
2017 Technical Report, as a valid and reliable measure of student achievement.
Data Analysis
The sample sizes necessary to achieve statistical significance of the regression models
were calculated based on being able to identify a p value at the .05 significance level and an
effect size of at least 0.50. The strength and direction of the relationships between independent
and dependent variables were determined by using the standardized beta in the models. For the
simultaneous multiple regression models and hierarchical regression models, I used the formula
that Field (2013) suggested to determine the required sample sizes to then determine statistical
significance. The formula is 104 + k, where k represents the number of predictor variables.
There were seven predictor variables utilized in this study. The minimum predictor variables
were 104 + 7 = 113 for enough statistical power to utilize the 95% confidence level and at least
.50 effect size.
Six districts were dropped from the study due to not submitting the variable of interest
(i.e., the administrative information technology budget) to the NJDOE. The overall sample size
came to a total of N= 172.

56
Conclusion
By using the hierarchical regression model, I was able to successfully answer the research
questions and determine the influence, if any, that the percentage of the undistributed
expenditures has on PARCC examination scores. I checked this regression model against both
the ELA and mathematics sections of the PARCC examination to fully answer all research
questions.
Chapter 4 includes interpretation of these results based on the regression model.
Significance was based on the .05 significance level to determine if the variable of interest—
percentage of undistributed expenditures—has a significant effect on PARCC examination
scores. The percentage of the influence of undistributed expenditures on student achievement
were also determined while controlling for the other district, staff, and student variables.
Finally, Chapter 5 includes recommendations for policy, practice, and future research
based on these interpretations.

57
CHAPTER 4
ANALYSIS OF THE DATA
My reason for conducting this cross-sectional, correlational, explanatory study was to
explain the relationship between the percentage of the overall expenditure account to the overall
undistributed expenditure account on the total percentage of students who met or exceeded
expectations on the PARCC examination in both ELA and mathematics in New Jersey K-12 and
K-12 school districts during the 2016–2017 school year.
The chapter is organized into three primary parts: (a) the procedures for collecting the
data, (b) a review and report of all the descriptive statistics of the sample, and (c) the results of
the statistical analyses based on each research questions posed. Lastly, this chapter concludes
with a brief section articulating the results in a succinct manner to answer each research question.
Procedure
The first step of the data analysis process was to analyze the descriptive statistics of all
variables. For the variable of interest, the percent of the administrative information technology
budget as percent of the undistributed expenditure budget and the proportion of the overall
undistributed expenditure accounts was utilized as the metric of choice for this analysis. The
undistributed accounts are budget accounts that are not readily assignable to a specific program.
The administrative information technology budget is one of these budget line items.
Subsequently, the following steps were performed for each subject area of the PARCC
examination to potentially identify the significant independent variables and their strength of
influence. The first step was to run a simultaneous multiple regression that included all
independent variables to determine which, if any, of the independent variables were statistically
significant predictors. During this step, it was identified in all simultaneous models that the ELL

58
variable created multicollinearity issues and was dropped from the models. The regression
models indicated that a strong relationship existed between the variable ELL (Ell) and
socioeconomic status (freereduce), which could be potentially creating multicollinearity issues in
the models. Since the relationship was strong, ELL could be considered a relative proxy variable
for socioeconomic status and possibly obfuscate the regression analyses. Consequently, the
prudent and practical solution was to drop ELL from the models. Subsequently, the
simultaneous regression analyses were run again, excluding the variable ELL.
From the results of the initial regression analysis, hierarchical regression models were
formed. All significant p values were included in order of significance in each hierarchical
model and the variable of interest was added last to determine if the variable of interest provided
for a “value-added” effect. Based on the results from the hierarchical model the following
statistics were noted and interpreted:
1. The overall statistical significance from the ANOVA table.
2. The R2 and the R2 changes were used to find out which variables contribute most to
the overall variance of the outcome–dependent variable. These are displayed in the
model summary tables throughout this chapter.
3. The Durbin-Watson statistic was noted from the model summary tables to check for
autocorrelation between the variables in the regression analysis to confirm the
assumption that the residuals are not correlated. A Durbin-Watson value between 1
and 3 indicates that the assumption has been met for that specific regression analysis
(Field, 2013).
4. The partial correlation values were noted from the coefficients table, paying close
attention to the statistically significant coefficients.

59
5. The collinearity statistics including tolerance and variance inflation (VIF) from the
coefficients table were also provided for each analysis. VIF is defined as the variance
inflation factor and determines the severity of multicollinearity between variables in a
multiple regression analysis. Tolerance is another statistic that is used for the
detection of multi-collinearity between variables in regression analysis (Leech et al.,
2011).
Descriptive Statistics
The unit of analysis for this study was school district. The means and SDs for the
dependent and independent variables used in the regression analyses were calculated and are
reported below. The mean percentage of students who achieved meeting (L4) or exceeding
expectations (L5) was approximately 49% with an SD of approximately 7.2. The mean
percentage of students who qualified for free or reduced lunch was 34.2. The mean enrollment
was 5,181 and mean of the administrative budget to overall undistributed expenditure budget was
1.46%. The percentage for students with disabilities was around 16% and for chronic
absenteeism, 9.6%. The percentage of faculty with advanced degrees combined was about 44%
and faculty attendance was about 96% days present. The full table of descriptive statistics is
listed in Table 4.

60
Table 4
Descriptive Statistics Table for Overall Population
Variable Sample N Mean Median SD
Disabilities 172 16.30 16.35 3.24
Ell 172 5.61 3.30 6.01
chronicabsent 171 9.62 8.40 5.31
Enrollment 172 5180.72 3627.00 5255.22
freereduce 171 34.12 28.30 25.92
Facultyattend 170 96.23 96.70 1.86
advdegreecombine 172 44.35 44.50 14.48
ELA 172 49.06 49.00 7.21
MATH 172 49.7209 50.0000 7.45399
Peradminsinfotech 172 .0146 .0100 .00926
Note. Ell = ELL; chronicabsent = chronically absent; freereduce = free or reduced lunch;
Facultyattend = faculty attendance; advdegreecombine = faculty with advanced degree
combined; peradminsinfotech = percentage of administration information technology budget.
Research Question 1
The first research question was as follows:
What is the nature of the relationship between a New Jersey K-12 school district’s
administration information technology budget in relation to the overall undistributed
expenditures budget on the percentage of students who perform at a Level 4 (L4) or
Level 5 (L5) on the 2016–2017 English Language Arts (ELA) Partnership for
Assessment of Readiness for College and Careers (PARCC) examination when
controlling for district, student, and staff variables?
The sections that follow include the process used to answer Research Question 1.

61
Simultaneous Multiple Regression: ELA
I ran the first simultaneous regression model with all the predictor variables included.
The model summary for the initial simultaneous regression run is shown in Tables 5 and 6. The
ANOVA results table indicated that the regression was statistically significant (F (7,160) =
8.755, p =.001) and that the R2 squared for this regression model is .277. This indicates that
27.7% of the outcome variable of PARCC ELA is explained by the variables in the regression
model.
Table 5
ELA Model Summary
Model summarya
Model R R2 Adjusted R2 Std. error of the estimate Durbin-Watson
1 .526b .277 .245 6.23676 1.661
Note. aDependent variable: ELA. bPredictors: (Constant), advdegreecombine (faculty with
advanced degree combined), enrollment, peradminsinfotech (percentage of administration
information technology budget), disabilities, facultyattend (faculty attendance), chronicabsent
(chronically absent), freereduce (free or reduced lunch).
Table 6
English Language Arts ANOVA Table
ANOVAa
Model
Sum of
squares df Mean square F Sig.
1 Regression 2383.849 7 340.550 8.755 .000b
Residual 6223.556 160 38.897
Total 8607.405 167
Note. aDependent variable: ELA. bPredictors: (Constant), advdegreecombine (advanced degree
combined), enrollment, peradminsinfotech (percentage of administration information technology
budget), disabilities, facultyattend (faculty attendance), chronicabsent (chronically absent),
freereduce (free or reduced lunch).

62
The coefficients table (see Table 7) showed that the statistically significant variables in
the regression were chronic absenteeism, faculty with advanced degree combined, and
enrollment. For chronic absenteeism (t = -3.967, p < .001, β = -.362) the partial correlation value
(-.299) indicates that it explains 8.9% of the overall variance of the model. Since the relationship
is negative, it indicates that as the rate of chronic absenteeism increases, the level of performance
on the PARCC ELA decreases. For percentage of faculty with advanced degrees (t = 2.909, p <
.001, β = .223) the partial correlation value of .224 indicates that 5% of the overall variance in
the model can be explained by the percentage of faculty with advanced degrees. Furthermore,
the relationship is positive, which indicates that as the percentage of faculty increases, so does
the performance on the PARCC ELA. Finally, for enrollment size (t = 2.644, p < .001, β = .204)
the partial correlation value of .205 indicates that 4.2% of the overall variance in the regression
model can be explained by enrollment. The β is positive, which indicates that as enrollment
numbers in a school district increase, so does performance on the PARCC ELA. The variable of
interest—the percentage of administrative information technology budget to overall
undistributed expenditure budget—was not significant (t = -.460, p = .646, β = -.032). Although
not significant, this demonstrates that the relationship is negative; as percentage of administrative
information technology budget increases, performance on the PARCC ELA decreases. Finally,
the partial correlation value of -.036 indicates that < 1% (.13) of the overall model can be
explained by the percentage of administrative information technology budget.

63
Table 7
English Language Arts Coefficients Table
Coefficientsa
Model
Unstandardized
coefficients
Standardized
Coefficients . Correlations
Collinearity
statistics
aB
Std.
Error Beta t Sig
Zero-
order Partial Part Tolerance VIF
1 (Constant) 33.516 28.014 1.196 .233
disabilities -.167 .158 -.076 -1.061 .290 -.133 -.084 -.071 .884 1.131
freereduce -.008 .026 -.027 -.295 .768 -.271 -.023 -.020 .521 1.918
enrollment .000 .000 .204 2.644 .009 .076 .205 .178 .757 1.320
chronicabsent -.490 .123 -.362 -3.967 .000 -.412 -.299 -.267 .541 1.847
facultyattend .180 .286 .046 .631 .529 .195 .050 .042 .843 1.186
peradminsinf
otech
-24.780 53.827 -.032 -.460 .646 .003 -.036 -.031 .933 1.072
advdegreeco
mbine
.111 .038 .223 2.909 .004 .384 .224 .196 .771 1.297
Note. freereduce = free or reduced lunch; chronicabsent = chronically absent; facultyattend = faculty attendance;
peradminsinfotech = percentage of administration information technology budget; advdegreecombine = faculty with
advanced degree combined. aDependent Variable: ELA.
Hierarchical Linear Regression: ELA
Based on the results of the initial simultaneous regression as reported in Table 7, a
hierarchical linear regression model was developed. The statistically significant variables
identified in the initial simultaneous regression were entered into the model in steps or blocks
with chronic absenteeism entered first, followed next by advanced degrees combined, and third
was enrollment size. I used both the significance value and the partial correlation coefficient to
determine the model order. The most significant variable was added first, followed by the
second, and the third. The variable of interest, or percent of administrative information
technology budget, was added last to see if the variable added any value to the overall model.
The variables of faculty attendance, free and reduced lunch status, and students with disabilities

64
were excluded from the model because they were not significant and had a p value of greater
than .05.
Table 8 shows the model summary for the hierarchical linear regression models. Model 1
only uses chronic absenteeism as it was the most significant variable in the simultaneous
multiple regression, with an R2 of .157. This means that chronic absenteeism explains 15.7% of
the overall model. The significant F change is < .000. In Model 2, I added the second most
significant variable of percentage of faculty with advanced degrees, with an R2 change of .072.
This means that an additional 7.2% of the outcome variable of the PARCC ELA can be taken
into account when percentage of faculty with advanced degrees is added to the model. There
was an F change from Model 1 to Model 2. The significant F change for both models is .000,
indicating that including the additional variable was significant.
In Model 3, I added the last significant variable from the simultaneous multiple
regression of enrollment size. There was an R2 change of .039, meaning an additional 3.9% of
the outcome variable of the PARCC ELA can be explained by taking into account enrollment
numbers. The significant F change from Model 2 to Model 3 is .003. In Model 4, I added the
variable of interest of the percentage of administrative information technology budget to overall
undistributed budget and found no R2 change. This suggests that the variable of interest adds
nothing to explaining the variance in the outcome variable of the PARCC ELA. There is no
significant F change when moving from Model 3 to Model 4 (.812). This indicates that Model 3
is the model of best fit because there is no R2 change from the Model 3 to Model 4 when the
variable of interest is added. Additionally, the significant F change value does not indicate
statistical significance. The Durbin-Watson value of 1.688 demonstrates no auto-correlation
between the variables within the regression analysis (Field, 2013).

65
Table 8
ELA Hierarchical Regression Model Summary Table
Model summarya
Model R R2 Adjusted R2
Std. error of
the estimate
Change statistics
Durbin-
Watson R2 change F change df1 df2
Sig. F
change
1 .396b .157 .152 6.61653 .157 31.399 1 169 .000
2 .479c .229 .220 6.34534 .072 15.754 1 168 .000
3 .517d .268 .255 6.20229 .039 8.839 1 167 .003
4 .518e .268 .250 6.21988 .000 .057 1 166 .812 1.688
Note. aDependent variable: ELA. bPredictors: (Constant), chronicabsent (chronically absent). cPredictors:
(Constant), chronicabsent (chronically absent), advdegreecombine (faculty advanced degree combined). dPredictors: (Constant), chronicabsent (chronically absent), advdegreecombine (faculty advanced degree
combined), enrollment. ePredictors: (Constant), chronicabsent (chronically absent), advdegreecombine (faculty
advanced degree combined),enrollment, peradminsinfotech (percentage of administrative information technology
budget).
The ANOVA results table indicates that all models were statistically significant for this
hierarchical regression. Table 9 includes these results.

66
Table 9
ELA ANOVA Results Table
ANOVAa
Model Sum of squares df Mean square F Sig.
1 Regression 1374.594 1 1374.594 31.399 .000b
Residual 7398.567 169 43.779
Total 8773.161 170
2 Regression 2008.922 2 1004.461 24.947 .000c
Residual 6764.239 168 40.263
Total 8773.161 170
3 Regression 2348.945 3 782.982 20.354 .000d
Residual 6424.216 167 38.468
Total 8773.161 170
4 Regression 2351.130 4 587.783 15.193 .000e
Residual 6422.030 166 38.687
Total 8773.161 170
Note. aDependent variable: ELA. bPredictors: (Constant), chronicabsent (chronically absent). cPredictors:
(Constant), chronicabsent (chronically absent), advdegreecombine (faculty advanced degree combined). dPredictors:
(Constant), chronicabsent (chronically absent), advdegreecombine (faculty advanced degree combined), enrollment. ePredictors: (Constant), chronicabsent (chronically absent), advdegreecombine (faculty advanced degree combined)
enrollment, peradminsinfotech (percentage of administrative information technology budget).
The coefficients table indicates the significant variables from each of the models (see
Table 10). In Model 4, chronic absenteeism, percentage of faculty with advanced degrees, and
enrollment were all significant, but percentage of administrative information technology budget
to overall budget was not. The variable of interest was not statistically significant (t = -.238, p =
.812, β = -.016) and contributed very little (.03%), if anything, to the overall model.
Consequently, it can be concluded that Model 3 is the best predictive model of the PARCC ELA
performance. This demonstrated that these variables all had a significant relationship with the
ELA portion of the PARCC examination. Their partial correlation coefficients reveal the impact
they had on the dependent variable of PARCC ELA scores. Chronic absenteeism had a strong
negative relationship with the PARCC ELA scores and explained 12.3% of variance of the

67
model. The negative relationship indicates that as chronic absenteeism in the district increases,
the PARCC ELA performance decreases. The next variable of percentage of faculty with
advanced degrees had a partial correlation value of .277 and explained 7.7% of the overall
variance of the model. The positive beta indicates that as the percentage of faculty with
advanced degrees increases, so does student performance on the PARCC ELA exam.
Enrollment size had a partial correlation coefficient of .224 and explained 5% of the variance of
the model. The positive relationship indicates that as enrollment numbers increase, so does
performance on the PARCC ELA examination.
Table 10
ELA Hierarchical Regression Coefficients
Coefficientsa
Model
Unstandardized
coefficients
Standardized
coefficients
t Sig.
Correlations
Collinearity
statistics
B Std. error ß
Zero-
order Partial Part Tolerance VIF
1 (Constant) 54.274 1.050 51.679 .000
chronicabsent -.536 .096 -.396 -5.603 .000 -.396 -.396 -.396 1.000 1.000
2 (Constant) 46.560 2.189 21.272 .000
chronicabsent -.393 .099 -.290 -3.988 .000 -.396 -.294 -.270 .866 1.154
advdegreecombine .143 .036 .289 3.969 .000 .395 .293 .269 .866 1.154
3 (Constant) 46.577 2.140 21.770 .000
chronicabsent -.497 .103 -.367 -4.851 .000 -.396 -.351 -.321 .765 1.307
advdegreecombine .132 .035 .266 3.719 .000 .395 .277 .246 .856 1.168
enrollment .000 .000 .210 2.973 .003 .082 .224 .197 .882 1.133
4 (Constant) 46.778 2.306 20.288 .000
chronicabsent -.499 .103 -.369 -4.841 .000 -.396 -.352 -.321 .760 1.315
advdegreecombine .131 .036 .265 3.687 .000 .395 .275 .245 .853 1.172
enrollment .000 .000 .213 2.951 .004 .082 .223 .196 .846 1.183
peradminsinfotech -12.570 52.882 -.016 -.238 .812 .011 -.018 -.016 .957 1.045
Note. chronicabsent = chronically absent; advdegreecombine = faculty advanced degree combined;
peradminsinfotech = percentage of administrative information technology budget. aDependent variable: ELA.

68
Table 10 shows that none of the models or variables had a VIF greater than 2, so it can be
assumed there are no multicollinearity issues. Tolerances are also all within a value that is less
than 1 - R2.
Research Question 2
The second research question was as follows:
What is the nature of the relationship between a New Jersey K-12 school district's
Administration Information Technology budget in relation to the overall undistributed
expenditures budget to the percentage of students who perform at a Level 4 or Level 5 on
the 2016-2017 Mathematics Partnership for Assessment of Readiness for College and
Careers (PARCC) examination when controlling for district, student, and staff variables?
The sections that follow include the process used to answer Research Question 2.
Simultaneous Multiple Regression: Mathematics
I ran the first simultaneous multiple regression model with all the predictor variables
included. The model summary for the initial simultaneous regression is shown in Tables 11 and
12. The ANOVA results table indicated that the regression was statistically significant (F
(7,160) = 6.852, p = .001) and that the R2 square for this regression model is .231. This indicates
that 23.1% of the outcome variable of the PARCC Mathematics is explained by the variables in
the regression model.
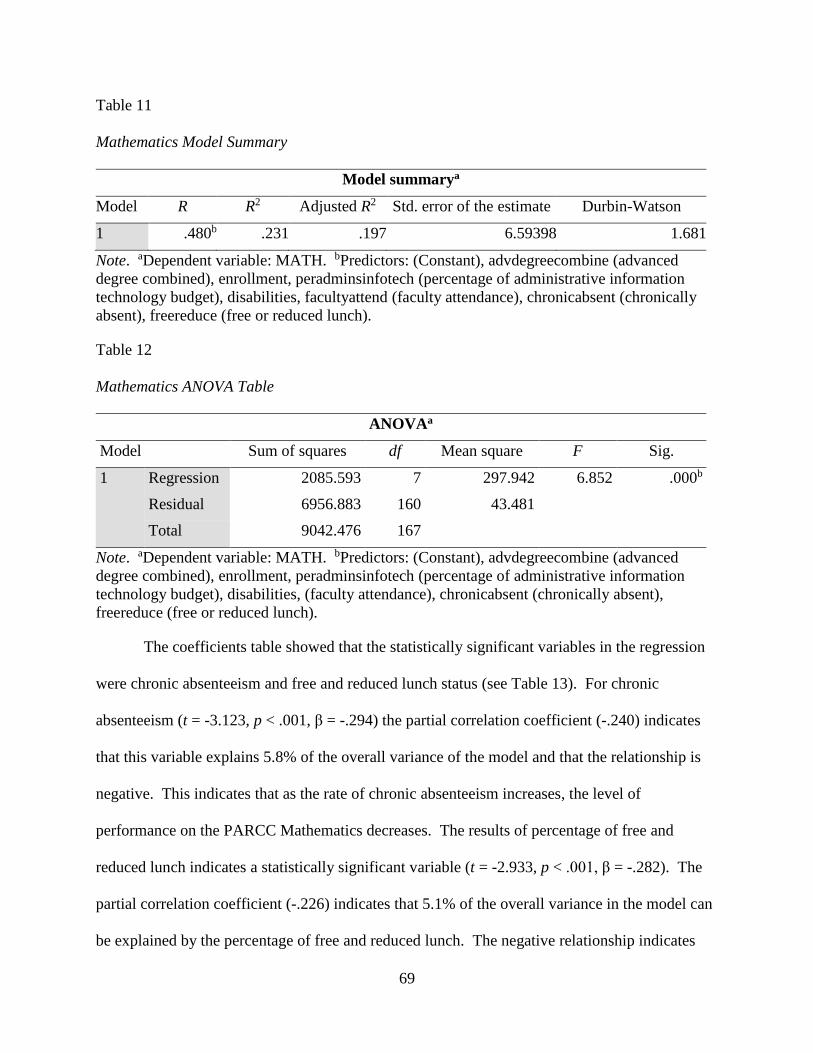
69
Table 11
Mathematics Model Summary
Model summarya
Model R R2 Adjusted R2 Std. error of the estimate Durbin-Watson
1 .480b .231 .197 6.59398 1.681
Note. aDependent variable: MATH. bPredictors: (Constant), advdegreecombine (advanced
degree combined), enrollment, peradminsinfotech (percentage of administrative information
technology budget), disabilities, facultyattend (faculty attendance), chronicabsent (chronically
absent), freereduce (free or reduced lunch).
Table 12
Mathematics ANOVA Table
ANOVAa
Model Sum of squares df Mean square F Sig.
1 Regression 2085.593 7 297.942 6.852 .000b
Residual 6956.883 160 43.481
Total 9042.476 167
Note. aDependent variable: MATH. bPredictors: (Constant), advdegreecombine (advanced
degree combined), enrollment, peradminsinfotech (percentage of administrative information
technology budget), disabilities, (faculty attendance), chronicabsent (chronically absent),
freereduce (free or reduced lunch).
The coefficients table showed that the statistically significant variables in the regression
were chronic absenteeism and free and reduced lunch status (see Table 13). For chronic
absenteeism (t = -3.123, p < .001, β = -.294) the partial correlation coefficient (-.240) indicates
that this variable explains 5.8% of the overall variance of the model and that the relationship is
negative. This indicates that as the rate of chronic absenteeism increases, the level of
performance on the PARCC Mathematics decreases. The results of percentage of free and
reduced lunch indicates a statistically significant variable (t = -2.933, p < .001, β = -.282). The
partial correlation coefficient (-.226) indicates that 5.1% of the overall variance in the model can
be explained by the percentage of free and reduced lunch. The negative relationship indicates
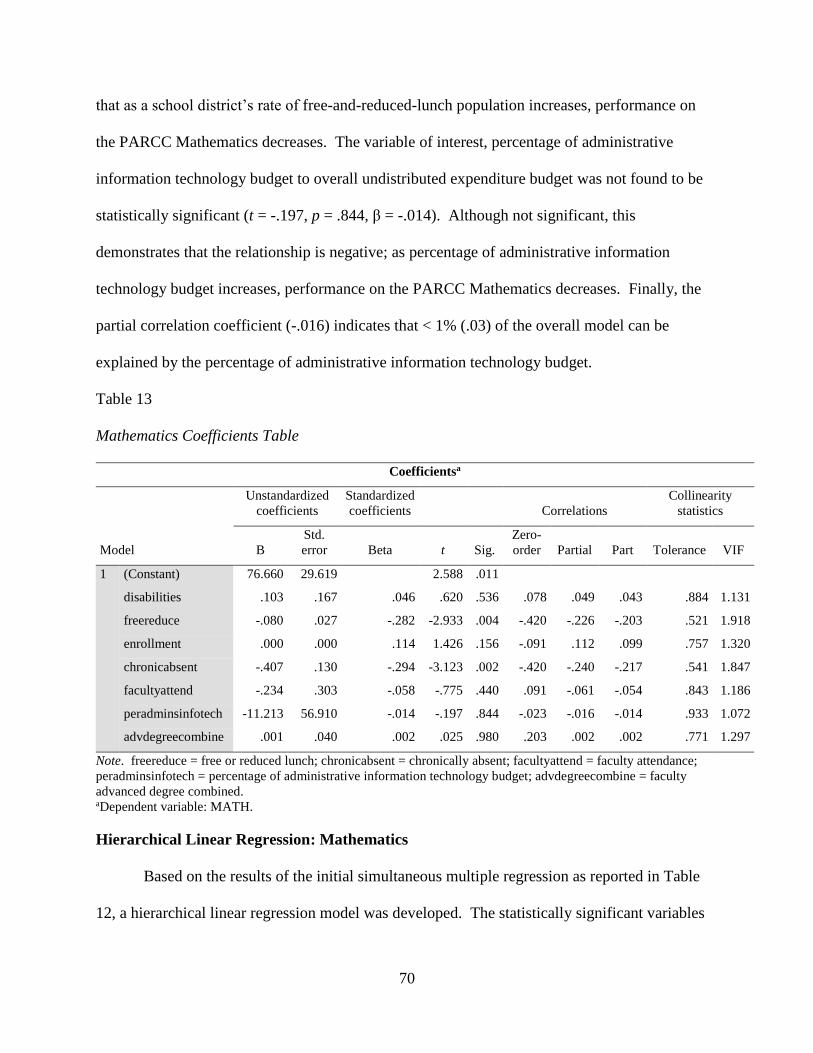
70
that as a school district’s rate of free-and-reduced-lunch population increases, performance on
the PARCC Mathematics decreases. The variable of interest, percentage of administrative
information technology budget to overall undistributed expenditure budget was not found to be
statistically significant (t = -.197, p = .844, β = -.014). Although not significant, this
demonstrates that the relationship is negative; as percentage of administrative information
technology budget increases, performance on the PARCC Mathematics decreases. Finally, the
partial correlation coefficient (-.016) indicates that < 1% (.03) of the overall model can be
explained by the percentage of administrative information technology budget.
Table 13
Mathematics Coefficients Table
Coefficientsa
Model
Unstandardized
coefficients
Standardized
coefficients Correlations
Collinearity
statistics
B
Std.
error Beta t Sig.
Zero-
order Partial Part Tolerance VIF
1 (Constant) 76.660 29.619 2.588 .011
disabilities .103 .167 .046 .620 .536 .078 .049 .043 .884 1.131
freereduce -.080 .027 -.282 -2.933 .004 -.420 -.226 -.203 .521 1.918
enrollment .000 .000 .114 1.426 .156 -.091 .112 .099 .757 1.320
chronicabsent -.407 .130 -.294 -3.123 .002 -.420 -.240 -.217 .541 1.847
facultyattend -.234 .303 -.058 -.775 .440 .091 -.061 -.054 .843 1.186
peradminsinfotech -11.213 56.910 -.014 -.197 .844 -.023 -.016 -.014 .933 1.072
advdegreecombine .001 .040 .002 .025 .980 .203 .002 .002 .771 1.297
Note. freereduce = free or reduced lunch; chronicabsent = chronically absent; facultyattend = faculty attendance;
peradminsinfotech = percentage of administrative information technology budget; advdegreecombine = faculty
advanced degree combined. aDependent variable: MATH.
Hierarchical Linear Regression: Mathematics
Based on the results of the initial simultaneous multiple regression as reported in Table
12, a hierarchical linear regression model was developed. The statistically significant variables

71
identified in the initial simultaneous regression were entered into the model in steps or blocks
with chronic absenteeism entered first, followed by free and reduced lunch status. I used both
the significance value and the standardized beta to determine the model order. The strongest
variable was added first, followed by the second. The variable of interest—percent of
administrative information technology budget—was added last to see if the variable added any
value to the overall model. The variables of faculty attendance, enrollment, percentage of
faculty with advanced degrees, free and reduced lunch status, and students with disabilities were
excluded from the model because they were not significant and had p values of greater than .05.
Table 14 shows the model summary for the hierarchical linear regression models. Model
1 only utilized chronic absenteeism as it was the most significant variable in the simultaneous
multiple regression with an R2 of .171. This means that chronic absenteeism explains 17.1% of
the overall model. The significant F change is =.000. In Model 2, I added the second most
significant variable, percentage of free and reduced lunch status. There was an R2 change of
.044. This means that an additional 4.4% of the outcome variable of the PARCC Mathematics
can be explained when percentage of free and reduced lunch status is added to the model. The
significant F change from Model 1 to Model 2 is .003. In Model 3, I added the variable of
interest of the percentage of administrative information technology budget to overall
undistributed budget and found no R2 change. This suggests that the variable of interest adds
nothing to explaining the outcome variable of the PARCC Mathematics. Since the significant F
change from Model 2 to Model 3 is .989, it can be concluded that Model 2 is the model of best
fit because there is no R2 change from the Model 2 to Model 3 and the added variable is not
statistically significant. The Durbin-Watson value of 1.721 confirms that there is no auto-
correlation between the variables within the regression analysis (Field, 2013).

72
Table 14
Mathematics Hierarchical Regression Model Summary
Model summarya
Model R R2 Adjusted R2
Std. error of
the estimate
Change statistics
Durbin-
Watson R2 change
F
change df1 df2
Sig. F
change
1 .413b .171 .166 6.69190 .171 34.577 1 168 .000
2 .464c .215 .205 6.53059 .044 9.402 1 167 .003
3 .464d .215 .201 6.55022 .000 .000 1 166 .989 1.721
aDependent variable: MATH. bPredictors: (Constant), chronicabsent (chronically absent). cPredictors: (Constant),
chronicabsent (chronically absent), freereduce (free or reduced lunch). dPredictors: (Constant), chronicabsent
(chronically absent), freereduce (free or reduced lunch), peradminsinfotech (percentage of administrative
information technology budget).
The ANOVA results table indicates that all models were statistically significant for this
hierarchical regression (see Table 15).
Table 15
Mathematics ANOVA Results Table
ANOVAa
Model Sum of Squares df Mean Square F Sig.
1 Regression 1548.413 1 1548.413 34.577 .000b
Residual 7523.287 168 44.781
Total 9071.700 169
2 Regression 1949.391 2 974.696 22.854 .000c
Residual 7122.309 167 42.649
Total 9071.700 169
3 Regression 1949.399 3 649.800 15.145 .000d
Residual 7122.301 166 42.905
Total 9071.700 169
Note. aDependent variable: MATH. bPredictors: (Constant), chronicabsent (chronically absent). cPredictors:
(Constant), chronicabsent (chronically absent), freereduce (free or reduced lunch). dPredictors: (Constant),
chronicabsent (chronically absent), freereduce (free or reduced lunch), peradminsinfotech (percentage of
administrative information technology budget).
The coefficients table indicates the significant variables from each of the models (see
Table 16). In Model 3, chronic absenteeism and percentage of free and reduced lunch were both
significant, but percentage of administrative information technology budget to overall

73
undistributed expenditure budget was not. The variable of interest was not statistically
significant (t = -.014, p = .989, β = -.001) and contributed very little (.0001%), if anything, to the
overall model. Consequently, it can be concluded that Model 2 is the best predictive model of
the PARCC Mathematics performance. This demonstrated that these variables all had a
significant relationship with the Mathematics portion of the PARCC examination. Their
standardized betas reveal the impact they had on the dependent variable of Mathematics PARCC
scores. Chronic absenteeism had a strong negative relationship with the PARCC Mathematics
scores, explaining 4.5% of variance of the model. The negative relationship indicates that as
chronic absenteeism in the district increases, the PARCC Mathematics performance decreases.
The second variable of percentage of free and reduced lunch had a partial correlation coefficient
of -.231 and explained 5.3% of the variance of the model. The negative beta indicates that as the
percentage of free and reduced lunch increases, performance on the PARCC Mathematics
examination decreases.

74
Table 16
Mathematics Coefficients and VIF Table
Coefficientsa
Model
Unstandardized
coefficients
Standardized
coefficients Correlations
Collinearity
statistics
B Std. error ß t Sig.
Zero-
order Partial Part Tolerance VIF
1 (Constant) 55.298 1.067 51.848 .000
chronicabsent -.570 .097 -.413 -5.880 .000 -.413 -.413 -.413 1.000 1.000
2 (Constant) 55.648 1.047 53.145 .000
chronicabsent -.338 .121 -.245 -2.786 .006 -.413 -.211 -.191 .609 1.642
freereduce -.076 .025 -.269 -3.066 .003 -.422 -.231 -.210 .609 1.642
3 (Constant) 55.659 1.310 42.495 .000
chronicabsent -.338 .122 -.245 -2.776 .006 -.413 -.211 -.191 .608 1.644
freereduce -.076 .025 -.269 -3.048 .003 -.422 -.230 -.210 .606 1.650
peradminsinfotech -.744 54.670 -.001 -.014 .989 -.020 -.001 -.001 .995 1.005
Note. chronicabsent = chronically absent; freereduce = free or reduced lunch; peradminsinfotech = percentage of
administrative information technology budget.
a. Dependent variable: MATH.
Table 16 shows that none of the models or variables had a VIF greater than 2, so it may be
assumed there are no multicollinearity issues. Tolerances are also all within a value that is less
than 1 - R2.
Conclusion
I conducted the analysis of both the ELA and Mathematics portions of the PARCC exam
on the percentage of administrative information technology budget to overall undistributed
expenditure budget for K-12 and PK-12 school districts when controlling for district, student,
and staff variables in New Jersey during the 2016–2017 school year. Both a simultaneous
multiple regression and hierarchical regression model were run in each subject area. The
variable of interest proved to not be significant in either subject area. Furthermore, in both
subject areas, the variable did not add any value to the overall models when the hierarchical

75
regression models were run based on the results of the simultaneous multiple regression. A more
in-depth discussion of these results as they relate to previous research done on the topic, policy
and practice, and future research is included in Chapter 5.

76
CHAPTER 5
CONCLUSION AND RECOMMENDATIONS
Organization of the Chapter
This chapter begins with an introduction to highlight the purpose of the study and a
discussion of the research questions with null hypotheses as well as answers to the research
questions. The second part of the chapter includes the conclusions and findings of the study and
how they relate to previously reviewed literature. Also included are recommendations for
policy, practice, and future research, followed by a short conclusion.
Earlier in the study, I highlighted finance as a limited resource that must be maximized in
order to produce results. One of these results or educational outputs is student achievement as
identified by results of the PARCC in ELA and mathematics in the 2016–2017 school year.
Another important educational input, specifically, is administrative technology infrastructure that
is budgeted for in the administrative information technology budget. Based on the study results,
I found that the percentage of this budget to the overall undistributed expenditures budget does
not have an impact on student achievement. However, I did identify other variables that were
significant in predicting student achievement, which reinforces previous literature.
Technology is embedded in the life of everyone today. Whether it be computers, lap
tops, tablets, smart phones, e-readers, or educational technology, today’s students encounter
technology almost every day. New Jersey places an emphasis on technology through the state
curriculum standards and numerous grants that were highlighted earlier in Chapter 2 of this study
such as the Future Ready Schools grant and the Talent 21 grant. Federal initiatives such as the
NCLB, the ARRA, and the ESSA placed a heavy emphasis on technology and its budget. The
PARCC examination is the high-stakes standardized test administered in New Jersey. It is a test

77
that is primarily administered online. In point of fact, in 2015, its first year of implementation,
98% of the examination was administered online in New Jersey (Heyboer, 2015). Its online
administration sometimes requires districts to increase not only their hardware, but also their
technology infrastructure in order to meet system requirements for administering the PARCC
examination. The results of this study served to determine that the percentage of the
administrative information technology budget to overall undistributed expenditure budget has no
significant relationship with the PARCC ELA or Mathematics examination performance in K-12
or PK-12 New Jersey school districts during the 2016–2017 school year.
Purpose of the Study
The purpose of this study was to explain the influence, if any, of the percentage of
district’s administrative information technology budgets on New Jersey K-12 districts’ student
achievement in mathematics and ELA as measured by the 2016–2017 PARCC examination. I
also examined the amount of variance that could be explained by administration information
technology budgets when controlling for additional factors that influence student achievement,
such as the school district’s percentage of special education students, student attendance, and
percentage of students on free and reduced lunch. This study adds to the body of research
literature on school finance and technology, specific to New Jersey K-12 and PK-12 school
districts, and their relationship to student achievement. This study also lays the groundwork for
future studies in this area.
Research Questions and Answers
This was a nonexperimental, cross-sectional, explanatory study using quantitative
research design methods to determine the influence of district, faculty, and student variables on

78
student performance in PK-12 and K-12 school districts on the PARCC ELA and Mathematics
examinations. The overarching research question for this study was as follows:
What is the nature of the relationship between a New Jersey K-12 school district’s the
administration information technology budget in relation to the overall budget on the
percentage of students who perform at a Level 4 (l4) or Level 5 (L5) on the 2016–2017
Partnership for Assessment of Readiness for College and Careers (PARCC) examination
when controlling for district, student, and staff variables?
Two simultaneous multiple regressions were run for both the ELA and Mathematics
portion of the PARCC exam. The results indicated that the administrative information
technology budget as a proportion of the overall undistributed expenditure account was not a
significant variable in either content areas in PK-12 and K-12 New Jersey school districts. It was
also determined that no significant relationship was found between the proportion of the
administrative information technology budget and PK-12 and K-12 school districts PARCC
exams when controlling for student, district, and staff variables.
Research Question 1
What is the nature of the relationship between a New Jersey K-12 school district’s
administration information technology budget in relation to the overall undistributed
expenditures budget on the percentage of students who perform at a Level 4 (L4) or Level 5 (L5)
on the 2016–2017 English Language Arts (ELA) Partnership for Assessment of Readiness for
College and Careers (PARCC) examination when controlling for district, student, and staff
variables?

79
Null Hypothesis 1
No statistically significant relationship exists between a New Jersey PK-12 or K-12
school district’s percentage of the administration information technology budget in relation to the
overall budget on the percentage of students who perform at a Level 4 (L4) or Level 5 (L5) on
the 2016–2017 English Language Arts (ELA) Partnership for Assessment of Readiness for
College and Careers (PARCC) examination when controlling for staff, student, and district
variables.
Research Question 1: Answer
Based on the simultaneous and hierarchical regression analyses of the data, the null
hypothesis was retained. It was determined that no statistically significant relationship exists
between the proportion of the administrative information technology budget and total
undistributed expenditure budget on PK-12 and K-12 New Jersey ELA PARCC scores when
controlling for district, faculty and staff, and student variables.
Simultaneous multiple regression was conducted by entering all seven predictor variables
into the model. Using this model, the R2 value was .277, indicating that 27.7% of the variability
in district performance on the 2016–2017 PARCC ELA exam can be explained by the overall
model. Further analysis of the model indicated that of the seven variables, three predictor
variables were determined to be significant. By examining and squaring the standardized beta, it
was determined that the rate of chronic absenteeism was the strongest statistically significant
predictor of student achievement that accounted for 13.1% of the district performance on the
2016–2017 PARCC ELA portion of the examination. The next strongest statistically significant
variable was percentage of faculty with advanced degrees. This had a standardized beta of .223
which explained roughly 5% of the explained variance of student performance on the PARCC

80
ELA portion on the 2016–2017 examination. The final significant variable, district enrollment,
had a standardized beta of .204 which explained 4.2% of the explained variance of student
performance on the PARCC ELA portion of the 2016–2017 examination. The administrative
information technology budget as a proportion of the overall undistributed expenditure account,
the variable of interest in this study, was not a statistically significant predictor variable of
student achievement on the PARCC ELA portion of the 2016–2017 exam for PK-12 and K-12
New Jersey school districts (p > .646).
Using the three significant predictor variables identified in the simultaneous multiple
regression, in addition to the variable of interest, a 4-step hierarchical regression model was used
to identify specific contributors to the explained variance of the significant predictors. The
hierarchical regression reinforced what was found in the initial simultaneous multiple regression
and, therefore, for this research question, the null hypothesis is retained.
Research Question 2
What is the nature of the relationship between a New Jersey K-12 school district’s
administration information technology budget in relation to the overall undistributed
expenditures budget on the percentage of students who perform at a Level 4 (L4) or level 5 (L5)
on the 2016–2017 Mathematics Partnership for Assessment of Readiness for College and Careers
(PARCC) examination when controlling for district, student, and staff variables?
Null Hypothesis 2
No statistically significant relationship exists between a New Jersey PK-12 or K-12
school district’s percentage of the administration information technology budget in relation to the
overall budget on the percentage of students who perform at a Level 4 (L4) or Level 5 (L5) on

81
the 2016–2017 Mathematics Partnership for Assessment of Readiness for College and Careers
(PARCC) examination when controlling for staff, student, and district variables.
Research Question 2: Answer
Based on the simultaneous and hierarchical regression analyses of the data, the null
hypothesis was retained. It was determined that no statistically significant relationship exists
between the proportion of the administrative information technology budget and total
undistributed expenditure budget on PK-12 and K-12 New Jersey PARCC Mathematics
examination scores when controlling for district, faculty and staff, and student variables.
Simultaneous multiple regression was conducted by entering all seven predictor variables
into the model. Using this model, the R2 value was .231, indicating that 23.1% of the variability
in district performance on the 2016–2017 PARCC Mathematics examination can be explained by
the overall model. Further analysis of the model indicated that of the seven variables, two
predictor variables were significant. By examining and squaring the standardized beta, it was
determined that the rate of chronic absenteeism was the strongest statistically significant
predictor of student achievement and accounted for 8.6% of the district performance on the
2016–2017 PARCC Mathematics portion of the examination. The second and least significant
variable was socioeconomic status. This had a standardized beta of -.282, which accounted for
roughly 8% of the explained variance of student performance on the PARCC Mathematics
portion of the 2016–2017 examination. The administrative information technology budget as a
proportion of the overall undistributed expenditure account, the variable of interest in this study,
was not a statistically significant predictor variable of student achievement on the PARCC
Mathematics portion of the 2016–2017 examination for PK-12 and K-12 New Jersey school
districts (p > .844).

82
Using the two significant predictor variables identified in the simultaneous multiple
regression, in addition to the variable of interest, a 3-step hierarchical regression model was used
to identify specific contributors to the explained variance of the significant predictors. The
hierarchical regression reinforced what was found in the initial simultaneous multiple regression
and, therefore, for this research question, the null hypothesis is retained.
Conclusions and Discussion
This study provides evidence that a strong positive relationship does not exist between
the percentage of the administrative information technology budget and the percentage of
students meeting or exceeding expectations on the PARCC exam in New Jersey K-12 or PK-12
school districts. The study presented the opportunity for differences on PARCC passing
percentages to be displayed, specifically in terms of the percentage of the administrative
information technology budget as a percentage of the overall undistributed expenditure accounts.
For both ELA and mathematics for K-12 and PK-12 school districts, the percentage of the
administrative information technology budget was not a statistically significant variable in
explaining the overall variance in PARRC scores and evidence provided by this study seems to
indicate a weak relationship between the variables. Due to the extremely limited literature on
this topic, it is difficult to relate the findings here or contextualize them to previous and similar
studies. In order to do this, one would have to look to the broader topic of school finance as a
general topic and its relationship to student achievement.
For the ELA variable, advanced degree combined was the strongest predictor, followed
by student chronic absenteeism, and then student enrollment. However, the percentage of the
administrative information technology budget was not a significant contributor to the regression
models and it did not add value to predicting the PARCC scores on the ELA portion of the

83
examination. Interestingly, socioeconomic status, determined to be pivotal in Coleman et al.’s
(1966) study as well as in subsequent studies, was not a significant predictor variable in this
current study. The percentage of the administrative information technology budget not being
significant does confirm the claims of Coleman et al. and supporters such as Hanushek (1989,
1997, 2016; Hanushek & Benson, 1994) that school finance does not matter when other
determinants of student achievement are considered. Coleman et al. did indicate that
socioeconomic status was the biggest contributor to student achievement, which was not the case
in the present study either. Enrollment numbers, although significant for the PARCC ELA
examination, indicated an interesting trend. The relationship is positive, both in the initial
simultaneous multiple regression and in the hierarchical regression best fit model. This shows
that as enrollment numbers increase in schools, so do scores on the PARCC ELA examination.
This contradicts much of the research suggesting that smaller schools lead to better student
performance (Alspaugh, 1998; Ready, Lee, & Welner, 2004).
For the PARCC Mathematics examination, there were two significant variables:
socioeconomic status and chronic absenteeism. Again, the percentage of the administrative
information technology budget was not a significant contributor to the initial simultaneous
multiple regression nor did it add any value to predicting achievement on the PARCC
Mathematics examination when added to the hierarchical model. This reinforces the work of
Coleman et al. (1966) and subsequent researchers in terms of socioeconomic status being a
significant indicator of student achievement. It is interesting that socioeconomic status still had a
lower significance value than chronic absenteeism did in terms of predicting outcome on the
PARCC Mathematics examination. These were the only two significant variables identified in
the present study. More recently, Hanushek (2016) posited that money can matter if there are

84
guidelines and direction. School budgets are strictly regulated, and it seems that neither budget
nor its level of regulation had an influence in either subject area in the present study with respect
to the budget area analyzed.
There is limited research in the area of specific technology line item budgets and its
impact on student achievement. There has been conflicting research in terms of school finance
as a whole and its subsequent influence or impact on student achievement. This study adds to
the body of literature initially posed by Coleman et al. (1966), Hanushek (1989, 1997, 2016;
Hanushek & Benson, 1994), Chung (2013), and other researchers who proposed that school
finance does not influence student achievement when other significant predictor variables are
controlled for. The present study conflicts with the findings of James et al. (2011), Cullen et al.
(2015), Hedges et al. (1994), and Greenwald et al. (1996a, 1996b). James et al. (2011) found
that certain predictor expenditure categories, such as improvement of instructional services, did
significantly influence student achievement. In a longitudinal study, Cullen et al. (2015) found
the same results in terms of instructional spending. Finally, in a meta-analysis of school district
level or smaller, Hedges et al. (1994) and Greenwald et al. (1996b) found significant positive
relationships and few negative relationships when looking at expenditures and high-stakes tests
in the prior studies they analyzed. Newly published district-level data and specific publicly
available data regarding district budgets has made the present study possible. This newly
available data will certainly prompt further research studies in this area of school finance as more
questions are raised over the scrutiny of high-stakes testing continues.
Recommendations for Policy
In order to address the policy issues determined from the present study, lawmakers need
to focus on the issues that were highlighted both in the literature review presented earlier and

85
again in the results of the study. Variables identified through the substantial literature review
that were determined to be predictors of student achievement are percentage of faculty with
advanced degrees, faculty attendance, students with disabilities, socioeconomic status, student
attendance, ELL status, and district size. Of these variables, the following variables were
identified as significant in the study and therefore should be addressed by policymakers:
combating chronic absenteeism, recruiting faculty with advanced degrees or encouraging pursuit
of them, and confronting socioeconomic status.
Chronic absenteeism was determined to be a significant predictor variable in both ELA
and mathematics. There are several programs or steps policy makers can take to combat
absenteeism. According to Adelman and Taylor, “Students who attend school between 85 and
100 percent of the time pass state tests at much higher rates than students who attend less than 85
percent of the time, according to the Center for Mental Health at UCLA” (as cited in Duke,
Sterrett, & Carr, 2013, p. 220). Duke et al. (2013) recommended several strategies for
combatting chronic absenteeism, with most of them revolving around student, parent, and
community involvement. Duke et al. (2013) also suggested the current common trend to use
truant officers and enforce policy are not working to combat student absenteeism.
One way that school districts can maintain communication with parents is by allowing
parents to report an absence and schools contacting parents whenever a child is absent. This
approach creates an open line of communication and helps discourage student truancy. Although
it can be costly, there are automated systems that will help with the costs of this type of
communication. Duke et al. (2013) recommended expanding on counseling services, providing
academic support to avoid students falling behind on coursework, providing social supports
through community involvement or peer-to-peer mentoring, expanding extracurricular and sports

86
activities, building transitional programs between grade levels; and identifying special needs,
including home instruction for injured or ill students or students who need to be outside a regular
school setting. These programs can all be very costly, but will help students stay engaged in the
classroom environment. Policymakers need to provide grants and additional monies to be
allocated to funding these types of programs.
Recruiting highly qualified faculty with advanced degrees can also be costly, but was
determined as a significant determining variable of PARCC ELA examination scores. In New
Jersey, 55.3% of teacher’s salaries come from the local government, 40.9% from the state
government, and 3.8% from the federal government (Chang, 2018). If the federal government
placed an emphasis on grants to recruit and retain highly educated educators, especially in areas
where performance is lower on the PARCC examination, there might be improvements on the
scores (Clotfelter et al., 2007; Graziano, 2012). The positive relationship indicates the higher the
percentage of teachers with master’s or doctoral degrees in a district, the higher the scores will
be on the PARCC ELA examination. Policymakers can take away salary caps for
superintendents that discourage teachers from pursuing advanced degrees. In addition, they can
provide additional funding to districts based on the percentage of faculty that hold advanced
degrees.
The last significant variable was in the PARCC Mathematics portion of the test and it
was socioeconomic status. The negative relationship indicated by the standardized beta indicates
that as the percentage of free-and-reduced-lunch students in a school district increases, the
performance on the PARCC Mathematics examination decreases district-wide. Coleman et al.
(1966) produced the first widespread report that indicated the importance of socioeconomic
status in terms of student achievement above all else. Many researchers, as previously

87
highlighted in the literature review, have come to reinforce and support Coleman et al.’s
conclusions (De Luca & Hinshaw, 2013; Hanushek 1989, 1997; Hanushek & Benson, 1994).
According to Coleman et al., “Finally, it appears that a pupil’s achievement is strongly related to
the educational backgrounds and aspirations of the other students in the school” (p. 22). Steps
must be taken to balance the disparities and create a positive school culture for all students.
Lawmakers need to do more to support these families. They can create zoning laws that
decrease the income disparities between districts by combining districts or creating inclusionary
zoning programs. In these types of programs, a certain percentage of homes are sold below
market value to encourage less fortunate families to move in.
They can also do more to assist families with everyday living expenses such as housing,
quality child care, and early child education. The disparities between rich and poor is
highlighted by the following statement:
Children from middle and upper-class environments who enter pre-school at age 4 have
heard approximately 45 million words compared to a child from a family on welfare who
has heard only 16 million words during his first four years of life. Hart and Risely (1995)
coined the difference between the language exposure of rich and poor children ‘the 30-
million-word gap.’” (Tienken, 2012, p. 4)
Early childhood education programs that are funded at all governmental levels will help fix this
gap or, at the very least, lessen it.
Recommendations for Practice
School leaders need to be able to address those needs that are most important to their
school community. The literature review in Chapter 2 included details about some of the known
variables that influence student achievement. This study provides further support for some of
those variables.
The PARCC Mathematics examination hierarchical regression analysis model of best fit
showed socioeconomic status as a significant variable influencing test scores. There are several

88
steps school leaders can take to identify and support this population of students. First is making
sure school districts are reaching out to these families and ensuring that students in need are
identified. Once the population is identified, then promoting after-school activities, community
involvement, and fostering smaller class sizes can help battle some of the negative impacts of
being a part of this population (Gottfried, 2009). There should be steps within the district to
identify populations struggling to meet basic needs at home that may not know support is
available. There also may be people that may barely meet state and federal cut-offs for
classification as low socioeconomic status, but may still require added support. After-school
activities can be held to ensure that certain needs, such as homework help, additional meals, or
other everyday needs are guaranteed to be met. Fostering community relationships through food
drives and fundraisers can also provide additional support to these families. Finally, linking
these families to other community programs that can provide financial support in times of need
can also provide added relief and alleviate stress for these families. For example, many
communities have organizations that will pay all or part of a monthly bill or expense during
times of documented financial hardship. Schools can support these organizations and link these
families to these organizations. This will provide extra relief to families and allow them to meet
other day-to-day needs.
Chronic absenteeism is a variable that was indicated in the best-fit models for the
hierarchical regression in both ELA and mathematics. “Missed educational time in school may
lead to poor grades and further absenteeism, leading to a vicious cycle that is a major concern of
all educators” (Parke & Kanyongo, 2012, p. 1). Community and school engagement initiated by
the school district will foster relationships that lead the student to be less likely to miss school.
Engagement can be gained by offering before- and after-school programs, after-school activities,

89
volunteer opportunities, and by the school reaching out to local businesses and organizations and
keeping them involved in the school. Businesses and organizations can be involved by being
invited to school events, offering fundraising opportunities, and allowing the businesses to use
school facilities. Smaller class sizes or teams can create support groups that will leave the
student feeling less isolated. Groups that may be more sensitive to missing school, such as
transfer students, kindergarten students, students entering middle or high school for the first time,
pregnant teens, socially isolated students, academically struggling students, students with low
socioeconomic status, and students with language barriers should be identified and provided the
extra support and guidance that they require (Duke et al., 2013). An administrator can do this by
setting up action plans for identification of at-risk students, providing counseling, and creating
appropriate follow-up action plans.
Another step to combat absenteeism that goes hand-in-hand with community engagement
is parent support and participation. Programs can be run by the school to ensure Internet access,
open lines of communication, and include parent nights and workshops in which parents can
keep up with the challenging coursework their students may be facing. Many of the systems
offered today to communicate with parents, display coursework, and grades are through the
Internet and computers. School districts should offer Internet or a place where parents can go to
access the Internet.
Low socioeconomic status and absenteeism both require support from the school
counselors. Counselors can help identify families that have these individual, yet often
interrelated, issues. After identification, it is critical that counselors come up with the
appropriate plan to tackle the unique student’s situation on a case-by-case basis. No two
students’ situations are going to be identical and that is when the counselor would assist. The

90
administration needs to make sure that the programs and staff are in place with the counselors
overseeing the execution of those plans.
Finally, in terms of the PARCC ELA, percentage of faculty with advanced degrees was
identified as a significant predictor variable in the hierarchical regression model of best fit.
School districts must be able to recruit and retain highly qualified and educated faculty. To
ensure this, the school can make sure it works cooperatively with the union and create a positive
relationship that benefits both the school and the faculty. The contract should allow for more
flexibility or professional development. Beyond that, schools can allow for a competitive tuition
reimbursement program that encourages faculty to continue their education. The school district
can set up many opportunities for professional development.
Staying competitive in terms of salaries offered is also an effective way to attract highly
educated staff. This would require school leaders to stay on top of what comparable positions
are being paid in similar districts. The school district needs to be more lenient, flexible, and fair
to make sure that these elements are negotiated for in the collective bargaining agreements with
the union, given that prior research determines it significant predictors in terms of student
achievement. Finally, offering competitive health and other benefits will attract a highly
educated staff. These suggestions were also iterated in both Graziano (2012) and Clotfelter et al.
(2012.
The initial theory guiding theory of input/output in this current study relates directly to
the implications for both policy and practice. The four variables identified as significant through
the regressions all represent what is put into schools. Combating chronic absenteeism involves a
strong staff to continue communication and set up programs to keep students involves. Teachers
with advanced degrees requires recruiting and maintaining a highly qualified staff into schools.

91
Free and reduced lunch requires staff to identify and support students that are economically
disadvantaged both through programs and funding. Finally, enrollment is defined by the number
of students in a district, school, and class. Adjusting the inputs affected by these significant
variables may influence, for the better, the output measure of student achievement.
Recommendations for Future Research
This study was conducted to look at the influence of the percentage of the administrative
information technology budget as a percentage of the overall undistributed expenditure budgets
for the 2016–2017 school year on the PARCC ELA and PARCC Mathematics scores in PK-12
and K-12 New Jersey school districts. To build upon the conclusions of this study, it is
important that future studies expand upon this topic with some of the suggested areas of research
listed below:
• Replicate this study in another state, using PARCC or another reliable and valid
measure of student achievement.
• Replicate this study on the national level.
• Use school building, rather than district, as the unit of analysis when designing the
study.
• Use total operating budget, rather than the undistributed accounts, to determine the
percent of administrative information technology budget when designing the study.
• Design a study to examine the difference in the amount spent on administrative
information and various school or school district socioeconomic statuses.
• Design a study that looks at different budget items or programs and their influence on
student achievement. This may be related to a specific program initiated or
technology hardware.

92
• Design a study to include examination of science standardized test scores as the
dependent variable and budgetary impacts.
Conclusions
Continued research and improvements in the education world will bring about positive
change for all students. It is important that policymakers, bureaucrats, and practitioners alike
pay attention to current research to stay abreast of potential implications. In this study, I found
that there is no statistically significant impact on the PARCC ELA or PARCC Mathematics
examinations in PK-12 and K-12 New Jersey School districts based on the percentage of money
budgeted for administrative technology from the overall undistributed expenditure accounts
budget. There was no added value to predicting PARCC assessment results when the percentage
of administrative information technology budget was added to the hierarchical models and the
significant variables were considered. Another take-away from this study is that variables that
were controlled for do have a significant impact. These variables are chronic absenteeism,
percentage of teachers with advanced degrees, and enrollment size in the PARCC ELA
examination and chronic absenteeism and socioeconomic status in the PARCC Mathematics
examination.
High-stakes tests such as PARCC are being pushed to be administered online with
limited paper administration options, causing districts to react to meet the system requirements of
this test. This can be a more cost-effective measure at the state level, but often has implications
for the district in terms of test administration. This often leads the district to inflate their already
high-technology budgets to meet the demands of the test. This study suggests that there is little
to no impact based on the percentage of money spent in New Jersey. This study highlights the

93
variables that have continuously come up in the literature as significant in determining student
achievement, continue to do so.
There has been little research in terms of specific technology budgets and their impact on
student achievement. Due to new data collected by the NJDOE, at the district and state levels,
this study was possible. The study provides specific insight for a specific point in time for the
relationship between school finance and student achievement. This study and newly available
data opens the door for this area to be examined and researched further.
“A well-educated mind will always have more questions than answers.”
-Helen Keller

94
REFERENCES
Alspaugh, J. W. (1998). The relationship of school-to-school transitions and school size to high
school dropout rates. The High School Journal, 81(3), 154. Retrieved from https://search-
proquest-com.ezproxy.shu.edu/docview/220218464?accountid=13793
American Recovery and Reinvestment Act (ARRA) of 2009, Pub. L. No. 111-5, 123 Stat. 115,
516 (2009).
Beggs, J. (2018, March 16). Learn about the production function in economics and its features.
Retrieved from https://www.thoughtco.com/the-production-function-overview-1146826
Brimley, V., Garfield, R. R., & Verstegen, D. A. (2012). Financing education in a climate of
change. Boston, MA: Pearson Education.
Chang, A. (2018, March 9). Your state’s teachers are underpaid. Find out by how much.
Retrieved from https://www.vox.com/policy-and-politics/2018/3/9/17100404/teacher-
pay-salary-underpaid-database
Chung, I. H. (2013). Education finance reform, education spending, and student performance
evidence from Maryland’s Bridge to Excellence in Public Schools Act. Education and
Urban Society, 47(4), 412–432. doi:10.1177/0013124513498413
Clark, A. (2016, March 29). N.J. one of just a few states still using PARCC tests in 2016.
Retrieved from
http://www.nj.com/education/2016/03/which_other_states_are_using_parcc_tests_this_ye
ar.html
Clotfelter, C. T., Ladd, H. F., & Vigdor, J. L. (2007). How and why do teacher credentials
matter for student achievement? (Working Paper 2., Revised). Cambridge, MA: National
Center for Analysis of Longitudinal Data in Education Research. Retrieved from
http://www.nber.org/papers/w12828
Clotfelter, C. T., Ladd, H. F., & Vigdor, J. L. (2010). Teacher credentials and student
achievement in high school: A cross-subject analysis with student fixed effects. Journal
of Human Resources, 45(3), 655–681.
Clotfelter, C. T., Ladd, H. F., & Vigdor, J. L. (2012). New destinations, new trajectories? The
educational progress of Hispanic youth in North Carolina. Child Development, (5), 1608.
Coleman, J. S., Campbell, E. Q., Hobson, C. J., McPartland, J., Mood, A. M., Weinfeld, F. D., &
York, R. L. (1966). Equality of educational opportunity. Washington, DC: National
Center for Education Statistics. Retrieved from https://files.eric.ed.gov/fulltext/
ED012275.pdf
Cullen, M., Polnick, B., Robles-Piña, R., & Slate, J. R. (2015). Instructional expenditures and
student achievement: A multiyear statewide analysis. Educational Research for Policy
95
and Practice, 14(2), 93–117. doi:http://dx.doi.org.ezproxy.shu.edu/10.1007/s10671-014-
9168-6
De Luca, B. M., & Hinshaw, S. A. (2013). Predicting student achievement in Ohio: The role of
expenditure distribution. Educational Considerations, 40(3), 9–16.
Doorey, N., & Polikoff, M. (2016). Evaluating the content and quality of next generation
assessments. Thomas B. Fordham Institute. Retrieved from
http://search.ebscohost.com/login.aspx?direct=true&AuthType=ip,sso&db=eric&AN=E
D565742&site=eds-live&authtype=sso&custid=s8475574
Duke, D. L., Sterrett, W., & Carr, M. (2013). The school improvement planning handbook:
Getting focused for turnaround and transition. Lanham, MD: R & L Education.
Every Student Succeeds Act (ESSA) of 2015, Pub. L. No. 114-95 § 114 Stat. 1177 (2015-2016).
Field, A. (2013). Discovering statistics using IBM SPSS statistics (4th ed.). Thousand Oaks, CA:
Sage.
Flores, S. M., & Drake, T. A. (2014). Does English language learner (ELL) identification predict
college remediation designation? A comparison by race and ethnicity, and ELL waiver
status. Review of Higher Education, 38(1), 1–36. Retrieved from https://search-proquest-
com.ezproxy.shu.edu/docview/1561501009?accountid=13793
Gage, N. A., Adamson, R., MacSuga-Gage, A., & Lewis, T. J. (2017). The relation between the
academic achievement of students with emotional and behavioral disorders and teacher
characteristics. Behavioral Disorders, 43(1), 213–222.
doi:http://dx.doi.org.ezproxy.shu.edu/10.1177/0198742917713211
Gershenson, S. (2016). Linking teacher quality, student attendance, and student achievement.
Education Finance and Policy, 11(2), 125–149. Retrieved from https://search-proquest-
com.ezproxy.shu.edu/docview/1826529359?accountid=13793
Gottfried, M. A., & Society for Research on Educational Effectiveness (SREE).
(2009). Evaluating the Relationship between Student Attendance and Achievement in
Urban Elementary and Middle Schools: An Instrumental Variables Approach. Society for
Research on Educational Effectiveness. Society for Research on Educational
Effectiveness. Retrieved from
http://search.ebscohost.com/login.aspx?direct=true&AuthType=ip,sso&db=eric&AN=E
D525312&site=eds-live&authtype=sso&custid=s8475574
Graziano, D. (2012). The relative influence of faculty mobility on NJ HSPA scores. (Doctoral
dissertation). Retrieved from ProQuest Dissertations and Theses database. (Accession
No. 1470242142)
Greenwald, R., Hedges, L. V., & Laine, R. D. (1996a). Interpreting research on school resources
and student achievement: A rejoinder to Hanushek. Review of Educational Research,

96
66(3), 411. Retrieved from https://search-proquest-
com.ezproxy.shu.edu/docview/214111636?accountid=13793
Greenwald, R., Hedges, L. V., & Laine, R. D. (1996b). The effect of school resources on student
achievement. Review of Educational Research, 66(3), 361. Retrieved from https://search-
proquest-com.ezproxy.shu.edu/docview/214118755?accountid=13793
Gronna, S. S., Jenkins, A. A., & Chin-Chance, S. (1998). The performance of students with
disabilities in a norm-referenced, statewide standardized testing program. Journal of
Learning Disabilities, 31(5), 482–493. Retrieved from https://search-proquest-
com.ezproxy.shu.edu/docview/194224249?accountid=13793
Hanushek, E. A. (1989). The impact of differential expenditures on school performance.
Educational Researcher, 18(4), 45–51. Retrieved from https://search-proquest-
com.ezproxy.shu.edu/docview/63151261?accountid=13793
Hanushek, E. A. (1996). A more complete picture of school resource policies. Review of
Educational Research, 66(3), 397. Retrieved from https://search-proquest-
com.ezproxy.shu.edu/docview/214117296?accountid=13793
Hanushek, E. A. (1997). Assessing the effects of school resources on student performance: An
update. Educational Evaluation and Policy Analysis, 19(2), 141–164. Retrieved from
https://search-proquest-com.ezproxy.shu.edu/docview/62512067?accountid=13793
Hanushek, E. A. (2008). Education production functions. The New Palgrave Dictionary of
Economics,1–5. doi:10.1057/978-1-349-95121-5_1930-1
Hanushek, E. A. (2016). What matters for student achievement. Education Next, 16(2) Retrieved
from https://search-proquest-com.ezproxy.shu.edu/docview/
1790928145?accountid=13793
Hanushek, E. A., & Benson, C. S. (1994). Making schools work: Improving performance and
controlling costs. Brookings Institution. Retrieved from https://search-proquest-
com.ezproxy.shu.edu/docview/38769886?accountid=13793
Harris, J. L., Al-Bataineh, M. T., & Al-Bataineh, A. (2016). One to one technology and its effect
on student academic achievement and motivation. Contemporary Educational
Technology, 7(4), 368.
Hedges, L. V., Laine, R. D., & Greenwald, R. (1994). Does money matter? A meta-analysis of
studies of the effects of differential school inputs on student outcomes. Educational
Researcher, 23(5), 5–24.
Herold, B. (2016, February 3). PARCC scores lower for students who took exams on computers.
Retrieved from https://www.edweek.org/ew/articles/2016/02/03/parcc-scores-lower-on-
computer.html

97
Heyboer, K. (2015, March 22). PARCC exams: Following the money behind N.J.’s costliest test.
Retrieved from https://www.nj.com/education/2015/03/parcc_exams_following_the_
money_behind_njs_costlie.html
Hoy, W., Tarter, C. J., & Hoy, A. (2006). Academic optimism of schools: A force for student
achievement. American Educational Research Journal, 43(3), 425–446. Retrieved from
http://www.jstor.org/stable/4121765
Huang, S. (2015). Mixed-method research on learning vocabulary through technology reveals
vocabulary growth in second-grade students. Reading Psychology, 36(1), 1–30.
doi:10.1080/02702711.2013.808723
Individuals with Disabilities Education Act, 20 U.S.C. § 1400 (2004)
James, L., Pate, J., Leech, D., Martin, E., Brockmeier, L., & Dees, E. (2011). Resource allocation
patterns and student achievement. International Journal of Educational Leadership
Preparation, 6(4). Retrieved from https://files.eric.ed.gov/fulltext/EJ974300.pdf
Jones, C. (2014, January-February). School finance 101. Retrieved from
https://www.njsba.org/news-publications/school-leader/januaryfebruary-2014-volume-
44-4/school-finance-101/
Kiger, D., Herro, D., & Prunty, D. (2012). Examining the influence of a mobile learning
intervention on third grade math achievement. Journal of Research on Technology in
Education, 45(1), 61–82.
Leech, N. L., Barrett, K. C., & Morgan, G. A. (2011). SPSS for intermediate statistics: Use and
interpretation. New York, NY: Lawrence Erlbaum Associates.
Lumpkin, R. B. (2016). School buildings, socioeconomic status, race, and student achievement.
Journal of Intercultural Disciplines, 15, 170–185.
Miley, S. K., & Farmer, A. (2017). English language proficiency and content assessment
performance: A comparison of English learners and native English speakers achievement.
English Language Teaching, 10(9), 198–207. Retrieved from https://search-proquest-
com.ezproxy.shu.edu/docview/1969012883?accountid=13793
Miller, R. T. (2012, November 5). Teacher absence as a leading indicator of student
achievement: New national data offer opportunity to examine cost of teacher absence
relative to learning loss. Introduction and Summary. Retrieved from
https://www.americanprogress.org/issues/education-k-12/reports/2012/11/05/
40371/teacher-absence-as-a-leading-indicator-of-student-achievement/
Miller, R. T., Murnane, R. J., & Willett, J. B. (2007). Do teacher absences impact student
achievement? Longitudinal evidence from one urban school district (Working paper,
13356). Cambridge, MA: National Bureau of Economic Research.
doi:http://dx.doi.org.ezproxy.shu.edu/10.3386/w13356
98
National Center for Education Statistics (NCES). (2018). English language learners in public
schools. Retrieved from https://nces.ed.gov/programs/coe/indicator_cgf.asp
New Jersey Department of Education (NJDOE). (2011). Definitions for New Jersey School
Report Card 2011 Retrieved from
https://www.state.nj.us/education/reportcard/2011/definitions.htm
New Jersey Department of Education (NJDOE). (2014). Educational technology. Retrieved from
http://www.state.nj.us/education/techno/
New Jersey Department of Education (NJDOE). (2015). Parent PARCC Questions Answered.
Retrieved from https://www.nj.gov/education/assessment/PARCCFAQ.pdf
New Jersey Department of Education (NJDOE). (2017a). Districtwide budget. Retrieved from
https://www.nj.gov/education/finance/fp/dwb.shtml
New Jersey Department of Education (NJDOE). (2017b). Educational technology grants.
Retrieved from https://www.nj.gov/education/archive/techno/grants/
New Jersey Department of Education (NJDOE). (2017c). New Jersey learning standards.
Retrieved from https://www.state.nj.us/education/aps/cccs/tech/
New Jersey Department of Education (NJDOE). (2017d). NJ School Performance Report: 2016-
17 data files. Retrieved from https://rc.doe.state.nj.us/reportsdatabase.aspx
New Jersey Department of Education (NJDOE). (2017e). The uniform minimum chart of
accounts for New Jersey public schools. Retrieved from https://www.nj.gov/education/
finance/fp/af/coa/coa1617.pdf
New Jersey Department of Education (NJDOE). (2018). High school graduation assessment
requirements. Retrieved from https://www.state.nj.us/education/assessment/
parents/GradReq.pdf
No Child Left Behind Act of 2001, P.L. 107-110, 20 U.S.C. § 6319 (2002).
Odden, A. R., Goetz, M. E., & Picus, L. O. (2008). Using available evidence to estimate the cost
of educational adequacy. Education Finance and Policy, 3(3), 374–397.
Organization for Economic Co-operation and Development (OECD). (2012). Viewing the United
States school system through the prism of PISA. Retrieved from https://www.oecd.org/
pisa/keyfindings/PISA2012-US-CHAP2.pdf
Packard, A. L., Hazelkorn, M., Harris, K. P., & McLeod, R. (2011). Academic achievement of
secondary students with learning disabilities in co-taught and resource rooms. Journal of
Research in Education, 21(2), 100–117.
Papke, L. E. (2005). The effects of spending on test pass rates: Evidence from Michigan, Journal
of Public Economics, 89(5–6), 821–839. http://dx.doi.org/10.1016/j.jpubeco.2004.05.008

99
Papke, L. E. (2008). The effects of changes in Michigan’s school finance system. Public Finance
Review, 36(4), 456–474.
Park, J. (2011, June 20). School finance. Retrieved from http://www.edweek.org/ew/issues/
school-finance/
Parke, C. S., & Kanyongo, G. Y. (2012). Student attendance, mobility, and mathematics
achievement in an urban school district. Journal of Educational Research, 105(3), 161–
175. https://doi.org/10.1080/00220671.2010.547231
Partnership for Assessment of Readiness for College and Careers (PARCC). (2018a). Final
technical report for 2017 administration. Retrieved from https://parcc-assessment.org/wp-
content/uploads/2018/03/PARCC-2017-Technical-Report-Final-03162018.pdf
Partnership for Assessment of Readiness for College and Careers (PARCC). (2018b). Score
report interpretation guide for parents. Retrieved from https://parcc-assessment.org/wp-
content/uploads/2018/01/PARCC-Parent-Interpretation-Guide-English-Spring-2017.pdf
Partnership for Assessment of Readiness for College and Careers (PARCC). (n.d.). Research.
Retrieved from https://parcc-assessment.org/research/
Raa, T. T. (2010). Input-output economics: Theory and applications: Featuring Asian
economies. Singapore: World Scientific.
Ready, D. D., Lee, V. E., & Welner, K. G. (2004). Educational equity and school structure:
School size, overcrowding, and schools-within-schools. Teachers College Record,
106(10), 1989–2014. Retrieved from https://search-proquest-com.ezproxy.shu.edu/
docview/211416249?accountid=13793
Roby, D. E. (2004). Research on school attendance and student achievement: A study of Ohio
schools. Educational Research Quarterly, 28(1), 3–14. Retrieved from https://search-
proquest-com.ezproxy.shu.edu/docview/216183172?accountid=13793
Shapley, K., Sheehan, D., Maloney, C., & Caranikas-Walker, F. (2011). Effects of technology
immersion on middle school students’ learning opportunities and achievement. The
Journal of Educational Research, 104(5), 299–315. doi:10.1080/00220671003767615
South, J. (2017, January 18). Office of Educational Technology U.S. Department of Education.
Retrieved from https://tech.ed.gov/files/2017/01/2017.1.18-Tech-Federal-Funds-Final-
V4.pdf
Storz, M. G., & Hoffman, A. R. (2013). Examining response to a one-to-one computer initiative:
Student and teacher voices. RMLE Online: Research in Middle Level Education, 36(6).
Retrieved from https://amle.org/portals/0/pdf/rmle/rmle_vol36_no6.pdf
Tienken, C. H. (2008). A descriptive study of the technical characteristics of the results from the
New Jersey assessments of skills and knowledge in Grades 3, 4, and 8. New Jersey
Journal of Supervision and Curriculum Development, 52, 46–61.

100
Tienken, C. H. (2012). The influence of poverty on achievement. Kappa Delta Pi Record, 48(3),
105. doi:10.1080/00228958.2012.707499
Tienken, C. H., & Wilson, M. J. (2005, January). Technical characteristics of large-scale state
assessments of skills and knowledge. Paper presented at the annual conference for the
New Jersey Association for Supervision and Curriculum Development, East Windsor,
NJ.
Tingle, L. R., Schoeneberger, J., Schools, C., Wang, C., Algozzine, B., & Kerr, E. (2012). An
analysis of teacher absence and student achievement. Education, 133(2), 367–382.
Williams, N. L., & Larwin, K. H. (2016). One-to-one computing and student achievement in
Ohio high schools. Journal of Research on Technology in Education, 48(3), 143–158.

101
APPENDIX
Data File (Truncated into three rows--in Excel File as one continuous row)
ID COUNT
Y_COD
E
DISTRIC
T_CODE
Disabi
lities
Englis
h
Learn
ers
Free
and
Reduc
ed
Overa
ll
Enroll
ment
Chron
ic
Absen
teeism
PARC
C
ELA
PARC
C
Math
Teacher Level of
Education MA
Faculty
Attendanc
e
District
Name
Grade
Span
Undistribut
ed
Expenditur
es total
Overall
Expenditu
re
Account
Teacher Level of
Education
Doctorate
Administrative
Information
Technology
Administrative
Technology
budget as
Percent of
overall
undistributed
expenditure
budget
Combined
Teacher
Level of
Education