the quality of the fossil record of the vertebrates
TRANSCRIPT

1
The quality of the fossil record of the vertebrates MICHAEL J. BENTON
Department of Earth Sciences, University of Bristol, Bristol, BS8 1RJ, U.K.
[Cite as: Benton, M. J. 1998. The quality of the fossil record of vertebrates. Pp. 269-303, in Donovan, S. K. and Paul, C. R. C. (eds), The adequacy of the fossil record. Wiley, New York, 312 pp.]
Fossilvertebratesincludeagreatdiversityofanimalsofallsizesandshapes,ranginginagebacktotheCambrian.Thehistoryofthevertebrateshasbeenrecountedmanytimes(forexample,Romer,1966;Carroll,1987;Benton,1990a,1997a)andtheoutlinesofthestoryarewellknown.Thesebroadoutlineswereworkedoutduringthenineteenthcentury,andthesequenceincludesthearmouredostracodermsandplacodermsoftheDevonian,Carboniferousamphibians,Permianmammal-likereptiles,Mesozoicdinosaurs,ichthyosaurs,plesiosaurs,andpterosaurs,birds,Tertiarymammals,andPlio-Pleistocenehominids.Thissuccessionisusuallyrecalledasaone-wayprogressionfromessentiallytoothedworm-likecreaturesoftheearlyPalaeozoictohumans,eventhoughsuchavisionismerelyadidacticdevice,anddoesnotproperlydepictthebranchingbushypatternofvertebrateevolution.
Howgoodisthisrecordofthediversificationofvertebrates?Therearetwointuitiveanswers.Oneistosuggestthattherecordisgoodbecausenothingmuchhaschangedinourunderstandingofthetimingofeventsinthepast100yearsofresearch.Theotheristosaythattherecordisterriblebecausemanyvertebrates,particularlytetrapods,liveonland,andtheyaremuchlesslikelytobepreservedthanmarineshelfinvertebrates.Thiscriticismcannot,ofcourse,applytofishes.
Thepurposeofthispaperistosummarizecurrentknowledgeofthehistoryofbackbonedanimals,butonlyinthesimplestofoutlineforms,andtopresentsomerecentworkonthequalityofthefossilrecordofvertebrates.
AGOODFOSSILRECORD?
Itislikelythatthenumbersoffossils,localities,andvertebratepalaeontologistshavemultipliedbyseveralordersofmagnitudeduringthetwentiethcentury,andyettherehavebeennosurprisesintheacceptedbroad-scalepatternofvertebrateevolution.Ofcourse,theimpressiveeffortsofcollectorshavepushedtheoriginsofvariousgroupsbackwardsintime,butthesestratigraphicrangeextensionshaveallbeenpredictable.Thiscentury,theoriginofagnathanfisheshasbeenpushedbackfromtheSiluriantotheCambrian,theoriginofamphibiansfromtheearlyCarboniferoustothelatestDevonian,theoriginofreptilesfromtheearlyPermiantothemidCarboniferous,andtheoriginofmammalsbackfromthemidJurassictothelateTriassic.Arguably,theoriginofbirdshasremainedunchangedinthelatestJurassic,sincetheworkofOwenandHuxleyinthe1860sand1870s.However,ifProtoavisisabird(Chatterjee,1995),thenthepointoforiginofthegroupmovesbacktothelateTrassic,andthatwoulddistortmanypartsofthephylogeny,notonlyofbirds,butalsoofDinosauriaingeneral.
2
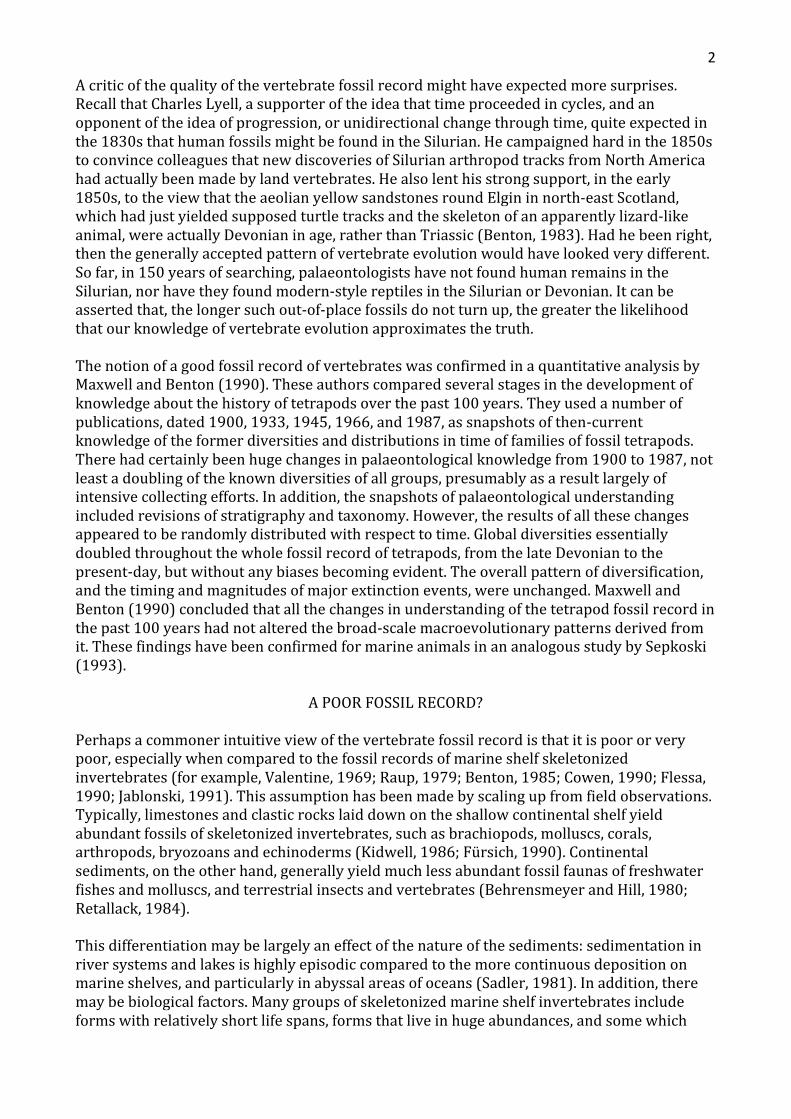
Acriticofthequalityofthevertebratefossilrecordmighthaveexpectedmoresurprises.RecallthatCharlesLyell,asupporteroftheideathattimeproceededincycles,andanopponentoftheideaofprogression,orunidirectionalchangethroughtime,quiteexpectedinthe1830sthathumanfossilsmightbefoundintheSilurian.Hecampaignedhardinthe1850stoconvincecolleaguesthatnewdiscoveriesofSilurianarthropodtracksfromNorthAmericahadactuallybeenmadebylandvertebrates.Healsolenthisstrongsupport,intheearly1850s,totheviewthattheaeolianyellowsandstonesroundElgininnorth-eastScotland,whichhadjustyieldedsupposedturtletracksandtheskeletonofanapparentlylizard-likeanimal,wereactuallyDevonianinage,ratherthanTriassic(Benton,1983).Hadhebeenright,thenthegenerallyacceptedpatternofvertebrateevolutionwouldhavelookedverydifferent.Sofar,in150yearsofsearching,palaeontologistshavenotfoundhumanremainsintheSilurian,norhavetheyfoundmodern-stylereptilesintheSilurianorDevonian.Itcanbeassertedthat,thelongersuchout-of-placefossilsdonotturnup,thegreaterthelikelihoodthatourknowledgeofvertebrateevolutionapproximatesthetruth.
ThenotionofagoodfossilrecordofvertebrateswasconfirmedinaquantitativeanalysisbyMaxwellandBenton(1990).Theseauthorscomparedseveralstagesinthedevelopmentofknowledgeaboutthehistoryoftetrapodsoverthepast100years.Theyusedanumberofpublications,dated1900,1933,1945,1966,and1987,assnapshotsofthen-currentknowledgeoftheformerdiversitiesanddistributionsintimeoffamiliesoffossiltetrapods.Therehadcertainlybeenhugechangesinpalaeontologicalknowledgefrom1900to1987,notleastadoublingoftheknowndiversitiesofallgroups,presumablyasaresultlargelyofintensivecollectingefforts.Inaddition,thesnapshotsofpalaeontologicalunderstandingincludedrevisionsofstratigraphyandtaxonomy.However,theresultsofallthesechangesappearedtoberandomlydistributedwithrespecttotime.Globaldiversitiesessentiallydoubledthroughoutthewholefossilrecordoftetrapods,fromthelateDevoniantothepresent-day,butwithoutanybiasesbecomingevident.Theoverallpatternofdiversification,andthetimingandmagnitudesofmajorextinctionevents,wereunchanged.MaxwellandBenton(1990)concludedthatallthechangesinunderstandingofthetetrapodfossilrecordinthepast100yearshadnotalteredthebroad-scalemacroevolutionarypatternsderivedfromit.ThesefindingshavebeenconfirmedformarineanimalsinananalogousstudybySepkoski(1993).
APOORFOSSILRECORD?
Perhapsacommonerintuitiveviewofthevertebratefossilrecordisthatitispoororverypoor,especiallywhencomparedtothefossilrecordsofmarineshelfskeletonizedinvertebrates(forexample,Valentine,1969;Raup,1979;Benton,1985;Cowen,1990;Flessa,1990;Jablonski,1991).Thisassumptionhasbeenmadebyscalingupfromfieldobservations.Typically,limestonesandclasticrockslaiddownontheshallowcontinentalshelfyieldabundantfossilsofskeletonizedinvertebrates,suchasbrachiopods,molluscs,corals,arthropods,bryozoansandechinoderms(Kidwell,1986;Fürsich,1990).Continentalsediments,ontheotherhand,generallyyieldmuchlessabundantfossilfaunasoffreshwaterfishesandmolluscs,andterrestrialinsectsandvertebrates(BehrensmeyerandHill,1980;Retallack,1984).
Thisdifferentiationmaybelargelyaneffectofthenatureofthesediments:sedimentationinriversystemsandlakesishighlyepisodiccomparedtothemorecontinuousdepositiononmarineshelves,andparticularlyinabyssalareasofoceans(Sadler,1981).Inaddition,theremaybebiologicalfactors.Manygroupsofskeletonizedmarineshelfinvertebratesincludeformswithrelativelyshortlifespans,formsthatliveinhugeabundances,andsomewhich

3
moult,andhenceproduceseveralpotentialbodyfossilsduringalifetime.Manyvertebrates,andtetrapodsinparticular,oftenhavelifespanslastingseveralyears,andpopulationsareoftennotcountedinthethousandsormillions.
Manyoftheseobservationsarequalitative,butrecenttaphonomicandpalaeoecologicalstudies(forexample,papersinBriggsandCrowther,1990;AllisonandBriggs,1991;Donovan,1991)showhugedifferencesintheabundanceandclosenessofspacingbetweenfossilspeciesofmarineinvertebratesandplanktonicformsontheonehand,andcontinentalvertebratesontheother.
Inconclusion,therearetwointuitiveviewsofthequalityofthefossilrecordofvertebrates,andeachissupportedbyobservationalevidenceandbyquantitativestudies.Howcantheybereconciled?
THEPATTERNOFTHEEVOLUTIONOFVERTEBRATES
Theevolutionofanygroupcanberepresenteddiagrammaticallyinvariousways.Oneusefulkindofgraphicpresentationisa'spindlediagram',inwhichtheevolutionofagroupisrepresentedbysymmetricalspindleshapeswhichindicatethewaxingandwaningofagroupthroughtime.They-axisisproportionaltotime,andthex-axistospeciesnumbers,orsomesimilarmeasure.Eachgrouporiginatesasanarrowpoint,andthentypicallyexpandsintoawiderspindleasitradiates.Anyindividualspindlemayremainnarrow(lowdiversity)throughtime,oritmayexpand,orvaryinwidththroughtime,dependingontherelativefortunesofthegroup.
Figure 1. The pattern of evolution of the vertebrates, showing the relative importance of the major groups through time. This is a 'spindle diagram', in which the vertical axis represents geological time, and the horizontal axis represents the diversity of each group. In this case, the horizontal

4
dimension is proportional to the number of families in each group, based on data compiled by various authors in Benton (1993). The groups include some clades (that is, monophyletic groups), such as Chondrichthyes, Placodermi, Acanthodii, Aves, and Mammalia, but the others are paraphyletic groups (that is, a group that includes the ancestor, but not all of the descendants of that ancestor). All groups are treated in their traditional sense. Mass extinctions show up in the Late Devonian, late Permian, and end-Cretaceous, indicated by relatively rapid contractions in the diversities of several clades.
Forvertebrates,thelatestcompilationofdata(chaptersinBenton,1993)givesadiagram(Fig.1)thathasnotchangedmuchsinceearliercomparableattempts(forexample,Romer,1966;Carroll,1987).Therelativewidthsofdifferentspindleshavechangedsomewhat,asalsothecurrentlyoldestindicationsofsomeofthegroups.Certainmassextinctions,particularlythoseinthelateDevonian,latePermian,andattheendoftheCretaceous,arehighlightedbyrelativelyrapidcontractionsinthewidthsofseveralofthespindles.Thisimplieshighratesofextinctionofseveralgroupsatthesametime.
Thesedataondiversitymayberenderedasmorepreciseplotsofactualcountsoffamiliesthroughtime(Fig.2).Inthiscase,thesamedatabase(Benton,1993)wastrawledfordataonthediversitiesoffamiliesofthemajorgroups.Thedataareplottedseparatelyforfishes(Fig.2a)andtetrapods(Fig.2b),and,ineachcase,thepresentationiscumulative,witheachlabelledcurveaddingontopofthecurvesbelow.Theuppercurverepresentsthetotalsumofdiversityforallfishesoralltetrapodsatanytimeinthepast500Myr.
Indetail,thepatternofdiversificationofthefishes(Fig.2a)showsarapidriseintheearlyPalaeozoic,toabroadpeak,atabout50-70familiesintheDevonian.Thisinitialriseindiversitymaybemoreapparentthanreal;Sansometal.(1996)havearguedthatthepre-Devonianrecordoffishesisunnaturallyimpoverished,andthattruediversitywasmuchhigherthaniscurrentlybelieved.DiversitydeclinesattheendoftheDevonian,anddiminishesfurtherthroughthelatePermian,beforeslowlyclimbingduringtheMesozoic.ThediversityoffishesreachesDevonianlevelsof50-70familiesagainintheCretaceous,andthendiversificationisapparentlyexplosivethroughtheTertiary,althoughapparentlyslowingdowninthelast40Myr.
ThehighlevelsoffishdiversityintheDevonianaredominatedbyostracodermagnathansandplacoderms,bothofwhichgroupswerehardhitbythelateDevonianmassextinction.Bearinmind,however,that'fishes'isaparaphyleticgroup,andthedropinpost-DevoniandiversitywasmatchedbythediversificationofPalaeozoictetrapods,justanotherbranchoffishdiversitythathappenedtomovepartlyorfullyontoland,throughthelateDevonianandCarboniferous.Thesubsequentdiversificationoffishesisdominatedbythechondrichthyans(sharksandrays)andactinopterygians(bonyfishes),andthedramaticearlyTertiaryburstindiversificationisdrivenlargelybytheradiationoftwoclades,theNeoselachii(modernsharks)andtheTeleostei(themajorityofmodernbonyfishes).
5
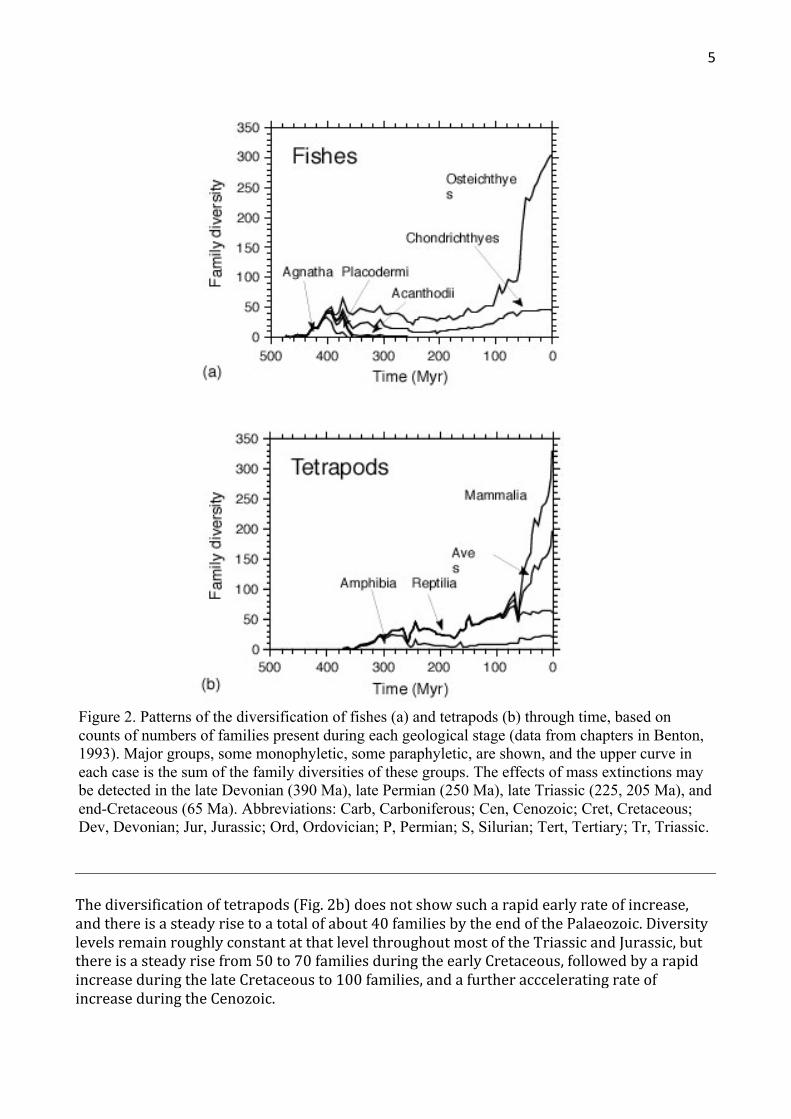
Figure 2. Patterns of the diversification of fishes (a) and tetrapods (b) through time, based on counts of numbers of families present during each geological stage (data from chapters in Benton, 1993). Major groups, some monophyletic, some paraphyletic, are shown, and the upper curve in each case is the sum of the family diversities of these groups. The effects of mass extinctions may be detected in the late Devonian (390 Ma), late Permian (250 Ma), late Triassic (225, 205 Ma), and end-Cretaceous (65 Ma). Abbreviations: Carb, Carboniferous; Cen, Cenozoic; Cret, Cretaceous; Dev, Devonian; Jur, Jurassic; Ord, Ordovician; P, Permian; S, Silurian; Tert, Tertiary; Tr, Triassic.
Thediversificationoftetrapods(Fig.2b)doesnotshowsucharapidearlyrateofincrease,andthereisasteadyrisetoatotalofabout40familiesbytheendofthePalaeozoic.DiversitylevelsremainroughlyconstantatthatlevelthroughoutmostoftheTriassicandJurassic,butthereisasteadyrisefrom50to70familiesduringtheearlyCretaceous,followedbyarapidincreaseduringthelateCretaceousto100families,andafurtheraccceleratingrateofincreaseduringtheCenozoic.

6
ThePalaeozoicdiversityrecordisdominatedby'amphibians'andthesebasaltetrapodsdeclinedindiversitydramaticallyduringtheMesozoic,andfinallydisappearedintheCretaceous.Thepost-PalaeozoicrecordofamphibiansrepresentsthecladeLissamphibia,andtheirdiversityhasrisenslowlyfromMesozoiclevelsofabout10familiestoabouttwicethatattheendoftheCenozoic.Notethatthediversificationpatternof'Amphibia'focusesonaparaphyleticgroupinthePalaeozoic(thatis,alltetrapodsexceptamniotes)andadescendantclade,theLissamphibia,afterthePalaeozoic,sothereisnoneedtoseekspecialreasonsforthedouble-peakedpatternofdiversificationofthe'Amphibia',asCarroll(1977)attempted.Thepatternisanartefactoftheconventionalclassificationofthegroupandneednotrepresentanunusualgapinthefossilrecord.
Thediversificationpatternforreptilesissimilarlyunrealistic,butthegroupsarerepresentedinthiswaytoindicatethecommonunderstandingoftheseterms.ThroughmostoftheMesozoicatleast,thepatternsaremeaningful,althoughthedescendantclades,thebirdsandmammals,risetoprominenceespeciallyinthelateCretaceous.ReptilediversityincreasedmarginallythroughtheMesozoicfrom20-30familiesintheTriassicto50-60inthelateCretaceous,mainlydinosaurs.BirdsandmammalsexistedthroughmuchoftheMesozoic,butatlowdiversities,andbothgroupsshoweddramaticallyacceleratingratesofdiversificationthroughtheCenozoic.
Changesindiversitymaybetrackedalsobydocumentingoriginationandextinctionrates.Here,thepercentageratesarepresented(Figs3,4),inotherwordsthenumbersoffamiliesarisingorbecomingextinctinageologicalstageasaproportionofthenumbersextantatthetime.Thismeasureoforiginationandextinctiongivesameasureofrisk,butitisnotnormalizedtogeologicaltime.Thishasnotbeendonesincethestratigraphicstagesarelargelyofcomparablelength,typically5-10Myr,andtheprecisedurationsofmanyofthesestagesarenotknownwithconfidence.
Originationratesforfishes(Fig.3)wereparticularlyhighinthelateCambrian(radiationofagnathans,includingconodonts),duringtheSilurian,DevonianandCarboniferous,intheearlyTriassic(afterthelatePermianextinction),inthemidCretaceousandEocene(aftertheKTevent).TetrapodsalsoshowhighratesoforiginationinthelateDevonianandearlyCarboniferous,justafterthelatePermianextinction,andjustaftertheKTevent.ThelateJurassicpeaksmaybereal,ormayreflectsomesitesofexceptionallygoodpreservation.
7
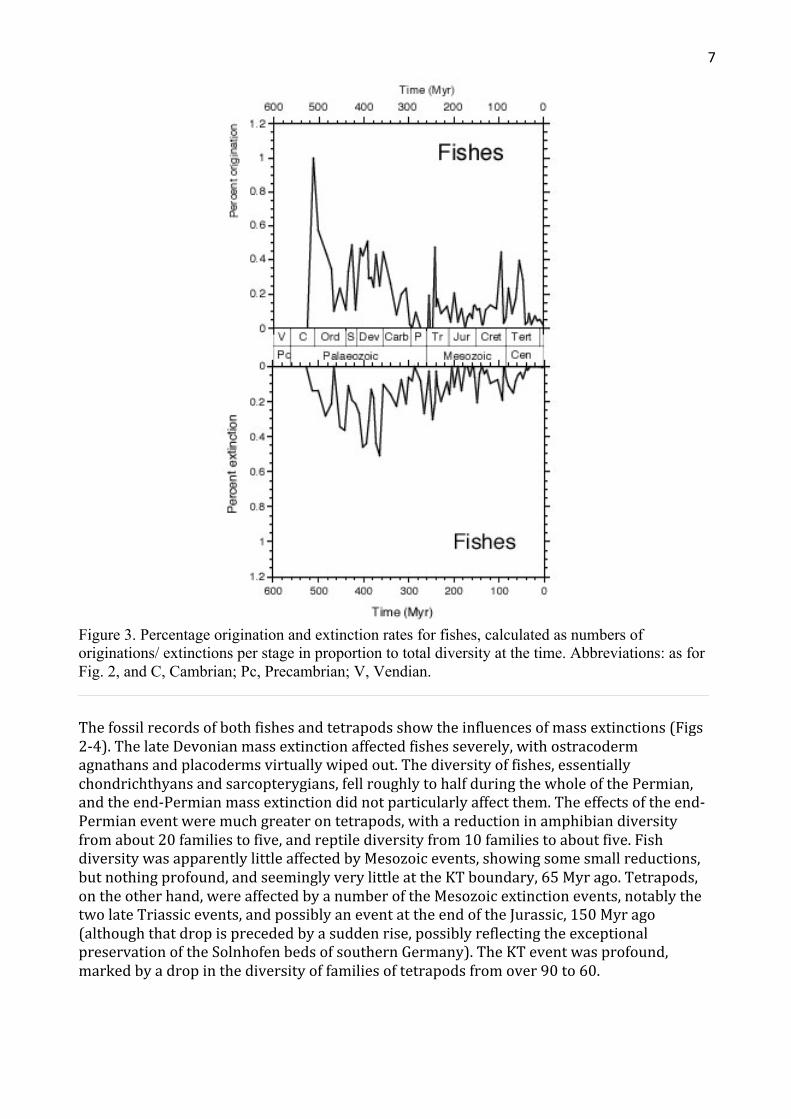
Figure 3. Percentage origination and extinction rates for fishes, calculated as numbers of originations/ extinctions per stage in proportion to total diversity at the time. Abbreviations: as for Fig. 2, and C, Cambrian; Pc, Precambrian; V, Vendian.
Thefossilrecordsofbothfishesandtetrapodsshowtheinfluencesofmassextinctions(Figs2-4).ThelateDevonianmassextinctionaffectedfishesseverely,withostracodermagnathansandplacodermsvirtuallywipedout.Thediversityoffishes,essentiallychondrichthyansandsarcopterygians,fellroughlytohalfduringthewholeofthePermian,andtheend-Permianmassextinctiondidnotparticularlyaffectthem.Theeffectsoftheend-Permianeventweremuchgreaterontetrapods,withareductioninamphibiandiversityfromabout20familiestofive,andreptilediversityfrom10familiestoaboutfive.FishdiversitywasapparentlylittleaffectedbyMesozoicevents,showingsomesmallreductions,butnothingprofound,andseeminglyverylittleattheKTboundary,65Myrago.Tetrapods,ontheotherhand,wereaffectedbyanumberoftheMesozoicextinctionevents,notablythetwolateTriassicevents,andpossiblyaneventattheendoftheJurassic,150Myrago(althoughthatdropisprecededbyasuddenrise,possiblyreflectingtheexceptionalpreservationoftheSolnhofenbedsofsouthernGermany).TheKTeventwasprofound,markedbyadropinthediversityoffamiliesoftetrapodsfromover90to60.

8
Figure4.Percentageoriginationandextinctionratesfortetrapods,calculatedasnumbersoforiginations/extinctionsperstageinproportiontototaldiversityatthetime.Abbreviations:asforFigs2.
Thereissomeevidenceforacouplingofpatternsoforiginationandextinction(Figs3,4),asnotedbeforeforvertebrates(Benton,1989),hencesuggestingapossible'Lagerstätteneffect'.[Ifafossilrecordisaffectedexcessivelybytheinfluenceofspecificlocalitiesofexceptionalpreservation,thepatternsoforiginationandextinctionareoftentightlycoupled.]Forfishes,apparenthighratesofturnover(highoriginationandhighextinctionrates)occurinthemidDevonianandearlyLateCretaceous(Fig.3).However,theevidenceforcouplingisnotstrong,andmoreoftenhighextinctionratesarefollowedbyhighoriginationrates.Thesameappearstobelargelytruefortetrapods(Fig.4),althoughtherewerecoupledhighratesoforiginationandextinctionintheearlyTriassicandlateJurassic.Thecouplingseemstobelessthanitwasinearlieranalyses(Benton,1985,1989):perhapsourknowledgeofthebackgroundfossilrecordisimprovingtotheextentthatLagerstättenarenolongerdistortingthepatternsunduly.

9
Figure 5. Patterns of the diversification of fishes (a) and tetrapods (b) through time, with best-fitting linear and exponential models. In both cases the exponential model fits best: for fishes, the linear model (y = 173.7 - 0.45x, r = 0.719) is a poorer match to the data than the exponential model (y = 236.9-0.0085x, r = 0.925); and for tetrapods, the linear model (y = 177.0 - 0.62x, r = 0.779) is also a poorer match to the data than the exponential model (y = 409.5-0.0159x, r = 0.979).
Theoveralldiversificationcurvesbothappeartofollowexponentialpatternsofincrease,fromrelativelylownumbersinthePalaeozoic,throughslightlyincreasingdiversitiesintheJurassicandCretaceoustodramaticallyacceleratingdiversificationsfromtheLateCretaceousonwards.Itwouldbehardtointerpretthesecurvesaslogistic,asSepkoski(1984)hasdoneforthediversificationoffamiliesofmarineanimals.Thediversitycurvesforbothfishesandtetrapodsshowagoodfittoanexponentialcurve(Fig.5).Thefitismarkedlybetterthantoastraightline(linearmodel),andthedistributionofpointspreventsthecalculationofanykindofmeaningfullogisticfit.Benton(1995a)foundthesameresultforallcontinentalorganisms,includingessentiallytetrapods,insects,andlandplants.
EXPONENTIALOREQUILIBRIALSYSTEMS

10
Theimplicationsofexponential,ratherthanlogistic,curvesofincreaseindiversityareprofound(Benton,1997b,c;Fig.6herein).Anexponentialcurve,allowingforthetemporaryreversescausedbyextinctionevents,impliesthatthereisnolimittotheglobaldiversitythatcanbeachieved,oratleastthatvertebrates(orlifeonland,oralllife)haveyettoapproachthatmaximumglobalcarryingcapacityforlife.Alogisticcurve,orseriesoflogisticcurves,impliesthatthereareglobal-scalecapstodiversity,thattheworldreachesastagewhereallecospaceisfull,andthislimitinglevel,orsteadystate,canbebreachedonlybysomemajorrevolution(amassextinction,theoriginofasubstantialnewadaptivecomplex,adramaticenvironmentalshift).Whichisthetrueinterpretationofthehistoryoflife,orofvertebratesatleast?
Figure 6. The basic shape of a logistic (a) and an exponential (b) curve.
Logisticmodels
Thelogisticmodelfortheexpansionofthediversityoflifehasdevelopedfromaninfluentialbodyofecologicaltheory.MacArthurandWilson(1967)presentedtheir'theoryofislandbiogeography'asasimplemeansofestimatingtherateoffillingofanisland,orotherdefinedpatchoflivingspace.Theyshowedhowtherateofarrivaloforganismsisinitiallyhigh,butthat,asthespacefillsup,therateofsuccessfulcolonizationdiminishes,andtherateoflocalextinctionincreases.Atsomepoint,thetworates,colonizationandextinction,stabilize,andthisdynamicequilibriumrepresentsthecarryingcapacity,oridealdiversityoflifeontheisland.Thecarryingcapacityisnotfixed,butcanbemodifiedbymajorchanges:forexample,movementsintherelativepositionoftheislandwithrespecttothenearestsourcesofspecies,changesintopography,climaticshifts,andthelike.
Rosenzweig(1975,1995),andothers,haveextendedthisisland-scalemodeltoregionalandglobalscales,allowingessentiallyforintracladecompetition,sothatMacArthurandWilson'sislandbecomestheworld,andtheirlocalratesofcolonizationandextinctionbecomeglobalratesoforiginationandextinctionofspecies,orhighertaxa.Timescalesmovefromtensorhundredsofyearstomillions.
Sepkoski(1978,1979,1984,1996)hasdevelopedanequivalentsystemofmodelling,butinwhichhefocusesonmorecomplexintraspecificcompetitionratherthanintracladecompetition.Theend-resultissimilar,however,andhefindsevidenceforequilibriumlevelsintheCambrianandinthepost-CambrianPalaeozoic,andtheseareinterpretedasrepresentingrealsteadystates.Thepost-Palaeozoicrecordofdiversificationofmarineanimals,accordingtohisanalysis,showsnofurtherequilibriumlevel,andhencethepast250

11
millionyearsisinterpretedastherisingpartofalogisticcurve.CourtillotandGaudemer(1996),ontheotherhand,inare-analysisofBenton's(1995a)data,confirmedalogisticmodelforthediversificationoflife,buttheyfoundevidenceforonlyoneequilibriumlevelinthePalaeozoic,andtheybelievedtheyhadidentifiedthebeginningofaslow-downindiversificationratesinthelateCenozoic,andhenceahintthatlifeisapproachinganewequilibriumlevel.
Thelogisticmodel,andtheimplicationsofglobalsteadystatesorequilibria,havedominateddiscussioninthisarea.Sepkoski'sinterpretationhasbeenreproducedinmanytextbooks(forexample,AllenandBriggs,1989;Clarkson1993;Skelton,1993;BentonandHarper,1997).However,someofthekeyassumptionsbehindsuchaviewhavebeencriticized(forexample,Hoffman,1985).
Thecriticalissuewithassumptionsofequilibriumlevels,orevenlessstablesteadystates,isthenotionofacarryingcapacity,oridealnumberofspeciesthatcanbeaccommodatedontheEarth.Rieppel(1984),forexample,showedthattheideaofaglobalsteadystateforspeciesisequivalenttotheold'principleofplenitude'.Thiswasapre-Darwinianidea,foundedonthekeyassumptionofnaturaltheology,thatGodhadcreatedallorganismsperfectandthathehadfittedsomeplantoranimaltoeachavailabletask(wewouldsayniche)intheeconomyofnature.Therewasnospaceleft.
Darwinborrowedtheprincipleofplenitudeandmadeitexplicitlyevolutionaryinhisanalogyofabarrelofapples.InhisunpublishedNaturalSelection(seeStauffer,1975,p.208),Darwincomparedthepresent-daydiversityofspeciestoanumberofapplesfloatingonthesurfaceofabarrelfilledwithwater.Thesurfaceiscoveredbyexactlytherightnumberofapples,anditisimpossibletoaddanewapplewithoutdisplacingonethatisalreadythere.Similarly,heargued,eachspecieshadbeenhonedbyevolutiontofititsniche,andifanewspeciesarises,ithastodisplaceapre-existingspeciesbeforeitcanbecomeestablished.WalkerandValentine(1984)questionedDarwin'sassumption,thatallnichesarefull.Thishasalsotypicallybeenanassumptionofregional-andglobal-scaleequilibriummodels,butitisunnecessary.Theseauthorsestimatedthatthemeanproportionofemptynichesrangedfrom12to54%foreightmarineinvertebrategroups,andthatspeciesturnovercouldoccurreadilyandrapidly,butwithouttheneedtoassumethatthereisconstantevolutionarypressurefromcompetitivelysuperiorspecies.
Shouldwebelievemathematicalmodels?ThereisnoquestionthatalogisticmodelisamuchbetterfittothepatternofdiversificationoffamiliesofPalaeozoicmarineanimalsthanastraight-line,exponentialorpower-lawcurve(Sepkoski,1979,1984,1996;CourtillotandGaudemer,1996).However,ifthebasicecologicalandevolutionaryassumptionsbehindsuchalogisticmodelarecontradicted,thenperhapsafreshconsiderationisjustified.
Exponentialmodels
Thequestionofmathematicsvs.basicobservationsdoesnotariseforvertebrates,sincealogisticcurve,orseriesoflogisticcurves,wouldbehardtofittotheknownpatternsofdiversificationoffishesortetrapods(Figs2,5).Thepatternsasawholesuggestexpansion,andespeciallyrapidexpansionoverthepast50-100Myr,thepartofthefossilrecordthatisprobablybetterknownandbetterdatedthanearliersegments.
Intuitiveobservationsofthefossilrecordofvertebratesconfirmtheideaofcontinuingexpansionbasedonevolutionaryinnovation.Theburstsofradiationamongfishes,for

12
example(Fig.2a),mayberelatedtospecificnewadaptations,suchasextensivearmourinostracodermagnathansandplacodermsinthelateSilurianandDevonian,jawsinplacodermsandacanthodiansintheDevonian,increasedswimmingspeedsandefficiencyofjawsinJurassicbonyfishes(andespeciallytheteleosts),expansionoftrophiclevelsinthesea(especiallythemodernsharks,Neoselachii),adaptationstofeedingonspecificfoods(suchasplankton,corals,buriedbivalvesandechinoderms),andparasiticmodes.
Asimilarsequenceofdramaticexpansionsofecospacecharacterizetheevolutionoftetrapods;terrestrialadaptationsamongearlytetrapodsinthelateDevonianandCarboniferous,insect-eatinginCarboniferoustetrapods,thecleidoic(enclosed)egginlateCarboniferousamniotes,herbivoryincertainearlyPermianamniotes,largesizeinsomelatePermianherbivorousmammal-likereptiles,fullyuprightpostureinseveralamniotegroupsinthelateTriassic,trueflappingflightinlateTriassicpterosaursandlateJurassicbirds,endothermyinMesozoicmammalsandbirds,verylargesizeinJurassicandCretaceousdinosaurs,newmarinetop-predatorrolesintheMesozoic(ichthyosaurs,plesiosaurs,mosasaurs),burrowingandtree-climbingamongsomeMesozoicandCenozoicamniotegroups,furtherexpansionofnichestoincludepolarregionsandnocturnalhabitsamongCenozoicmammals,andsoon.
Theseadditionsofdietarymodesandhabitatshavebeenakeyfeatureoftheevolutionoftetrapods(Benton,1990b),andpresumablyalsooffishes,andindeedmanyotherexpandingclades.Thetetrapodsshiftedfrombeingessentially100%fish-eatersand100%theinhabitantsoffreshwatersandadjacentlandareasinthelateDevonianandearlyCarboniferous,toamuchwiderarrayofniches.Indeed,fish-eatingandamphibiousfreshwaternichesfelltoasteady10%ofallfamiliesfromthelateMesozoiconwards(Benton,1990b).Withafinemagnifyingglass,perhapsonecouldarguethattherewere'steadystate'conditionsworldwidebetweeneachoftheseadaptiveburstsofradiation(Rosenzweig,1995).However,thesumtotalofnewadaptationsthatcanbeidentifiedislargerthanthelistsjustgiven(forexample,colonialnestinginmolerats,feedingongarbagebyvariousurbanizingmammals,ant-eating,...).Howsmalldothe'steadystates'havetobecomebeforetheyevaporatealtogetherintoapictureofopportunisticexpansionindiversification?
Cantheexpansionofdiversitygoonforever?Ofcoursethereisanultimatelimittothenumbersoffamilies,orothertaxa,thatcaninhabittheEarthatanytime;suchalimitwouldbecausednotleastbytheamountofstandingroomontheArk.Presumably,though,ifalimitoflivingspacewereapproached,eversmallerorganismsmightperhapsbefavouredbyevolution.Equally,ashashappenedsomanytimesduringevolution,organismswouldtakeunexpectedmeasurestosurviveby,forexample,occupyingtheair,burrowingintosedimentsand,inthecaseofsomebacteria,livingdeepwithintheEarth'scrust.Withsizereduction,theultimatelimittothediversificationoflifemightthenbecometheavailabilityofthechemicalcomponentsoflife,principallycarbon.Ofcourse,otherpartialescapemechanismsfromsuchalimitingfactoristospeeduptherateofcyclingofcarbonthroughbiogeochemicalcycles,toretainsuchchemicalsintheorganicrealmforlonger,andtoreducetheamountoftimetheyremainburied.
Cladereplacements
Anexpectationofthelogisticmodelfordiversificationisthatthereisaphaseofrapidincreaseindiversity,followedbyalevelling-offphaseasthegradientofthecurvediminishes(Fig.6a).Thisoccursasdiversityapproachestheequilibriumlevel,andtherateofincreasediminishesprogressivelythecloserthediversityapproachesthatlevel.Justastherateof
13
diversificationdeclines,sothephaseofrapidexpansion(fillingofecospace)switchestoaprolongedphaseofdynamicequilibrium;newtaxamayarise,buttheywilltendtodisplacepre-existingtaxa(Darwin'sbarrelofapplesanalogy).Inarealcaseoftheevolutionofamajorclade,onemightexpecttofindachangeinthenatureoftaxonoriginations,fromexpansionisttoequilibrial,fromtaxamovingintounoccupiedecospace,tomoreandmorecompetitivedisplacement.
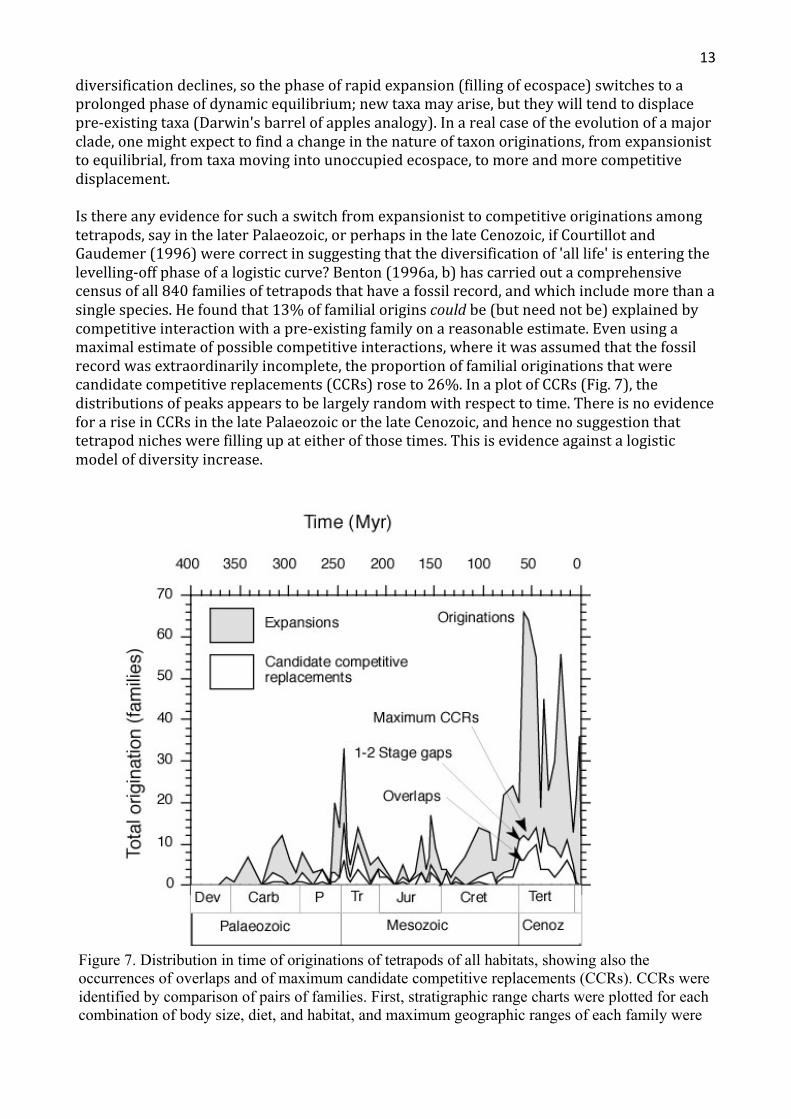
Isthereanyevidenceforsuchaswitchfromexpansionisttocompetitiveoriginationsamongtetrapods,sayinthelaterPalaeozoic,orperhapsinthelateCenozoic,ifCourtillotandGaudemer(1996)werecorrectinsuggestingthatthediversificationof'alllife'isenteringthelevelling-offphaseofalogisticcurve?Benton(1996a,b)hascarriedoutacomprehensivecensusofall840familiesoftetrapodsthathaveafossilrecord,andwhichincludemorethanasinglespecies.Hefoundthat13%offamilialoriginscouldbe(butneednotbe)explainedbycompetitiveinteractionwithapre-existingfamilyonareasonableestimate.Evenusingamaximalestimateofpossiblecompetitiveinteractions,whereitwasassumedthatthefossilrecordwasextraordinarilyincomplete,theproportionoffamilialoriginationsthatwerecandidatecompetitivereplacements(CCRs)roseto26%.InaplotofCCRs(Fig.7),thedistributionsofpeaksappearstobelargelyrandomwithrespecttotime.ThereisnoevidenceforariseinCCRsinthelatePalaeozoicorthelateCenozoic,andhencenosuggestionthattetrapodnicheswerefillingupateitherofthosetimes.Thisisevidenceagainstalogisticmodelofdiversityincrease.
Figure 7. Distribution in time of originations of tetrapods of all habitats, showing also the occurrences of overlaps and of maximum candidate competitive replacements (CCRs). CCRs were identified by comparison of pairs of families. First, stratigraphic range charts were plotted for each combination of body size, diet, and habitat, and maximum geographic ranges of each family were

14
noted. Then, the point of origin of each of the 840 families was scrutinised to determine whether it was a CCR or an expansion. CCR cases were subdivided into overlaps, where the stratigraphic range of the family overlapped another family, and situations where the family apparently originated at the precise time of extinction of another (gap 0), or after a gap of one or two (gap 1, 2) stratigraphic stages. Overlaps give evidence that the two families could have encountered each other, while the gap 0, 1, and 2 cases allow for possible incompleteness of the fossil record. CCRs are plotted as overlaps and maximum CCRs (the sum of all overlaps and gap 0, 1, and 2 cases). Abbreviations: Carb, Carboniferous; Cenoz, Cenozoic; Cret, Cretaceous; Dev, Devonian; Jur, Jurassic; P, Permian; Tert, Tertiary; Tr, Triassic. Based on data in Benton (1996a, b).
QUALITYOFTHEFOSSILRECORDOFVERTEBRATES
Thequalityofthefossilrecord,orofsomesegmentofit,maybeassessedinaqualitativeway,andassertionsmaybemadebaseduponfieldexperience,oruponoverallsurveysofagroup.Theseintuitiveapproacheshavebeendiscussedabove,especiallywithregardtothefossilrecordofvertebrates.Theseobservations,however,areoftenhardtojustify,especiallytonon-palaeontologists,andtheymaygivemisleadingevidence:casesweresetoutabovethatthefossilrecordofvertebratesiseithergood(stabilityinourunderstanding;norealsurprises)orpoor(incompletenessofsedimentaryrecord;rarityoffossils).Ultimately,ofcourse,adecisivetestonthequalityofanyfossilrecordcannotbeapplied,sincenomortalcanknowwhatreallyhappenedinthepast.Withoutayardstickofthetruth,itisclearlyimpossibletotestassertionsaboutthefossilrecordonceandforall.However,threequantitativeapproachesmayshedsomelightoncompleteness.
Taphonomictestsofthecompletenessofthefossilrecord
Thefirstquantitativeapproachtoassessingthecompletenessofthefossilrecordistocomparelikewithlikethroughtime.Forexample,itisafairassumptionthatdepositscontainingexceptionallypreservedfossils(Lagerstätten)fromtheCambrianarenotnecessarilyworsethanequivalentsedimentarysettingsofJurassicorEoceneage.Lagerstättenofspecifictypesmaythenbetreatedascomparablesnapshotsofthetruediversityoflifeatparticulartimesandinspecificenvironments/regions,sincetheyincludesoftpartsandentirelysoft-bodiedorganismsthatareotherwisemissed.Theymaythenactasstandardsagainstwhichother,moretypical,deposits(thosethatdonotpreservesoftpartsandsoft-bodiedorganisms)maybecompared.Thismaybeafruitfulapproach(AllisonandBriggs,1993;Chapter3herein)anditcanprovideasemi-quantitativeassessmentofhowthequalityof'normal'fossildepositshasvariedthroughtime.
ComparinglikewithlikeneednotstopatLagerstätten.Certainotherkindsoffossilaccumulationsmaybetreatedasequivalentandunaffectedbytime-relateddestructivephenomena(seealsoChapters1,5,11herein).Forexample,coquinas,orwinnowedaccumulationsoffossilshells,maysurviveinequallyunmetamorphosedanduncrushedconditionfromtheearlyPalaeozoicandthelateCenozoic.KidwellandBrenchley(1996)foundnodiminutionofthequalityofpreservationbackwardsintimewhentheycomparedlargesamplesofOrdovician-Silurian,Jurassic,andNeogenecoquinas.Theydidfindothertime-relatedtrends,someofthemactuallymakingtheMesozoicfossilrecordpoorerthanthePalaeozoic,forexampleadramaticincreaseinthediversityandeffectivenessofpredatoryorganismsthatcrushshells,andincreasesinthediversityoforganismsthatburrowandborethroughsea-bedsediments.Further,inlinewiththeevolutionofnewandever-morefiendish

15
groupsofshell-crushersandshell-borers,mostshellsofthepotentialpreybecamethicker,andhencetheyoungercoquinasarethemselvesthicker(moreandthickershellsareintroducedintotheshellbeds),buttheyarealsoprobablymoretime-averaged(thatis,representingalongertimeperiodofaccumulation).
Historicaltestsofthecompletenessofthefossilrecord
Historicalapproachesmayalsobehelpful.The'collectorcurve'(Fig.8)isausefulapproachthatisoftenusedinecology,anditmaybeusedinvariouspalaeontologicalstudies.Thistechniquewasdevisedasatime-savingapproachtohelpfieldecologistsdecidewhentostopcollectingspecimens.Aprimaryrequirementofanecologicalsurveyistoproducealistofallthespeciesinanarea.Atfirst,thecollectinggoeswell,andmostspecimensthatarepickeduprepresentadditionstothelist.Intime,the'hit'ratedeclines,anditbecomesharderandhardertofindanewspeciesthathasnotalreadybeenidentified.Thecollectorcurvesimplyquantifiesthecollectingeffort(assessedasnumberofspecimenspickedup,ortime)againsttheidentificationsofnewspecies.Whentheratedeclinesmarkedly,itisassumedthatthecollectorisapproachingthetruetotaldiversity,andhethendecidestostopcollectingatthe90%or95%level:theeffortrequiredtofindtheverylastspeciesinanareamightwellequaltheeffortexpendedinfindingalltheothers.
Figure 8. The basic collector curve is a way of estimating when to stop collecting. At first, the 'effort' devoted to collecting is richly rewarded with discoveries of new species, but as the collector approaches the maximum possible total (dashed line), the effort expended to find a new species increases dramatically.
Palaeontologistscanreadilyusesuchanapproachwhencollectingfossilsfromanewlocality.Thisalsoprovidesatechniqueforstandardizingcollectingeffortwhenapalaeontologistisattemptingtodrawuprangechartsandassessmentsoftherelativeabundanceofparticulargroupsthroughasection.Thecollectorcurvemayalsoprovideanapproachtoassessingthequalityofthefossilrecord.
MaxwellandBenton(1990)suggestedthat,givenenoughtime,allthefossilsthatareoutthereintherockswillbecollected.Thissampleoffossilsintherocksdoesnot,ofcourse,representallofthelifeofthepast,sincemultitudesofspeciesmusthavecomeandgone,andyetneverhavebeenfossilized.Nonetheless,thoseorganismsthatwerefossilizedarepotentiallyknowable.Ofcourse,liketheecologistsettingouttocompileafaunallistonanewtropicalisland,thepalaeontologisthastoexertevermoreefforttofindthoselastrarespecimens(seeChapter8).

16
Figure 9. Collector curves and discovery of dinosaurs in Europe (a) and China (b). In Europe, the rate of recovery of new dinosaurs has been fairly static since the 1920s, and perhaps all the species that are in the rocks to be found have been found. In China, on the other hand, collecting began 100 years later, in the 1920s, and the rate of determination of new species increased in the 1970s, with an equivocal flattening in the 1990s.
Large-scalepalaeontologicalcollectorcurvesmaybecompiledinvariousways.Onesimpleapproachistouseyearsofstudyasthemeasureofeffort(sinceitwouldbehardtocountaccuratelythenumbersofspecimenspalaeontologistshaveinspected,andperhapsdiscarded),andthentocounttherateofaccretionofnewspecies.Onecaveatisthattherateofaccretionofnewspeciescanbedistortedhorriblybyanenthusiasticsplitter(ataxonomistwhonamesspeciesbasedonsmalldifferences).
Oneexampleisapreliminarystudyoftherateofdiscoveryofnewdinosaurs(Fig.9).Here,theeffortscalerunsfrom1824,thedateofpublicationofthefirstformaldinosaurname,Megalosaurus,byWilliamBuckland,upto1990.The'newspecies'axisrepresents'netnewspecies',thatis,actualnewspeciesnamed,minusthosenewspeciesthatwerelatersynonymised.Iftheliteralnumberofnewspecieshadbeenplotted,thefinaltotaldiversitywouldhavebeenmuchhigher,butanyinterpretationswouldthenhavebeenbasedpartlyonfantasy.Admittedly,thereisnoguaranteethatlatersynonymieswerealwaysjustified,northatallcurrentlyaccepteddinosaurnamesareactuallyvalid.Inaddition,thesynonymyratefallsofffornewerdinosaurnamessincethesehavenotallgonethroughthenormalprocessesofreassessmentbyotherworkers.
Dinosaursfromtwobroadregionsareshown,thosefromEurope(Fig.9a),andthosefromChina(Fig.9b),approximatelyequivalentareasoftheEarth'ssurface,andthuspotentiallyroughlyequallylikelytoyielddinosaursofdifferentkinds,andpotentiallylikelytoyieldcomparabletotalnumbersofdinosaurspecies.Intuitively,palaeontologistswouldexpectEuropetobea'mature'regionintermsofthediscoveryofnewspeciesofdinosaurs,sincethefirstfindsweremadethere,andthereisarecordofnearly200yearsofcollectioningenerally

17
populousareasthatareactivelycombedbylargenumbersofcollectorsandacademics.China,ontheotherhand,isamerejuvenile,sincethefirstdinosaurswereidentifiedthereonlyinthe1920s,muchoftheareaisremote,andtherehavebeenfarfewercollectorsandpalaeontologistsinChinathaninEurope.Indeed,theintuitiveexpectationisborneout:theEuropeancollectorcurveshowsafullydevelopedlogisticpattern,andtherateofdeterminationofnewspeciesofdinosaurshasbeenlevellingoffsincethe1920s.InChina,ontheotherhand,thelongslowphaseofaccretion,fromthe1920stothe1960s,hasbeenfollowedbytheacceleratingphasesincethe1970s,andthereisonlyanequivocalhintofalevelling-offinthe1990s.ThesefiguresarealsorathermoreimmaturethantheEuropeantotals,sincemorerevisionandsynonymyoftheChinesematerialmayoccurinthefuture.Upto1990,about220speciesofdinosaurshadbeenidentifiedfromEurope,and160speciesfromChina.CanChinesepalaeontologistsexpecttopushtheirtotalsto220,orevenhigher?Untilthelogisticcurvedefinitelybeginstobendover,no-onecantell!
Thehistoricalapproachwasused,inaslightlydifferentform,inMaxwellandBenton's(1990)assessmentofthefossilrecordoftetrapods,andinSepkoski's(1993)assessmentofthefossilrecordofmarineanimals.Intheformercase,thehistoricaltimespanunderinvestigationranfrom1900to1987,andespecially1966to1987.Inthelattercase,thetimespanwas1982to1992.Thepremiseinbothcaseswasthesame,thatmanychangeshadoccurredinourknowledgeofthefossilrecord(newspecimens,revisedstratigraphy,revisedtaxonomy),buthadthesehadasignificanteffectonpalaeontologicalknowledgeasawhole?Inbothstudies,itwasshownthatthechangeswererandomlydistributedwithrespecttotimeandmajorclades:inotherwords,manychanges,buttheoverallpatternstaysthesame.Specificchangeswerethatoveralldiversityincreased,andthatextinctioneventsbecamesharper(asnewfossilswerefoundthatfilledgaps).Thefossilrecordis,then,goodenoughtoreadempirically,asavalidindicatorofthetruehistoryoflife.Buthowmuchchangehastherebeen?
MaxwellandBenton(1990)hopedthatpalaeontologicalknowledgewasimproving.They,andSepkoski(1993),wereonlyabletoshow,however,thatpalaeontologicalknowledgewaschanging.Perhapsallthenewfossils,newstratigraphies,andnewtaxonomieswereactuallymakingthingsworse.Howcoulditbeshownthatthechangesinknowledgeweretendingintherightdirection,towardsafullknowledgeofthefossilrecord?Thisrequiredadifferentapproach,theuseofsomeexternalyardstick,andluckilysuchayardstickexists.
Phylogenetictestsofthecompletenessofthefossilrecord
Thefossilrecordmaybetestedagainstcladisticandmolecularphylogenies,sincephylogeniesareindependentofstratigraphy.Cladogramsareconstructedbythesearchforpatternsinthedistributionofcharactersamongfossilorlivingorganisms(Platnick,1979),andthereisnotestofgeologicalageintheassessmentofacharacterorataxon.Likewise,molecularphylogeniesarebasedoncomparisonsofsequenceorgeneralsimilaritydata,andstratigraphyisnotinvolved.Thismeansthattheorderanddistributionoffossilsintherocksmaybecomparedwithmorphologicalcladogramsormolecularphylogenies,andtheseindependentsourcesofdataonthetruephylogenyoflifemaybeassessedforcongruence(Benton,1994,1995b;BentonandHitchin,1996,1997).

18
Figure10.Techniquesforassessingthequalityofthefossilrecord.Comparisonsaremadebetweenbranchingorderincladogramsandstratigraphicdata(A-E),andbetweentherelativeamountofgapandtheknownrecord(E).Theexampleisacladogramwithnineterminalbranches(A-I).Forcomparisonsofcladeorderandageorder,cladisticrankisdeterminedbycountingthesequenceofprimarynodesinacladogram(A):nodesarenumberedfromone(basalnode)upwardstotheultimatenode.Incasesofnon-pectinatecladograms(A),thecladogramisreducedtopectinateform(B),andgroupsoftaxathatmeetthemainaxisatthesamepointarecombinedandtreatedasasingleunit.Thestratigraphicsequenceofcladeappearanceisassessedfromtheearliestknownfossilrepresentativeofsistergroups,andcladerankandstratigraphicrankmaythenbecompared(C).MatchingofcladerankandstratigraphicrankmaybetestedbySpearmanrankcorrelation(SRC).SRCcoefficientsmayrangefrom1.0(perfectcorrelation)through0(nocorrelation)to-1.0(perfectnegativecorrelation).Forassessingtheproportionofghostrange,orminimumimpliedgap(MIG),andknownstratigraphicrange,thewholecladogramisused(E).MIG(diagonalrule)isthedifferencebetweentheageofthefirstrepresentativeofalineageandthatofitssister,asoldestknownfossilsofsistergroupsarerarelyofthesameage.TheproportionofMIGtoknownrangeisassessedusingtherelativecompletenessindex(RCI),accordingtotheformula:Σ(MIG)RCI=(1-)x100%.Σ(SRL)RCIvaluesmayrangefrom100%(noghostrange)through0(ghostrange=knownrange)tohighnegativevalues(ghostrange>>knownrange).Stratigraphicconsistencyisassessed(D,E)asacomparisonoftheratioofnodesthatareyoungerthan,orofequalageto,thenode

19
immediatelybelow(consistent),comparedtothosethatareapparentlyolder(inconsistent).Thestratigraphicconsistencyindex(SCI)isassessedonthefullcladogram(D,E).SCIvaluesrangefrom1.0(allnodesstratigraphicallyconsistent)to0(nonodesstratigraphicallyconsistent).BasedondatainBentonandHitchin(1997).
Theassessmentmetrics.Thereareavarietyofmetricsforcomparingphylogeniesandfossilrecords(Fig.10);Spearmanrankcorrelation(SRC),therelativecompletenessindex(RCI),andthestratigraphicconsistencyindex(SCI).SRCisanestablishednonparametricstatisticaltest,andithasbeenusedincomparingtheorderoffossilsintherockswiththeimpliedorderofappearanceofgroupsbasedonthesequenceofnodes(branchingpoints)inacladogram.ThefirstapplicationsoftheSRCtestforthispurposewerebyGauthieretal.(1988)andNorellandNovacek(1992a,b).
TheRCIwasproposed(Benton,1994;BentonandStorrs,1994)asanadditionalmetricthattookaccountoftheactualtimespansbetweenbranchingpoints,andofimpliedgapsbeforetheoldest-knownfossilsoflineages.Sistergroups,bydefinition,originatedfromanimmediatecommonancestor,anddivergedfromthatancestor.Thus,bothsistergroupsshouldhavefossilrecordsthatstartatessentiallythesametime.Inreality,usuallytheoldestfossilofonelineagewillbeolderthantheoldestfossilofitssisterlineage.Thetimegapbetweenthesetwooldestfossilsisthe'ghostrange'orminimalcladistically-impliedgap.TheRCIassessestheratioofghostrangetoknownrange,andhighvaluesimplythatghostrangesareshort,andhencethatthefossilrecordisgood.
[Ithasbeensuggested(Paul,1992;Wagner,1995)thatghostrangesmaybeanartefactofthecladistictechnique,whichassumesthatsistertaxagenerallyoriginateatthesametime(bydichtomousbranching).Ifonesisterincludesancestorsoftheother,however,andbranchingoccursaftertheoriginofoneofthesistertaxa,theghostrangemightdisappear,andhencetheRCItechniquewouldbeinvalid.Itisnotclearwhethertheancestormodelappliestoamajorityofcasesornot.Certainly,thecriticismofghostrangesisnotvalidforgroupsanalysedatlowtaxonomiclevelswherethefossilrecordispatchy,sincethetaxaavailableforanalysisarenecessarilyonlyasampleofallthosethateverexisted,andthechancesofhittingonatrueancestoraresmall.Thisisprobablythecaseforthevertebrates,echinoderms,arthropods,andothergroupsforwhichcladogramsareabundant,andonwhichwehavebasedourtests.Ontheotherhand,manyfossilmolluscsandforaminiferamaybeancestorsofotherknownforms,andtheRCItechniquewouldnotperhapsworkforthem.Ifmostsistertaxasplitatasinglepointoforigin,asassertedbycladists,thenthetechniqueworks.]
TheSCIwasproposedbyHuelsenbeck(1994)totesthowwellthenodesincladogramscorrespondedtotheknownfossilrecord.Nodesaredatedbytheoldestknownfossilsofeithersistergroupsubtendedfromthenode.Eachnodeiscomparedwiththenodeimmediatelybelowit.Iftheuppernodeisyoungerthan,orequalinageto,thenodebelow,thenodeissaidtobestratigraphicallyconsistent.Ifthenodebelowisyounger,theuppernodeisstatigraphicallyinconsistent.TheSCIforacladogramcomparestheratioofthesumsofstratigraphicallyconsistenttoinconsistentnodes.SCIvaluescanindicatecladogramswhosenodesareallinlinewithstratigraphicexpectationsthroughtocladogramsthatimplyasequenceofeventsthatisentirelyoppositetotheknownfossilrecord.
Thesemetricsmaybeappliedtoindividualphylogeneticproblems-thatis,whichofthesetencladogramsofmarsupialrelationshipsprovidesthebestfittocurrentstratigraphicevidence?-ortheymaybeusedtoassesslargesamplesofcladograms.Inthecasestobepresentedhere,

20
thelatterapproachisused.Theassumptionhereisthatvariationsincladisticormoleculartechniques,variationsintaxiclevel,andstratigraphicvariationsaresubsumedintheoverallvariationwithinalargesample.Sofar,thesampleofcladogramsassessedinthesewaysamountsto384,composedof174cladogramsoftetrapods,147cladogramsoffishes,and63cladogramsofechinoderms(BentonandHitchin,1996,1997;seealsohttp://palaeo.gly.bris.ac.uk/palaeo/cladestrat.html).
Testingfossilrecordquality:branchingorder.Thekeyquestiontobeansweredbythisregimeoftestingiswhetherthefossilrecordisgoodenough.Firstresultswereencouraging:NorellandNovacek(1992a)foundthat18outof24testcasesoffamily-levelandgeneric-levelcladogramsofvertebrates(75%)gavestatisticallysignificant(P<0.05)correlationsofcladeandagedata,usingtheSRCtest.Inlargersamples,NorellandNovacek(1992b)foundsignificantcorrelationin24of33testcases(73%),whileBentonandStorrs(1994)foundsignificantcorrelationin41of74testcases(55%).Inotherwords,fortetrapods,therewasapparentlygoodagreementbetweenstratigraphicandcladisticevidenceinmostcases.
Subsequentassessments,however,basedonlargersamplesofcladograms,providedmoredisappointingresults.Forechinoderms,BentonandHitchin(1996)foundthatonly24outof63cladograms(36%)showstatisticallysignificant(P<0.05)matchingofcladerankandagerankdata.Forfishes,thefigureis37outof147cladograms(25%),andfortetrapods,87outof174cladograms(50%).Theresultsforallcladogramsinthetestsampleisthat148outof384showedsignificantSRCvalues(38%).Doesthismeanthatonlyaminority,somethingfromone-quartertoone-half,ofcladogramsarecongruentwithfossilrecords,thatthefossilrecordisequallylikelytogivethewrongorderoffossilsasitistogivethecorrectorder?
Twopointsmaybemade.ThecomparisonsbyBentonandHitchin(1996)weremadeonlargesamplesofcladograms,andtheseincludedsomecategoriesofcladogramthatperformedbadlyintheSRCtest(BentonandHitchin,1997):
(1)Cladogramsbasedonspeciesorgenera.Taxonomicallylow-levelcladogramsgenerallygaveverypoormatchestostratigraphy,largelybecausethefossilrecordswerenotadequate.Oftenonlyoneortwooutoftenorfifteengenerahadanyfossilrepresentatives.
(2)Rejectedcladograms.Oursampleofcladogramswascomprehensive,andweincludedanumberofcladogramsthathadbeenpublishedaspossible,butnotpreferred,solutions.Manyoftheseperformedbadly.
(3)Cladogramswithsmallnumbersofterminaltaxa.Whenthereareonlyfourorfiveterminaltaxa,theSCIinparticularhasonlytwoorthreenodestocomparewiththebasalnode.Thesequencehastobeperfectinordertoachieveagoodresult,andonemismatchgivesaverylowvalue.FortheSRCtestalso,cladogramswithfewerthanfiveorsixterminaltaxamusthaveaperfectmatchofthesequencesofcladeandageorderbeforetheyproduceastatisticallysignificantcoefficient.ForboththeSCIandSRCmetrics,acceptablescoresmaybeachievedbylargercladogramseveniftherearesomemismatches.
Testingfossilrecordquality:RCIandSCImetrics.Thetestsofthequalityofthefossilrecordsofechinoderms,fishesandtetrapodsusingtheSRCstatisticweredisappointing.However,muchbetterresultswereobtainedwiththeRCIandtheSCImetrics(BentonandHitchin,1996,1997).ItmayseemunusualthatmanycladogramsthatapparentlyfailedtheSRCtestofmatchingbetweenageandcladedatashouldpasswithanothermetric.ThereasonisthattheRCIandtheSCImeasuredifferentaspectsofcladogramandfossilrecordquality,andperhaps

21
theSRCtestistooindiscriminateformanypurposes.TheSRCsimplycomparesrawordersoffossilsandbranchingpoints.Ittakesnoaccountoftheoverallamountsoftimeinvolved,norespeciallyoftheseriousnessofamismatch.WefoundthatmanycladogramsfailedtheSRCtestbecausetheyhadmanynodespackedwithinanarrowtimeband.Someofthenodeswereoutofsequencebyonly1-2Myrorless,whichisaninsignificantamountoftimeinmostanalyses.
Forallthreegroupsassessed,mostcladogramshaveRCIvaluesequalto,orgreaterthan,0.5,thanvalueslessthan0.5(Fig.11).Thepassratesare49outof63cladograms(78%)forechinoderms,124outof147cladograms(84%)forfishes,and128outof174cladograms(74%)fortetrapods(Fig.12).Thepassrateforallcladogramswas78%.Inotherwords,301ofthe384cladogramstestedhavemorethantwiceasmuchoftheirrangesrepresentedbyfossilsthanrepresentedbyghostrange.ThedifferencesinmeanvaluesofRCIforechinoderms(mean,62.3%)andfishes(mean,69.4%)aremodest,butcontinentaltetrapodshaveamuchlowervalue(mean,49.8%).
Figure 11. Assessments of congruence between stratigraphic and cladistic data show highly skewed distributions. Values for three metrics calculated on a sample of 384 cladograms of echinoderms, fishes, and tetrapods: Spearman rank correlation (SRC) coefficients (a), measures of the significance of those SRC coefficients, which take account of cladogram size (b), relative completeness index (RCI) values (c), and stratigraphic consistency index (SCI) values (d). Mean values for each sample are indicated by dotted lines. Based on data in Benton and Hitchin (1997).

22
ThepassratesaresimilarlyfavourablefortheSCImeasure(Fig.11).Inthesecases,allthreesetsofcladogramshavesignificantlymorethanhalftheirnodesshowingstratigraphicconsistencythaninconsistency.Thepassratesare60outof63cladograms(95%)forechinoderms,102outof147cladograms(69%)forfishes,and152outof174cladograms(87%)fortetrapods(Fig.12).Thepassrateforallcladogramsis82%,basedon314ofthe384cladograms(theSCImetriccouldnotbecalculatedfor70smallcladogramsinthefullsample).ThereasonsforsignificantlyhigherSCIvaluesforechinoderms(mean,0.78)thanfishes(mean,0.55)andtetrapods(mean,0.66)arenotimmediatelyevident.
Figure 12. Summary of the metrics for comparison of cladogram data and stratigraphic age data. Metrics indicated are Spearman Rank Correlation (SRC) of age and clade data, the Relative Completeness Index (RCI), based on comparisons of known and implied stratigraphic ranges, and the Stratigraphic Consistency Index (SCI) of nodes in cladograms. The metrics have been applied to large samples of cladograms (n, number of cladograms in sample) for echinoderms, fishes, and tetrapods. Comparisons are between singificant and non-significant SRC coefficients, and between frequencies of values of the RCI above and below 50%, and frequencies of values of the SCI above and below 0.5. The differences in values among the three groups are significant, based on comparison of the binomial error bars. Based on data in Benton and Hitchin (1996).
TheresultsoftheRCIandSCImetricsshowthatfossilrecordsareonthewholegoodforechinoderms,fishesandtetrapods.Comparisonsamongthethreegroupsshowsthatnoneofthemconsistentlyhasabetterfossilrecord,orbettercladisticresolution,thantheothers.Eachoftheanimalgroupsunderstudycouldbesaidtohavethebestfossilrecordsinceeach

23
issupportedbyoneofthethreetests:tetrapodsbySRC,fishesbyRCIandechinodermsbySCI(Fig.12).Onlyonegroupcomesoutworstontwoofthetests:fisheshavethepoorestshowingaccordingtotheSRCandSCImetrics.TetrapodshavetheworstfossilrecordsaccordingtotheRCImetric,whileechinodermsarenotworstofthethreeanimalgroupsaccordingtoanyofthemetrics.
Comparingcontinentalandmarinehabitats.BentonandSimms(1995)obtainedsomecounter-intuitiveresultswhentheyshowedthatcontinentaltetrapodshaveafossilrecordthatisasgoodas,orbetterthan,thatofechinoderms,basedoncomparisonsofresultsobtainedwiththeSRCandRCImetrics.Thisshockingresultcouldnothavebeenpredictedfromobservationsofthefieldoccurrenceofbothgroups:tetrapodsarefoundinsporadicandunpredictablesedimentarysettings,whileechinodermremainsarehugelyabundantinmanymarineshelfdeposits.
AmoredetailedcomparisonofSRC,RCIandSCImetricsforallmarinecladogramsandallcontinentalcladogramsyieldedmixedresults(BentonandHitchin,1996;Fig.13).TheSRCtestshowedthat87outof174continentalcladograms(50%)hadsignificantmatchingofageandcladeorder,whilethevalueformarinegroupswasonly61outof210cladograms(29%),muchworsethantheresultsforechinodermsalonereportedbyBentonandSimms(1995).ThepassrateforRCIvalueswasmuchmorecomparable,with173ofthe210marinecladogramsyieldingvalueshigherthan50%(82%),comparedto128of174continentalcladograms(74%).Meanvaluesconfirmedthatmarinecladogramsshowalowerproportionofimpliedgaps(meanRCI,67.3%)thandocontinentalcladograms(meanRCI,49.8%).ThepassrateforSCIvalues,ontheotherhand,favouredthecontinentalcladograms,where152of174cladogramshadvaluesequalto,orbetterthan,0.500(87%),comparedto162ofthe210marinecladograms(77%).Meanvaluessuggestedthatcontinentalcladograms(meanSCI,0.66)performslightlybetterthanmarinecladograms(meanSCI,0.62)intheSCItest.
Thefindingthatcontinentalvertebrateshaveafossilrecordofsimilarqualitytomarineechinodermsandfishessuggeststwoobservations.(1)Therelativeabundanceofspecimensatindividualfossillocalitiesisnoindicatorofthecompletenessoftheirfossilrecordonalargescale:thisdependsonthenumberofstratigraphichorizonsthathaveyieldedfossils,andonthepackingofthosehorizonsintime.(2)Thefossilrecordofcontinentaltetrapodshasprobablybeenmoreintensivelystudiedthanhasthatofechinoderms,andindeedfishes.Hence,currentknowledgeofthetetrapodfossilrecordisnowhigheronthecollectorcurve(numbersoftaxavs.effort),andmaybeassumedtoapproachclosertothelevelofcompletesamplingandfullknowledgeofallfossiltaxathatexistintherocks.

24
Figure 13. Summary of the metrics for comparison of cladogram data and stratigraphic age data. Comparisons of cladograms of marine (echinoderm + fish) and continental (tetrapod) cladograms according to the SRC, RCI and SCI metrics. The differences in values among the three groups are significant, based on comparison of the binomial error bars. Abbreviations as in Fig. 12. Based on data in Benton and Hitchin (1996).
Comparingchangesinknowledgeofthefossilrecord.TheSRCandRCImetricshavebeenusedtocomparehistoricalaspectsoftheunderstandingofthefossilrecord.Itmightbeexpectedthattheadditionofnewfossilfindsandreanalysisofolderoneswouldimprovethefitofagedatatoafixedsampleofcladograms,bythefillingofgaps,andcorrectionsofformertaxonomicassignments.However,inacomparisonofa1967dataset(Harlandetal.,1967)andonefrom1993(Benton,1993),BentonandStorrs(1994,1996)foundnochangeatallintheproportionsofcladogramsthatshowedstatisticallysignificant(P<0.05andP<0.01)matchingofcladeandageorder,althoughtherehadbeenachangeinthestatusof28ofthe71cladogramscompared(39%;Fig.14herein).Inotherwords,asaresultof26yearsofwork,newdiscoveriesandreassignmentshadimprovedthefitin20%ofcases,buthadcausedmismatchesofcladeandagedatainafurther20%ofcases.Sometimes,anewfossildoesnotfillagap,butcreatesadditionalgapsonotherbranchesofacladogram.

25
Figure 14. Relative improvement in fossil record quality from 1967 (Harland et al., 1967) to 1993 (Benton, 1993). During these 26 years, gaps in the record were filled, and there is a clear shift in the distribution of RCI (relative completeness index) values to the right from 1967 to 1993, indicating improvement in palaeontological knowledge (significant shift at P < 0.05; t-test and non-parametric signs and Wilcoxon signed ranks tests). Based on data in Benton and Storrs (1994).
Thisdiscoveryofalackofimprovementinthecongruenceofcladevs.agerankorderisimportant,sinceithighlightsthefactthatmismatchesmayarisefromsubtlechangesinknowledge.Non-correlationmayresultfromminorvariationsinfossildating,andmaynotimplywildlydifferentevidenceaboutthehistoryoflifefromcladogramsandfromfossiloccurrences.
TheRCImetric,however,detectedasignificantimprovementinknowledgeofthetetrapodfossilrecordfrom1967to1993.Intheirstudyofcladogramsofvertebrates,BentonandStorrs(1994,1996)foundthatthemeanRCIvalueshiftedfrom67.9%to72.3%,astatisticallysignificantdifference,accordingtoaWilcoxonsignedrankstest(P=0.026).Inotherwords,comparisonsoftherelativecompletenessofcladogramsshowsasignificantimprovement,byabout5%,inknowledgeofthefossilrecordoverthepast26yearsofresearch.Hence,newfossildiscoveries,andreassignmentsofolderones,dopositivelyaffecttheamountofghostrange,althoughsuchchangesinknowledgedidnotapparentlyaffectthematchofcladeandagerankorder,asassessedbytheSRCtest.
CONCLUSIONS
Theadequacyofthefossilrecordishardtoassess,asthevariouscontributionsinthisbookindicate.Inastrictsense,itwillneverbepossibletoassesstheadequacyofanysegmentofthefossilrecord,sincethetruepicturewillbeforeverunknown.Perhapstherehavebeenwholephyla,orevenkingdoms,ofextraordinaryorganismsthatlivedatdifferenttimesinthepast,butwhichhaveleftnofossilindications.Onecouldimaginewholetribesofgiantpurplewormswithbodies100metreslong,squirmingaroundonCarboniferousforestfloors,oranentirelyunknownkingdomofphotosynthesisingorganismsthatlivedinCambrianseasandmovedbymeansoffloppywheelsmadefromprotoplasm.Suchorganismsarenotimpossible,buttheyareunlikely.Theunlikelihoodincreasesday-by-dayasevermorepalaeontologicaleffortfailstoturnupanyhintofsuchunknownmajorgroupsofmacroscopicorganisms.
Thereareavarietyofpowerfulnewtechniquesforassessingthequalityofthefossilrecord.Oneapproachistoadoptauniformitarianapproachtospecifickindsoffossil-preservationsites,andtocomparelikewithlikeacrossvastspansofgeologicaltime.Thekindofintuitive

26
argumentpresentedinthepreviousparagraphrepresentsasecondapproach,wherethepatternofdiscoveryoverresearchtimeisinvestigated.Itisstatisticallyvalidtoquantifyeffortagainstdiscoveryrate,andtoassertthatthelongersomeunknownorganismremainsundiscoveredthelesslikelihoodthereisofitsformerexistence.(Thisstatementassumesthatthereisapremiumattachedtofindingsuchanunknownorganism,andthisiscertainlyverymuchthecase.)
Thethirdnewapproach,comparingphylogeneticandstratigraphicevidencetoassessingtheadequacyofthefossilrecord,hasbeenappliedwithconsiderablesuccesstovertebrates.Thisapproachisbasedontheobservationthatphylogenies(cladogramsfoundedonmorphologicalcharactersandmolecularphylogenies)areconstructedindependentlyofgeologicalevidence.Theorderandtimingofsplittingeventsinphylogeniesmaythenbecross-comparedwithstratigraphicevidenceontheorderandtimingoftheappearanceofgroupsinthefossilrecordinordertoassessthedegreeofcongruence.Goodmatchingofthedatasetsimpliesthatboththefossilrecordandthephylogenyareprobablygood,whileamismatchimplieseitheramisleadingfossilrecordoraninaccuratephylogenetichypothesis.
Thephylogeneticcongruenceassessmentshaveindicatedthatthereisnoevidencethatvertebrateshaveafossilrecordthatiseitheranybetter,orindeedanyworse,thanthatofanyothermajorgroupofanimals.Inaddition,thereisnoevidencethattherecordofcontinental(thatis,terrestrialandfreshwater)tetrapodsisworsethanthatofmarineechinodermsorfishes.Thesekindsofassessmentshaveprovedhighlyfruitful,andtheyprovideasoundquantifiedanswertotheoldcryof'thefossilrecordisprettyincompleteanduninformative'.
ACKNOWLEDGEMENTS
IthankGillesCuny,SteveDonovan,BeckyHitchin,ChrisPaulandDavidUnwinforcommentsonthisMS,andtheLeverhulmeTrust(GrantF182/AK)forfunding.
REFERENCES
Allen,K.C.andBriggs,D.E.G.1989.Evolutionandthefossilrecord,BelhavenPress,London,265pp.
Allison,P.A.andBriggs,D.E.G.1991.Taphonomy;Releasingthedatalockedinthefossilrecord,Plenum,NewYork,560pp.
Allison,P.A.andBriggs,D.E.G.1993.Exceptionalfossilrecord:distributionofsoft-tissuepreservationthroughthePhanerozoic,Geology,21,527-530.
Behrensmeyer,A.K.andHill,A.P.1980.Fossilsinthemaking:Vertebratetaphonomyandpaleoecology,UniversityofChicagoPress,Chicago,338pp.
Benton,M.J.1983.Progressionisminthe1850s:Lyell,Owen,MantellandtheElginfossilreptileLeptopleuron(Telerpeton),ArchivesofNaturalHistory,11,123-136.
Benton,M.J.1985.Massextinctionamongnon-marinetetrapods,Nature,316,811-814.
Benton,M.J.1989.Patternsofevolutionandextinctioninvertebrates,inEvolutionandtheFossilRecord,(Ed.K.C.AllenandD.E.G.Briggs),Belhaven,London,pp.218-241.

27
Benton,M.J.1990a.Thecausesofthediversificationoflife,inMajorEvolutionaryRadiations,(Ed.P.D.TaylorandG.P.Larwood),SystematicsAssociationSpecialVolume,42,ClarendonPress,Oxford,pp.409-430.
Benton,M.J.1990b.Vertebratepalaeontology,UnwinHyman,London,377pp.
Benton,M.J.1993.TheFossilRecord2,Chapman&Hall,London,839pp.
Benton,M.J.1994.Palaeontologicaldata,andidentifyingmassextinctions,TrendsinEcologyandEvolution,9,181-185.
Benton,M.J.1995a.Diversificationandextinctioninthehistoryoflife,Science,268,52-58.
Benton,M.J.1995b.Testingthetimeaxisofphylogenies,PhilosophicalTransactionsoftheRoyalSociety,SeriesB,348,5-10.
Benton,M.J.1996a.Onthenonprevalenceofcompetitivereplacementintheevolutionoftetrapods,inEvolutionarypaleobiology,(Ed.D.Jablonski,D.H.Erwin,andJ.H.Lipps),UniversityofChicagoPress,Chicago,pp.185-210.
Benton,M.J.1996b.Testingtherolesofcompetitionandexpansionintetrapodevolution,ProceedingsoftheRoyalSocietyofLondon,SeriesB,263,641-646.
Benton,M.J.1997a.Vertebratepalaeontology(2ndedition),Chapman&Hall,London,452pp.
Benton,M.J.1997b.Thehistoryoflife:largedatabasesinpalaeontology,inStatisticalmethodsinpalaeobiology,(Ed.D.A.T.Harper),Wiley,London,inpress.
Benton,M.J.1997c.Modelsforthediversificationoflife.TrendsinEcologyandEvolution,inpress.
Benton,M.J.andHarper,D.A.T.1997.Basicpalaeontology,Addison-Wesley,London,325pp.
Benton,M.J.andHitchin,R.1996.Testingthequalityofthefossilrecordbygroupsandbymajorhabitats,HistoricalBiology,12,111-157.
Benton,M.J.andHitchin,R.1997.Congruencebetweenphylogeneticandstratigraphicdataonthehistoryoflife,ProceedingsoftheRoyalSociety,London,SeriesB,inpress,
Benton,M.J.andSimms,M.J.1995.Testingthemarineandcontinentalfossilrecords,Geology,23,601-604.
Benton,M.J.andStorrs,G.W.1994.Testingthequalityofthefossilrecord:paleontologicalknowledgeisimproving,Geology,22,111-114.
Benton,M.J.andStorrs,G.W.1996.Diversityinthepast:comparingcladisticphylogeniesandstratigraphy,inAspectsofthegenesisandmaintenanceofbiologicaldiversity,(Ed.M.E.Hochberg,J.Clobert,andR.Barbault),OxfordUniversityPress,Oxford,pp.19-40.
Briggs,D.E.G.andCrowther,P.R.1990.Palaeobiology:asynthesis,BlackwellScientific,Oxford,583pp.

28
Carroll,R.L.1977.Patternsofamphibianevolution:anextendedexampleoftheincompletenessofthefossilrecord,inPatternsofevolutionasillustratedbythefossilrecord,(Ed.A.Hallam),Elsevier,Amsterdam,pp.405-437.
Carroll,R.L.1987.Vertebratepaleontologyandevolution,W.H.Freeman,SanFrancisco,698pp.
Chatterjee,S.1995.TheTriassicbirdProtoavis.Archaeopteryx,13,15-31.
Clarkson,E.N.K.1993.Invertebratepalaeontologyandevolution(3rdedition),Chapman&Hall,London,434pp.
Courtillot,V.andGaudemer,Y.1996.Effectsofmassextinctionsonbiodiversity,Nature,381,146-148.
Cowen,R.1990.Historyoflife,BlackwellScientific,Boston,470pp.
Donovan,S.K.1991.Theprocessesoffossilization,BelhavenPress,London,303pp.
Flessa,K.W.1990.The"facts"ofmassextinctions,GeologicalSocietyofAmerica,SpecialPaper,247,1-7.
Fürsich,F.T.1990.Fossilconcentrationsandlifeanddeathassemblages,inPalaeobiology;asynthesis,(Ed.D.E.G.BriggsandP.R.Crowther),BlackwellScientific,Oxford,pp.235-239.
Gauthier,J.,Kluge,A.G.,andRowe,T.1988.Amniotephylogenyandtheimportanceoffossils,Cladistics,4,105-209.
Harland,W.B.,Holland,C.H.,House,M.R.,Hughes,N.F.,Reynolds,A.B.,Rudwick,M.J.S.,Satterthwaite,G.E.,Tarlo,L.B.H.,andWilley,E.C.1967.Thefossilrecord;asymposiumwithdocumentation,GeologicalSocietyofLondon,London,827pp.
Hoffman,A.1985.Islandbiogeographyandpalaeobiology:insearchforevolutionaryequilibria,BiologicalReviews,60,455-471.
Huelsenbeck,J.P.1994.Comparingthestratigraphicrecordtoestimatesofphylogeny,Paleobiology,20,470-483.
Jablonski,D.1991.Extinctions:apaleontologicalperspective,Science,253,754-757.
Kidwell,S.M.1986.Modelsoffossilconcentrations:paleobiologicimplications,Paleobiology,12,6-24.
Kidwell,S.M.andBrenchley,P.J.1996.Evolutionofthefossilrecord:thicknesstrendsinmarineskeletalaccumulationsandtheirimplications,inEvolutionarypalaeobiology,(Ed.D.Jablonski,D.H.Erwin,andJ.H.Lipps),UniversityofChicagoPress,Chicago,pp.290-336.
MacArthur,R.H.andWilson,E.O.1967.Thetheoryofislandbiogeography,PrincetonUniversityPress,Princeton,203pp.

29
Maxwell,W.D.andBenton,M.J.1990.Historicaltestsoftheabsolutecompletenessofthefossilrecordoftetrapods,Paleobiology,16,322-335.
Norell,M.A.andNovacek,M.J.1992a.Thefossilrecordandevolution:comparingcladisticandpaleontologicevidenceforvertebratehistory,Science,255,1690-1693.
Norell,M.A.andNovacek,M.J.1992b.Congruencebetweensuperpositionalandphylogeneticpatterns:comparingcladisticpatternswithfossilrecords,Cladistics,8,319-337.
Paul,C.R.C.1992.Therecognitionofancestors.HistoricalBiology,6,239-250.
Platnick,N.I.1979.Philosophyandthetransformationofcladistics,SystematicZoology,28,537-546.
Raup,D.M.1979.Biasesinthefossilrecordofspeciesandgenera,BulletinoftheCarnegieMuseumofNaturalHistory,13,85-91.
Retallack,G.1984.Completenessoftherockandfossilrecord:someestimatesusingfossilsoils,Paleobiology,10,59-78.
Rieppel,O.1984.Theproblemofextinction,ZeitschriftfürZoologischerSystematikundEvolutionsforschung,22,81-85.
Romer,A.S.1966.Vertebratepaleontology(3rdedition),UniversityofChicagoPress,Chicago,468pp.
Rosenzweig,M.L.1975.Oncontinentalsteadystatesofspeciesdiversity,inTheecologyofspeciescommunities,(Ed.M.L.CodyandJ.M.Diamond),BelknapPressofHarvardUniversityPress,Cambridge,Mass.,pp.121-140.
Rosenzweig,M.L.1995.Speciesdiversityinspaceandtime,CambridgeUniversityPress,Cambridge,436pp.
Sadler,P.M.1981.Sedimentaccumulationratesandthecompletenessofstratigraphicsections,JournalofGeology,89,569-584.
Sansom,I.J.,Smith,M.M.,andSmith,M.P.1996.Scalesofthelodontandshark-likefishesfromtheOrdovicianofColorado,Nature,379,628-630.
Sepkoski,J.J.,Jr.1978.AkineticmodelofPhanerozoictaxonomicdiversity.I.Analysisofmarineorders,Paleobiology,4,223-251.
Sepkoski,J.J.,Jr.1979.AkineticmodelofPhanerozoictaxonomicdiversity.II.EarlyPhanerozoicfamiliesandmultipleequilibria,Paleobiology,5,222-251.
Sepkoski,J.J.,Jr.1984.AkineticmodelofPhanerozoictaxonomicdiversity.III.Post-Paleozoicfamiliesandmassextinctions,Paleobiology,10,246-267.
Sepkoski,J.J.,Jr.1993.Tenyearsinthelibrary:howchangesintaxonomicdatabasesaffectperceptionofmacroevolutionarypattern,Paleobiology,19,43-51.

30
Sepkoski,J.J.,Jr.1996.Competitioninmacroevolution:thedoublewedgerevisited,inEvolutionarypaleobiology,(Ed.D.Jablonski,D.H.Erwin,andJ.H.Lipps),UniversityofChicagoPress,Chicago,pp.211-255.
Skelton,P.1993.Evolution.Abiologicalandpalaeontologicalapproach,Addison-Wesley,Wokingham,1064pp.
Stauffer,R.C.1975.CharlesDarwin'snaturalselection.Beingthesecondpartofhisbigspeciesbookwrittenfrom1856-1858.,CambridgeUniversityPress,NewYork,694pp.
Valentine,J.W.1969.PatternsoftaxonomicandecologicalstructureoftheshelfbenthosduringPhanerozoictime,Palaeontology,12,684-709.
Wagner,P.J.1995.Stratigraphictestsofcladistichypotheses.Paleobiology,21,153-178.
Walker,T.D.andValentine,J.W.1984.Equilibriummodelsofevolutionaryspeciesdiversityandthenumberofemptyniches,AmericanNaturalist,124,887-899.