the published booklet may be downloaded here - wasa... the microscale modelling at the wasa ......
TRANSCRIPT
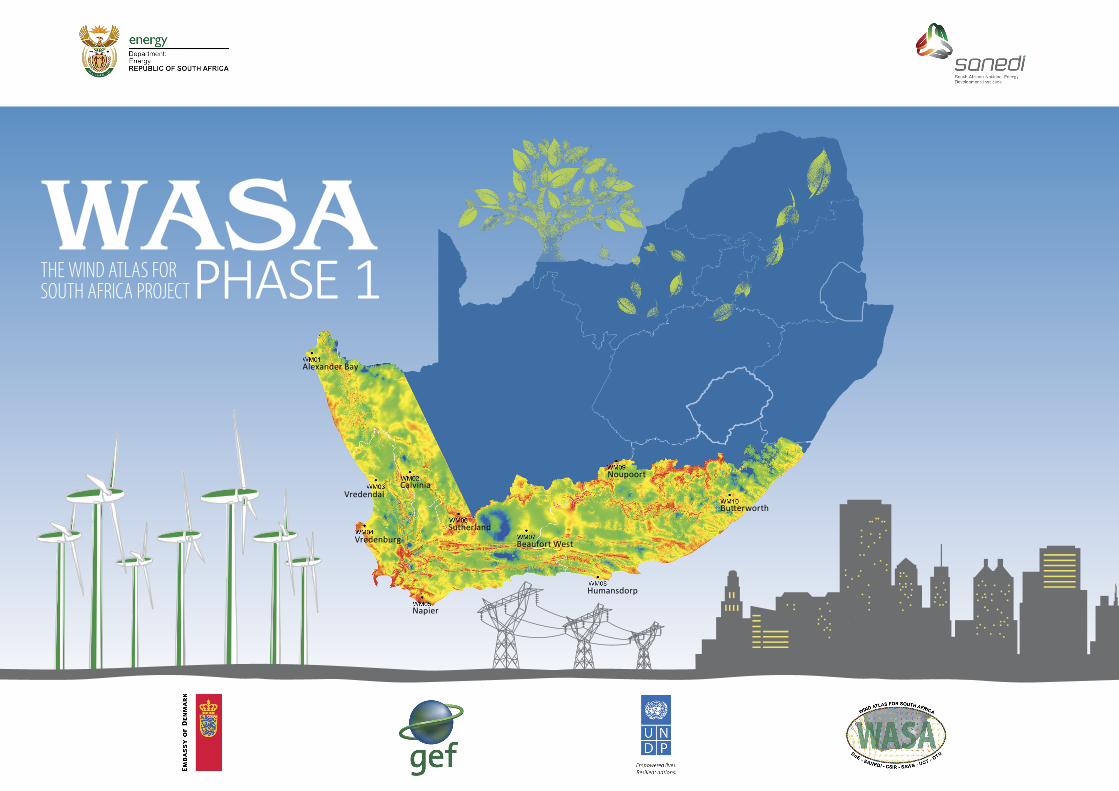
THE WIND ATLAS FOR SOUTH AFRICA PROJECTPHASE 1WASA
Alexander Bay
CalviniaVredendal
VredenburgSutherland
Napier
Beaufort West
Humansdorp
Butterworth
Noupoort

PUBLISHED BYSouth African National Energy Development InstituteAddress: Second Floor, Block E, 150 Linden Street, Strathavon, Sandton 2146
PRINTED IN SOUTH AFRICA BYImpumelelo Print Solutions (Pty) Ltd
WIND ATLAS FOR SOUTH AFRICA CONTACT DETAILSAddress: Second Floor, Block E, 150 Linden Street, Strathavon, Sandton 2146Tel: +27 (0)11 038 4300 Website: www.wasaproject.info
Copyright 2015 © Wind Atlas for South Africa Phase 1All rights reserved. No part of this publication may be reproduced, stored in a retrieval system or transmitted in any form or by any means, electronic, mechanical, photocopying, recording or otherwise, without the prior permission of the copyright holder. ISBN: 978-0-620-63781-7
DISCLAIMERThis document was prepared as an account of work done for the Wind Atlas of South Africa project. Neither the sponsors, the agency thereof, nor any of their employees or the authors make any warranty, expressed or implied, or assume any legal liability or responsibility for the accuracy, completeness or usefulness of any information, apparatus, product or process disclosed, or represent that its use would not infringe privately owned rights. Reference herein to any specific commercial product, process or service by trade name, trademark, manufacturer or otherwise does not necessarily constitute or imply its endorsement, recommendation or favouring by the sponsors or any agency thereof. The views and opinions of authors expressed herein do not necessarily state or reflect those of the sponsors or agency thereof.

i
WIND ATLAS FOR SOUTH AFRICA
Compiled by André OttoSouth African National Energy Development Institute2015
Wind Atlas for South Africa Phase 1
Phase 1
Wind Atlas for South Africaii
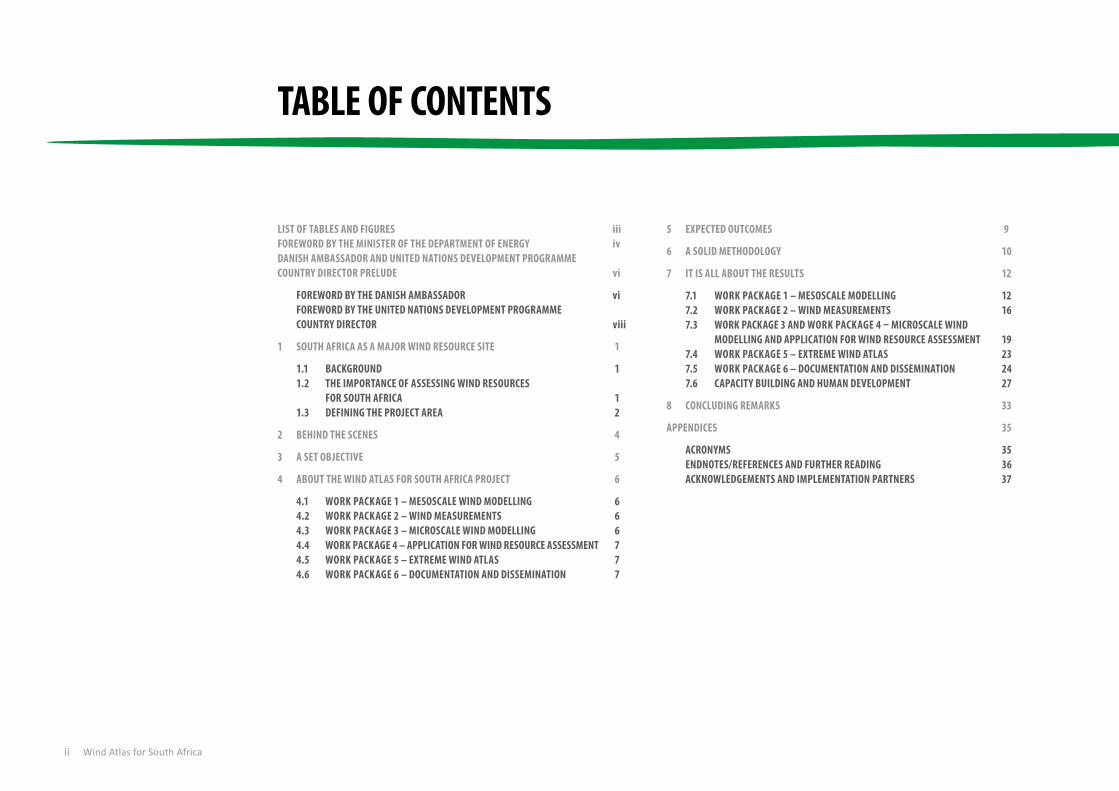
TABLE OF CONTENTS
LIST OF TABLES AND FIGURES iiiFOREWORD BY THE MINISTER OF THE DEPARTMENT OF ENERGY ivDANISH AMBASSADOR AND UNITED NATIONS DEVELOPMENT PROGRAMME COUNTRY DIRECTOR PRELUDE vi
FOREWORD BY THE DANISH AMBASSADOR viFOREWORD BY THE UNITED NATIONS DEVELOPMENT PROGRAMME COUNTRY DIRECTOR viii
1 SOUTH AFRICA AS A MAJOR WIND RESOURCE SITE 1
1.1 BACKGROUND 11.2 THE IMPORTANCE OF ASSESSING WIND RESOURCES FOR SOUTH AFRICA 11.3 DEFINING THE PROJECT AREA 2
2 BEHIND THE SCENES 4
3 A SET OBJECTIVE 5
4 ABOUT THE WIND ATLAS FOR SOUTH AFRICA PROJECT 6
4.1 WORK PACKAGE 1 – MESOSCALE WIND MODELLING 64.2 WORK PACKAGE 2 – WIND MEASUREMENTS 64.3 WORK PACKAGE 3 – MICROSCALE WIND MODELLING 64.4 WORK PACKAGE 4 – APPLICATION FOR WIND RESOURCE ASSESSMENT 74.5 WORK PACKAGE 5 – EXTREME WIND ATLAS 74.6 WORK PACKAGE 6 – DOCUMENTATION AND DISSEMINATION 7
5 EXPECTED OUTCOMES 9
6 A SOLID METHODOLOGY 10
7 IT IS ALL ABOUT THE RESULTS 12
7.1 WORK PACKAGE 1 – MESOSCALE MODELLING 127.2 WORK PACKAGE 2 – WIND MEASUREMENTS 167.3 WORK PACKAGE 3 AND WORK PACKAGE 4 – MICROSCALE WIND MODELLING AND APPLICATION FOR WIND RESOURCE ASSESSMENT 197.4 WORK PACKAGE 5 – EXTREME WIND ATLAS 237.5 WORK PACKAGE 6 – DOCUMENTATION AND DISSEMINATION 247.6 CAPACITY BUILDING AND HUMAN DEVELOPMENT 27
8 CONCLUDING REMARKS 33
APPENDICES 35
ACRONYMS 35ENDNOTES/REFERENCES AND FURTHER READING 36ACKNOWLEDGEMENTS AND IMPLEMENTATION PARTNERS 37

iii
LIST OF TABLES AND FIGURES
Description Page No.Table 1: WASA wind measurement masts data recovery 17Figure 1: Wind rose and wind speed distribution U for WM05 Napier at 62 m AGL 2Figure 2: WASA Phase 1 project area: Western Cape and parts of the Northern Cape and Eastern Cape provinces 3Figure 3: The WASA methodology 10Figure 4: Modelling scales and the making of a wind atlas 11Figure 5: VNWA for South Africa, based on WRF, launched in April 2014 (generalised wind climate – flat terrain, 3 km x 3 km grid spacing) 13Figure 6: A screenshot of the VNWA interface – Tadpole – using a Google Earth plug-in 13Figure 7: The WRF-based NWA shows good agreement with the wind speeds and wind direction distributions 14Figure 8: Comparison of the wind speed at 62 m AGL for WM01 15Figure 9: The 10 wind masts launched in September 2010 17Figure 10: The measured wind data is used to create the wind statistics 18Figure 11: Resolution is important for the real wind energy potential, as shown in this study by DTU Wind Energy (N.G. Mortensen) 19Figure 12: The microscale modelling at the WASA meteorological masts 20Figure 13: Large-scale high-resolution wind resource map launched in April 2014 (local wind climate, 250 m grid spacing) with the mean wind speed 21Figure 14: Large-scale high-resolution wind resource map launched in April 2014 (local wind climate, 250 m grid spacing) with the mean wind power density 22Figure 15: 1:50 years 10-minute wind speed (m/s) at 10 m AGL (standard conditions) 23Figure 16: 1:50 years 2-3 s gust speed (m/s) at 10 m AGL (standard conditions) 23Figure 17: User statistics of the WASA websites 25
List of Tables and Figures
Wind Atlas for South Africaiv
FOREWORD BY THE MINISTER OF THE DEPARTMENT OF ENERGY
The Department of Energy (DoE) initiated the Wind Atlas for South Africa (WASA) project to update the old wind atlas with the latest wind measurement technologies that are designed to incorporate terrain obstacles including buildings and trees. This was done in parallel to the rollout of the Renewable Energy Independent Power Producers Programme (REIPPP). The WASA project was completed using 10 wind measurement masts of 62 m which were installed across the Western Cape and parts of the Northern and Eastern Cape. To this end, the renewable energy efforts reached another critical milestone in 2014 with the finalisation of the WASA Phase 1.
The WASA project is one of the major outputs of the South African Wind Energy Programme (SAWEP) which the DoE has implemented from 2008. Financial and technical assistance from the Global Environment Facility (GEF) through the United Nations Development Programme (UNDP) and the government of Denmark ensured that this initiative was successfully implemented while bringing on board key stakeholders from industry, universities and governments.
The WASA project is also being implemented as a research and capacity-building initiative, hence the appointment of the South African National Energy Development Institute (SANEDI) as the Executing Partner. Dedicated key Implementing Partners, namely the Council for Scientific and Industrial Research (CSIR), the South African Weather Service (SAWS), the University of Cape Town (UCT) Climate System Analysis Group (CSAG), the Technical University of Denmark (DTU), and the Department of Wind Energy worked with the SANEDI to strengthen South Africa’s capacity to undertake wind resource measurements. We are proud to have been able to anchor the development of this critical skill at South African public institutions for the long-term planning of the large-scale exploitation of our abundant wind
resources. We are inspired by the partnership with the Danish government where the twinning arrangement between our respective institutions has fostered the transfer of skills.
The WASA project has achieved many significant milestones and this book embodies the spirit of ensuring that the WASA outputs are publicly accessible in order to level the playing field between large and small industry players. We are encouraged by 90% data recovery from all 10 of the wind measurement masts which ensured that we were already able to share three years of high-quality measurements by 2013. The WASA project was completed through a combination of physical measurements, modelling tools and databases.
On 31 July 2013, we launched the first large-scale high-resolution (250 m x 250 m grid spacing) wind resource map made from the WASA database. This map identifies wind hot spots or the best suitable sites for the location of wind farms. To this end, the WASA project offers significant cost- and time-saving benefits to planners, policy makers, the Energy Supply Commission (Eskom) and the wind industry. The WASA project has also produced an innovative extreme wind atlas which estimates extreme wind speeds with a 50-year return period to assist wind energy developers to make informed decisions when selecting wind turbines and designing wind farms around areas with relatively strong winds. Outside the energy sector, the built environment has found the extreme wind atlas equally useful for informing national building standards, since wind loading is generally considered a key factor in structural design.
The DoE is grateful to the Danish government for further sponsoring the expansion of the WASA project to the remaining areas of the Eastern Cape, KwaZulu-Natal and parts of the Free State provinces. Additional funding is
“The Department is confident about the solid contribution of the entire WASA project to energy planning in South Africa.”
v
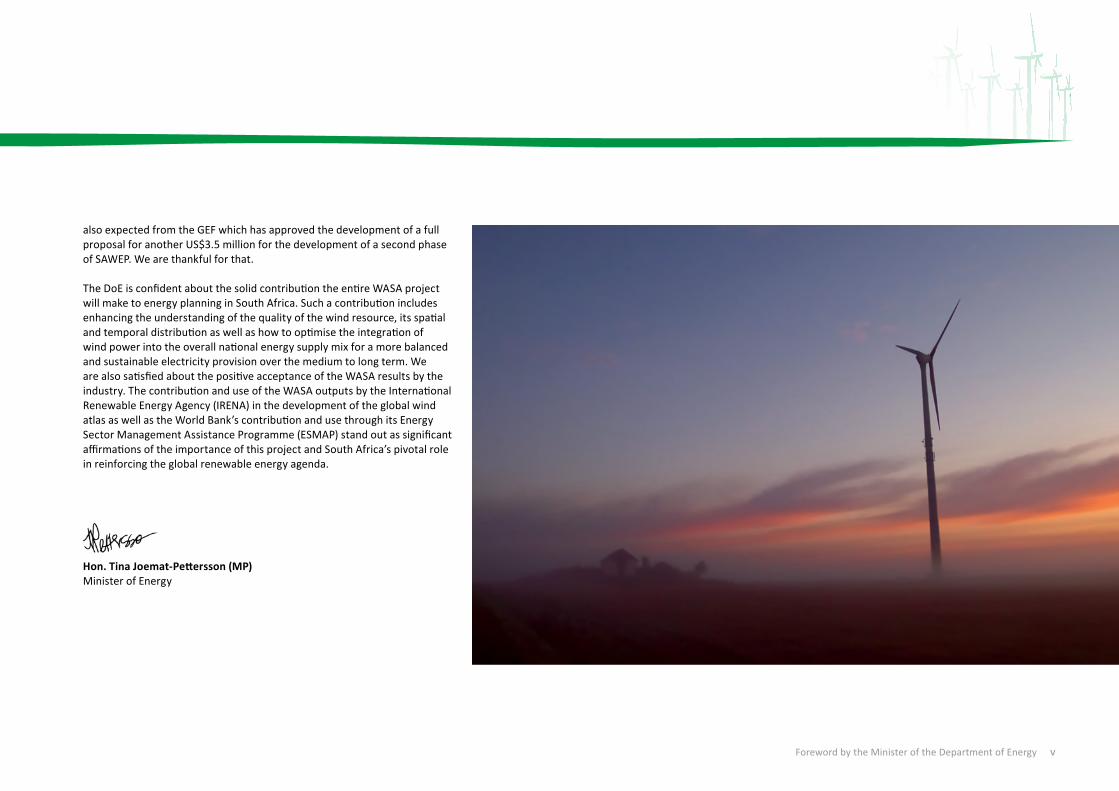
also expected from the GEF which has approved the development of a full proposal for another US$3.5 million for the development of a second phase of SAWEP. We are thankful for that.
The DoE is confident about the solid contribution the entire WASA project will make to energy planning in South Africa. Such a contribution includes enhancing the understanding of the quality of the wind resource, its spatial and temporal distribution as well as how to optimise the integration of wind power into the overall national energy supply mix for a more balanced and sustainable electricity provision over the medium to long term. We are also satisfied about the positive acceptance of the WASA results by the industry. The contribution and use of the WASA outputs by the International Renewable Energy Agency (IRENA) in the development of the global wind atlas as well as the World Bank’s contribution and use through its Energy Sector Management Assistance Programme (ESMAP) stand out as significant affirmations of the importance of this project and South Africa’s pivotal role in reinforcing the global renewable energy agenda.
Hon. Tina Joemat-Pettersson (MP)Minister of Energy
Foreword by the Minister of the Department of Energy

Wind Atlas for South Africavi
DANISH AMBASSADOR AND UNDP COUNTRY DIRECTOR PRELUDE
The main objective of the WASA was and is to enable South African authorities to do long-term planning of large-scale exploitation of wind power in South Africa. The development of the wind atlas was done by transferring knowledge from wind energy specialists at the DTU to their South African colleagues. In other words, capacity building has been a key concept throughout this first phase of the project.
The objective of the WASA Phase 1 has successfully been accomplished. Public data has since been downloaded more than 47 670 times by about 1 537 registered users. Furthermore, South Africa now has a group of wind resource modelling and measurement experts thanks to the WASA Phase 1.
The WASA now serves as a model for other countries and projects. The data and access are not monopolised by any company or institution. It is all in the public domain and free for all to use.
The WASA will thus assist all players in the wind energy market to obtain verifiable scientific data about the wind. It will assist Government in its long-term grid planning and it will offer important cost-saving benefits for large and small industry players that are developing their project sites.
The WASA Phase 1 can also serve as a reference in the ongoing review of the Integrated Resources Plan (IRP) which outlines how renewable energy will make up a large part of all the new additional energy capacity to be established until 2030.
In other words, the wind atlas is a very important input to the ambitious process of introducing wind energy to secure the green transformation of the South African energy profile.
South Africa has abundant coal resources and yet it has still embarked on an ambitious road toward renewable energy. I can only applaud and admire this policy of diversifying your energy sources and helping to combat climate change. I hope many other countries will continue to follow in your steps.
I would like to congratulate South Africa for the way the Government and the DoE has implemented the REIPPP. It has been very transparent and effective, setting new international standards in the field. This has made wind power a reality in South Africa and has demonstrated the feasibility of a model which could and ought to be exported and duplicated in other countries.
I see the green economy as one of the areas in which both Denmark and South Africa can benefit from further close co-operation. We already share a long history of collaboration on the Green Growth Agenda. The development of a Verified Numerical Wind Atlas (VNWA) is just one successful example. I hope we have seen other examples and continue to do so in the future.
Denmark is proud that we have been able to support the WASA Phase 1 in the first steps on the road toward a growing and sustainable wind industry in South Africa.
FOREWORD BY THE DANISH AMBASSADOR
“Capacity building has been a key concept throughout this first phase of the project.”

vii
The Danish-South African energy co-operation will definitely continue in the years to come. During the visit of the Danish Prime Minister to South Africa in March 2013, the Danish government and the South African Government signed a co-operation agreement on a new Renewable Energy Programme with a budget of DKK40 million. Included in this agreement is the expansion of the wind atlas to cover the remaining areas of the Eastern Cape, KwaZulu-Natal and areas of the Free State provinces. The total budget for Phase 2 of the WASA is DKK12 million.
Mrs Trine Rask ThygesenAmbassador of Denmark
Danish Ambassador and United Nations Development Programme Country Director Prelude

Wind Atlas for South Africaviii
I want to acknowledge, on behalf of the UNDP and the GEF, the leadership and commitment of a range of partners – including the South African DoE, the SANEDI, the South African CSIR, the SAWS, the UCT, the DTU Wind Energy Department and the government of Denmark – in the successful completion of the first WASA.
The story of the WASA and its success is intricately tied to the massive global emergence of wind power as a technology that has demonstrated that the world can turn this challenge into an opportunity and choose a different path to meeting its energy needs in a sustainable and climate-resilient manner.
Eight years ago, at the start of the SAWEP Phase 1, South Africa had less than 10 MW of wind power. Today, because of the vision of Government and the REIPPP, if all goes well, the country will have some 2 GW of wind installed by 2018. Overnight, South Africa has become a global and regional leader in wind power deployment and wind is becoming a significant new sector in the South African economy. At the UNDP, we firmly believe that the WASA has played a key behind-the-scenes role in facilitating the growth of the South African wind sector, providing high-resolution wind resource data to all stakeholders that have, amongst others, the following benefits: - allowed for a democratic levelling of the playing field between small
and large industry players to identify and develop project sites for wind farms;
- assisted government planners to identify high-potential wind development zones in line with the strategic environmental framework and assessments studies; and
- facilitated short- and long-term grid planning for renewable energy rollout.
I also wish to highlight and commend the WASA’s involvement in the IRENA Global Atlas Initiative which is the largest initiative ever undertaken to assess renewable energy potential on a global scale. The WASA is helping to close the knowledge gap between nations with access to the necessary data sets, expertise and financial support to evaluate their national renewable energy potential and those countries lacking such elements or who wish to learn from the experiences of those nations that have already undertaken such work.
Looking forward, the UNDP is committed to continuing its support of South Africa’s wind sector and increased renewable energy deployment on a global level.
More specific to South Africa, in 2013, the GEF approved a project proposal concept for an additional funding allocation of US$3.5 million for a second phase of the SAWEP. Phase 2 is designed to assist Government and industry stakeholders to overcome strategic barriers to the successful attainment of South Africa’s IRP target of 2.8 GW new build wind power online by 2020. The second phase of the SAWEP is intended to build on the achievements of the first phase, with regard to the removal of early-stage energy-related barriers, and focus efforts on creating the conditions for medium- and long-term wind power development in South Africa.
Components proposed under the second phase of the SAWEP include, amongst others, providing additional support for resource mapping and wind corridor development, including the expansion of the WASA to additional provinces in conjunction with support from the government of
FOREWORD BY THE UNITED NATIONS DEVELOPMENT PROGRAMME COUNTRY DIRECTOR
“Overnight, South Africa has become a global and regional leader in wind power deployment and wind is becoming a significant new sector in the South African economy.”
ix
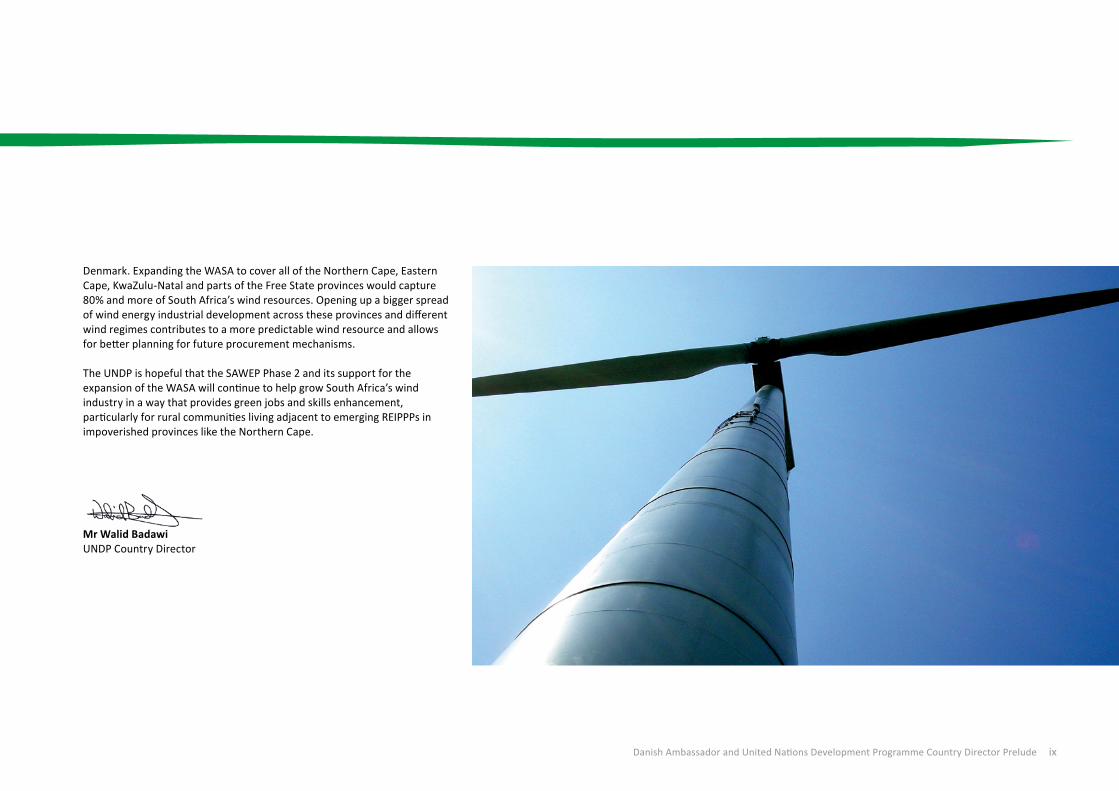
Denmark. Expanding the WASA to cover all of the Northern Cape, Eastern Cape, KwaZulu-Natal and parts of the Free State provinces would capture 80% and more of South Africa’s wind resources. Opening up a bigger spread of wind energy industrial development across these provinces and different wind regimes contributes to a more predictable wind resource and allows for better planning for future procurement mechanisms.
The UNDP is hopeful that the SAWEP Phase 2 and its support for the expansion of the WASA will continue to help grow South Africa’s wind industry in a way that provides green jobs and skills enhancement, particularly for rural communities living adjacent to emerging REIPPPs in impoverished provinces like the Northern Cape.
Mr Walid BadawiUNDP Country Director
Danish Ambassador and United Nations Development Programme Country Director Prelude

Wind Atlas for South Africax
“South Africa is one of 15 countries with the best wind resources in Africa.”

1
1Wind speed determines the amount of power in the wind.
Wind power (P) is directly proportional to the wind speed cubed (U3).
P α U3
P = ½ρU3 [W/m2], ρ = air density.
The amount of energy a wind turbine produces depends on the power (P) in the wind and the efficiency of the wind turbine (Cp).
The efficiency of the wind turbine is specified as a function of the wind speed at hub height (the distance from the ground to the hub which connects the wind turbine blades to its main shaft). It is therefore very important that we can determine the wind speed accurately at the hub heights of wind turbines.
Fast
Fac
ts
1.1 BACKGROUNDIn 2003, the Department of Minerals and Energy’s (DMEa) Capacity-Building Project in Energy Efficiency and Renewable Energy, which was funded by the Danish Government, commissioned the Review of Wind Energy Resource Studies in South Africab study. This study reviewed wind energy resource studies and estimated if the potential of the resources discussed in these studies are correct.
The conclusions drawn by this study include the following: - There is a poor accuracy prediction rate of the wind energy resources
at potential sites based on the present wind atlases. This is mainly because the locations of the weather measuring masts are too close to buildings and other obstacles. Therefore, the present wind atlases should not be used to predict the energy output at potential sites which are in turn used in feasibility studies.
- The accuracy of the resource estimates may be improved significantly by establishing a network of high-quality wind measurements, including masts of at least 30 m.
The study also revealed that South Africa has potential sites with wind resources that are equal to wind resources at sites around the world that have been exploited for large-scale wind power projects. This finding agrees with the findings of another study conducted for the African Development Bank, namely the Strategic Study of Wind Energy Deployment in Africac, which stated that South Africa is one of 15 countries with the best wind resources in Africa.
SOUTH AFRICA AS A MAJOR WIND RESOURCE SITE
1.2 THE IMPORTANCE OF ASSESSING WIND RESOURCES FOR SOUTH AFRICA
It is very important to assess the wind resources correctly, because if the wind data is, for example, only 10% incorrect, the calculation of the amount of energy produced would be incorrect – up to the order of 30%. An error of such magnitude could result in cost-benefits being incorrectly determined for: - investment costs; - operation and maintenance costs; - electricity production; - turbine lifetime; and - environmental benefits.
Incorrectly assessing the wind resources will also result in the modelling output being incorrect.
It is also important to assess the wind resources as: - energy, electricity and sustainable solutions are needed; - the development of power systems are long-term efforts; - we need to look for the best place for wind resources; - we need to plan, implement and operate the power systems for
timely and well-placed wind power distributions; - traditional climatology models do not give the required answers for
wind resources; and - data on wind is not adequately available and/or is of poor qualityd.
a Currently the Department of Energy. b See Reference 1. c See Reference 2. d See Reference 3.
South Africa as a Major Wind Resource Site

Wind Atlas for South Africa2
Figure 1: Wind rose and wind speed distribution U for WM05 Napier at 62 m AGL
1.3 DEFINING THE PROJECT AREAThe WASA Phase 1 project covers the Western Cape province and parts of the Northern Cape and Eastern Cape provinces.
The criteria for selecting the wind measurement sites were based on the needs to best possibly serve for verification of the wind modelling and the followinge: - Topography: such as mountains, escarpments, hills, the slope of hills,
and the distance to mountain ranges and valleys; - Roughness: such as vegetation, forests, agricultural land, and the
distance to towns and cities; - Communication: such as a Global System for Mobile Communications
(GSM) network, a radio modem and a satellite; - Infrastructure: such as access, roads, building material and concrete. - The distance to the power grid; - Sensitive areas: such as airports, nature reserves, game parks, bird
migration routes and bats; - Land ownership: such as private, trust, Government, local authority
and tribal land; and - Land classification: such as industrial or agricultural land.
The positions were carefully chosen to cover all of the WASA domain terrain types and climatology for the modelling to be representative of the WASA domain. They were not chosen because they were the windiest or the best locations for wind farmsf.
The end result of this WASA project is to support the large-scale utilisation of wind energy in South Africa.
e See Reference 4. f See Reference 5.
Frequency of wind direction (wind rose) Frequency of wind speed (histogram)
30.0%
20.0
0.00 U [m/s] 30.00
f[%/(m/s)]
Sector: allA: 9.7 m/sk: 2.21U: 8.63 m/sP: 648 W/m2
--Emergent--Fitted

3
“The end result of this WASA project is to support the large-scale utilisation of wind energy in South Africa.”
Figure 2: WASA Phase 1 project area: Western Cape and parts of the Northern Cape and Eastern Cape provinces
NAMBIA
BOTSWANA
ZIMBABWE
LIMPOPO
MPUMA-LANGANORTH WEST
FREE STATE
NORTHERN CAPE
ATLANTICOCEAN
WESTERN CAPE
EASTERN CAPE
INDIAN OCEAN
KWAZULU-NATAL
LESOTHO
GAU-TENG SWAZI-
LAND
MOZAM- BIQUE
South Africa as a Major Wind Resource Site
Wind Atlas for South Africa4
2BEHIND THE SCENES
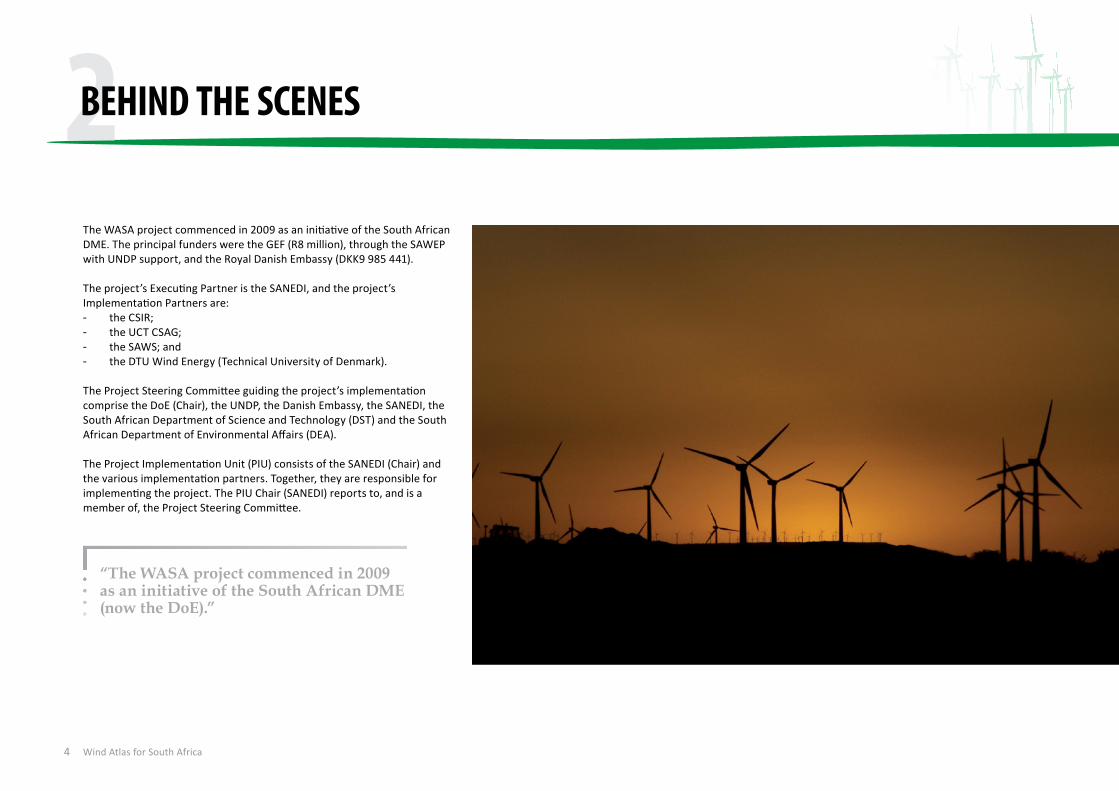
The WASA project commenced in 2009 as an initiative of the South African DME. The principal funders were the GEF (R8 million), through the SAWEP with UNDP support, and the Royal Danish Embassy (DKK9 985 441).
The project’s Executing Partner is the SANEDI, and the project’s Implementation Partners are: - the CSIR; - the UCT CSAG; - the SAWS; and - the DTU Wind Energy (Technical University of Denmark).
The Project Steering Committee guiding the project’s implementation comprise the DoE (Chair), the UNDP, the Danish Embassy, the SANEDI, the South African Department of Science and Technology (DST) and the South African Department of Environmental Affairs (DEA).
The Project Implementation Unit (PIU) consists of the SANEDI (Chair) and the various implementation partners. Together, they are responsible for implementing the project. The PIU Chair (SANEDI) reports to, and is a member of, the Project Steering Committee.
“The WASA project commenced in 2009 as an initiative of the South African DME (now the DoE).”

5
3A SET OBJECTIVE
Through capacity development and research co-operation, the WASA project’s main objective is to develop and employ numerical (modelled) wind atlas methods. In using these methods, the project also aims to develop capacity in support of long-term planning for large-scale wind power to take place in South Africa. This includes dedicated wind resource assessment and siting tools for planning purposes. The siting tools used when planning are: - physical wind measurements; - numerical (modelled) wind atlases; and - South African databases.
“The WASA project’s main objective is to develop and employ numerical (modelled) and verified wind atlas methods.”
A Set Objective
Dorper Wind Farm. Image by Dorper Wind Farm (RF) Pty Ltd.
Wind Atlas for South Africa6
4ABOUT THE WIND ATLAS FOR SOUTH AFRICA PROJECT
The WASA project consists of six Work Packages (WPs). The outcomes for each package are summarised in this chapter.
4.1 WORK PACKAGE 1 – MESOSCALE WIND MODELLINGThe initial model setup and the preliminary calculations formed part of the first WP. This involved downscaling from global data sets to regional data with the Karlsruhe Atmospheric Mesoscale Model (KAMM) method and the Weather Research and Forecasting (WRF) model.
The outcomes of WP1 include: - KAMM and WRF model configurations; - statistical and dynamic downscaling (using KAMM and WRF coupled
to the Wind Atlas and Application Programme (WAsP); - dynamical downscaling using WRF; - methods for satellite data input to mesoscale models; - the post-processing of mesoscale outputs which are coupled to
microscale models; - the analysis of the mesoscale results versus the measured data; - the creation of a Numerical Wind Atlas (NWA) for the Western Cape
and selected areas of the Northern and Eastern Cape provinces; and - training, including the exchange of PhD theses.
4.2 WORK PACKAGE 2 – WIND MEASUREMENTSThe most important objective of the second WP was to get high-quality wind measurements over three years from the 10 masts in order to verify the mesoscale modelling.
The outcomes of WP2 include: - the design of a wind measuring system; - the design of data acquisitions by GSM; - the procurement, shipment, customs clearance, tax and Value Added
Tax (VAT) exemption and necessary import permits; - survey, screening and selection (if appropriate) of the existing data
from private measurements, agreement and confidentiality and the value of the data;
- siting and necessary approvals attained; - consideration of an appropriate mast design; - construction and installation; - recalibration; - operation, security and data collection; - data analyses; and - technical training on upgrading to wind energy-related measurement
systems.
4.3 WORK PACKAGE 3 – MICROSCALE WIND MODELLINGDuring this WP, microscale modelling was carried out for the 10 chosen meteorological stations to create an observational wind atlas for each of the 10 masts.
The outcomes of WP3 include: - wind speed and the distribution of the direction of the wind; - terrain elevation; - terrain roughness; - sheltering obstacles; - WAsP modelling;
The following are the six WPs of the WASA project: - WP1 – Mesoscale Wind
Modelling - WP2 – Wind Measurements - WP3 – Microscale Wind
Modelling - WP4 – Application for Wind
Resource Assessment - WP5 – Extreme Wind Atlas - WP6 – Documentation and
Dissemination
Fast
Fac
ts

7
- the analysis of the microscale results versus the measured data; - the creation of observational wind atlases for selected measurement
sites in South Africa; and - WAsP training which will consists of Training of Trainers (ToT).
4.4 WORK PACKAGE 4 – APPLICATION FOR WIND RESOURCE ASSESSMENT
This WP concerned the use of the results for actual applications particularly for those parties that are not part of the project.
The outcomes of WP4 include: - mid-term workshops for invited stakeholders from authorities,
planners, developers, banks, scientists, etc.; - the development of tools, such as guidelines and training materials
on how to use the NWA for wind resource assessment; - a course for trainers; - microscale High-Resolution Wind Resource Map for the modelled
areas in the three provinces, including integration as a Geographic Information System (GIS) layer;
- the seasonal variation of wind resources at the mast locations; and - final workshops and Training of Trainers (ToT) for invited
stakeholders, including opportunities for application in determining extreme wind climate, seasonal forecasting and applications, which are not wind energy related.
4.5 WORK PACKAGE 5 – EXTREME WIND ATLASDuring this WP, an estimation of the extreme wind climate of South Africa was also achieved. The outcomes of WP5 include: - the development of tools and guidelines; - a course for trainers; - workshops as technical working sessions and progress reporting for PIU; - a better understanding of the estimation of extreme winds; - capacity development of the theoretical aspects of extreme wind
estimation; - the application of mesoscale modelling results to the estimation of an
extreme wind climate of the project area; and - database and maps for extreme winds.
4.6 WORK PACKAGE 6 – DOCUMENTATION AND DISSEMINATION
During the last WP, the WASA project has been presented at conferences and seminars and published and distributed through websites for Phase 1.
The outcomes of WP6 include: - the preparation and dissemination of research publications of
the results of the project, including the final book and homepage publication;
- the preparation of national wind seminars for dissemination of the results of the project; and
- the establishment and documentation of research co-operation between South African and international wind research partners.
“The WASA project consists of six work packages.”
About the Wind Atlas for South Africa Project
Wind Atlas for South Africa8
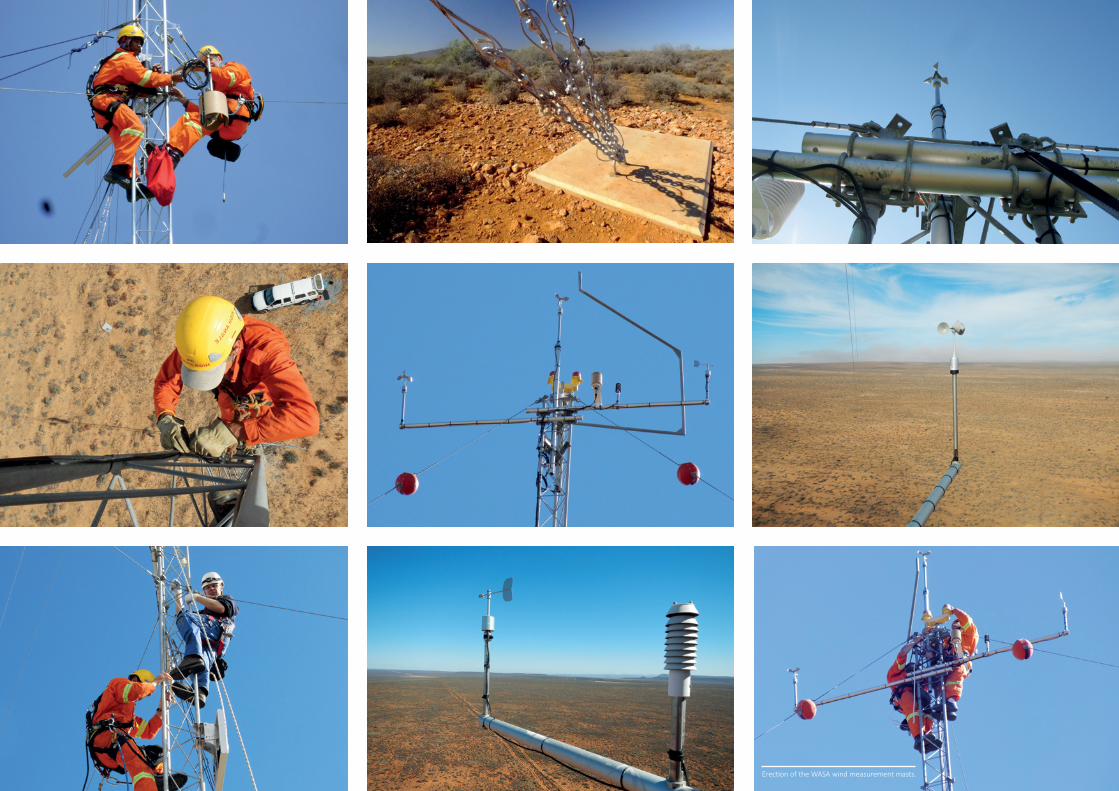
Erection of the WASA wind measurement masts.
9
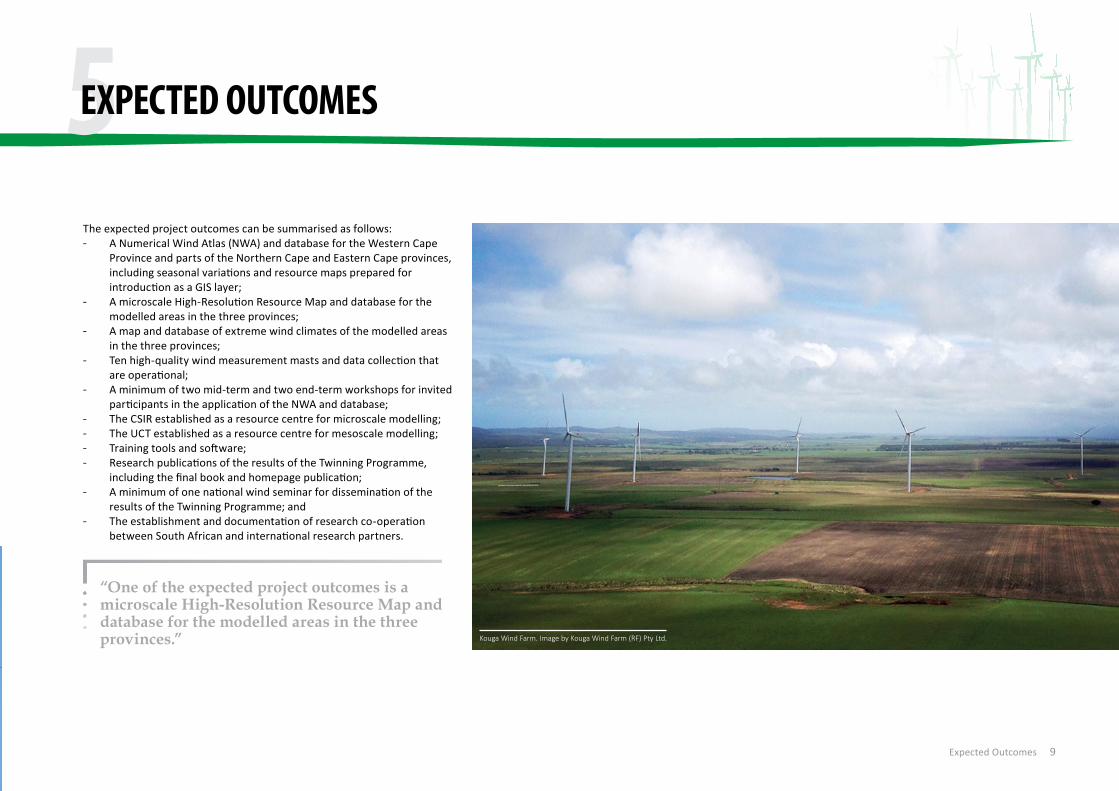
The expected project outcomes can be summarised as follows: - A Numerical Wind Atlas (NWA) and database for the Western Cape
Province and parts of the Northern Cape and Eastern Cape provinces, including seasonal variations and resource maps prepared for introduction as a GIS layer;
- A microscale High-Resolution Resource Map and database for the modelled areas in the three provinces;
- A map and database of extreme wind climates of the modelled areas in the three provinces;
- Ten high-quality wind measurement masts and data collection that are operational;
- A minimum of two mid-term and two end-term workshops for invited participants in the application of the NWA and database;
- The CSIR established as a resource centre for microscale modelling; - The UCT established as a resource centre for mesoscale modelling; - Training tools and software; - Research publications of the results of the Twinning Programme,
including the final book and homepage publication; - A minimum of one national wind seminar for dissemination of the
results of the Twinning Programme; and - The establishment and documentation of research co-operation
between South African and international research partners.
5EXPECTED OUTCOMES
“One of the expected project outcomes is a microscale High-Resolution Resource Map and database for the modelled areas in the three provinces.”
Expected Outcomes
Kouga Wind Farm. Image by Kouga Wind Farm (RF) Pty Ltd.
Wind Atlas for South Africa10
Mesoscale m
odelling
Microscale m
odelling
Verification
Microscale m
odellingLocal surface wind
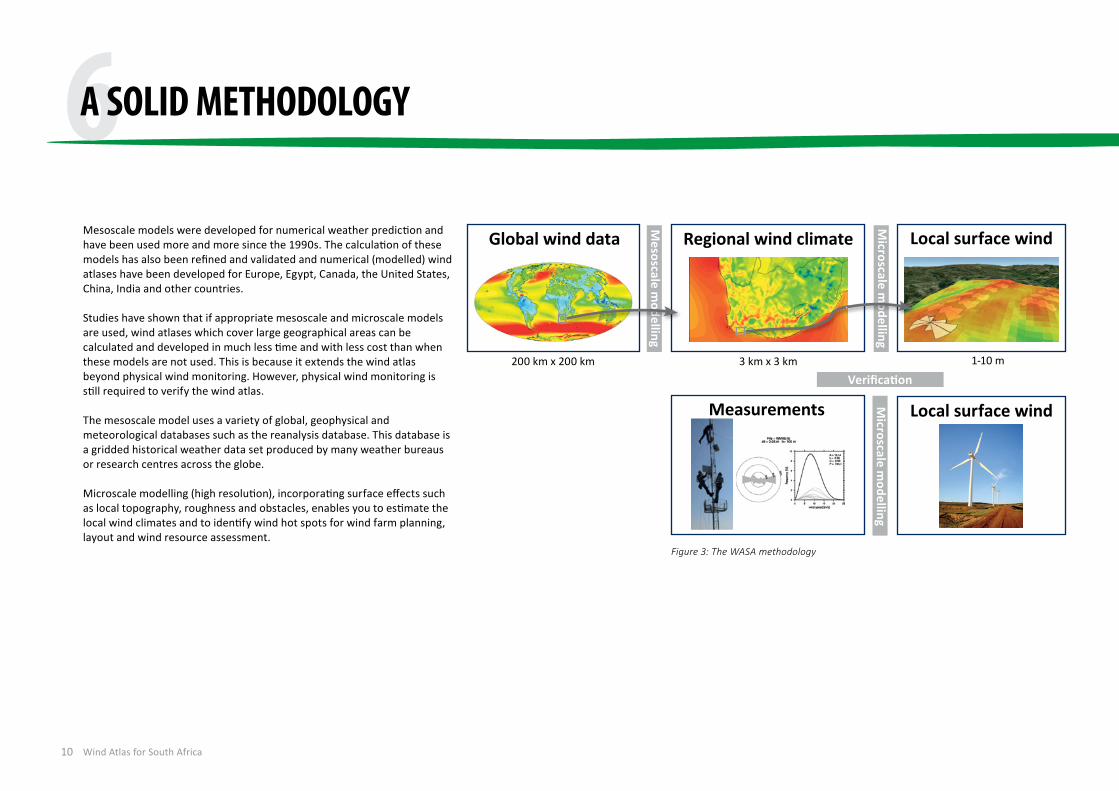
6Mesoscale models were developed for numerical weather prediction and have been used more and more since the 1990s. The calculation of these models has also been refined and validated and numerical (modelled) wind atlases have been developed for Europe, Egypt, Canada, the United States, China, India and other countries.
Studies have shown that if appropriate mesoscale and microscale models are used, wind atlases which cover large geographical areas can be calculated and developed in much less time and with less cost than when these models are not used. This is because it extends the wind atlas beyond physical wind monitoring. However, physical wind monitoring is still required to verify the wind atlas.
The mesoscale model uses a variety of global, geophysical and meteorological databases such as the reanalysis database. This database is a gridded historical weather data set produced by many weather bureaus or research centres across the globe.
Microscale modelling (high resolution), incorporating surface effects such as local topography, roughness and obstacles, enables you to estimate the local wind climates and to identify wind hot spots for wind farm planning, layout and wind resource assessment.
A SOLID METHODOLOGY
Figure 3: The WASA methodology
200 km x 200 km 3 km x 3 km
Global wind data Regional wind climate
1-10 m
Local surface windMeasurements

11
“Microscale modelling, incorporating surface effects, enables the estimation of the local wind climate and the identification of wind hot spot areas.’’MACRO
MESO
MICRO
OUTP
UT INPU
T
INPU
TOUTP
UT
Global weather
data
Microscale terrain
Mesoscale terrain
Simulated & generalised winds
NWA
Wind speed & power density maps
Wind farm energy production estimates
+
OUTPUT
+Figure 4: Modelling scales and the making of a wind atlas
A Solid Methodology

Wind Atlas for South Africa12
The WASA results are divided into six WPs as well as capacity building and human development. These WASA results are summarised below according to these divisions. The original reports can be downloaded by following the links provided: - http://www.wasa.csir.co.za - http://wasadata.csir.co.za/wasa1/WASAData
(register for free and log in) - The WASA website at http://www.wasaproject.info/ - http://veaonline.risoe.dk/wasa
Final reports, maps, guides and data can be accessed online (register for free and log in): http://wasadata.csir.co.za/wasa1/WASAData
7.1 WORK PACKAGE 1 – MESOSCALE MODELLING The Numerical Wind Atlas (NWA) is the main result of the mesoscale modelling based on the WRF model in April 2014. The responsible parties for WP1 are the UCT CSAG and the DTU Wind Energy.
The measured data from the 10 WASA wind measurement stations was used to verify the result which resulted in a Verified Numerical Wind Atlas (VNWA) (see Figure 5).
This VNWA can be applied to more than the 10 WASA mast areas; it can be applied to the whole WASA modelling domain with data available every 3 km x 3 km which correspond to about 40 000 points of data (or “virtual masts”) covering the WASA area. This VNWA data can be directly used with most of the standard software that is used to assess wind resources, such as the WAsP. The information on wind resources is used for the planning of wind farms.
7 IT IS ALL ABOUT THE RESULTS
The Deputy Minister of Energy launched the first VNWA that was based on the KAMM method at the WASA workshop in March 2012.
The WRF-based NWA verification compared to measurements at the 10 WASA sites show that the generalised mean wind speeds have a mean absolute error* of only 4.4%.
*Average of the absolute errors of the annual mean wind speed at the 10 sites.
WP
1 Fa
st F
acts
WM07 Beaufort West.

13
Figure 5: VNWA for South Africa, based on WRF, launched in April 2014 (generalised wind climate – flat terrain, 3 km x 3 km grid spacing)
Figure 6: A screenshot of the VNWA database interface – Tadpole – using a Google Earth plug-in that can be accessed here:http://wasaclimates.eu/Tadpole/Viewer?gid=08aee5e5-e31f-416a-ad12-9a7a4d26f92e
It is all About the Results
“This VNWA can be applied to more than the 10 WASA mast areas; it can be applied to the whole WASA modelling domain with data available every 3 km x 3 km which correspond to about 40 000 points of data (or ‘virtual masts’) covering the WASA area.”
Met mast Umean OWA Umean WRF NWA
∆ Umean WRF−
OWA %WM01 6.83 6.73 -1.5WM02 6.68 7.31 9.4WM03 7.38 6.99 -5.3WM04 7.50 8.15 8.7WM05 8.98 9.08 1.1WM06 7.86 8.27 5.2WM07 7.78 7.39 -5.0WM08 8.01 8.08 0.9WM09 8.33 8.45 1.4WM10 7.12 7.53 5.8Mean error% 2.1Mean absolute error% 4.4Umean =mean wind speedOWA Observational Wind AtlasWRF VNWA WRF-based Numerical Wind Atlas
Wind Atlas for South Africa14
WM05 observed wind atlas
File = wrf_WASA_34.609S_19.676E_3km_WM05.libz0 = 0.03 m h = 100 m
30%
20%
10%
Freq
uenc
y [%
]
00 5 10 15 20 25
2
4
6
8
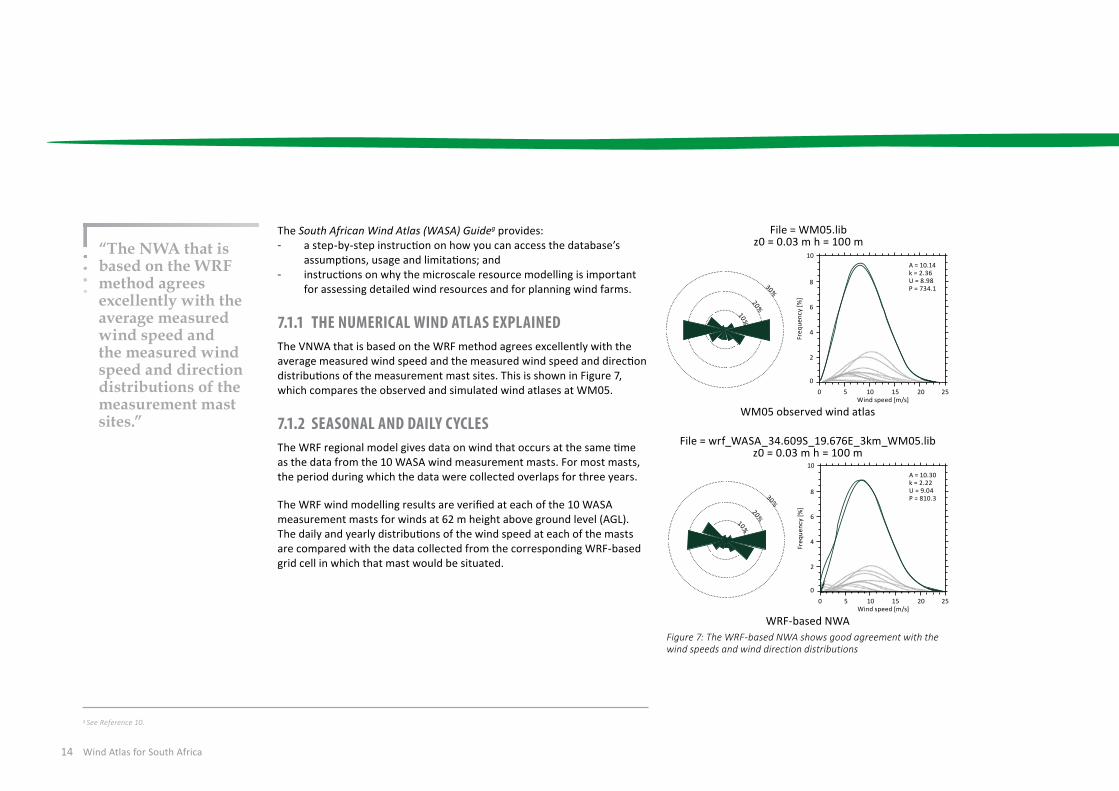
10A = 10.30k = 2.22U = 9.04P = 810.3
Wind speed [m/s]
30%
20%
10%
Freq
uenc
y [%
]
00 5 10 15 20 25
2
4
6
8
10A = 10.14k = 2.36U = 8.98P = 734.1
Wind speed [m/s]
g See Reference 10.
File = WM05.lib z0 = 0.03 m h = 100 m
WRF-based NWAFigure 7: The WRF-based NWA shows good agreement with the wind speeds and wind direction distributions
The South African Wind Atlas (WASA) Guideg provides: - a step-by-step instruction on how you can access the database’s
assumptions, usage and limitations; and - instructions on why the microscale resource modelling is important
for assessing detailed wind resources and for planning wind farms.
7.1.1 THE NUMERICAL WIND ATLAS EXPLAINEDThe VNWA that is based on the WRF method agrees excellently with the average measured wind speed and the measured wind speed and direction distributions of the measurement mast sites. This is shown in Figure 7, which compares the observed and simulated wind atlases at WM05.
7.1.2 SEASONAL AND DAILY CYCLESThe WRF regional model gives data on wind that occurs at the same time as the data from the 10 WASA wind measurement masts. For most masts, the period during which the data were collected overlaps for three years.
The WRF wind modelling results are verified at each of the 10 WASA measurement masts for winds at 62 m height above ground level (AGL). The daily and yearly distributions of the wind speed at each of the masts are compared with the data collected from the corresponding WRF-based grid cell in which that mast would be situated.
“The NWA that is based on the WRF method agrees excellently with the average measured wind speed and the measured wind speed and direction distributions of the measurement mast sites.”

15
For each of the 10 masts, the following assessments were made: - a histogram of the wind speed, seasonal cycle and daily cycle (see
Figure 8); and - summary statistics:
• mean bias;• root mean squared error (RMSE);• mean absolute cycle bias (this is the mean absolute difference
between the daily cycles across the seasonal cycles); and• a Pearson’s correlation coefficient (namely a linear correlation
coefficient).
Figure 8 shows: - the wind speed distribution (top left); the mean seasonal cycle
(top centre) and the mean daily cycle (top right) in the mast measurements (blue) and in the WRF model simulations (green); and
- the mean wind speed (ms−1) at 62 m AGL as a function of the time of the day and the month of the year for the mast observations (bottom left) and the WRF simulations (bottom right).
Freq
uenc
y
It is all About the Results
“The WRF model agrees excellently with the daily and seasonal wind cycles at the wind mast sites.”
Mean speed (m/s) Mean speed (m/s)
Hour
Wind speeds (m/s)
Win
d sp
eed
(m/s
)
Nor
mal
ised
win
d sp
eed
(m/s
)
HoursMonth (2010-2013)
Mon
th
Mon
th
Hour
WM01 Histogram Mean seasonal cycle Mean daily cycle
WRF annual speed cycle at WM01Observed annual speed cycle at WM01
Figure 8: Comparison of the wind speed at 62 m AGL for WM01

Wind Atlas for South Africa16
The WRF model data agrees excellently (near unity 1.0 Pearson correlation coefficients) with the hourly, daily and monthly measured wind speed averages.
7.1.3 WIND TIME SERIES DATAThe WRF model simulated the wind time series data (hourly mean wind speed and direction) from 1 September 1990 to 31 December 2012.
The wind time series are particularly useful: - to study the annual, seasonal and diurnal variations in wind
resources; - as input to power system modelling; - to study the geographical cross correlation of wind across South
Africa; and - for long-term corrections of the wind resources given by the WRF
wind climate files.
7.1.4 FINAL REPORTS AND DATA FOR WORK PACKAGE 1A final report was created for the first WP, named the Mesoscale Modelling for the Wind Atlas of South Africa (WASA) Projecth.
7.2 WORK PACKAGE 2 – WIND MEASUREMENTSThe main result of WP2 was to collect quality measurements from the 10 installed wind masts. WP2 was carried out by the CSIR and the DTU Wind Energy.
The Minister of the DoE launched 10 wind measurement masts (WM01 to WM10) (see Figure 9) at the second Annual Wind Energy Seminar in September 2010, after they were installed according to the International Electrotechnical Commission (IEC) and Measnet standards. These masts have been operational since their launch.
Features of WASA wind measurement masts include the following: - instrumentation is arranged to minimise errors and uncertainties due
to flow distortion; - proven sensors are of high quality that are individually calibrated; - regular inspection and maintenance; - anemometers at five different heights: 10 m, 20 m, 40 m, 60 m and 62 m; - wind vanes at two heights: 20 m and 60 m; - temperature and pressure sensors; - data recovered at 10 minute average intervals; - turbulence calculated and recorded; and - data downloaded and checked regularly to minimise loss of data or
data gaps.
Risø Online Database for Environmental Observations (Rodeo) has been installed and is operational at the CSIR branch in Stellenbosch. It is a system which manages data and stores online measurement data in a MySQL database. The data are automatically displayed on a website from the MySQL database. The online graphs on this website can be viewed on the WASA website and you can access and download the data from the website once quality checks have been done.
h See Reference 9.
The tenth mast was completed on 17 September 2010. The three-year measurement period started once this mast was completed.
The CSIR indicated that the time to install instruments on a mast was improved, from taking two days to only taking five hours at the tenth mast.
Wind data is stored in the Rodeo MySQL database management system after which it is displayed on the website. A stringent quality assurance process was applied to the WASA data before being published on the website.
The preferred mast type for the WASA measurements was a narrow, triangular, lattice mast.
WP
2 Fa
st F
acts
17
WM01 ALEXANDER BAY
WM03 VREDENDAL
WM02 CALVINIA
WM06 SUTHERLAND
WM07 BEAUFORT
WESTWM08
HUMANSDORP
WM10 BUTTERWORTH
WM09 NOUPOORT
WM04 VREDENBURG
WM05 NAPIER
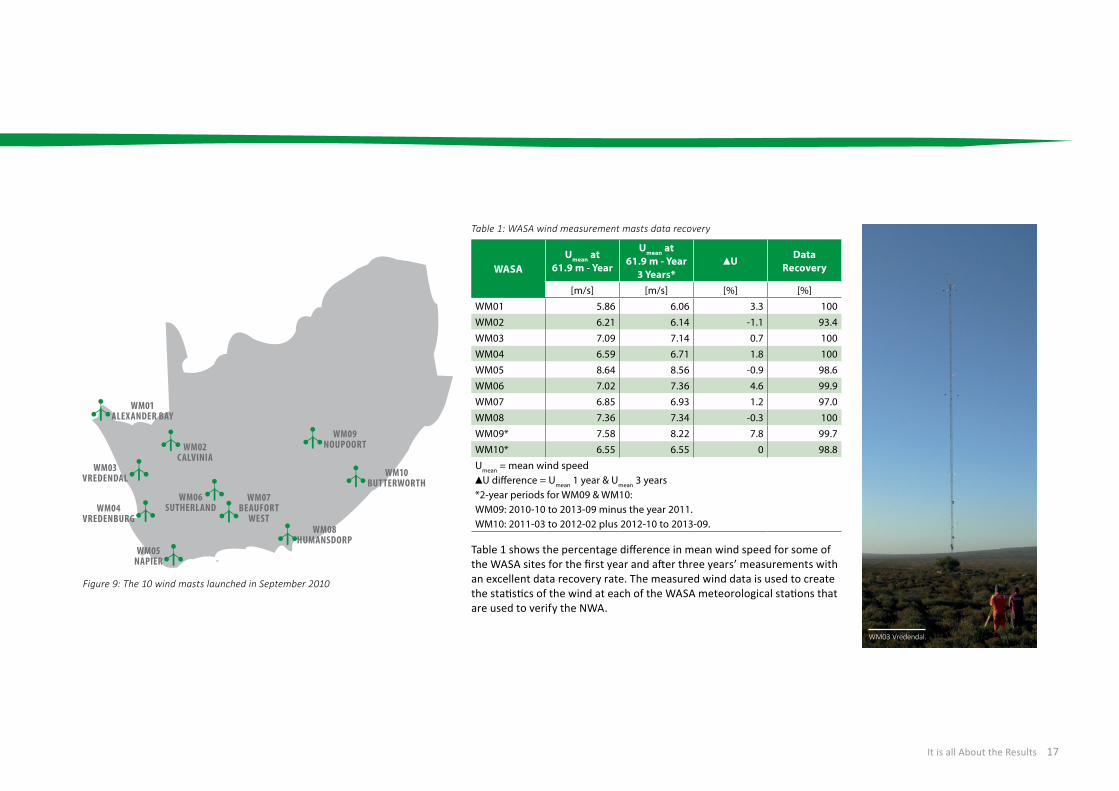
Table 1: WASA wind measurement masts data recovery
WASAUmean at
61.9 m - Year
Umean at 61.9 m - Year
3 Years*U
Data Recovery
[m/s] [m/s] [%] [%]WM01 5.86 6.06 3.3 100WM02 6.21 6.14 -1.1 93.4WM03 7.09 7.14 0.7 100WM04 6.59 6.71 1.8 100WM05 8.64 8.56 -0.9 98.6WM06 7.02 7.36 4.6 99.9WM07 6.85 6.93 1.2 97.0WM08 7.36 7.34 -0.3 100WM09* 7.58 8.22 7.8 99.7WM10* 6.55 6.55 0 98.8Umean = mean wind speed
U difference = Umean 1 year & Umean 3 years*2-year periods for WM09 & WM10:WM09: 2010-10 to 2013-09 minus the year 2011.WM10: 2011-03 to 2012-02 plus 2012-10 to 2013-09.
Table 1 shows the percentage difference in mean wind speed for some of the WASA sites for the first year and after three years’ measurements with an excellent data recovery rate. The measured wind data is used to create the statistics of the wind at each of the WASA meteorological stations that are used to verify the NWA.
Figure 9: The 10 wind masts launched in September 2010
It is all About the Results
WM03 Vredendal.
Wind Atlas for South Africa18
i See Reference 12. j See Reference 11. k See Reference 13. l See Reference 12. m See Reference 11. n See Reference 13.
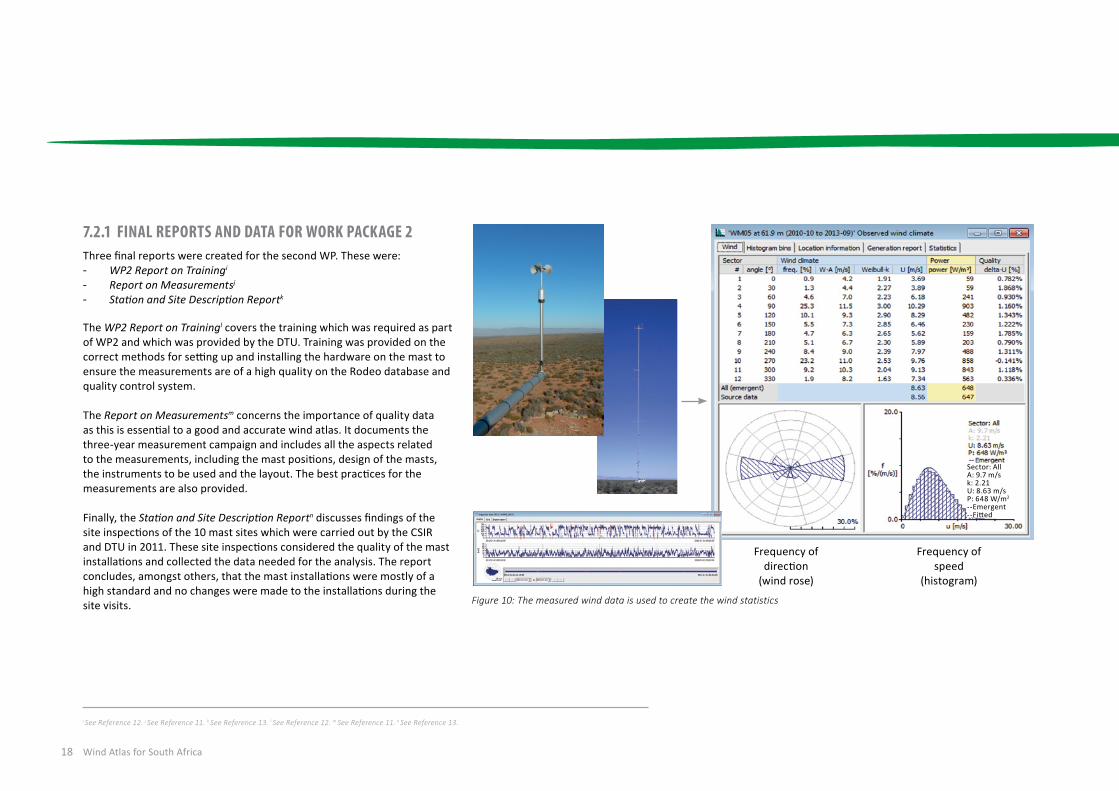
7.2.1 FINAL REPORTS AND DATA FOR WORK PACKAGE 2Three final reports were created for the second WP. These were: - WP2 Report on Trainingi
- Report on Measurementsj
- Station and Site Description Reportk
The WP2 Report on Trainingl covers the training which was required as part of WP2 and which was provided by the DTU. Training was provided on the correct methods for setting up and installing the hardware on the mast to ensure the measurements are of a high quality on the Rodeo database and quality control system.
The Report on Measurementsm concerns the importance of quality data as this is essential to a good and accurate wind atlas. It documents the three-year measurement campaign and includes all the aspects related to the measurements, including the mast positions, design of the masts, the instruments to be used and the layout. The best practices for the measurements are also provided.
Finally, the Station and Site Description Reportn discusses findings of the site inspections of the 10 mast sites which were carried out by the CSIR and DTU in 2011. These site inspections considered the quality of the mast installations and collected the data needed for the analysis. The report concludes, amongst others, that the mast installations were mostly of a high standard and no changes were made to the installations during the site visits. Figure 10: The measured wind data is used to create the wind statistics
Frequency of direction
(wind rose)
Frequency of speed
(histogram)
Sector: AllA: 9.7 m/sk: 2.21U: 8.63 m/sP: 648 W/m2
--Emergent--Fitted
19
7.3 WORK PACKAGE 3 AND WORK PACKAGE 4 – MICROSCALE MODELLING AND APPLICATION FOR WIND RESOURCE ASSESSMENT
The main result of WP3 was 10 observational wind atlases while WP4 mainly resulted in ways to apply the maps and data. These WPs were carried out by the CSIR and the DTU Wind Energy.
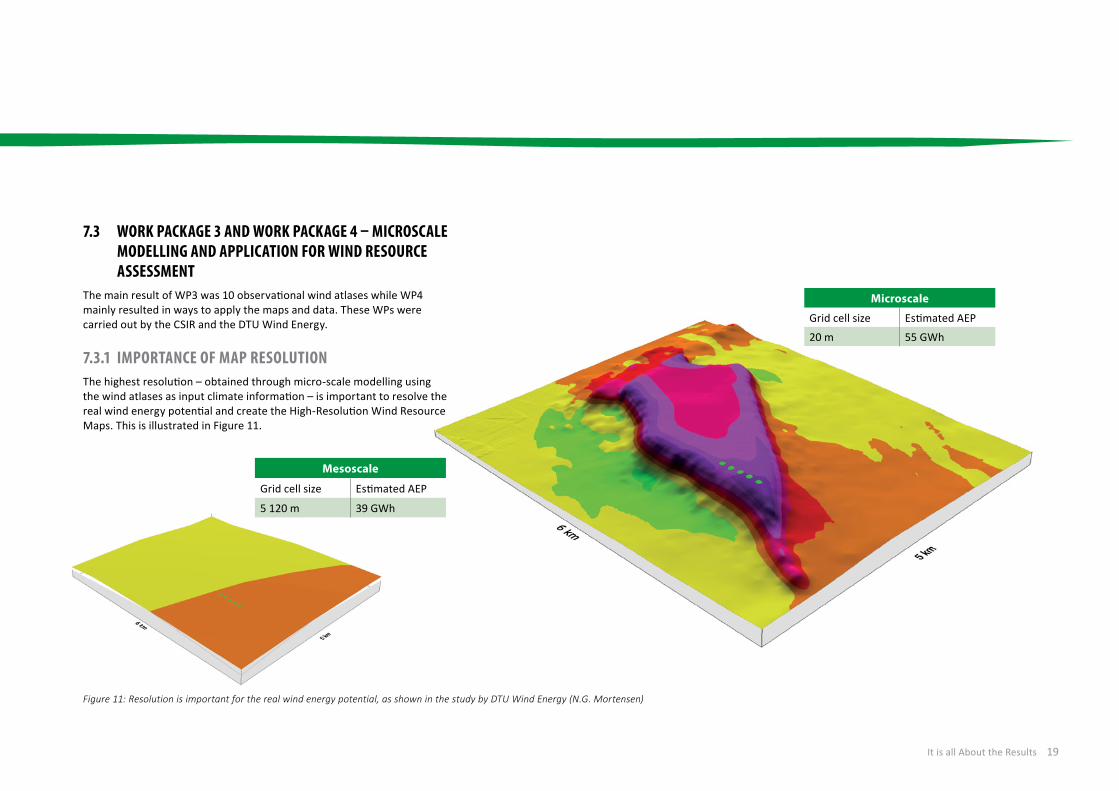
7.3.1 IMPORTANCE OF MAP RESOLUTIONThe highest resolution – obtained through micro-scale modelling using the wind atlases as input climate information – is important to resolve the real wind energy potential and create the High-Resolution Wind Resource Maps. This is illustrated in Figure 11.
It is all About the Results
Figure 11: Resolution is important for the real wind energy potential, as shown in the study by DTU Wind Energy (N.G. Mortensen)
Mesoscale
Grid cell size Estimated AEP
5 120 m 39 GWh
Microscale
Grid cell size Estimated AEP
20 m 55 GWh

Wind Atlas for South Africa20
The VNWA and the local terrain topography are used with the DTU WAsP Wind Resource Mapping Tool, Frogfoot, to create large-scale high-resolution (250 m grid spacing) wind resource maps.
The outputs of the high-resolution maps are given in Figures 13 and 14: - Mean wind speed and mean power density at 100 m AGL and a grid
spacing of 250 m. - Terrain ruggedness index and more are also available on the
download site.
These high-resolution maps based on the WRF model are traceable to the wind measurements that were used to verify the NWA.
Figure 12: The microscale modelling at the WASA meteorological masts
WM01 WM02 WM03 WM04
WM05 WM06
WM09
WM07
WM10
WM08
“The VNWA and the local terrain topography are used to create large scale high-resolution wind resource maps.”

21
Figure 13: Large-scale high-resolution wind resource map launched in April 2014 (local wind climate, 250 m grid spacing) with the mean wind speed
It is all About the Results
“On average, the WRF-based wind resource map (see Figure 13) estimates the wind speed accurately at the WASA mast sites with an uncertainty of less than 2.2%.”

Wind Atlas for South Africa22
7.3.2 METADATAThe high-resolution wind resource map depicts the local wind climate that a wind turbine would encounter. It also offers important benefits for developers, policy makers, utilities and the industry, including the following: - Saves time and costs as the bankability of a potential wind farm site
can now be estimated and physical wind measurements are only undertaken for bankable wind sites.
- Levels the playing field between small and large industry players to identify and develop wind hot spots.
- Assists Government in estimating the real wind resource potential. - Identifies possible wind development zones in line with the
strategic environmental assessment (SEA) studies or in line with frameworks. The DEA’s SEA for solar photovoltaic and wind is an example of such an SEA study and is available at http://www.csir.co.za/nationalwindsolarsea/
- Long-term grid planning to connect with high-potential wind development areas.
- Wind farm planning in positioning (micrositing) the wind turbines for optimal wind exposures.
7.3.3 REPORTS, DATA AND TRAINING MATERIAL FOR WORK PACKAGE 3 AND WORK PACKAGE 4
For the third WP, the Observational Wind Atlas for 10 Met Masts in Northern, Western and Eastern Cape Provincesp report was developed.
This report describes the microscale modelling that was done for the 10 meteorological masts, using the latest version of the WAsP. This modelling was done to create the first observational wind atlas and it was concluded that the WAsP works well where the sites are within its operational
o See Reference 15. p See Reference 14.
Figure 14: Large-scale high-resolution wind resource map launched in April 2014 (local wind climate, 250 m grid spacing) with the mean wind power density
23
envelope and to follow the general WAsP best practices closely when applying WAsP and similar models in South Africa.
The fourth WP resulted in the reports, training and maps listed below: - Brief Introduction to Working with WASA Filesq
- A training course in applying the products of the WASA project - Detailed High-Resolution Wind Resource Maps
The Brief Introduction to Working with WASA Filesr provides step-by-step instructions on how to use the NWA with the topography data to do microscale wind resource mapping.
The training course in applying the products of the WASA project concerned the planning and review of potential wind farm production and education for the purposes of teaching planners, assessors and students about wind atlases and, specifically, the WASA project. The course was divided into three themes: - Theme 1: Wind Atlases - Theme 2: the Wind Industry Sector - Theme 3: the WASA project
7.4 WORK PACKAGE 5 – EXTREME WIND ATLASWP5 mainly resulted in an Extreme Wind Atlas and was carried out by the SAWS and the DTU Wind Energy.
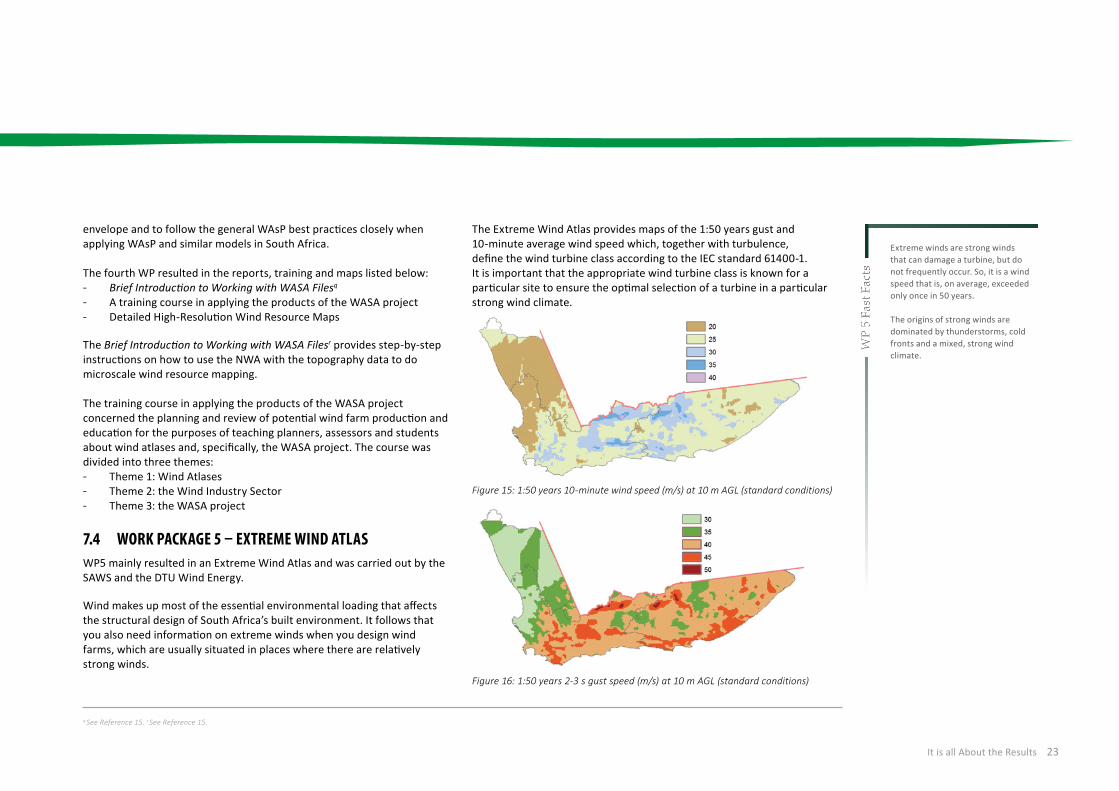
Wind makes up most of the essential environmental loading that affects the structural design of South Africa’s built environment. It follows that you also need information on extreme winds when you design wind farms, which are usually situated in places where there are relatively strong winds.
The Extreme Wind Atlas provides maps of the 1:50 years gust and 10-minute average wind speed which, together with turbulence, define the wind turbine class according to the IEC standard 61400-1. It is important that the appropriate wind turbine class is known for a particular site to ensure the optimal selection of a turbine in a particular strong wind climate.
Figure 15: 1:50 years 10-minute wind speed (m/s) at 10 m AGL (standard conditions)
Figure 16: 1:50 years 2-3 s gust speed (m/s) at 10 m AGL (standard conditions)
q See Reference 15. r See Reference 15.
Extreme winds are strong winds that can damage a turbine, but do not frequently occur. So, it is a wind speed that is, on average, exceeded only once in 50 years.
The origins of strong winds are dominated by thunderstorms, cold fronts and a mixed, strong wind climate.
WP
5 Fa
st F
acts
It is all About the Results
Wind Atlas for South Africa24
7.4.1 FINAL REPORTS AND DATA FOR WORK PACKAGE 5For this WP, the metadata for the Extreme Wind Atlas has been created. The Guidelines for Using the Extreme Wind Data from the Selective Dynamical Downscaling Methods from April 2014 was also created. This guideline was created to obtain the design parameters required in the IEC standard and provides instructions to use the WAsP Engineering (WEng) software to estimate the 1:50-year wind at a particular site at the hub height.
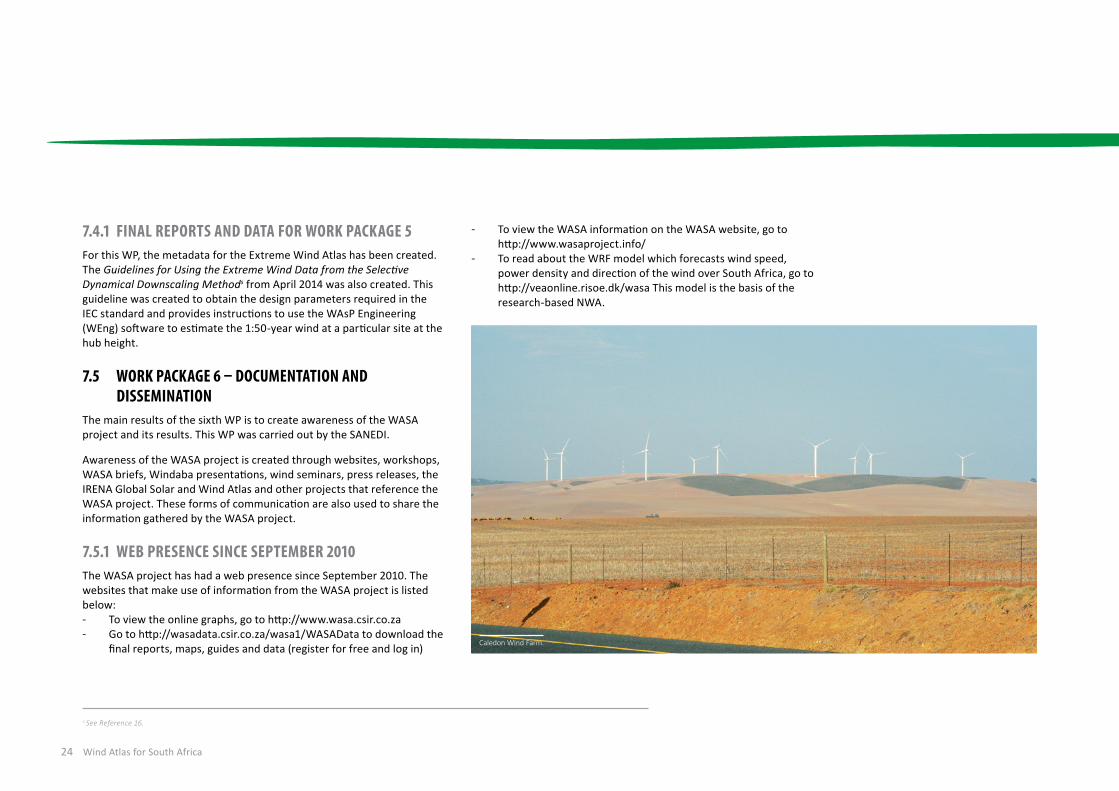
7.5 WORK PACKAGE 6 – DOCUMENTATION AND DISSEMINATION
The main results of the sixth WP is to create awareness of the WASA project and its results. This WP was carried out by the SANEDI.
Awareness of the WASA project is created through websites, workshops, WASA briefs, Windaba presentations, wind seminars, press releases, the IRENA Global Solar and Wind Atlas and other projects that reference the WASA project. These forms of communication are also used to share the information gathered by the WASA project.
7.5.1 WEB PRESENCE SINCE SEPTEMBER 2010The WASA project has had a web presence since September 2010. The websites that make use of information from the WASA project is listed below: - To view the online graphs, go to http://www.wasa.csir.co.za - Go to http://wasadata.csir.co.za/wasa1/WASAData to download the
final reports, maps, guides and data (register for free and log in)
- To view the WASA information on the WASA website, go to http://www.wasaproject.info/
- To read about the WRF model which forecasts wind speed, power density and direction of the wind over South Africa, go to http://veaonline.risoe.dk/wasa This model is the basis of the research-based NWA.
s See Reference 16.
Caledon Wind Farm.
25
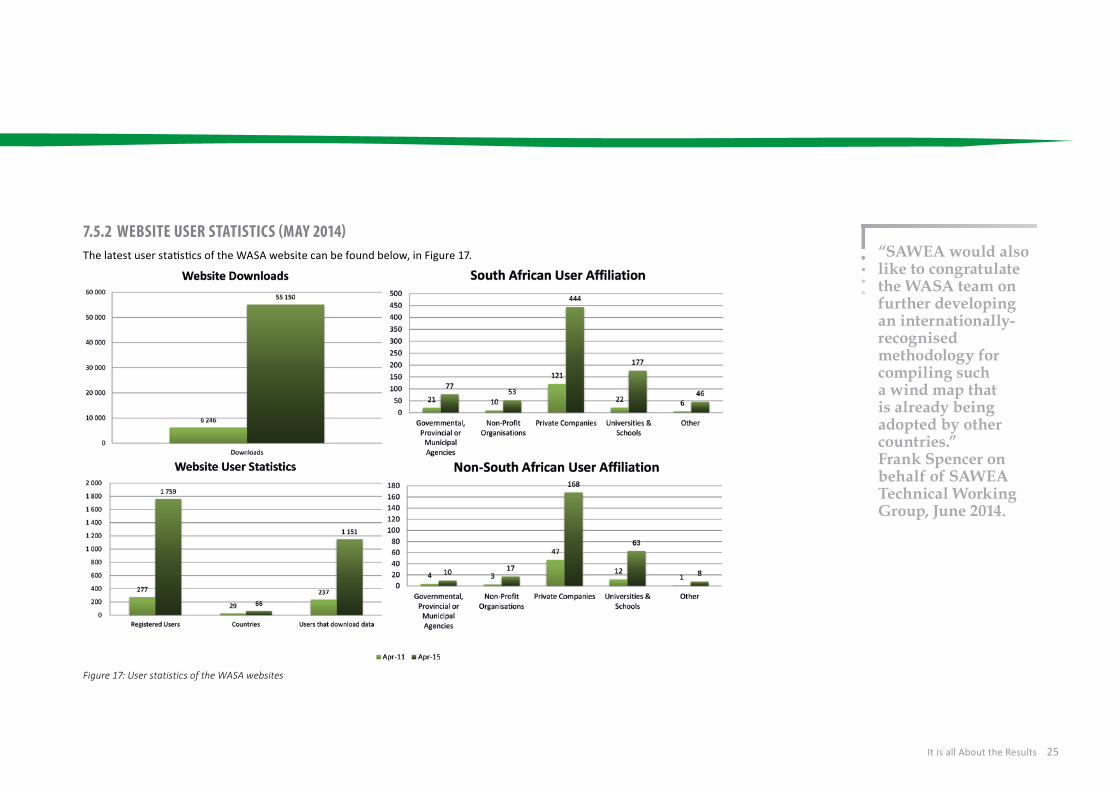
7.5.2 WEBSITE USER STATISTICS (MAY 2014)The latest user statistics of the WASA website can be found below, in Figure 17.
Figure 17: User statistics of the WASA websites
It is all About the Results
“SAWEA would also like to congratulate the WASA team on further developing an internationally-recognised methodology for compiling such a wind map that is already being adopted by other countries.” Frank Spencer on behalf of SAWEA Technical Working Group, June 2014.

Wind Atlas for South Africa26
7.5.3 WORKSHOPSFour workshops were completed since 2010 in order to distribute the information from the WASA project and to make people aware of the project. These were: - SAWEP Wind Atlas Workshop (completed on 4 March 2010); - WASA Mid-Term Workshop (completed on 14 to 16 March 2012); - DoE WASA Workshop (completed on 11 December 2012); and - SANEDI WASA Workshop (completed on 10 April 2014).
7.5.4 WINDABA PRESENTATIONSSince 2011, three Windaba presentations were done every year, as shown below: - In 2011, the Windaba was held in Cape Town on a comparative and
quantitative assessment of South Africa’s wind resource – the WASA project.
- In 2012, the Windaba presentation concerned quantifying South Africa’s wind resource – an update on the WASA project and verification against two years of measurements.
- In 2013, the Windaba presented on large-scale high-resolution wind resource mapping for SEA and wind farm planning and development.
7.5.5 FINAL WIND SEMINAR 8 APRIL 2014A final wind seminar was presented on 8 April 2014 and was divided into three sections. The three sessions concerned: - the WASA results; - an overview of the WASA project and the first two WPs; and - WP3 to WP5, including case studies.
7.5.6 PRESS RELEASESTwo press releases were created to make people aware of the project. The first press releaset announced the launch of South Africa’s first large-scale high-resolution wind resource map and notified people that the map would boost renewable energy efforts.
This press release can be read in its entirety at http://www.sanews.gov.za/south-africa/wind-resource-map-boost-renewable-energy-efforts
The second press releaseu was released on 8 April 2014 and notified the public about the completion of the project with the final seminar of the WASA Phase 1 taking place.
You can read this press release in its entirety at http://www.energy.gov.za/files/media/pr/2014/PressRelease-WASA-Seminar-08April2014.pdf
7.5.7 INTERNATIONAL RENEWABLE ENERGY AGENCY GLOBAL SOLAR AND WIND ATLAS
The WASA supports the DoE and the DoE Minister with the Clean Energy Ministerial and is a technical partner in the IRENA Global Solar and Wind Atlas initiative.
You can find out more about the other partners of the IRENA Global Solar and Wind Atlas initiative by visiting http://globalatlas.irena.org/Partnership.aspxThe WASA is also included in the catalogue of this initiative, as can be seen at http://irena.masdar.ac.ae/?map=405 as well as the initiative’s booklet at http://www.irena.org/DocumentDownloads/Publications/GA_Booklet_Web.pdf
t See Reference 19. u See Reference 20.
WM01 Alexander Bay.
27
7.5.8 PROJECTS REFERENCING THE WIND ATLAS FOR SOUTH AFRICA
The WASA project has also been referenced by other projects, increasing awareness of the project and distributing information to the public.
The Terms of Reference for Renewable Energy Mapping: Wind Pakistan, 2013 of the World Bank ESMAP Renewable Energy Resource Mapping initiativev referred to the WASA project as:
“In the numerical wind atlas supplied by the bidder, each cell shall provide downloadable directional Weibull distributions in WAsP lib-file format, applicable to a generalised wind climate with flat terrain and a uniform roughness of 0.03 m. (See, for example, the Wind Atlas for South Africa [WASA] project.)”
You can visit http://www.esmap.org/RE_Mapping for more information on the World Bank ESMAP Programme.
The Palestinian Energy Authority also made reference to the WASA project in their Request for Proposal in June 2013w for the Energy Sector Assistance in Palestine, Phase V project which was to produce a comprehensive, validated atlas for wind energy resource based on satellite data. They referenced the WASA project as follows:
“The consultant must supply all wind maps and data for the same heights above ground level as in the Wind Atlas for South Africa (WASA).”
“Directional Weibull distributions for each cell is the most important data, cf. the WASA model data online.”
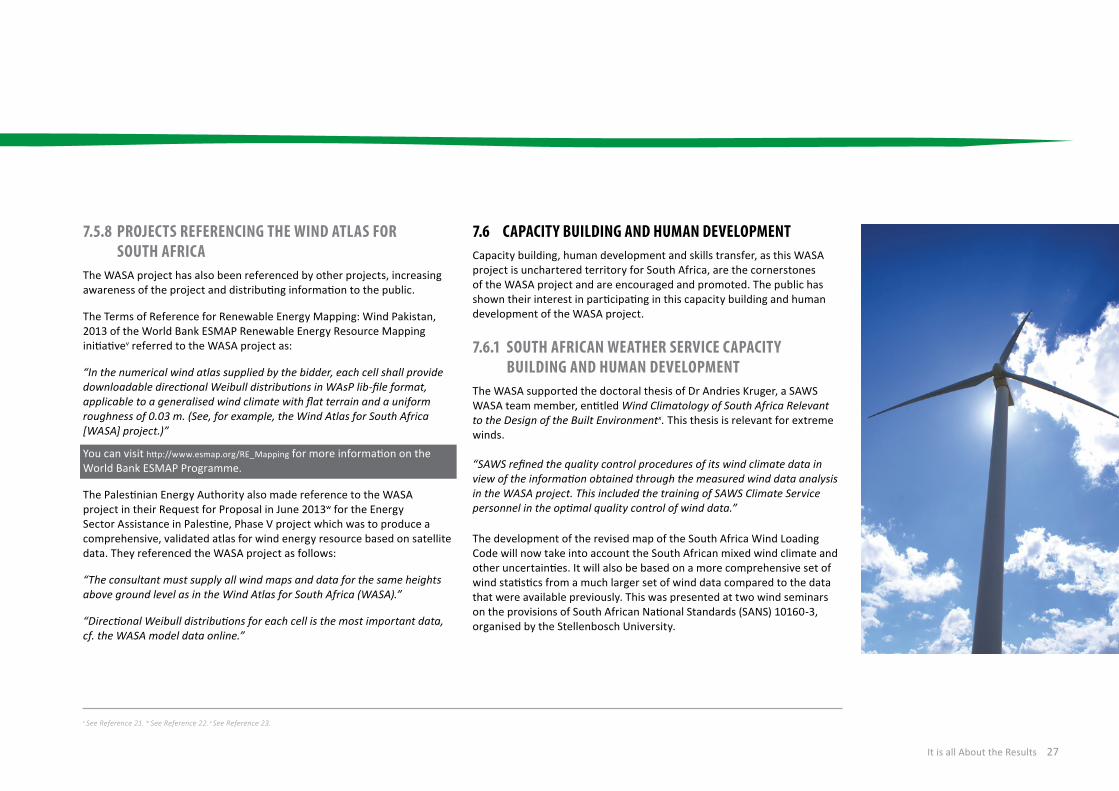
7.6 CAPACITY BUILDING AND HUMAN DEVELOPMENTCapacity building, human development and skills transfer, as this WASA project is unchartered territory for South Africa, are the cornerstones of the WASA project and are encouraged and promoted. The public has shown their interest in participating in this capacity building and human development of the WASA project.
7.6.1 SOUTH AFRICAN WEATHER SERVICE CAPACITY BUILDING AND HUMAN DEVELOPMENT
The WASA supported the doctoral thesis of Dr Andries Kruger, a SAWS WASA team member, entitled Wind Climatology of South Africa Relevant to the Design of the Built Environmentx. This thesis is relevant for extreme winds.
“SAWS refined the quality control procedures of its wind climate data in view of the information obtained through the measured wind data analysis in the WASA project. This included the training of SAWS Climate Service personnel in the optimal quality control of wind data.”
The development of the revised map of the South Africa Wind Loading Code will now take into account the South African mixed wind climate and other uncertainties. It will also be based on a more comprehensive set of wind statistics from a much larger set of wind data compared to the data that were available previously. This was presented at two wind seminars on the provisions of South African National Standards (SANS) 10160-3, organised by the Stellenbosch University.
v See Reference 21. w See Reference 22. x See Reference 23.
It is all About the Results
Wind Atlas for South Africa28
7.6.2 UNIVERSITY OF CAPE TOWN CLIMATE SYSTEMS ANALYSIS GROUP CAPACITY BUILDING AND HUMAN DEVELOPMENT
Students have directly or indirectly benefited from the WASA project. How we understand the many aspects of the wind climate of South Africa has been aided by these students’ work. Certain students have already graduated, while others are still studying.
7.6.2.1 Graduated StudentS
- Christopher Broderick (BSc Hons) used sonic detection and ranging (sodar) for wind measurements to assess the correlations of wind profiles from sodar, radiosonde and anemometer data.
- Teboho Nchaba (MSc) verified gridded seasonal wind forecasts over South Africa.
- Tich Mukunga (BSc Hons) graduated at the end of 2014 with an assessment of the wind power resource in the Sere region of the Western Cape.
7.6.2.2 Current StudentS
- Brendan Argent (PhD) is expected to graduate in July 2015 with a look at Towards an Uncertainty Atlas for Wind Forecasts in South Africa.
- Teboho Nchaba (PhD) is expected to graduate at the end of 2016 with an improved South African wind atlas from a multi-model super-ensemble.
- Zaccheus Olaofe (PhD) is expected to graduate at the end of 2017 with an assessment of the offshore wind resources along the West Coast of South Africa.
7.6.3 COUNCIL FOR SCIENTIFIC AND INDUSTRIAL RESEARCH CAPACITY BUILDING AND HUMAN DEVELOPMENT
The capacity and expertise of the CSIR can be divided into three main themes: measurements, data management and microscale modelling.
A number of staff members received training in various aspects of the project which ensured the final outcomes of the second, third and fourth WPs.
7.6.4 TECHNICAL UNIVERSITY OF DENMARK WIND ENERGY CAPACITY BUILDING AND HUMAN DEVELOPMENT
Jens Carsten Hansen, the DTU project leader, has stated the following regarding the WASA project’s contribution to research and training at the DTU:
“The WASA project is an applied research project for DTU through which we get an opportunity to pilot new models and methods in a real application and collect feedback for further developments and research. Depending on the definition of the term ‘capacity building’, this has certainly happened here at DTU, i.e. as we see it, WASA has contributed to building capacity at DTU, including teaching students and applied research.”
Xiaoli Guo Larsén (from the DTU) gave the below statement about WASA’s contribution to creating the background for further WAsP Engineering development:
“WASA has contributed to creating the background necessary for DTU decisions regarding how to further develop WAsP Engineering.”
“Capacity building, human development and skills transfer are the cornerstones of the WASA project.”
29
7.6.5 CAPACITY BUILDING AND HUMAN DEVELOPMENT IN MEASUREMENTS
The WASA project has also provided other valuable training for measurements: - Prinsloo, E. and Mabille, E. were trained in site selection to ensure
conformity with the WAsP criteria. The training was provided by DTU. - Truter, P., Hendricks, T., Prinsloo, E. and Mabille, E. were trained
in installing measurement sensors on the masts according to the Measnet and IEC standards. The training was provided by DTU.
- Prinsloo, E., Truter, P., Hendricks, T., Kieviet, J., Mashabala, S. and Connor, P.O. attended a Working at Heights course in June 2010 in Cape Town so they could comply with Safety, Health, Environmental and Quality (SHEQ) requirements.
- Prinsloo, E., Connor, P.O., Kieviet, J. and Hendricks, T. attended a course in August 2013 to be SHEQ certified again.
- Jelbert, H., Haasbroek, S. and Mabille, E. also completed the full SHEQ course for the WASA Phase 2.
- Von St Ange, U., August, M., Prinsloo, E. and Pietersen, S. were trained on the Rodeo Data Management System by DTU.
- Prinsloo, E. was trained in data quality control that enabled him to eventually take over the 10 stations’ data quality control from the DTU.
Both the Working at Heights and SHEQ recertification courses were conducted by Alpinist Safety Consultants at their premises in Montague Gardens.
7.6.6 CAPACITY BUILDING AND HUMAN DEVELOPMENT IN MICROSCALE MODELLING
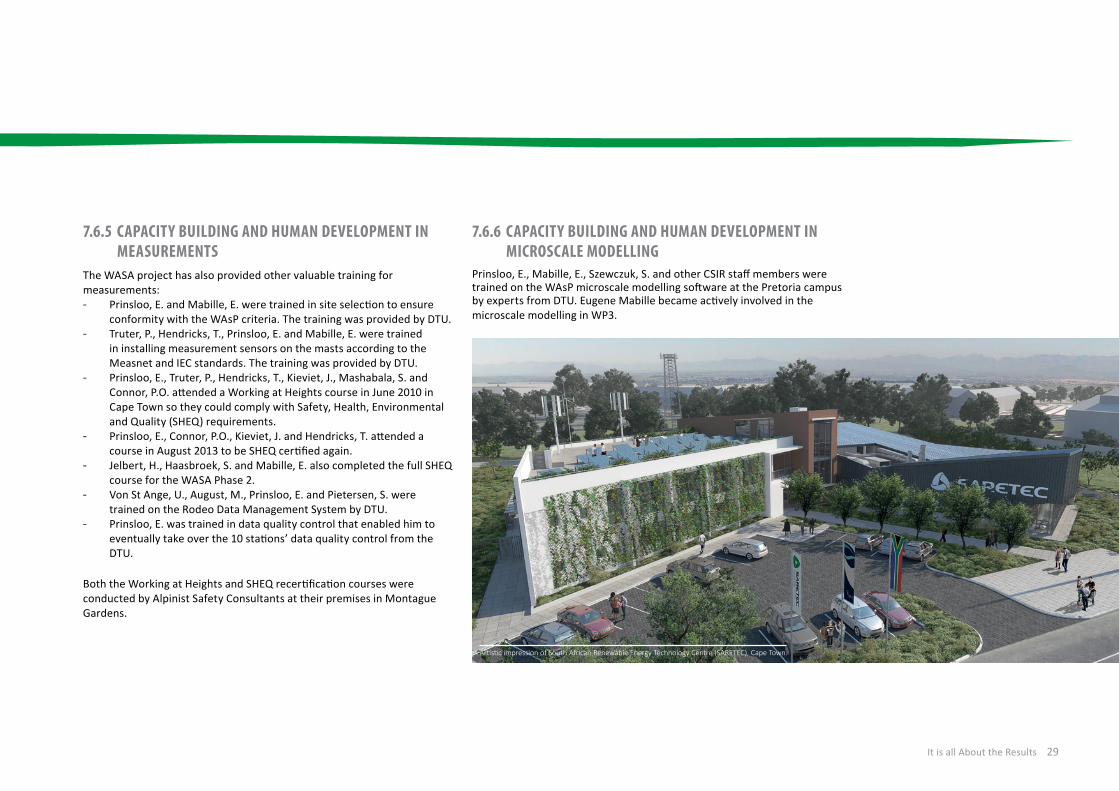
Prinsloo, E., Mabille, E., Szewczuk, S. and other CSIR staff members were trained on the WAsP microscale modelling software at the Pretoria campus by experts from DTU. Eugene Mabille became actively involved in the microscale modelling in WP3.
It is all About the Results
Artistic impression of South African Renewable Energy Technology Centre (SARETEC), Cape Town.
Wind Atlas for South Africa30
7.6.7 INTERNATIONAL CONFERENCES, PRESENTATIONS AND PUBLISHED PAPERS FOR CAPACITY BUILDING AND HUMAN DEVELOPMENT
7.6.7.1 PubliCation PreSented at an international ConferenCe
Hahmann, A.N., Badger, J., Volker, P., Nielsen, J.R., Lennard, C., Hansen, J.C. & Mortensen, N.G. 2014. Validation and Comparison of Numerical Wind Atlas Methods: the South African Example. Presented to European Wind Energy Association, European Wind Energy Conference and Exhibition 2014, Barcelona, Spain, 10 March 2014.
7.6.7.2 referenCe of the Wind atlaS for South afriCa ProjeCt in ConferenCe PaPerS
Kruger, A.C., Goliger, A.M. & Retief, J.V. 2011. Integration and Implications of Strong Wind Producing Mechanisms in South Africa. Presented to ICWE 13, Amsterdam, Netherlands, 10-15 July 2011.
Kruger, A.C., Goliger, A.M. & Retief, J.V. 2011. An Updated Description of the Strong-Wind Climate of South Africa. Presented to ICWE 13, Amsterdam, Netherlands, 10-15 July 2011.
Kruger, A.C., Goliger, A.M. & Retief, J.V. 2013. Directional Analysis of Extreme Winds under Mixed Climate Conditions. Presented to EACWE 2013, Cambridge, United Kingdom, 7-11 July 2013.
Kruger, A.C., Goliger, A.M. & Retief, J.V. 2013. Representivity of Wind Measurements for Design Wind Speed Estimations. Presented to EACWE 2013, Cambridge, United Kingdom, 7-11 July 2013.
Larsén, X.G., Kruger, A.C., Badger, J. & Jørgensen, H.E. 2013. Extreme Wind Atlases of South Africa from Global Reanalysis Data. Presented to EACWE 2013, Cambridge, United Kingdom, 7-11 July 2013.
Kruger, A.C., Goliger, A.M., Larsén, X.G. & Retief, J.V. 2014. Optimal Application of Climate Data to the Development of Design Wind Speeds. Presented to 26th Conference on Climate Variability and Change (Annual Meeting of the American Meteorological Society), Atlanta, United States of America, February 2014.
Larsén, X.G., Kruger, A.C., Badger, J. & Jørgensen, H.E. 2014. Dynamical and Statistical Downscaling Approaches for Extreme Wind Atlas of South Africa. Presented to EMS conference, Reading, United Kingdom, February 2014.
7.6.8 PUBLICATIONS PUBLISHED FOR CAPACITY BUILDING AND HUMAN DEVELOPMENT
There are also numerous publications which have made use of the WASA project, including the following: - Hansen, J.C., Hahmann, A.N., Mortensen, N.G. & Badger, J. 2011. How
Can Denmark Support Wind Mapping in Africa? Third Wind Energy Seminar between South Africa and Denmark. Presented to Side Event at COP17, Durban, South Africa, 8 December 2011.
- Mortensen, N.G., Hansen, J.C., Kelly, M.C., Prinsloo, E., Mabille, E. & Szewczuk, S. 2012. Wind Atlas for South Africa (WASA) Station and Site Description Report. Presented to Danmarks Tekniske Universitet, Risø Nationallaboratoriet for Bæredygtig Energi. p70. (Risø-I; No. 3271 [ed.3][EN]).
- Mortensen, N.G., Hansen, J.C., Kelly, M.C., Szewczuk, S., Mabille, E. & Prinsloo, E. 2012. Wind Atlas for South Africa (WASA) Observational Wind Atlas for 10 Met Stations in Northern, Western and Eastern Cape Provinces. Presented to Danmarks Tekniske Universitet, Risø Nationallaboratoriet for Bæredygtig Energi. p42. (Risø-I; No. 3273 [ed.2][EN]).
- Mortensen, N.G., Hansen, J.C., Mabille, E. & Spamer, Y. 2013. Large-Scale, High-Resolution Wind Resource Mapping for Strategic Environmental Assessment and Wind Farm Planning and
“There are numerous publications which have made use of the WASA project.”
31
Development. Presented to Windaba 2013, Cape Town, South Africa, 25 September 2013.
- Hahmann, A.N., Badger, J., Volker, P., Nielsen, J.R., Lennard, C., Hansen, J.C. & Mortensen, N.G. 2014. Validation and Comparison of Numerical Wind Atlas Methods: the South African Example. Presented to European Wind Energy Association, European Wind Energy Conference and Exhibition 2014, Barcelona, Spain, 10 March 2014.
- Mortensen, N.G., Badger, J., Hansen, J.C., Mabille, E. & Spamer, Y. 2014. Large-Scale, High-Resolution Wind Resource Mapping for Wind Farm Planning and Development in South Africa. Presented to Proceedings of EWEA 2014, European Wind Energy Association, 2014.
- Goliger, A.M., Retief, J.V., Dunaiski, P.E. & Kruger, A.C. 2009. Revised Wind-Loading Procedures for SANS 10160. In Retief, J.V. & Dunaiski, P.E. (eds). Background to SANS 10160. Basis of Structural Design and Actions for Buildings and Industrial Structures. SunMedia, Stellenbosch.
Andrea N.H. (DTU Wind Energy) said the following:
“The DTU wind atlas method is based on the generalisation of the wind climatologies derived from the mesoscale modelling. This generalisation post-processing method has been used extensively in a number of wind resource assessment studies within the KAMM-WAsP method. The WRF- based WASA wind atlas is the first wind atlas study where the generalisation has been carried out on the WRF-model output with excellent results.”
7.6.9 JOURNAL ARTICLES PUBLISHED FOR CAPACITY BUILDING AND HUMAN DEVELOPMENT
The following journal articles have referenced the WASA project or referenced methodologies developed or results obtained during the course of the WASA project:
- Goliger, A.M. & Kruger, A.C., et al. 2013. Comparative Study between Poland and South Africa: Wind Climates, the Related Damage and Implications of Adopting the Eurocode for Wind Action on Buildings. Archives of Civil Engineering.
- Kruger, A.C., Retief, J.V. & Goliger, A.M. 2013. Strong Winds in South Africa: Part I – Application of Estimation Methods. Journal of the South African Institution of Civil Engineering.
- Kruger A.C., Retief, J.V. & Goliger, A.M. 2013. Strong Winds in South Africa: Part II – Mapping of Updated Statistics. Journal of the South African Institution of Civil Engineering.
- Kruger, A.C., Goliger, A.M., Retief, J.V. & Sekele, S. 2012. Clustering of Extreme Winds in the Mixed Climate of South Africa. Wind and Structures.
- Kruger, A.C., Goliger, A.M., Retief, J.V. & Sekele, S. 2010. Strong Wind Climatic Zones in South Africa. Wind and Structures.
- Larsén, X.G., Mann, J., Rathmann, O. & Jørgensen, H. 2013. Uncertainties of the 50-Year Wind from Short Time Series Using Generalized Extreme Value Distribution and Generalized Pareto Distribution. Wind Energy.
7.6.10 DISSEMINATION OF WIND ATLAS FOR SOUTH AFRICA RESULTS FOR CAPACITY BUILDING AND HUMAN DEVELOPMENT
WASA results have also been disseminated through: - Hahmann, A.N., Badger, J., Morgensen, N.G. & Hansen, J.C. 2009.
From Trades to Turbines: The Art and Science of Wind Energy Resource Assessment. Presented to WASA Mesoscale Workshop, Pretoria, South Africa, 24 September 2009.
- Hahmann, A.N. & Kruger, A. 2010. What is the Large-Scale Wind Regime in South Africa? Presented to SAWEP Wind Atlas Workshop, Cape Town, South Africa, 4 March 2010.
- Hahmann, A.N., Badger, J., Mortensen, N.G. & Hansen, J.C. 2010.
It is all About the Results
Wind Atlas for South Africa32
Wind Atlas Introduction. Presented to SAWEP Wind Atlas Workshop, Cape Town, South Africa, 4 March 2010.
- Hahmann, A.N., Badger, J., Vincent, C.L., Kelly, M., Volker, P., Refslund, J., Hansen, J.C., Mortensen, N., Lennard, C. & Argent, B. 2014. WP1: Mesoscale Modelling for the Second Verified WASA Numerical Wind Atlas. Presented to Final WASA wind seminar, Cape Town, South Africa, 8 April 2014.
- Hahmann, A.N. 2014. The Wind Atlas of South Africa. Presented to DTU Wind Energy Internal Seminar, Roskilde, Denmark, 4 May 2014.
7.6.11 OTHER CAPACITY DEVELOPMENT ACTIVITIESFurther capacity development activities that have been performed by the WASA project are given below: - Brendan Argent was able to attend the 2012 European Wind Energy
Association meeting and present his work there. - Teboho Nchaba, Brendan Argent and Christopher Broderick
presented their work at the annual meetings of the South African Society of Atmospheric Sciences.
- Dr Chris Lennard has learned advanced techniques related to the WRF model in his work with Dr Andrea Hahmann at DTU and is also trained in the use of the WAsP microscale model.
- Assessment of the WASA forecast using SAWS wind data was carried out.
“All WASA data and analyses are in the public domain.”
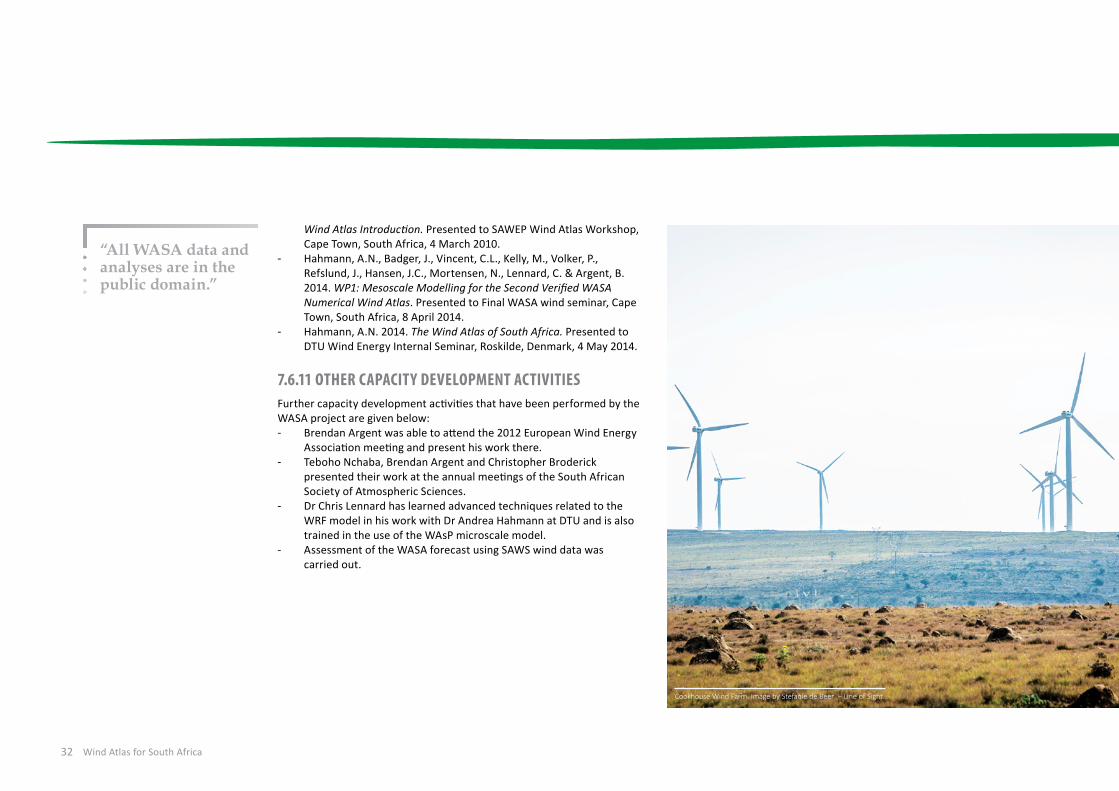
Cookhouse Wind Farm. Image by Stefanie de Beer – Line of Sight.
33
All the project objectives and expected project outcomes have been met and exceeded within the budget for the WASA project. For example, the WASA wind resource map based on both the KAMM method and the WRF model could be done without making any changes to the project budget for the entire (100%) WASA domain and with the time series data being available from 1 September 1990 to 31 December 2012.
The WASA project, while under implementation, could help the SIP 8: Green Energy SEA initiative Strategic Environmental Impact Assessment study for PV and wind that was implemented by the DEA. The WASA project could also help the revision of the South African Building Load Codes for wind.
The WASA generates much more than data with in-depth analysis, tools (for example the “Tadpole”) and guides. Of particular importance were the setup, customisation and validation (measurements, wind speed and direction distributions, and seasonal and daily cycles) of the WRF model for wind resource assessment.
Minister of Energy, Tina Joemat-Pettersson, stated (speech delivered by Acting DG at the Windaba 2014):
“I am now happy to say the key results of the First Phase that have been independently verified by a team of scientists working on the Wind Atlas project of South Africa using both numerically modelled data and practical observational methods and analysis, confirm that South Africa has an excellent wind resource.”
The project helped with capacity building and human development both in South Africa, for example the six UCT students that benefitted and contributed to the WASA project, and overseas and other projects, for example the World Bank ESMAP Renewable Energy Resource Mapping initiative, are using the WASA project’s information. The amount of
8CONCLUDING REMARKS
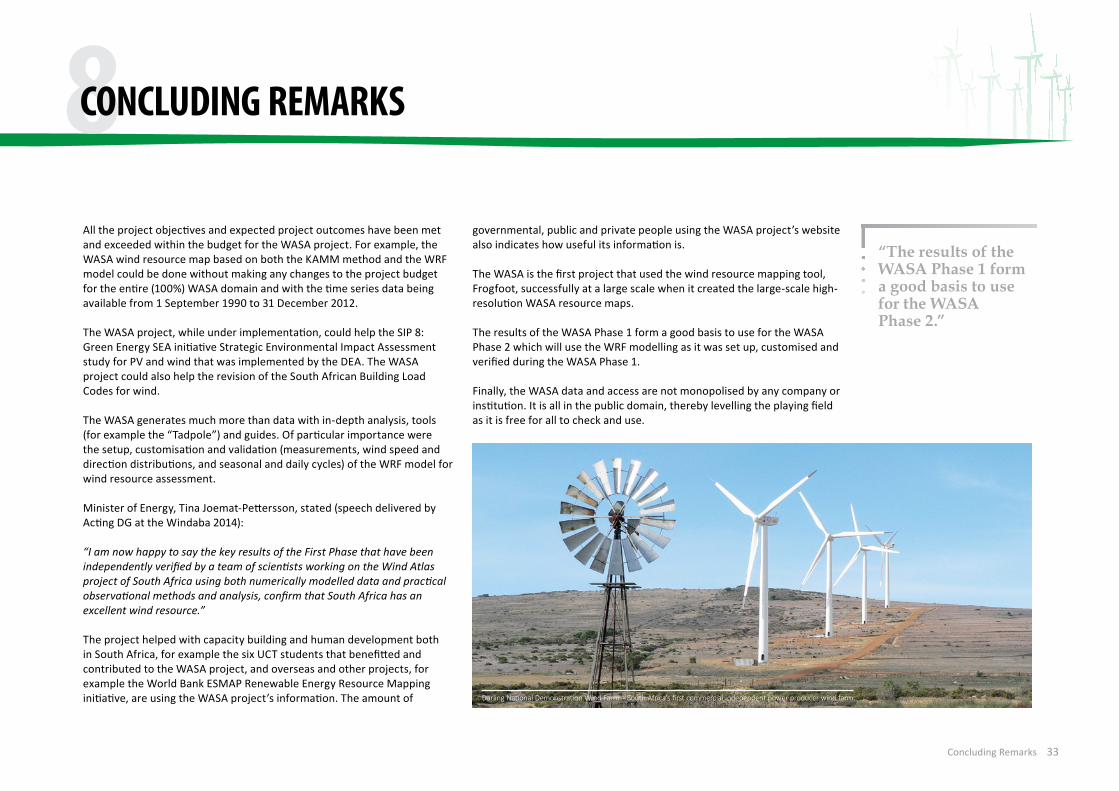
Darling National Demonstration Wind Farm – South Africa’s first commercial independent power producer wind farm.
governmental, public and private people using the WASA project’s website also indicates how useful its information is.
The WASA is the first project that used the wind resource mapping tool, Frogfoot, successfully at a large scale when it created the large-scale high-resolution WASA resource maps.
The results of the WASA Phase 1 form a good basis to use for the WASA Phase 2 which will use the WRF modelling as it was set up, customised and verified during the WASA Phase 1.
Finally, the WASA data and access are not monopolised by any company or institution. It is all in the public domain, thereby levelling the playing field as it is free for all to check and use.
“The results of the WASA Phase 1 form a good basis to use for the WASA Phase 2.”
Concluding Remarks

Wind Atlas for South AFrica34
“The WASA initiative came at a critical time in the development of the wind industry in South Africa. The extremely robust affirmation it provided of the excellent wind resource in the country and its wide geographical distribution served to enhance developer interest and urgency and to reassure policy makers that wind is an energy source they can bank on. These aspects have been instrumental in the rapid growth and the success of our wind industry. The opportunity exists now with private sector continuing measuring the exact wind regime and WASA expanding to map the remainder of the country, together confirming and unlocking South Africa’s excellent wind resource. The future relevance of WASA looks as unequivocal as the historical relevance.”
Johan van den Berg CEO, SAWEA, 2015
Hopefield Wind Farm. Photo courtesy of Umoya Energy (RF) (Pty) Ltd.

Appendices 35
APPENDICES
Acronym Description
AGL Above ground level
CSAG Climate System Analysis Group
CSIR Council for Scientific and Industrial Research
DEA Department of Environmental Affairs
DME Department of Minerals and Energy
DoE Department of Energy
DST Department of Science and Technology
DTU Technical University of Denmark
Eskom Electricity Supply Commission
ESMAP Energy Sector Management Assistance Programme
EWEA European Wind Energy Association
GEF Global Environment Facility
GIS Geographic Information System
GSM Global System for Mobile Communications
GW Gigawatt
GWh Gigawatt hour
IEC International Electrotechnical Commission
IRENA International Renewable Energy Agency
IRP Integrated Resources Plan
KAMM Karlsruhe Atmospheric Mesoscale Model
m Metre
ms-1 Metres per second
MW Megawatt
Acronym Description
NWA Numerical Wind Atlas
PIU Project Implementation Unit
REIPPP Renewable Energy Independent Power Producers Programme
RMSE Root mean square error
Rodeo Risø Online Database for Environmental Observations
SANEDI South African National Energy Development Institute
SANS South African National Standards
SAWEA South African Wind Energy Association
SAWEP South African Wind Energy Programme
SAWS South African Weather Service
SEA Strategic Environmental Assessment
SHEQ Safety, Health, Environmental and Quality
ToT Training of Trainers
UCT University of Cape Town
UNDP United Nations Development Programme
VAT Value Added Tax
VNWA Verified Numerical Wind Atlas
WASA Wind Atlas for South Africa
WAsP Wind Atlas Analysis and Application Programme
WM Wind mast
WP Work package
WRF Weather Research and Forecasting
APPENDICES
Acronyms

Wind Atlas for South AFrica36
ENDNOTES/REFERENCES1. 2003. Review of Wind Energy Resource Studies in South Africa.2. Africa Development Bank. 2004. Strategic Study of Wind Energy
Deployment in Africa.3. Mid-term workshop, 14 & 16 March 2012. Wind Atlas Methodology –
The Why and The How? 4. Hansen, J.C. & Mortensen, N.G. 2014. Report on Measurements.5. 2014. WASA Training Presentation Slides Final.6. 2010. Project Brief September 2010 at Official Opening of Data
Display and Download Websites. 7. 2014. Project Brief.8. International Renewable Energy Agency. 2012. IRENA Case Study
2013 Wind Atlas for South Africa. 9. Hahmann, A.N., Badger, J., Vincent, C.L., Kelly, M.C., Volker, P.J.H.,
Refslund, J., Lennard, C. & Argent, B. 2014. Mesoscale Modelling for the Wind Atlas for South Africa (WASA) Project.
10. Mabille, E. 2014. South African Wind Atlas (WASA) Guide. 11. Mabille, E., Prinsloo, E., Mortensen, N.G. & Hansen, J.C. 2014. Report
on Measurements. 12. Mabille, E. & Prinsloo, E. 2014. WP2 Report on Training. 13. Mortenses, N.G., Hansen, J.C., Kelly, M.C., Prinsloo, E., Mabille, E. &
Szewczuk, S. 2014. Station and Site Description Report. 14. Mortensen, N.G., Hansen, J.C., Kelly, M.C., Szewczuk, S., Mabille, E.
& Prinsloo, E. 2014. Observational Wind Atlas for 10 Met Masts in Northern, Western and Eastern Cape Provinces.
15. Mabille, E. 2014. Brief Introduction to Working with WASA Files. 16. Larsén, X.G., Kruger, A. & Cronin, T. 2014. Guidelines for Using the
Extreme Wind Data from the Selective Dynamical Downscaling Method.
17. Hansen, J.C. & Lennard, C. 2011. A Comparative and Quantitative Assessment of South Africa’s Wind Resource – the WASA Project. Presented to Windaba 2011. Cape Town, South Africa.
18. 2014. Wind Atlas for South Africa (WASA) Phase 1 Project Final Wind Seminar. Cape Town, South Africa. 8 April 2014.
19. SAnews.gov.za. 2013. Wind Resource Map to Boost Renewable Energy Efforts Press Release.
20. Department of Energy. 2014. Wind Atlas for South Africa (WASA) Phase 1 – Final Seminar Press Release.
21. World Bank Energy Sector Management Assistance Programme Renewable Energy Resource Mapping Initiative. 2013. Renewable Energy Mapping: Wind in Pakistan, South Asia Region, Project ID: P146140, Selection: 1118422.
22. Palestinian Energy Authority. 2013. Request for Proposal for the Energy Section Assistance in Palestine, Phase V (RFP No. Phase V-PEA/CS-W).
23. Kruger A.C. 2010. Wind Climatology of South Africa Relevant to the Design of the Built Environment. PhD dissertation Stellenbosch University http://hdl.handle.net/10019.1/6847
FURTHER READINGIt is advised that you visit the following WASA websites for further reading: - To view the online graphs, go to http://www.wasa.csir.co.za - Go to http://wasadata.csir.co.za/wasa1/WASAData to download the
final reports, maps, guides and data (register for free and log in) - To view the WASA project information, presentations, etc., go to
http://www.wasaproject.info/ - To read about the WRF model which forecasts wind speed, power
density and direction of the wind over South Africa, go to http://veaonline.risoe.dk/wasa
Endnotes/References and Further Reading

Acknowledgements and Implementation PartnersThe WASA project is an initiative of the Government of South Africa – the DME (now the DoE) – and the project is co-funded by the UNDP-GEF through the SAWEP with UNDP support; and the Royal Danish Embassy.
The SANEDI is the executing agency, coordinating and contracting with the implementing partners: the CSIR, the UCT CSAG, the SAWS and the DTU Wind Energy (formerly Risø DTU).
COUNCIL FOR SCIENTIFIC AND INDUSTRIAL RESEARCHThe CSIR improves the competitiveness of industry and the quality of life of the people of the country. South Africa’s CSIR was established in 1945 as a science council by an act of Parliament. It has a proud track record and a bright and challenging future through science, engineering and technology, undertaken by its innovative individuals and teams.
SOUTH AFRICAN NATIONAL ENERGY DEVELOPMENT INSTITUTE The SANEDI is a Schedule 3A state-owned entity. The main function of the SANEDI is to direct, monitor and conduct applied energy research and development, demonstration and deployment as well to undertake specific measures to promote the uptake of green energy and energy efficiency in South Africa.
UNIVERSITY OF CAPE TOWNThe UCT is a public research university located in Cape Town in the Western Cape province of South Africa. UCT was founded in 1820 as the South African College and is the oldest university in South Africa and the second oldest extant university in Africa.
SOUTH AFRICAN WEATHER SERVICEThe SAWS is a Section 3(A) public entity under the Department of Environmental Affairs. It is the authoritative voice for weather and climate forecasting in South Africa. The company became a public entity on 15 July 2001 in terms of the South African Weather Service Act, 2001 (Act No. 8 of 2001).
TECHNICAL UNIVERSITY OF DENMARK WIND ENERGYThe DTU Department of Wind Energy is a globally leading centre for wind energy research and development with technical-scientific competences in the international front and with a unique integration of research, education and public as well as private sector consulting.
Appendices 37