the psychology of decisions to abandon waits for service narayan
TRANSCRIPT
1
Journal of Marketing Research Article Postprint © 2011, American Marketing Association All rights reserved. Cannot be reprinted without the express permission of the American Marketing Association.
The Psychology of Decisions to Abandon Waits for Service
Narayan Janakiraman*
Robert J. Meyer
Stephen J. Hoch
Author Notes
Narayan Janakiraman is Assistant Professor of Marketing at the Eller College of Management, University of Arizona, 320L McClelland Hall, 1120 East Helen Street, Tucson, AZ, 85721, Phone (520) 621-2885, Fax (520) 621-7483, Email: [email protected]. Robert J. Meyer is the Gayfryd Steinberg Professor of Marketing at the Wharton School, University of Pennsylvania, 700 Jon M. Huntsman Hall, 3730 Walnut Street, PA 19104-6340, Phone (215) 898-8243, Fax (215) 898-2534, Email: [email protected]. Stephen J. Hoch is the John J. Pomerantz Professor of Marketing at the Wharton School, University of Pennsylvania, 700 Jon M. Huntsman Hall, 3730 Walnut Street, PA 19104-6340, Phone (215) 898-8243, Fax (215) 898-2534, Email: [email protected]. The authors wish to thank Mrinal Ghosh, Raji Srinivasan, Amnon Rapaport and Shankar Ganesan for their inputs on earlier versions of the document.

2
The Psychology of Decisions to Abandon Waits for Service
Abstract
This research investigates the process that underlies consumer decisions whether to
abandon waits for service. The work centers on a hypothesis that stay-or-renege decisions are
made through a process that blends two opposing psychic forces: an escalating displeasure of
waiting versus an escalating commitment to a wait that has been initiated. The consequence is a
predicted tendency for abandonments to be most likely near the mid-point of waits, which is sub-
optimal for many waiting time distributions. This hypothesis is tested using data from three
laboratory experiments in which participants play a time-management game that involves
waiting for downloads from different computer servers, as well as field data on hang- ups from
an emergency call center in India. The data lend support to the proposed competing hazards
model, and show that the trade-off between desires to abandon and persist is moderated by such
contextual factors as the initial number of alternative queues and the amount of distracting
activity engaged in during a wait.
Keywords: Time perception, Waits, Queues, Renege, Retrial

3
Consumers often abandon waits hoping to get faster service by returning later or by
joining a different queue. Shoppers switch check-out lines, web users refresh their browsers
hoping for faster downloads, and visitors to theme parks abandon queues in the hope of finding
rides that offer shorter waits. Abandonments also occur, however, in settings where the
consequences can be far more substantial for both consumers and firms. A consumer who
prematurely hangs up while placed on hold for an emergency service may end up incurring
delays that are potentially life-threatening, and a firm whose customers terminate calls or web
sessions prior to completing service may face a significant loss of revenue if purchases then are
made from competing sellers. To illustrate the importance firms place on reducing such
abandonments, in 2006 3.7% of the working population of the United States was employed in
call-center operations designed to better manage the duration of waits (Direct Marketing News,
2006).
The purpose of this paper is to understand how consumers decide whether to abandon
waits from queues. We focus on a time-management problem in which a consumer faces a set of
alternative queues with uncertain wait times--such as checkout lines in a grocery store--and seeks
to minimize the length of time to service. Upon joining a queue the consumer can choose to
abandon it at any time to initiate a new wait in one of the alternatives. The consumer faces a
series of such waiting tasks, and seeks to make stay-or-abandon decisions so as to maximize the
number of waits that can be completed within a fixed time frame. The problem is thus akin to
the dilemma faced by an office worker trying to complete as many personal errands as possible
over a lunch hour, or family at an amusement park trying to maximize the number of rides they
experience within a day.

4
We study abandonment decisions that arise in the course of recurrent waits because of the
control they afford over an important real-world driver of abandonment decisions: the
opportunity cost of forgoing alternative activities. Because when waits are recurrent
abandonment from one queue merely triggers a new wait from an alternative, the opportunity
cost of waiting in a queue can be precisely defined by the expected gain (or loss) in the number
of waits that could be completed by abandoning it and starting anew—a value that is driven by
the probability distribution over waiting times. Hence, when waits are recurrent there is an
unambiguous rational policy that guides abandonment: one should never leave a queue if it
would lengthen the mean time to service within the available time budget.
Central to the work is a hypothesis that consumers will often depart from such rational
prescriptions about waiting, however, by making stay-or-renege decisions through a subjective
algebra that balances two competing psychic forces: a growing disutility for waiting that induces
a desire to abandon queues as time evolves, and a growing commitment to seeing waits through
to their end as the time until likely conclusion shrinks. The balancing of these two forces yields
an inverted U-shaped hazard function that will be suboptimal for many waiting-time
distributions, causing decision makers to abandon waits that should be persisted and staying too
long in those that should be abandoned.
We partition our discussion into four phases. We begin by describing the decision task
and characterizing how a rational decision maker would solve it. We then review prior
behavioral work on waiting that suggests how actual abandonment decisions likely depart from
this normative benchmark. This review then forms the basis of a behavioral theory of queue-
switching decisions that we test through three laboratory studies. We conclude with a discussion

5
of the implications of the findings for a broader range of real-world problems in waiting-time
management.
Theory
The Decision Task and its Normative Solution
In this paper we study a time-management problem in which individuals seek to
minimize the time spent waiting in one of a set of alternative queues, each of uncertain duration.
While such dilemmas arise in a number of real-world settings, the specific task we study both
theoretically and empirically closely parallels that faced by consumers when downloading music
or video content from peer-to-peer server sites (e.g., www.kazaa.com, www.bearshare.com).
There, like here, upon logging in a consumer is given a menu of servers from which he or she
can download a desired item of content (e.g., an MP3), but the time to complete a download
from each server is uncertain, being a function of such things as host connection speed and
server load. To simplify the problem for study we assume that the consumer can only download
content from one server at a time, and uncertainty about the wait is a random variable whose
mean and variance are correctly surmised by the decision-maker. Once a wait is initiated the
decision-maker has the option to abandon it at any point to start a new wait in a different queue,
but if the decision-maker abandons a queue, all invested time is lost; he or she cannot resume
progress at the same place later. The decision maker faces a fixed time budget, and seeks to earn
as many rewards (e.g. download as many songs) as possible before the overall budget expires.
In Appendix A we describe the mathematical conditions under which an abandonment
policy would be optimal for a given waiting time distribution within such a task. Consistent with

6
the analytic results on rational abandonment from exponential queues derived by Mandelbaum
and Shimkin (2000), at its core is the following simple intuition: one should never abandon a
wait from a queue when the expected time remaining is less than the expected duration of an
entirely new wait. Because for any uni-modal distribution (e.g., exponential, normal, or
uniform) the expected time to completion will be strictly decreasing in the time already invested,
reneging will rarely be optimal; as long as one’s goal is simply to minimize completion time, if a
queue is worth joining it is probably worth completing (see also Shimkin & Mandelbaum 2002).
Of course, there will be could be some multi-modal distributions for which the expected
time remaining in a queue is not strictly decreasing in the time already invested, and in such
cases abandonment could be rational. Mandelbaum and Shimkin (2000) give the example of fault
distributions where queues have either “working” or “broken” states of operation. For example,
if a download server shows no progress after a few moments of waiting, one might reasonably
conclude that it is off line, providing a rational incentive to switch to another. In Appendix A we
show that a rational decision-maker who faces such a partitioned distribution could have a
rational incentive to renege if: 1) the maximum wait given that the system is in a fault state is
increasing relative to that of the working state; and 2) the long-term odds of the fault state are
increasingly large.
How and why consumer decisions may depart from rational benchmarks
While the simple advice that “a queue worth joining is a queue worth persisting” might
well have a normative basis for many waiting problems, it is advice that is clearly often violated
in natural settings. To illustrate this, in Figure 1 we plot the distribution of times-to-
abandonment
==================

7
Insert Figure 1 about here
==================
of 322,808 calls made to an emergency (108) call center in Hyderabad, India in August, 20091,
where calls were received and handled similar to a police dispatch unit handling 911 calls in the
United States. In all cases these calls we not frivolous; they were made to report such serious
events as heart attacks, strokes, and crimes. The Figure displays two mass points of reneging:
one that occurs almost instantaneously within 10 seconds after a call is placed (presumably
reflecting unintended dials or mechanical faults), and another within 120 seconds of being placed
on hold by an operator.
In an attempt to understand the reason for the abandonments, a random sample of eight
hundred and six callers who hung-up during the last week of August 2009 were contacted, the
same day the call was placed, and asked for reason they terminated the call. While 48% were
terminated for such simple reasons such as the call was unintentional, 52% were motivated by
apparent impatience, either because a desire to pursue other remedies for the problem in lieu of
waiting (18%), or simply by a desire to hang up and dial again (34%). Most tellingly, within this
latter group of re-dialers few benefited from their impatience, as the time to reach an attendant
increased from 177 seconds for a non-reneged wait to 447 seconds for a call that was abandoned
once and answered on the first retrial.
Are these hang-ups evidence of decision mistakes? The answer, of course, is uncertain.
While some the 34% who hung up only to redial again were almost certainly displaying
excessive impatience, some of the hang-ups-then-redials could well have had a rational basis in
opportunity costs, such as a caller who hangs up to administer emergency care before redialing.

8
Likewise, it could well be that some of these abandonments were mistakes of excessive patience,
staying too long in the line when an earlier hang-up would have been optimal.
In this work we offer a body of theoretical and empirical evidence suggesting that
decisions to abandon waits from these and other queues will be prone to systematic biases, and,
depending on the waiting-time distribution, both kinds of mistakes are possible—aborting too
soon and persisting too long. The reason is that waiting decisions are hypothesized to be
influenced by two sets of psychological factors not typically recognized in normative models: 1)
myopic consideration of current and future waiting costs (e.g., Taylor 1994); and 2) a competing
urge to complete goals whose realization is perceived as close at hand (e.g., Cheema and Bagchi
2011; Kivetz, Urminsky, and Zheng 2004).
1. Myopia and the psychic cost of waiting. Few people find waiting to be pleasant
affairs. Researchers who have studied affective response to waits offer a number of reasons for
their intuitive unpleasantness: the longer one waits in a queue the more one is likely to mentally
focus on the forgone benefits of alternative activities, experience boredom, and, in some cases,
experience heightened feelings of anxiety and stress (e.g., Carmon & Kahneman, 1995; Gelfand-
Miller, Kahn, & Luce, 2008; Maister, 1985; Taylor, 1994). While we are not aware of empirical
studies that have formally mapped the time-course of emotions while waiting in a queue (the
primary exception being a working paper by Carmon & Kahneman, 1995), waiting is widely
presumed to incur psychic costs that increase monotonically in time (e.g., Osuna, 1984).
But whether psychic waiting costs are sufficient to explain reneging from recurrent
queues, however, is less clear than one might first appear. First, in their theoretical analysis of
rational reneging from a single, non-recurrent, queue Mandelbaum and Shimkin (2000) find that
if wait times are exponential and waiting costs are a linear in time invested, then a rational

9
decision maker who anticipates these waiting costs will either stay in the queue until served or
never join it. Reneging is rational in such cases only if waiting costs take on certain concave
forms, increasing at an increasing rate with time in a queue (Mandelbaum & Shmikin, 2000;
Shimkin & Mandelbaum, 2002).
Second, even if psychic costs are indeed concave, here we consider a task where a
decision-maker faces recurrent queues where abandonment from one wait simply triggers the
start of a new wait. To rationalize abandonments in such cases we would thus have to assume
both that psychic waiting costs are both highly nonlinear and, more critically, that the costs are
assessed for each queue individually, not cumulatively over the total time spent waiting. That is,
decision makers consider waiting costs myopically, focusing only on avoiding the displeasure of
the immediate wait rather than minimizing the total length of time until service.
Why might a decision maker fail to consider cumulative time when deciding whether to
abandon a wait? A body of work that could help explain myopia in queues is that exploring how
negative affect and stress affect the efficiency of decision-making (e.g, Luce, Payne, & Bettman,
1999). A common finding is that escalating stress in a task acts to constricts the breadth of
processing of cues, limiting peoples’ ability to consider trade-offs in a balanced way (e.g.,
Keinan et al., 1987; Luce, Bettman, and Payne 2001; Zackay 1993). Hence, one might
hypothesize that as the unpleasantness of waiting builds, individuals may find it increasingly
hard to focus on anything but the sense of displeasure from the immediate wait, thus triggering
abandonment without consideration of how it will affect the overall time to a reward. Moreover,
because such emotional focusing is not easily controllable, it is a bias that may persist despite
repeated encounters with queues—much like the impatient commuter who fails to learn that

10
rapid switching of lanes does little to speed the journey to work (see, e.g., Gigeranzer, Hertwig,
and Pachur 2011),.
2. Completion Commitment. The above ideas lay the groundwork for explaining why
consumers may abandon queues they would be better off persisting in. But what about the case
where it is optimal to abandon waits, such as the case of broken traffic lights or off-line servers?
In such cases we hypothesize that a different bias—an accelerating desire to complete tasks that
are seen as nearing completion—may induce the opposite bias of a tendency to remain in queues
that one would be better-off leaving.
This possibility is suggested by prior research that shows that consumers often display an
increased commitment toward a completing a goal whose realization is close at hand—such as a
greater desire to take flights when one is near a reward tier in a frequent-flier program (e.g.,
Dreze and Nunes, 2006). To illustrate, Cheema and Bagchi (2011) find that when individuals
can visualize goal-completion, they exert more effort and report more goal- commitment than if
they are unable to visualize goal-completion. Consistent with this, goal-commitment has been
found to be is driven by perceived virtual progress to the goal (Soman & Shi, 2003) and by
perceived temporal proximity to the goal in the absence of obstacles (Soman, 2003).
A number of alternative mechanisms for explaining goal-commitment effects have been
proposed. Kivetz , Urminsky, & Zheng (2006), for example, argue that that the effect can be
explained by goal-gradient effects long observed in animal psychology, where effort to complete
a goal increases as a power function of the percentage proximity to the reward (e.g., Hull, 1932).
Likewise, the effect could also be explained in terms of hyperbolic discounting, or the tendency
for subjective assessments of distant rewards to be a non-linear function of the time to their
receipt (e.g., Loewenstein & Prelec, 1992). If consumers subjectively discount the present value

11
of future rewards in a non-linear manner, or are prone to goal-gradient effects, early on in a wait
the value of a distant reward would seem small relative to the much larger immediate pains of
waiting. In contrast, as a wait persists and the reward is felt to be near at hand, its value would
be seen as exponentially more attractive, a perception that could overwhelm otherwise more
rational instincts to leave.
A Behavioral Model of Abandonment
The above research suggests that decisions to abandon queues will often invoke two
opposing psychic forces: a desire to abandon waits whose duration has become unpleasant, and a
desire to see tasks through to their completion. To formally model how the presence of these
may affect abandonment decisions, consider a consumer who faces a choice from a set of
identical queues, each yielding a common reward R upon completion. As above, while the
length of the wait in each queue is uncertain; the consumer believes that it will be a random draw
from a finite distribution (e.g., a uniform) with maximum duration Tmax.
As the wait unfolds, we hypothesize that its ongoing attractiveness will be a function of
two competing dynamic elements:
1. Waiting utility, which captures the growing displeasure of waiting in a queue as time
evolves; and
2. Completion utility, which captures the competing desire to remain in the queue as the
likely time to reward diminishes.
Following Osuna (1984) and Denuit and Genest (2001), we model waiting utility as a
strictly decreasing function of the length of the experienced wait t (t = 0, …, Tmax). Because
prior work has suggested that subjective assessments of the disutility of waiting are often
conditioned by prior expectations of wait times (e.g., Taylor 1994), we hypothesize that waiting

12
disutility will be best captured by a decreasing function is centered around a reference or
expected wait w*, 0 ≤ w* ≤ Tmax; formally,
(1) WUt = vw(t - w*)
where vw( ) is a concave marginal-value function. In our empirical work we represent
Expression 1 as a quadratic response function centered on w*, however other consistent forms
could be considered, such as (inverted) Prospect-Theory value function that assigns greater
marginal disutility to waits that are longer than the reference wait (e.g., Kahneman & Tversky,
1979).
Completion utility, in contrast, would capture the intuitive tendency to be dissuaded from
abandoning a queue when the maximum possible wait is close at hand— akin to being next-in-
line at service queue. As noted above, this instinct might be seen to work in a fashion
comparable to goal-gradient effects that encourage higher rates of participation in frequent-buyer
programs when consumers approach reward thresholds (e.g., Dreze & Nunes 2006; Kivetz, Oleg,
& Zhang 2006), and/or to exponential discounting of delayed rewards (e.g., Laibson, 1997;
Loewenstein & Prelec, 1992). Following these ideas, we model completion utility as a strictly
increasing convex function of the temporal proximity of the maximum duration of the wait,
weighted by the value of the reward; that is,
(2) CUt = vc(Tmax - t) vR(R)
where vc( ) is a convex marginal value function that captures the desire of the decision-maker to
complete a wait, a desire that is amplified given increasing perceived value of the reward (the
marginal valuation vR(R)). In the empirical work described we again characterize Expression 3
by a quadratic function; however, other functional forms, such as power or exponential
discounting models, might be considered.

13
Taken together, we model the strict utility of the incumbent queue i at time t (Vit) as a
convex combination of completion and waiting utility; i.e.,
(3) Vit = WDt + CUt = k1vw(t - w*) + k2 vc(Tmax - t) vR(R)
where k1 and k2 are scaling constants that capture differential effects of the two influences on
overall assessments (see, e.g., Keeney & Raiffa, 1976) . We assume that decision-makers are
utility-maximizers who, at each point during a wait, elect to remain in the current queue as long
as its utility, Vit, remains greater than that of a new queue, V0 = k1v(-w*) + k2v(R | Tmax).
Implications
Equation 3 yields a straightforward prediction about how the likelihood of reneging will
evolve over the course of a wait. Because the waiting utility function vw ( ) is monotonically
decreasing in t with a maximum at t = 0, while completion utility vc( ) is monotonically
increasing in t with a maximum at Tmax, any convex combination of these elements will display
two maxima, one at each time-extreme. Hence, by implication, the minimum of this function---
corresponding to the maximum risk of reneging—will lie in the interior of (0, Tmax); that is, the
conditional probability of reneging will correspond to a an inverted-U shape hazard function
over time. Specifically,
H1: Reneging hazard rates will display an inverse U-shape, being highest in the region
of the mid-point of the maximum possible wait.
As noted above, such a reneging pattern will be non-normative in experimental tasks
where participants face uniformly-distributed wait times. In contrast, in the case of bi-modal
distributions where abandonment can be optimal, the normative status of the decisions yielded
by Expression 3 will depend on how closely the actual bail times correspond to those predicted
by a rational decision-maker who uses Bayes’ rule to make abandonment decisions. Equation 3

14
predicts that patient consumers who either possess long referent waits w* or hold a high marginal
utility for persistence (i.e., the case of Expression 3 where k1 < k2) would display the opposite
bias of staying too long in queues that should be abandoned.
We should also emphasize that the psychological process that drives the inverse U-
shaped hazard function here should not be confused with purely statistical mechanisms that
might produce similar inverse U-shaped abandonment functions in aggregate data, such as
through survivor censoring (see, e.g., Zohar, Mandelbaum, & Shimkin, 2002). To illustrate, a
similar data pattern could arise if we observed reneging over time for a finite heterogeneous
population of consumers who varied in the length of time they were willing to wait in a queue.
One of the empirical challenges we face in the next section is thus teasing apart the
psychological effects of waiting considered here from purely statistical effects that could yield
similar data patterns.
Boundaries and Moderators
As formulated, equation 3 offers a general descriptive representation of how queues are
evaluated over time. The exact outcome of stay-or-renege decisions will thus depend on its
parameterization, something that might systematically vary across task settings. To illustrate,
consider the effect of increasing the number of alternative queues that a consumer may renege to
in the course of a wait. Although such a manipulation would have no normative effect on
reneging behavior (since all queues have the same priors), work on option attachment (Carmon
et al., 2003) suggests that when individuals forgo multiple tenable options when making a choice
they are more prone to feelings of post-choice regret, owing to an increased tendency to focus on
the imagined benefits of foregone options. Applied to choices among multiple queues, such
second-guessing would manifest in a tendency for decision-makers to experience a greater

15
marginal disutility for elapsed time in a queue, something manifested in equation 3 by a larger
relative weight k1 being applied to the marginal waiting function vw(t - w*).
We thus hypothesize:
H2: The conditioning effect of increased alternative queues: Rates of abandonment
will be an increasing function of the number of alternative queues.
A tendency to increasingly regret the choice of a queue as time evolves could possibly be
mitigated if consumers were provided with ongoing feedback about the actual current duration
of the un-chosen queues. If consumers were to see that the wait would have been just as long had
they not chosen the current queue, expectations about the duration of alternative waits would be
adjusted upward, diminishing the appeal of a new wait. Hence, if the imagined benefits of
alternative acts to increase the relative weight applied to the marginal disutility of waiting (k1),
providing knowledge that these alternatives would have resulted in only slower waits should
have the opposite effect of increasing the relative weight applied to the marginal utility of
completion (k2). Hence, we would hypothesize:
H3: The de-biasing effect of comparative queue knowledge: Rates of abandonment
will be reduced given knowledge of slower rates of progress in alternative queues.
There are, of course, a range of other contextual factors that could exert similar positive
and negative effects on tendencies to renege from waits. For example, a commonly-encountered
contextual cue that would presumably act to increase rates of reneging would be external aids
that emphasize the amount of time that has elapsed in a wait, such as a clock posted by an
elevator. Following the old adage that a “watched-pot never boils”, one might conjecture that
such aids will enhance the rate of reneging by focusing attention on the ongoing (unpleasant)
experience of waiting, or, in terms of equation 3, the size of k1 relative to k2 (Zakay 1993).

16
Likewise, a widely-held element of wisdom in wait management is that the disutility of
waiting can be diminished if individuals are given activities to engage in while in a queue,
whether they are physical (e.g., walking) or mental (watching television or reading; Taylor,
1994). Such activities are widely hypothesized to both diminish perceptions of time waste and
draw cognitive resources away from monitoring elapsed time (Zakay, 1993). Hence, in terms of
equation 3, whereas cues that draw attention to time would increase k1 relative to k2, activities
that draw attention away would decrease k1 relative to k2.
H4: The moderating effect of time cues and distractions: Rates of abandonment from
queues will be inflated by clock aids that draw attention to elapsed time, but
deflated by external mechanical activities that draw attention away.
Empirical Analysis
We tested the above hypotheses using data from three empirical studies in which
participants played a time-management game that challenged them to complete as many page
downloads as possible from hypothetical web sites in a 150-second period. The task was
designed to mimic the many if the features of waiting for downloads from peer-to-peer server
sites (e.g., Kazaa), a task likely to be familiar to the subject population of University
undergraduates. In each study participants were compensated based on the number of
downloads they were able to successfully complete.
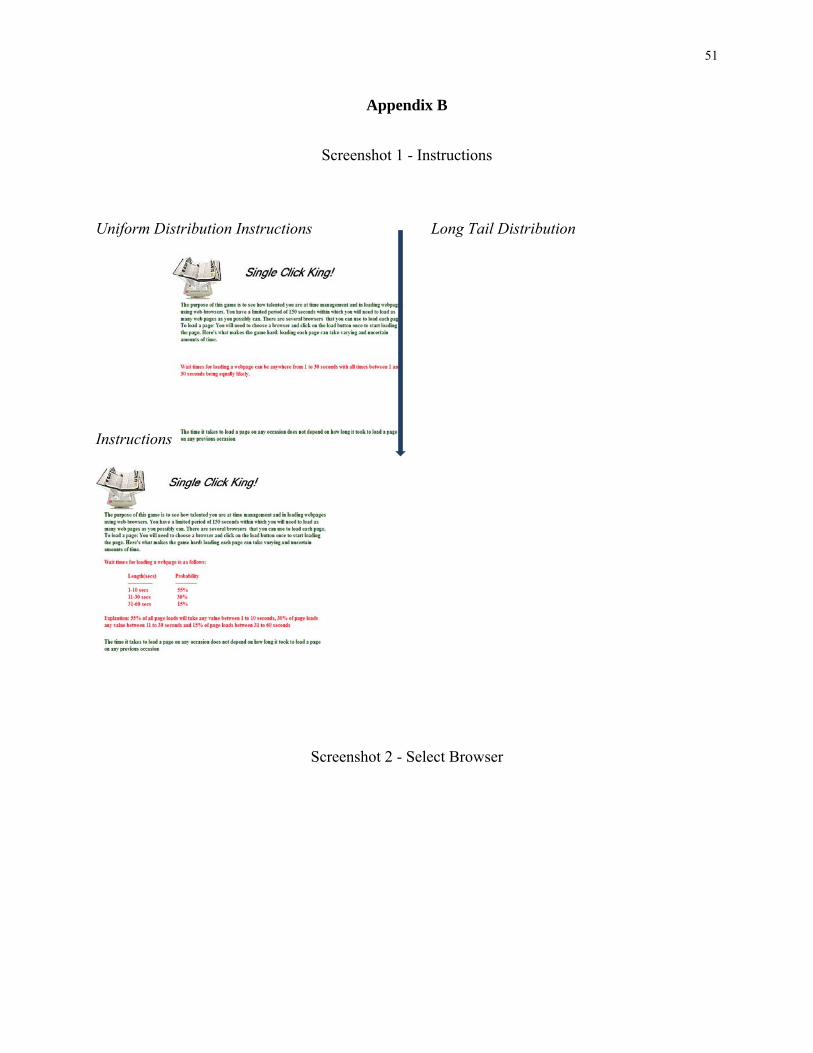
All studies followed a common basic procedure as illustrated in the sequence of screen
shots shown in Appendix B. After being instructed as to the goals of the task, participants were
informed about the distribution of possible waiting times for a download from each site

17
(Screenshot 1). Depending on the experimental condition to which the participant had been
assigned, participants were told that waiting times were a random draw either from a uniform
distribution in which downloads varied between 1 and 30 seconds, or a multi-modal distribution,
where downloads varied over three uniform intervals: between 1 and 10 seconds with a
probability of .55, 11-30 seconds with a probability of .3, and 31-60 seconds with a probability
of .15. These two distributions were chosen because they captured cases where reneging would
or would not be optimal for a participant wishing to maximize earnings in the task. Specifically,
as noted in the Appendix A, reneging would never have been optimal when participants faced a
uniform distribution, but would be when they faced the multi-modal distribution. In the latter
case a participant who continuously used Bayes’ rule to update the posterior probability that he
or she was facing the longest uniform wait interval would find it optimal to renege in an interval
between 6 and 18 seconds and not otherwise.
After reading these instructions participants chose a “browser” to load the webpage
(Screenshot 2). On selecting a browser, they would wait for the page to load or terminate the
wait by pressing the “Stop Load” button (Screenshot 3). Upon either the completion of a wait or
a termination participants were led back to start, with an update of the total number of pages that
had been successfully loaded.
Study One
Experimental Design and Procedure
The purpose of the first study was to test whether empirical abandonment rates would
display the hypothesized inverted U-shape function over time and display the predicted
departures from optimality: reneging too often when it is optimal to stay and reneging too
infrequently when it is optimal to leave. In addition, we also examined the effect of two

18
theorized moderators: the number of alternative queues (H2) and the salience of waiting time
(H4).
The study manipulated three factors: wait distribution (uniform or multimodal), the
number of alternative queues (2 or 12) and the salience of waiting (high or low). Salience of
waiting time was manipulated by varying whether the display included a clock showing the
amount of time that had elapsed since the start of each wait. Distribution type and number of
queues were manipulated within subjects, and time salience was manipulated between subjects2.
Participants were 98 undergraduate students who agreed to participate as part of their
regular course credit. Each participant within each salience condition completed two
randomized replicates of a 2 (distribution-type)-by-2 (number-of-alternative) factorial design,
yielding eight games overall for each participant. To motivate performance and to ensure active
participation, the best three performances, as measured by number of page loads, were rewarded
with $50 cash prizes. Participants completed the experiments at computer terminals in the
University’s behavioral research laboratory in about 20 minutes, inclusive of time spent reading
instructions.
Results
Recall abandonment was never optimal when participants were facing a uniform
distribution, but it was optimal for waits longer than 6 seconds (but less than 18) when they were
facing a multimodal distribution. An initial analysis of reneging rates strongly rejected these
normative predictions as descriptions of behavior. Contrary to the optimal waiting policy, 25%
of all uniform waits were abandoned, and so were 27% of waits longer than 18 seconds from the
multi-modal distribution. Likewise, 41% of waits that lasted between 6 and 18 seconds in the
multi-modal distribution were not abandoned when they should have. The effect of these

19
departures resulted, in turn, with participants realizing fewer page downloads they could have
following the optimal policy. Whereas the optimal policy would have realized 10 page
downloads within each 150-second time budget, the actual realization was 6.86 pages from the
uniform and 7.92 from the multi-modal.
To initially investigate the drivers of abandonment decisions, in Figure 2 we plot of the
hazard functions of reneging for each distribution using SAS procedure Proc Lifetest (Allison,
1995). Consistent with H1, the figures suggest that reneging rates display an inverted U-shape
for both distributions, reaching a peak about one-third of the way through a maximum wait.
Likewise, a log rank test of the survival functions supports a negative significant effect of
enhanced salience (H4) both for the uniform (PNo Clock = 17% vs. PClock = 32%; χ2 = 75.6;
==================
Insert Figure 2 about here
==================
p < .001) and multi-modal distributions (PNo Clock = 28% vs. PClock = 34%; χ2 = 22.38; p < .001).
The data only partially support, however, the hypothesized effect of number of queues (H2):
while mean renege rates for twelve alternative queues were higher than for two given a uniform
distribution (P12 queues = 27% vs. P2 queues = 22%; χ2 = 3.59; p < .05), no comparable effect was
observed given a multi-modal (P12 queues = 29% vs. P2 queues = 33%; χ2 = 1.12; p =.27).
To provide a more detailed analysis of the drivers of abandonment decisions over time,
ongoing decisions whether to stay or abandon waits were modeled as a log-linear function of six
factors: distribution, number of available queues salience of wait, linear and quadratic terms for
wait time, total time left in the game, and number of games completed. Following Zeger and
Liang (1986), parameters were estimated using PROC GENMOD in SAS using GEE estimation

20
to correct for multiple observations from each individual. Consistent with the predicted U-shape
functions displayed in Figure 2, the analysis supported significant linear ( = .26, Z = 3.43,
==================
Insert Table 1 about here
==================
p < .001) and quadratic ( = -.006, Z = -3.62, p < .001) effects of wait time. In addition, the
analysis supported a positive main effect of an increased number of alternative queues on
reneging (H2) (12 queues= .214, Z = 2.29, p = .02), but, unlike the above analysis of mean hazard
rates, failed to support a significant effect of wait salience (no clock = .248, Z =1.45, p =.15). The
analysis also suggested there was little evidence of learning; if anything, participating in more
rounds of play was actually associated with higher impatience ( = .053, Z = 2.04, p = .04).3
Calibration of the Behavioral Model
Above we hypothesized that the observed inverted U-shaped abandonment function could
be described as the consequence of two opposing psychological forces: a concave decreasing
utility for elapsed time in the queue (defined by the marginal disutility function vw(t - w*)) and a
convex increasing utility for maximum time remaining (defined by the function vc(Tmax - t) vR(R).
To develop an estimable form of Expression 3 we first assumed that time was discrete, and in
each period t the conditional probability that a participant would choose to remain in the current
queue i could be represented by the binary logit model gi(t) = 1 / (1 + exp(Vit)), where Vit is the
strict utility of the current wait as defined in Expression 3. The probability that we would
observe an abandonment (or switch) in the data at time t, P(A | t), would thus be gi(t), which
simplifies to the exponential hazard function
P(A | t) = 1 / exp(Vik) + ε.

21
where Vit is the strict utility of the current wait. We then represented Vik in terms of the
polynomial expansion
(4) Vit = k0 + k1(t - t*) + k2(t - t*)2 + k3(Tmax - t) + k4(Tmax - t)2
a form4 that could flexibly capture concavity in t - t* and convexity in Tmax - t.
Note that for a constant w* and Tmax Expression 4 reduces to a simple quadratic equation
in t, implying that the behavioral process model and a simple quadratic hazard model are
statistically equivalent in the current data.
==================
Insert Table 2 about here
==================
Nevertheless, we can still derive best-fitting values of the parameters of Expression 4 using
numerical methods, which will allow us to assess whether a process model with the hypothesized
curvature properties could provide a consistent, though admittedly not unique, explanation for
the data. In Table 2 we report non-linear least-squares estimates of the structural parameters k0 -
k4 in Expression 4 as well as jack-knifing estimates of their associated standard errors for the
uniform and long-tailed distributions. These parameters were derived using an iterative
application of the Solver non-linear estimation algorithm in Excel (Flystra, et al., 1998). To
provide a visual account of the performance of the model, in Figure 3 we plot observed versus
predicted reneging rates and
==================
Insert Figure 3 about here
==================

22
the implied shapes of the waiting and utility functions yielded by this estimation. To make the
interpretation of the functions consistent with Expression 4, the marginal value functions are
plotted in reverse scale, hence showing temporal changes in the utility of staying rather than
reneging from a queue.
The figure and table demonstrate two central findings. First, the process model provides
a good descriptive account of the data, suggesting that observed abandonment patterns could be
explained by a process that balances two marginal utility functions, one decreasing in waiting
time (waiting cost) and one increasing (completion utility). Second, the results provide mixed
support for the hypothesized curvature of these functions. While, as hypothesized, the waiting
function for both distributions is concave in elapsed time, the best-fitting completion function is
also concave, increasing at a decreasing rate in the maximum time remaining. This latter
finding, however, comes with a strong caveat: because of the non-uniqueness of the model, the
standard errors of the parameters are quite large; hence caution needs to be exercised before
making strong process inferences about the shape of the implied value functions. Stronger tests
require more direct measurement of how utility was changing over time during waits, which we
gather and report in Study Two.
Discussion
The results of the first study provide initial support for several of the basic research
hypotheses. As hypothesized, abandonment rates were found to display an inverted U-shape over
time, and abandonment behavior was far from optimal, with many participants abandoning
queues too quickly often when they should have stayed and staying too long in queues they
should have abandoned

23
Three natural concerns might be raised about the findings, however. First, if individuals
misconstrued the average wait of the distributions, it is possible that the decisions were optimal
given their beliefs. To investigate this, we recruited a separate group of 157 participants to
complete a new version of the task in which half were first asked to estimate the likely average
wait given the two distributions. After providing the estimates the participants went on to
complete the same waiting task as above. Averaging over conditions the means estimated for the
uniform distribution (Mtrue = 15 vs Mcalculated = 14.2, t = .82, p < .4) and for the multimodal (Mtrue
= 15 vs Mcalculated = 14.9, t = .21, p < .7) were not significantly different from the true mean of 15
seconds with most (92%) of the respondents getting the mean value correct of 15 seconds. Most
critically, subsequent renege behavior for the estimation group mirrored that reported above,
with the hazard function displaying the same predicted U-shaped functional form1.
A second possible explanation for data was that they were the outcome of a naïve
survival process in which each participant had a constant probability of abandoning a queue that
was formed prior to entering, and these probabilities were simply symmetrically (e.g., normally)
distributed over the population (see, e.g., Zohar, Mandelbaum, & Shimkin, 2002). Likewise,
even if survival heterogeneity was not the main driver of the findings, the results fall short of
providing direct process evidence of the hypothesized behavioral process of abandonment
decisions. We first address these limitations in Study Two by measuring abandonment behavior
in a task that controls for survivor bias by making the option to renege available only at fixed
time points during a wait, and gathering more direct measures of affect changes and beliefs about
expected durations in the course of a wait.
Study Two
Experimental Design and Procedure 1 A more detailed reporting of the follow-up study is available from the authors upon request.
24
Participants were forty undergraduates who completed the task for course credit. The
task mirrored that described in Study 1 for the case of two queues and a clock always being
available, but with a major difference: for half of all participants the button that allowed them to
terminate a wait was not continuously available during each download, but became available
only after 5, 10, 15 or 20 seconds of elapsed wait. Once the button appeared it remained
available for the remainder of the wait. This delayed ability to abandon a wait allowed us to
measure reneging rates at each of four elapsed time points while controlling for possible survival
biases.
In an effort to gather more direct process evidence of the reasons underlying decisions to
abandon waits, for half the trials on which the “stop” button was clicked a subset of 30
participants were asked to indicate their level of disappointment with the wait on a 0 (not at all
disappointed) to -5=very disappointed) sliding scale. In addition, participants were asked to
indicate which of 6 possible reasons best described the reason for the abandonment, including: “I
couldn’t take it any longer, “I crossed a waiting threshold set for myself”, “I will be luckier if I
try again”, “I was unsure how much longer it would be”, “other reason”, and “no particular
reason” .
The overall design was a mixed 2x2x4 factorial, with the availability of the terminate
button manipulated as a between-subjects factor, and wait distribution and timing of the
appearance of the terminate button manipulated as within-subjects factors. Both groups
completed 8 versions of the game, with the continuously-available group playing 4 replicates
within each distribution in lieu of the timing manipulation.
Results

25
A logistic regression using the GENMOD procedure revealed significant effects for the
linear ( = .43, Z = 6.8, p < .001) and quadratic terms ( = -.012, Z = 5.8, p < .001) of waiting
time, suggesting an inverse U-shape form (H1), similar to that of study one (Table 3). In
addition, asking subjects to respond to process measures did not change behavior as revealed by
a non-significant ( = .07, Z = 0.25, p = .80) effect of the process intervention, implying that the
data could be pooled for subsequent analyses.
==================
Insert Table 3 about here
==================
To examine whether reneging rates followed the predicted inverse U-shape relationship
with waiting time after experimentally controlling for survival bias, we computed the proportion
of participants who reneged within 2 seconds of the stop button becoming available among those
with a controlled stop load page. For example, if the stop button was available after 5 seconds of
wait, then renege frequency at 5 seconds was determined by looking at the number of
participants who reneged before the 7th second of wait. Similar frequencies of reneging were
calculated for other points in time, and are plotted in Figure 3. Abandonment rates display an
inverted U-shape (H1), consistent with that of study one, though the amplification is more muted
than in the first
==================
Insert Figure 4 about here
==================
study, suggesting that heterogeneity in levels of patience likely explain some of the temporal
variation in abandonment in Study 1. The figure also reports the p values of pair-wise z-tests of
26
differences of proportions of reneging between adjacent waiting times. For example, in the case
of the uniform distribution, after 5 seconds of elapsed wait the frequency of reneging was 40%,
while after 10 seconds this increased to 55%—a difference greater than would be expected under
standard thresholds of chance (Z (158) = 1.99, p = .02).
The gathered process measures provide some initial insights into the reasons underlying
abandonment decisions. Among those pressing the stop button after 15 seconds the top three
reasons cited for doing so were: couldn’t take it any longer (34%), crossed threshold set for
myself (33%) and lucky if I try again (20%). These responses thus give some support for two
structural aspects of the proposed theory: that participants approached waits with expectations
about their likely duration, and that waits of increasing duration induced heightening senses of
disutility.
Deeper insights into the dynamics of wait disutility are provided in Figure 5, which plots
the mean ratings of disappointment with waits that had reached varying durations for each
distribution.
=======================
Insert Figure 5 about here
=======================
The data suggest that satisfaction with the wait decreased monotonically over time for both
distributions (global r(disappointment, time) = .85; p < .01). We hypothesized that the shape of
the disutility function for waiting would be concave, with the marginal disutility of time being
higher for waits that exceed an expected or reference time (t*). Our ability to fully test this
hypothesis was limited by exit bias because we could only record disappointment when it was
sufficient to trigger reneging. If we fit separate regression slopes for the effect of time on

27
disappointment before and after the distribution mean of 15 seconds, however, we see modest
evidence of the hypothesized asymmetry (before = -.417 vs after = -.490, F(1221) = 2.26, p = .11,
for the uniform; before = -.281 vs after = -.465, F(1221) = 2.5, p = .10, for long tail).
Study Three
Experimental Design and Procedure
The objective of the final study was to explore the effect of two additional moderators on
reneging decision: the level of activity that the decision-maker is engaged in during a wait (H4)
and the availability of information about the waiting time in an un-chosen queue (H3). As in the
previous studies, participants faced one of two types of waiting-time distributions: uniform or
long-tailed, and, like in Study 2, the number of alternative queues was held constant at two, and a
clock was visible during all waits.
Activity during wait was varied at two levels: “active wait” and “passive wait.”
Participants in “active wait” were required to press a button every second to progress in the wait
while participants in the “passive wait” advanced through the wait automatically on starting a
wait, as in the prior studies. In both conditions the subject had the stop button available at all
times to leave the wait.
Knowledge about the length of the wait in the un-chosen queue was a mixed
between/with factor, with half of all subjects receiving no comparative knowledge, and the other
half receiving either positive or negative knowledge. In the positive comparative knowledge
condition participants were told that, had they chosen the other queue, their wait would have
ended after 25 seconds, whereas is the negative knowledge condition participants were told that
had the alternative wait would have lasted only 5 seconds. This comparative information was

28
displayed the moment that a queue was chosen, and remained visible during the course of each
wait.
Participants were 50 undergraduate students who agreed to participate in the study as part
of their regular course credit. The design was a 2(2) x2 partially nested factorial, with
participants each playing 4 games in a randomized order.
Results
In Table 4 we present the results of a logistic regression analysis of abandonment
decisions using PROC GENMOD. We again find consistent support for the inverse
=======================
Insert Table 4 about here
======================
U-shapes form (H1), with significant effects for the linear ( = .13, Z = 2.85, p < .01) and
quadratic terms ( = -.005, Z = 3.59, p < .01) of wait time. More critically, we also find support
for both the hypothesized effects of activity during a wait (H4) and knowledge about
comparative waits (H3). Specifically, as hypothesized, engaging in a simple activity during the
course of a wait (continuously clicking a progress button) significantly reduced propensities to
bail ( = -.47, Z = 3.93, p < .01). We also found support for the hypothesized effect of
knowledge about progress in alternative queues. The effect, however, was surprisingly
asymmetric; while knowing that the wait would have been a long one in the alternative queue
produced lower rates of abandonment than those observed among participants were not given
comparative knowledge ( = -.715, Z = 3.37, p < .01), there was no comparable tendency for
knowledge that the alternative was fast to enhance abandonments ( = -.139, Z = .63, p = .15).
While the reason for this asymmetric effect is unclear, one possibility is that it reflected a

29
tendency for some participants to interpret the comparative knowledge in a way allowed them to
rationalize staying in the current queue. Specifically, while for some participants the negative
comparative knowledge may have indeed induced a desire to bail, this could have been offset by
others who optimistically construed that a short wait on the un-chosen queue foretold a similarly
short wait in the current, or that the short wait was a one-time event unlikely to be repeated.
General Discussion
The goal of this paper was to contribute to an understanding of how individuals make
decisions to abandon waits from queues. The work centered on a hypothesis is that while
engaged in waits individuals experience an on-going trade-off between two psychic forces— one
that increasingly urges abandonment as waits evolve (waiting disutility), and one that
increasingly urges persistence when a plausible end comes within sight (completion
commitment). The relative dynamic weight given to these two forces is then presumed to
depend on context in ways consistent with some prior work on factors thought to affect
perceptions of the pleasantness of waiting, such as the initial number of queues (H2), knowledge
about comparative progress in these queues (H3), and the presence or absence of external aids
(such as clocks) that increase the salience of elapsed time in a queue (H4). Data drawn from
three experimental studies supported these hypotheses.
While our empirical findings were drawn from a time-management game set in the
context of web-page downloads, we suggest that the underlying theoretical principle—that
waiting involves an evolving trade-off between the disutility of waiting versus the utility of
completion- -is one that would apply to a wide range of waiting problems, even those with

30
competing outside activities. For example, this same trade-off likely arises when a caller is put
on hold from a 911-emergency line; longer waits induce escalating feelings of frustration that
motivate hanging up, but also, possibly, competing desires to stay on the line when one feels that
an answer by an operator is almost surely nearly at hand.
To illustrate this, we fit the empirical form of form of the proposed behavioral model
given in equations 4 and 5 to the India 108 call data plotted in Figure 1, censoring the early
observations that reflect immediate hang-ups. In estimating the model we assumed that the
maximum expected wait (Tmax) was 5 minutes, a number that represented the empirical
maximum in the data and also anecdotally mentioned by callers as the likely maximum duration
of a wait. The results of the model fit using Jackknife estimates of parameters are plotted in
Figure 6,
==================
Insert Figure 6 about here
==================
which suggests that in this case the distribution of the emergency calls is consistent with a
parametric version of the behavioral model that assumes that abandonment decisions are driven
almost entirely the frustration of waiting, with limited counteracting completion utility.
Perhaps the most surprising aspect of our findings was the evidence that participants
violated a normative principle of waiting that, on its surface, would seem obvious: one should
not abandon a wait to undertake a new one that will likely only be longer. Why did this happen?
One explanation is that some of the mistakes accrued to a tendency to over-generalize real-world
heuristics for abandonment that have a rational basis in some settings. For example, unlike here,
in some real-world tasks waits are negatively correlated in time; if one sees a long line at a bank,

31
one might assume it will be shorter later when the current group of customers has been served.
A mistaken belief that that waits in the task were not independent (akin to the gambler’s
fallacy) could restore a measure of bounded rationality to some of the premature abandonment
decisions observed here. A key finding of work by Gigeranzer and colleagues (e.g., Gigeranzer,
Hertwig, and Pachur 2011) is that such heuristics often have a deeply-rooted adaptive basis that
makes them robust to learning effects, something that could help explain their possible use and
persistence here.
In this light, an important challenge for future work will be to examine the degree to
which the biases uncovered here generalize to a broader range of waiting tasks, and to extend the
current formal theory to accommodate such settings. For example, one natural extension of the
model is to the case where decision makers hold ambiguous beliefs about the distribution of wait
times. One hypothesis is that in such cases consumers enter queues with multiple ordered
hypotheses about how long the wait might be—hypotheses that are successively formulated and
then rejected as a given wait exceeds each threshold. Under such a process consumers might
experience something of an emotional roller-coaster in the course of a wait: the wait would first
be seen as tolerable while it remains less than an initial expectation (t < t*), then it would
become acutely unpleasant when this threshold is exceeded (t > t*), only to become tolerable
again once a new expectation is formulated (t < t*). Such a finding would be consistent with the
work of Zohar, Mandelbaum, and Shimkin (2002), who found evidence that individuals become
adaptively more patient when they find themselves in unexpectedly long queues. While this
research pertains to waits, one could possibly extend findings to how one deals with time
management in general with individuals entering tasks with optimism, getting further

32
disillusioned with task duration and finally bailing from the task unless potential completion is
seen as salient and feasible.

33
REFERENCES
Allison, P. (1995), Survival analysis using the SAS system: A practical guide. Cary, NC: SAS
Institute.
Carmon, Z., & Kahneman, D. (1995). The experienced utility of queuing: Real-time affect and
retrospective evaluations of simulated queues. Unpublished manuscript, Duke University:
City, State.
Carmon, Z., Shanthikumar, J. G., & Carmon, T. F. (1995). A psychological perspective on
service segmentation: The significance of accounting for consumers’ perceptions of
waiting and service. Management Science, 41, 1806-1815.
Carmon, Z., Wertenbroch, K., & Zeelenberg, M. (2003). Option attachment: When deliberating
makes choosing feel like losing. Journal of Consumer Research, 30(1), 15-29.
Cheema, A., & Bagchi, R. (2011). Goal visualization and goal pursuit: Implications for
consumers and managers. Journal of Marketing, 75(2), (Forthcoming in March).
Denuit & Genest (2001). An extension of Osuna’s model for stress caused by waiting. Journal of
Mathematical Psychology, 45, 115-130.
Direct Marketing News. Retrieved September 16, 2006, from http://www.dmnews.com/sizing-
up-the-call-center-industry/article/92761

34
Dreze, X., & Nunes, J. (2006). The endowed progress effect: How artificial advancement
increases effort. Journal of Consumer Research, 32(4), 504-512.
Gigeranzer, Gerd, Ralph. Hertwig, and Thorsteb. Pachur (2011), Heuristics The Foundations of
Adaptive Behavior. New York, Oxford University Press.
Hassin, R., & Haviv, M. (2003). To queue or not to queue: Equilibrium behavior in queuing
systems. Norwell, Massachusetts: Klewer Academic Publishers.
Hull, C. L. (1932). The goal-gradient hypothesis and maze learning. Psychological Review,
39(1), 25-43.
Kahneman, D. & Tversky, A. (1979). Prospect theory: an analysis of decision under risk.
Econometrica, 47(March), 263-292.
Keeney, R., & Raiffa, H. (1976). Decisions with multiple objectives: Preferences and value
tradeoffs. New York: John Wiley.
Keinan, G. (1987). Decision-making under stress: Scanning alternatives under controllable and
uncontrollable threats. Journal of Personality and Social Psychology, 52(3), 639-644.

35
Kivetz, R., Urminsky, O., & Zheng, Y. (2006). The goal-gradient hypothesis resurrected:
Purchase acceleration, illusory goal progress, and customer retention. Journal of
Marketing Research, 43(1), 39-58.
Laibson, D. (1997). Golden eggs and hyperbolic discounting. Quarterly Journal of Economics,
112, 443-477.
Loewenstein, G., & Prelec, D. (1992). Anomalies in inter-temporal choice: Evidence and an
interpretation. Quarterly Journal of Economics, 10, 573-598.
Luce, M.F., Payne, J.W., & Bettman, J.R. (1999). Emotional trade-off difficulty and choice.
Journal of Marketing Research, 36, 143-159.
Maister, D. (1985). The psychology of waiting lines. Unpublished manuscript.
http://davidmaister.com/articles/5/52/
Mandelbaum, A., & Shimkin, N. (2000). A model for rational abandonment from invisible
queues. Queuing Systems: Theory and Applications, 36, 141-173.
Miller, E.G., Kahn, B., & Luce, M.F. (2008). Consumer wait management strategies for negative
service events: A coping approach. Journal of Consumer Research, 34(5), 635-648.

36
Osuna, E. E. (1985). The psychological cost of waiting. Journal of Mathematical Psychology,
29(1), 82-105.
Shimkin, N. & Mandelbaum, A. (2002). Rational abandonment from tele-queues: Nonlinear
waiting costs with heterogeneous preferences. Queueing Systems, 1-30.
Soman, D. (2003). Prospective and retrospective evaluations of experiences: How you evaluate
an experience depends on when you evaluate it. Journal of Behavioral Decision Making,
16(1), 35-52.
Soman, D., & Shi, M. (2003). Virtual progress: The effect of path characteristics on perceptions
of progress and choice behavior. Management Science, 49(September), 1229-1250.
Taylor, S. (1994). Waiting for service: The relationships between delays and valuations of
service. Journal of Marketing, 58(April), 56-69.
Zakay, D. (1993). The impact of time perception processes on decision making under time stress.
In O. Svenson & J. A. Maule (Eds.), Time pressure and stress in human judgment and
decision making (pp. 59-72). New York: Plenum.
Zeger, S. L., & Liang, K-Y (1986). Longitudinal data analysis for discrete and continuous
outcomes. Biometrics, 42(1), 121-130.

37
Zhou, R. & Soman, D. (2003). Looking back: Exploring the psychology of queuing and the
effect of the number of people behind you. Journal of Consumer Research, 29(4), 517-
530.
Zohar, E., Mandelbaum, A., & Shimkin, N. (2002). Adaptive behavior of impatient customers in
tele-queues: Theory and empirical support. Management Science, 48(4), 566-83.

38
ENDNOTES
1 We thank Emergency Management Research Institute of India for providing us with these data.
2 Exposing each individual to only one experimental condition produced similar findings and
hence are not reported.
3 Not reported is a full survival Cox regression model using Proc Phreg correcting for multiple
observations using the covsandwich procedure for each type of distribution. The overall model
was significant and so were the manipulated variables of number of available queues and
salience of waits. They do not add beyond the results of the logistic regression or the empirical
model.
4 We also estimated more restrictive logistic, log, and exponential forms for waiting and
completion utility, but none could be as reliably fit as a general (unrestricted) quadratic form.

39
TABLES
Table 1
STUDY1: PARAMETER ESTIMATES OF PROC GENMOD USING GEE ESTIMATION
(Model Bail=1)
Parameter Estimate Std Error Z P > |Z|
Intercept -1.983 0.291 -6.800 <.0001
Type of distribution (m-mode =0) -0.340 0.159 -2.140 0.033
Number of queues (12 queues=1) 0.214 0.094 2.290 0.022
Salience of wait (having clock=1) 0.248 0.171 1.450 0.146
Wait time – Linear 0.169 0.049 3.420 0.001
Wait time – Quadratic -0.006 0.002 -3.620 0.000
Time left 0.003 0.001 3.960 <.0001
Number of rounds completed 0.053 0.026 2.040 0.041

40
Table 2
STUDY1: PARAMETER ESTIMATES OF BEHAVIORAL MODEL PARAMETERS AND
JACKKNIFE STANDARD ERRORS
Uniform Distribution Long-Tailed Distribution
Estimate Std Error Estimate Std Error
t* (constraint) 0 - 0 -
Intercept 0.1623 0.0419 -4.3525 0.1241
weight cost (linear) -0.1792 0.3145 -1.5397 3.0404
weight cost (quadratic) 0.0617 0.0441 0.3215 0.3855
completion utility (linear) -0.1934 0.3148 -1.5651 1.7472
completion utility
(quadratic) 0.0513 0.0364 0.0739 0.0685
Tmax(constraint) 0 - 0
Absolute Deviation 0.051 0.085
Model R2 0.627 0.865

41
Table 3
STUDY2: PARAMETER ESTIMATES OF PROC GENMOD USING GEE ESTIMATION
(Model Bail=1)
Parameter Estimate Std Error Z P > |Z|
Intercept -4.66 0.446 -10.460 <.0001
Type of distribution (long tail=0) -0.281 0.244 -1.150 0.250
Wait time – Linear 0.433 0.064 6.790 <.0001
Wait time – Quadratic -0.012 0.002 -5.230 <.0001
Time left 0.005 0.001 3.320 0.001
Number of rounds completed 0.121 0.054 2.240 0.025
Controlling Impatience 0.073 0.291 0.250 0.803

42
Table 4
STUDY3: PARAMETER ESTIMATES OF PROC GENMOD USING GEE ESTIMATION
(Model Bail=1)
Parameter Estimate Std Error Z P > |Z|
Intercept -1.338 0.332 -4.03 < 0.01
Type of distribution (long tail=0) 0.514 0.132 3.89 < 0.01
Wait time – Linear 0.132 0.046 2.85 < 0.01
Wait time – Quadratic -0.005 0.002 -3.59 < 0.01
Time left 0.003 0.001 3.68 < 0.01
Number of rounds completed -0.031 0.024 -1.27 0.204
Activity during wait (Passive wait = 0) -0.477 0.121 -3.93 < 0.01
Negative Feedback - alternative queue
is 5 seconds (No feedback=0) -0.139 0.220 -0.63 0.148
Positive Feedback – alternative queue
is 25 seconds (No feedback = 0) -0.715 0.212 -3.37 < 0.01

43
FIGURES
Figure 1
RATES OF ABANDONMENT OF EMERGENCY CALLS MADE TO CALL CENTER IN HYDERABAD, INDIA, BY 6-SECOND INTERVALS, AUGUST 2009

44
Figure 2
STUDY 1: EMPIRICAL HAZARD FUNCTIONS OVER TIME BY DISTRIBUTION

45
Figure 3
STUDY 1: PERFORMANCE OF MODEL OF BEHAVIORAL ABANDONMENT
Uniform Distribution Long-Tailed Distribution
Notes: Top panels show predicted v. fitted abandonment rates, lower panel shows implied shape
of marginal value functions for waiting and completion utility based on parameters in Table 1
(inversely scaled to show utility). Each time interval above is 2 seconds.

46
Figure 4
STUDY 2: OBSERVED RATES OF RENEGING BY DISTRIBUTIONS AND FORCED
WAIT TIME
Uniform
Distribution
Long Tail
Distribution

47
Figure 5
STUDY 2: NEGATIVE AFFECT (DISAPPOINTMENT) BY LENGTH OF WAIT
Uniform
Distribution
Long Tail
Distribution

48
Figure 6
CALL CENTER DATA: FITTING MODEL OF BEHAVIORAL ABANDONMENT
Notes: Top panels show predicted v. fitted abandonment rates, lower panel shows implied shape of marginal value functions for waiting and completion utility. Each time interval above is 20 seconds.

49
APPENDIXES
Appendix A: Properties of the Optimal Waiting Policy for the Time-Budgeting Task
Consider a decision maker who faces a finite waiting-time distribution f(x) that has an
upper bound L, and is considering two reneging policies: one that never abandons a wait once it
has been initiated, and one that abandons any wait that exceeds a critical threshold duration t*,
t*<L. If 0<p<1 is the probability that the wait will be completed before the abandonment
threshold t* is reached, under this policy he or she can expect to endure, on average,
abandonments without a reward before finally encountering a wait that terminates before t*.
Hence, the average wait time to a reward under a policy that allows abandonment will be
(1/p)t*+E(w|<t*), where E(w|<t*) is the expected duration of a wait given that it is shorter than
t*. In contrast, of course, if he or she never abandons a wait (t*=L), the expected time to a
reward will simply be E(w), the mean of the wait distribution. An abandonment policy will thus
be optimal for the distribution f(x) if there exists a t*<L such that
(1) (1/p)t*+E(w|<t*)<E(w), or
(2) t*<p[E(w)-E(w|<t*)];
that is, if the cost of forfeiting some time invested in a queue (t*) to begin a new wait is less than
the probability-weighted expected gains of this forfeiture.
In our experimental work we initially focus on the case where waits are uniformly
distributed over (0,L). Since under a uniform distribution the probability one will realize a wait
that is shorter than a threshold t*, p(t<t*), is t*/ L , the inequality in (2) reduces to L <( L -t*)/2,
which clearly cannot be satisfied for any positive t*< L. Hence, if decision makers behave

50
optimally with the goal of maximizing the number of rewards in the task, we should never
observe reneging from uniform waits.
We also investigate abandonment behavior for the case of two-part uniform distributions
of the form f(x)=qU(0,L1)+(1-q)U(L1,L2), where L2 and L1 are the upper bounds of long and
short wait distributions, respectively, and q is the separating probability. To establish existence
of a rational reneging policy in this case, assume a decision maker reneges when he or she is
certain that operant distribution is that with the longer wait; i.e., t*=L2. In this case a policy that
never reneges yields an expected wait time of E(w)=[qL1+(1-q)(L1+L2)]/2, while that which
reneges when t*=L yields (1/p)t*+E(w|<t*)=L1/q+L1/2. The inequality (1) in this case is thus
[L1/q+L1/2 ]< [qL1+(1-q)(L1+L2)]/2 ,
which simplifies to
L2>2L1/q(1-q)
Which will be increasingly satisfied with increases in L2 and decreases in q; that is, the longer
the maximum wait in the fault distribution and the greater its likelihood, the greater the rational
incentive to abandon the wait as soon as the state is recognized and begin a new one.
In our empirical work we follow Mandelbaum and Shimpkin (2000) by assuming that
decision makers use Bayes’ rule to update beliefs about the probability that operant distribution
is that with the longer maximum wait. The optimal reneging time t* is then solved numerically.
51
Appendix B
Screenshot 1 - Instructions
Uniform Distribution Instructions Long Tail Distribution
Instructions
Screenshot 2 - Select Browser

52
Uniform Distribution Browsers Long Tail Distribution Browsers
Screenshot 3 – Continue Or Stop Loading Page