the pros of privately-housed cons - rio grande...
TRANSCRIPT
Rio Grande Foundation
P.O. Box 2015
Tijeras, NM 87059 505 286-2030
www.riograndefoundation.org
The Pros of Privately-Housed Cons:
New Evidence on the Cost Savings of Private Prisons
March 2003
By Matthew Mitchell
Research Economist
i
Foreword Harry Messenheimer, Ph.D. President, Rio Grande Foundation During the three years since its founding, the Rio Grande Foundation has been emphasizing the bad policies that have held New Mexico back compared to other states in the nation and region. Indeed, our constant harping on New Mexico’s high tax rates and their economic consequences may have contributed to a major shift in thinking about tax policy in the state. Now we have good news: There is a major personal income tax rate reduction in the offing. There is still more good news. New Mexico has been on the cutting edge of innovation in privatizing its prisons. In this study research economist Matthew D. Mitchell conducts an interstate econometric test of the relative efficiency of private-run versus government-run prisons. The econometric test
• demonstrates to state policy makers nationwide strong empirical evidence of potential savings from privatization and
• provides them with a good estimate of the magnitude of those savings. The econometric model consists of a cross-section comparison of 46 states’ corrections outlays per prisoner as a function of the portion of their prisoners that are housed privately. To account for differences among states the econometric model includes interstate differences in labor market conditions (does the state enjoy right to work?), pay for prison guards (using entry level pay for state police as an indicator) and the amount of crowding (utilization of bed space). The results suggest that privatization saved New Mexico roughly $51 million in 2001. This equates to $9,660 per prisoner. We really can do something right! States facing a budget crunch would do well to follow New Mexico’s lead. Privatization can release money for tax reductions or other needs. While not our primary aim, another result of the study deserves emphasis: The magnitude of estimated saving per prisoner in 2001 for states enjoying right to work legislation was $9,365 per prisoner. That means the average state could save roughly 28 percent of its corrections budget by legislating right to work. One wonders how much could be saved elsewhere by right to work. Are you listening, New Mexico?
ii
Contents Foreword .......................................................................................................................................... i Contents .......................................................................................................................................... ii I. Abstract........................................................................................................................................ 1 II. Background ................................................................................................................................ 2
Part A. Brief History of Privatization ......................................................................................... 2 Part B. Motivations to Privatize.................................................................................................. 3
III. New Approach: Interstate Comparison of How Privatization Affects Cost ............................. 6 Part A. Previous Studies ............................................................................................................. 6 Part B. What is the Appropriate Measure of Cost?..................................................................... 7 Part C. Why do Per-Prisoner Costs Vary From State to State? .................................................. 8 Part D. Model and Predictions .................................................................................................. 10 Part E. Findings......................................................................................................................... 13
IV. Conclusion .............................................................................................................................. 16 V. Appendix.................................................................................................................................. 17
Part A. Technical Note on the Model ....................................................................................... 17 Part B. Variations on the Model ............................................................................................... 17
VI. About the Author .................................................................................................................... 19 VII. Bibliography.......................................................................................................................... 20
1
I. Abstract
Three-fifths of all U.S. states contract with private corporations to house a portion of their
state prisoners. A host of studies have analyzed the cost of incarceration in many of these
prisons. This study takes a broader approach. It compares state per-prisoner department of
corrections budgets across 46 states. Accounting for a number of cost factors, significant per-
prisoner savings were found in states that house a portion of their prisoners privately. All other
factors being equal, states such as New Mexico with forty-five percent of their prisoners in
private custody spent about $9,660 less per-prisoner in 2001 than non-privatized states. Given
New Mexico’s prison population of 5,300 this is an annual savings of $51 million. Forty-five
percent privatization is expected to reduce the typical department of corrections budget by about
one-third.
The paper begins with a short history of the privatization movement and a discussion of the
motivation to privatize.
2
II. Background
Part A. Brief History of Privatization
In the late 1970s and early 1980s, public backlash against soft-on-crime policies delivered a
generation of tougher judges to the bench. Levitt noted in 1996 that “the incarceration rate in the
United States has more than tripled in the last two decades.”1 Federal and state criminal
statutes—particularly those dealing with drugs—were also strengthened and law enforcement
budgets redoubled. Between 1982 and 1999, the federal government increased its police
expenditure by 485 percent ($35 to $40 billion dollars a year go to the War on Drugs alone).2
Over the same period, states increased their police expenditures by 239 percent.3 Both trends
out-paced inflation and overall growth in government spending by a wide margin.
The inevitable result was an explosion in the prison population. Between 1980 and 1999, the
U.S. prison population grew fifteen times faster than the population at large.4 By 1986, “all but
seven states were operating their prisons in excess of 95 percent capacity.”5
The overcrowded prisons begat quality lapses. In 1983, “Only about one-fifth of all state and
federal prisons were accredited by the Commission on Accreditation for Corrections.”6 More
seriously, courts began to intervene, asserting that states’ old and crowded facilities violated the
Constitution.
1 See Levitt, p. 319. 2 See The Economist, p. 4 for War on Drugs figures. 3 See Gifford, p. 3. for increases in law enforcement budgets. 4 The U.S. population grew by 20 percent while the prison population grew by 303 percent. Sources: Historical National Population Estimates, 1900-1999, and Correctional Populations, 1980-2000. 5 See McDonald, p. 8. 6 Ibid, p. 8.
3
When in the early 1980s Tennessee’s entire correctional system was found unconstitutional,
the state considered contracting with a private firm. The firm, the Corrections Corporation of
America (CCA), had been incorporated in 1983 to contract with the Federal Immigration and
Naturalization Service to detain illegal immigrants pending hearings or deportation.7 Tennessee
refused CCA’s offer. But not long after, prison privatization began in earnest.
In 1985, Florida’s Bay County contracted with CCA to operate its jail. The next year, CCA
contracted with Santa Fe County, New Mexico to run its jail. By 1987, there were about 3,000
people held in private prisons nationwide. This represented little over one half of one percent of
the entire prison population.8 By 2001, the private prison population had soared to over 91,000
inmates. Despite such rapid growth, only about seven percent of all prisoners were in private
custody in 2001.9
Part B. Motivations to Privatize10
Capacity management and speed of delivery continue to drive privatization. According to
one survey, 21 percent of state agencies who privatized say they turned to private firms because
of their reputation for speedy delivery.11 This is because private firms can construct jails and
prisons in about half the time it takes government to do so.12 But in addition to capacity
management and speed of delivery, states also turn to private firms in order to improve quality
and lower cost.
There are a number of reasons to believe that private prisons offer a better, safer product.
One is accreditation. The American Correctional Association is an independent, non-profit
7 Ibid, p. 4. 8 Private prison population from McDonald, p. 7; total prison population from Correctional Populations, 1980-2000. 9 Private prison population from Harrison and Beck; total population from Correctional Populations, 1980-2000. 10 Much of this discussion follows Segal and Moore. 11 See Chi and Jasper, p. 8. 12 See Levinson and Chase, pp. 156-9.
4
professional corrections organization. They accredit public and private prisons. Forty-four
percent of all private prisons are currently accredited. Just ten percent of public prisons are
accredited.13 Court orders offer another perspective on quality. “In 2001, of the 50 state
correctional departments, 13 entire departments were under a court order to relieve
unsatisfactory conditions.”14 Not a single private prison has ever been placed under a court order
for unsatisfactory conditions.15 Finally, there is evidence from a number of independent studies.
Sixteen of eighteen studies surveyed by the Reason Public Policy Institute found private prisons
to perform as well or better than public prisons.16
In addition to capacity and quality, many states choose to privatize in order to save money.
State prisons are often encumbered by expensive court rulings and statutory regulations. Quality
lapses in New Mexico’s state prison system, for example, have led to a costly court order. After
a bloody 36 hour riot in Santa Fe’s state prison in 1980, a federal judge ordered that the state
could not house more than one prisoner per cell. As noted, private prisons have altogether
avoided such court trouble. In New Mexico, the private prisons with which the state contracts
are still permitted to house prisoners two to a cell.
State constitutions have also restricted prison finance. If states are at their legal bonding
capacity, they cannot borrow further to build new prisons. But, if they contract with private
prisons, they can get around the constraint. Private prisons are free to spend their contracted
money on debt service.
13 See Accredited Facilities and Programs. 14 See Segal and Moore, p. 13. 15 See 2001 Directory, p. 16. 16 See Segal and Moore, p. 12.
5
But beyond any legal or statutory constraint, there is a more fundamental reason private
prisons are cost effective. The power of economic competition virtually forces them to be so.17
And there is good empirical evidence that private prisons save money. Segal and Moore identify
twenty eight private prison cost studies. They report that “virtually all of them found private
prisons to provide significantly lower cost—on average between 5 and 15 percent.”18 These
studies suggest a new approach: How does prison privatization affect costs state-to-state?
Answering that question is the main task that follows.
17 See Benson for a sweeping discussion of private sector competition in criminal justice. The literature on competitive markets is extensive. See Landsburg for an accessible treatment. 18 See Segal and Moore, p. 6.
6
III. New Approach: Interstate Comparison of How Privatization Affects Cost
Part A. Previous Studies
Most work on prison privatization has been conducted at the micro level—usually comparing
specific prisons to one another.19 (Many of the studies were commissioned by states whose
privatization laws require cost analysis.) The studies, therefore, often look at prisons in one (or
occasionally a handful) of state(s). Arizona, for instance, commissioned a study that compared
one private prison to the state’s fifteen government run facilities.20 Likewise, Texas conducts a
biannual review of the average cost of private and public Texas prisons.21
Such focused studies may have little widespread applicability. They fail to isolate and
quantify an important source of cost savings: the effect of competition induced by privatization.
By focusing on the prisons themselves, rather than the broader public and private mix of
correctional services, these studies may miss the forest for the trees. Because competition and its
threat forces cost discipline, one would expect all prisons—private and public—in a competitive
market to be more efficient than prisons in an all-public, monopolistic market. Empirical
evidence, in fact, supports this expectation. In Florida, researchers found statewide prison costs
were reduced by privatization.22 Likewise, researchers in Arizona found that after privatization,
public prisons lowered their costs, narrowing the gap between public and private prison
spending.23
19 See Thomas (2001) for an extensive bibliography of correctional privatization research. 20 See Thomas (1997). 21 See Segal and Moore, p. 7 for a discussion of the Texas studies. 22 See Comparing Costs of Public and Private Prisons. 23 See Public-Private Prison Comparison.
7
Studies often contain the caveat that any public/private cost comparison is an “apples to
oranges” exercise. Because private and public prisons operate within such radically different
environments, critics say, one ought to be skeptical of the apparent cost savings of private
prisons. This has led many to conclude that the only sound comparison is one between prisons
similar in all respects except for ownership. This was the tack taken by studies conducted in
California, Washington and Tennessee, for example.24 But as Segal and Moore argue:
Achieving identical facilities, populations, and conditions is perhaps impossible. More important, creating identical situations puts the cart of cost comparison before the horse of motivations for privatization in the first place. If a government and private prison are identical in every detail that could affect cost, what is the point of privatizing, since many of the driving factors for privatization (quality, innovation, etc.) are necessarily lost?25
Many of the dangers of this kind of micro-analysis may be avoided by taking a “bird’s eye
view” of the issue. Rather than focusing on individual prisons, this study focuses on states. The
data are collected from 46 states (the most complete data set obtainable). This allows us to
isolate cost savings induced by privatization rather than the specific cost savings of a particular
prison. Because data are from a wide cross-section of states, the findings have much broader
implications.
Part B. What is the Appropriate Measure of Cost?
An important difference in the way publicly and privately-owned prisons finance capital
assets (e.g., building, land, equipment) makes cross-state cost comparisons difficult. Private
firms attempt to spread the cost of an asset throughout the asset’s useful life. Public managers
make no such attempt. Instead, the public accounting practice is to count the capital expenditure
only in the year it was made. Since the fee charged by a private firm incorporates capital
24 See Sechrest and Shichor; Department of Corrections Privatization Feasibility Study, Report 96-2; and Cost Comparison of Correctional Centers, respectively. 25 See Segal and Moore, p. 9.
8
financing, the ideal public measure of cost would also include some annualized portion of capital
investment. Such a measure is not available. We must therefore rely on a measure of spending
which excludes public capital expenses (which can vary wildly depending on whether it is a
building year), but not the capital expenses of privately-owned prisons.26 This may bias the data
to make private prisons appear more expensive than public prisons. Still, it is the best measure
possible.
Part C. Why do Per-Prisoner Costs Vary From State to State?
Our primary interest is in how privatization affects per-prisoner costs. But what factors affect
a state’s capital-exclusive per-prisoner department of corrections budget? Input costs such as
labor conditions vary wildly from state to state. So too does the extent to which a prison can
efficiently use its capacity. To isolate the impact of privatization, we must also account for these
other factors.
In selecting factors that might affect cost, it is important to mind Segal and Moore’s warning
that all too often researchers put the cart of cost comparison before the horse of privatization.
Assuming that privatization affects prison management policy, it is important not to “control” for
any prison policy differences that could be due to privatization. The study, therefore, does not
include factors over which prison managers (public or private) have influence. The reader will
find no mention of cost-affecting factors such as the type of food or laundry service the state’s
prisons establish or the salary paid prison employees. Instead, the factors represent a priori
conditions that each state’s corrections department must deal with.
Wages paid no doubt affect cross-state differences in prison spending (recall that our focus is
on non-capital spending, so labor is likely the single most important input). Though prison 26 Only 59 percent of privately managed prisons are also privately owned (and therefore privately financed). See McDonald, p. 35 for further discussion.
9
managers may have some discretion over what they choose to pay, they must compete with other
employers for comparably skilled employees. Managers are restrained, therefore, by the state’s
prevailing market wage.
Another important cost factor is organized labor. Where the power of organized labor is
strong, labor markets tend to be less competitive. An uncompetitive labor market, in turn, can
drive up a number of prison costs. A union of prison guards, for example, might be able to
obtain more liberal leave than would be determined absent the union monopoly. Unions may
also push up the cost of an employee benefit package. In addition to salary and benefits, unions
affect the size of a workforce. They may erect barriers to entry in order to restrict the supply
(and therefore raise the price) of labor. Or they may make it difficult for an employer to shrink
his workforce when market conditions change. This can lead to over-staffing (featherbedding).
Other expenses are also affected by union power. For example, organized labor may raise the
price of contracted services such as food, laundry or maintenance. The power of organized labor
and the labor conditions created by union-encouraged state laws vary from state to state.
Finally, prisons in different states face different constraints on their ability to use prison
space. If a prison can place more prisoners in a given space, it can save money on important
variable costs such as guards, surveillance equipment and even electricity.27 But prison
managers face different state laws and court rulings that govern the legally permissible crowding
level. Furthermore, states differ in their fiscal outlook and ability to match growth in prison
populations with new prisons. These differences lead to disparities in prison density.28
27 Of course, higher prison density can also save money on construction costs as well. Recall, however, that to the extent possible, this study excludes construction costs by focusing on non-capital expenditures. 28 Because crowded conditions tend to lead to more probationers and parolees, we can help control for differences in what departments of corrections spend on these punishments by controlling for differences in prison density.
10
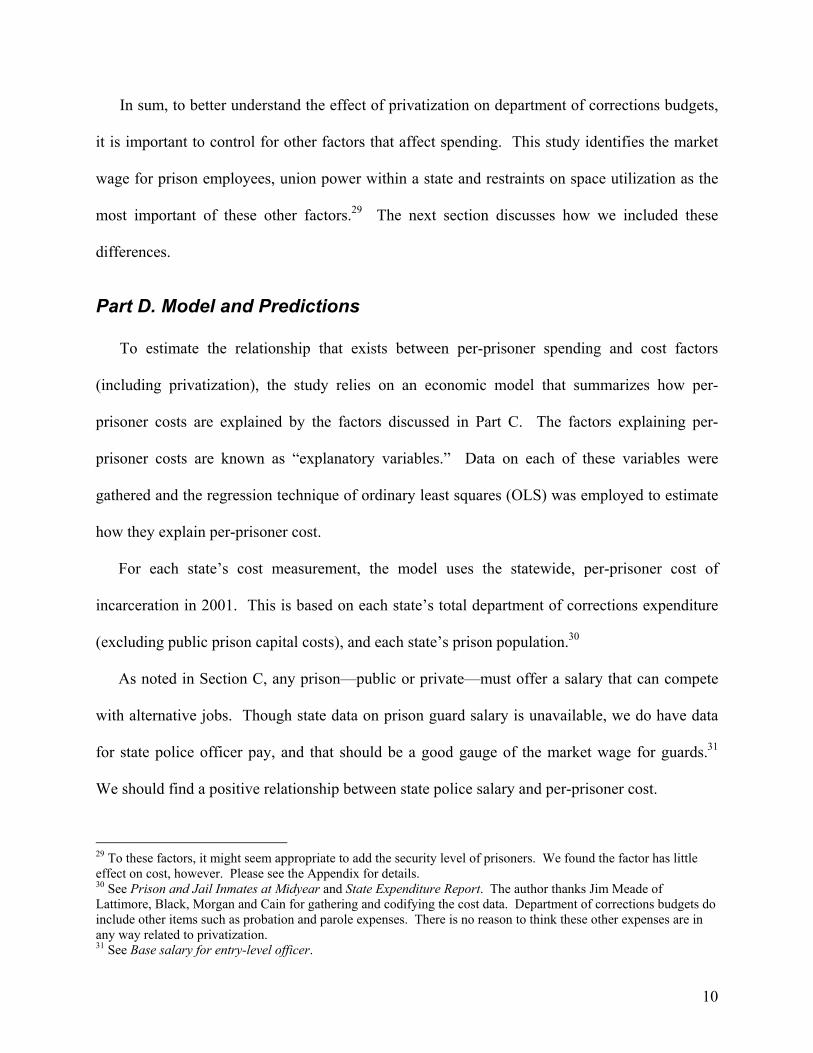
In sum, to better understand the effect of privatization on department of corrections budgets,
it is important to control for other factors that affect spending. This study identifies the market
wage for prison employees, union power within a state and restraints on space utilization as the
most important of these other factors.29 The next section discusses how we included these
differences.
Part D. Model and Predictions
To estimate the relationship that exists between per-prisoner spending and cost factors
(including privatization), the study relies on an economic model that summarizes how per-
prisoner costs are explained by the factors discussed in Part C. The factors explaining per-
prisoner costs are known as “explanatory variables.” Data on each of these variables were
gathered and the regression technique of ordinary least squares (OLS) was employed to estimate
how they explain per-prisoner cost.
For each state’s cost measurement, the model uses the statewide, per-prisoner cost of
incarceration in 2001. This is based on each state’s total department of corrections expenditure
(excluding public prison capital costs), and each state’s prison population.30
As noted in Section C, any prison—public or private—must offer a salary that can compete
with alternative jobs. Though state data on prison guard salary is unavailable, we do have data
for state police officer pay, and that should be a good gauge of the market wage for guards.31
We should find a positive relationship between state police salary and per-prisoner cost.
29 To these factors, it might seem appropriate to add the security level of prisoners. We found the factor has little effect on cost, however. Please see the Appendix for details. 30 See Prison and Jail Inmates at Midyear and State Expenditure Report. The author thanks Jim Meade of Lattimore, Black, Morgan and Cain for gathering and codifying the cost data. Department of corrections budgets do include other items such as probation and parole expenses. There is no reason to think these other expenses are in any way related to privatization. 31 See Base salary for entry-level officer.
11
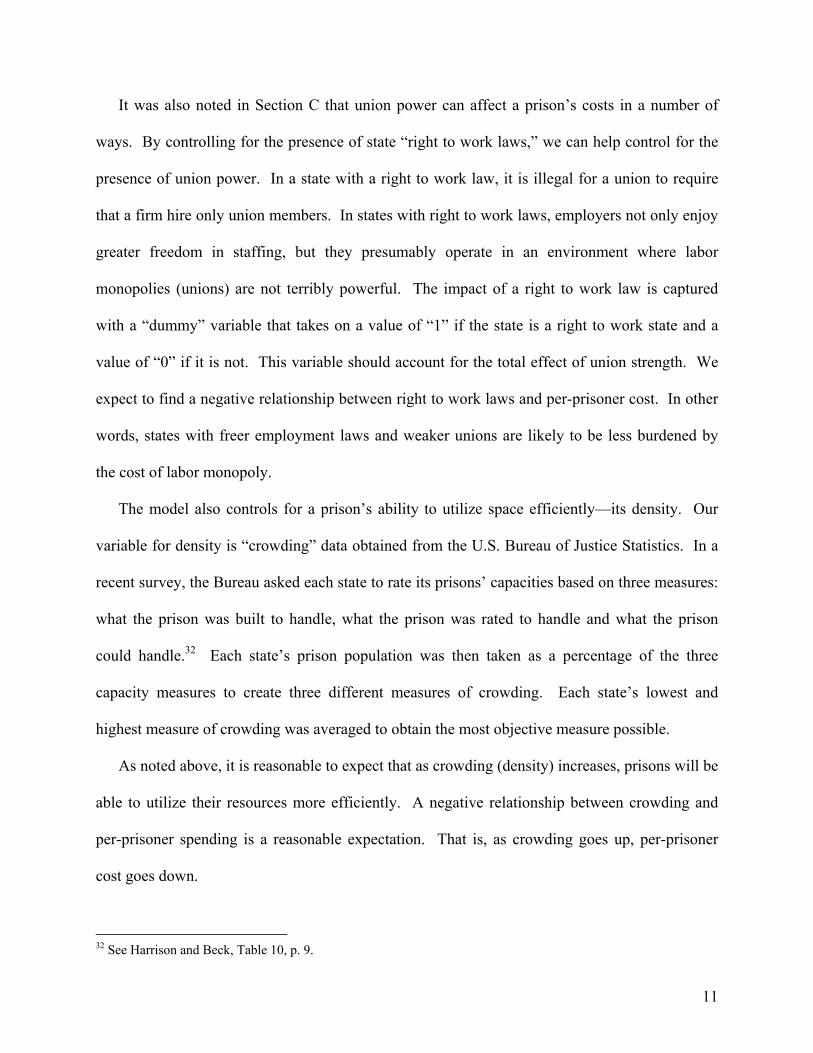
It was also noted in Section C that union power can affect a prison’s costs in a number of
ways. By controlling for the presence of state “right to work laws,” we can help control for the
presence of union power. In a state with a right to work law, it is illegal for a union to require
that a firm hire only union members. In states with right to work laws, employers not only enjoy
greater freedom in staffing, but they presumably operate in an environment where labor
monopolies (unions) are not terribly powerful. The impact of a right to work law is captured
with a “dummy” variable that takes on a value of “1” if the state is a right to work state and a
value of “0” if it is not. This variable should account for the total effect of union strength. We
expect to find a negative relationship between right to work laws and per-prisoner cost. In other
words, states with freer employment laws and weaker unions are likely to be less burdened by
the cost of labor monopoly.
The model also controls for a prison’s ability to utilize space efficiently—its density. Our
variable for density is “crowding” data obtained from the U.S. Bureau of Justice Statistics. In a
recent survey, the Bureau asked each state to rate its prisons’ capacities based on three measures:
what the prison was built to handle, what the prison was rated to handle and what the prison
could handle.32 Each state’s prison population was then taken as a percentage of the three
capacity measures to create three different measures of crowding. Each state’s lowest and
highest measure of crowding was averaged to obtain the most objective measure possible.
As noted above, it is reasonable to expect that as crowding (density) increases, prisons will be
able to utilize their resources more efficiently. A negative relationship between crowding and
per-prisoner spending is a reasonable expectation. That is, as crowding goes up, per-prisoner
cost goes down.
32 See Harrison and Beck, Table 10, p. 9.
12
Finally, for the variable of interest, percent of state prisoners in private custody, we expect a
negative relationship between cost and the extent of privatization.33 That is, as the percent of
prisoners privately housed increases, per-prisoner cost should decrease. Furthermore, it is
reasonable to expect the relationship to be non-linear. There are two reasons for these
expectations. Some savings are likely to be achieved simply because of better private sector
management. As the number of prisoners under such management increases, one would expect
per-prisoner costs to decline (though perhaps with diminishing marginal savings).
Another important source of cost saving from privatization is competition. The credible
threat of contract termination should induce both public and private prisons to carefully mind
costs. Here, diminishing marginal cost savings are likely. Once the threat of contract
termination has been well established, increased privatization seems unlikely to have the same
marginal impact as at lower levels of privatization. Such diminishing marginal cost savings can
be captured by taking the natural log of the percent of prisoners privately housed.34
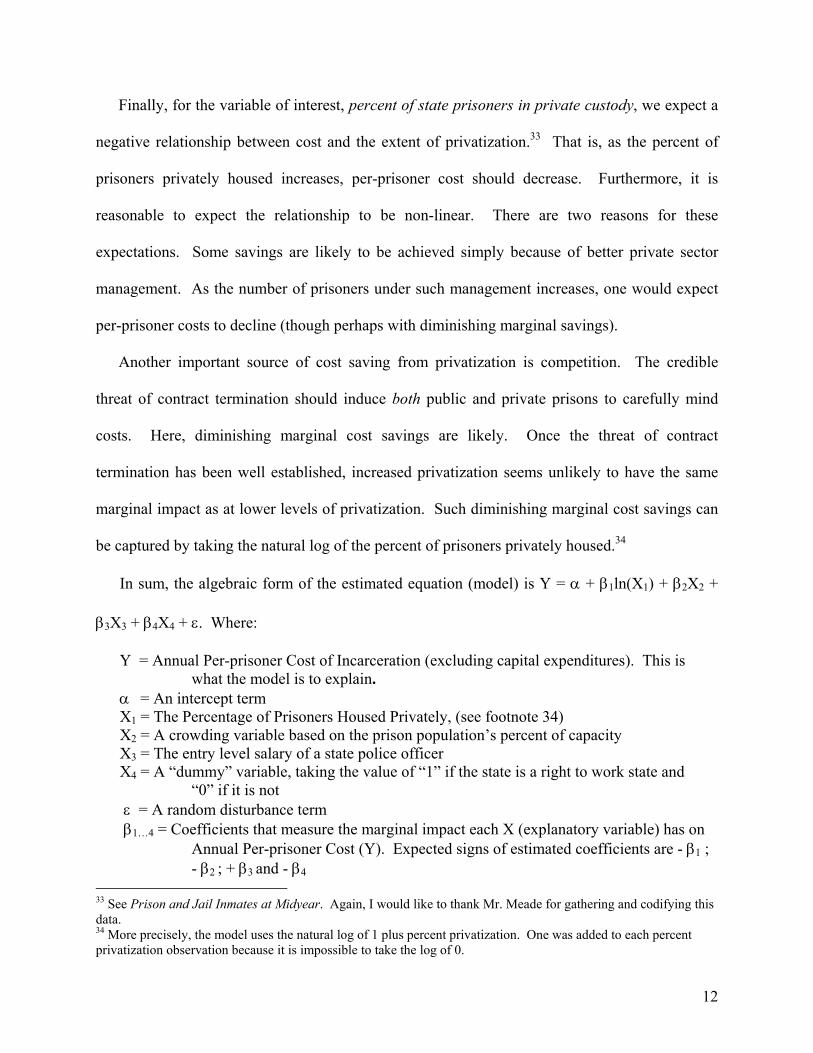
In sum, the algebraic form of the estimated equation (model) is Y = α + β1ln(X1) + β2X2 +
β3X3 + β4X4 + ε. Where:
Y = Annual Per-prisoner Cost of Incarceration (excluding capital expenditures). This is what the model is to explain.
α = An intercept term X1 = The Percentage of Prisoners Housed Privately, (see footnote 34) X2 = A crowding variable based on the prison population’s percent of capacity X3 = The entry level salary of a state police officer X4 = A “dummy” variable, taking the value of “1” if the state is a right to work state and
“0” if it is not ε = A random disturbance term β1…4 = Coefficients that measure the marginal impact each X (explanatory variable) has on
Annual Per-prisoner Cost (Y). Expected signs of estimated coefficients are - β1 ; - β2 ; + β3 and - β4
33 See Prison and Jail Inmates at Midyear. Again, I would like to thank Mr. Meade for gathering and codifying this data. 34 More precisely, the model uses the natural log of 1 plus percent privatization. One was added to each percent privatization observation because it is impossible to take the log of 0.

13
Part E. Findings
The model provides a good statistical fit for the interstate cost factors posited above,
explaining nearly 40 percent of variation in per-prisoner cost across states. This is quite
respectable for a cross-sectional study. But more important than the overall explanatory power
of the model is what it tells us about each explanatory variable. The estimated coefficients
associated with each of these variables are presented in Table 1.
Table 1 Annual per-prisoner department of corrections spending = α + β1ln(Transformed Percent Private) + β2(Crowding) + β3(State Police Pay) + β4(Right to Work) + ε
Explanatory Variable Estimated Coefficient (beta) Value ln(Transformed Percent Private)** -2,537.59 Crowding* -147.57 State Police Pay*** 0.92 Right to Work*** -9,364.66
General Information R-Squared 0.40 Mean Annual Per-prisoner
Spending $33,289
Adjusted R-Squared 0.34 Standard Deviation of Annual Per-prisoner Spending
$14,101
Notes: * = Statistically significant at 10% ** = Statistically significant at 5% *** = Statistically significant at 2.5%
All estimated coefficients except crowding were statistically significant at the 5 percent level
(crowding was significant at 10 percent). Furthermore, the estimated coefficients had the
predicted effect on cost. Importantly, the findings indicate that privatization reduced per-
prisoner cost by quite a lot.35
35 As noted in Table 1, the privatization estimate is statistically significant at the 5 percent level. This means that if the true population coefficient were zero, the chance of getting our estimated coefficient would be less than 5 percent in repeated sampling.
14
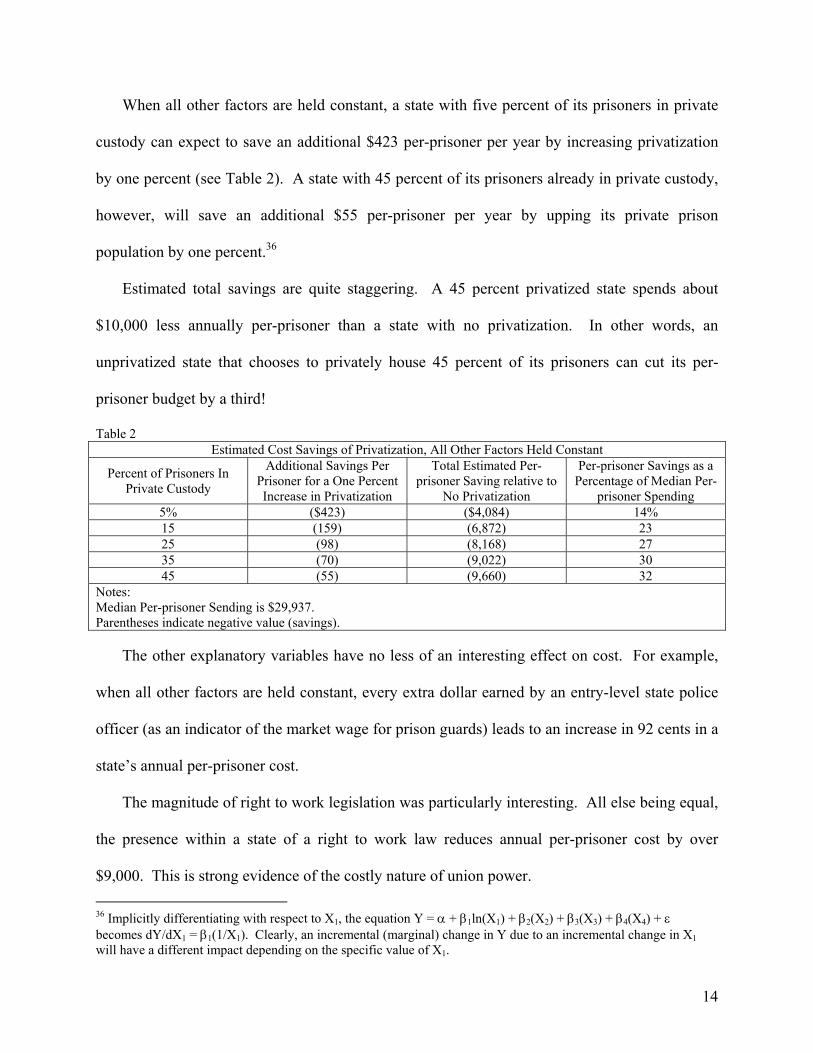
When all other factors are held constant, a state with five percent of its prisoners in private
custody can expect to save an additional $423 per-prisoner per year by increasing privatization
by one percent (see Table 2). A state with 45 percent of its prisoners already in private custody,
however, will save an additional $55 per-prisoner per year by upping its private prison
population by one percent.36
Estimated total savings are quite staggering. A 45 percent privatized state spends about
$10,000 less annually per-prisoner than a state with no privatization. In other words, an
unprivatized state that chooses to privately house 45 percent of its prisoners can cut its per-
prisoner budget by a third!
Table 2 Estimated Cost Savings of Privatization, All Other Factors Held Constant
Percent of Prisoners In Private Custody
Additional Savings Per Prisoner for a One Percent Increase in Privatization
Total Estimated Per-prisoner Saving relative to
No Privatization
Per-prisoner Savings as a Percentage of Median Per-
prisoner Spending 5% ($423) ($4,084) 14% 15 (159) (6,872) 23 25 (98) (8,168) 27 35 (70) (9,022) 30 45 (55) (9,660) 32
Notes: Median Per-prisoner Sending is $29,937. Parentheses indicate negative value (savings).
The other explanatory variables have no less of an interesting effect on cost. For example,
when all other factors are held constant, every extra dollar earned by an entry-level state police
officer (as an indicator of the market wage for prison guards) leads to an increase in 92 cents in a
state’s annual per-prisoner cost.
The magnitude of right to work legislation was particularly interesting. All else being equal,
the presence within a state of a right to work law reduces annual per-prisoner cost by over
$9,000. This is strong evidence of the costly nature of union power. 36 Implicitly differentiating with respect to X1, the equation Y = α + β1ln(X1) + β2(X2) + β3(X3) + β4(X4) + ε becomes dY/dX1 = β1(1/X1). Clearly, an incremental (marginal) change in Y due to an incremental change in X1 will have a different impact depending on the specific value of X1.
15
Finally, the study finds that crowding tends to reduce costs. All else being equal, every one
percent increase in a state’s ratio of prison population to capacity, lowers annual per-prisoner
cost by $147. Prisons reduce per-prisoner non-capital costs by increasing density.37
37 This finding must be weighed against quality, which may very well suffer when prisons are over-crowded. On the other hand, an attempt to reduce crowding by prematurely releasing prisoners to parole status may endanger public safety.
16
IV. Conclusion
Other factors being equal, those states with a strong commitment to privatization in prison
services spend significantly less per-prisoner per year than states without privatization. The data
indicate, for example, that annual per-prisoner spending in a five percent privatized state was
$4,084 less in 2001 than in a state with all-public prisons. A 45 percent privatized state,
meanwhile, was estimated to spend $9,660 less per year per-prisoner than a non privatized state.
This is an annual savings of nearly one-third of per-prisoner cost.

17
V. Appendix
Part A. Technical Note on the Model The estimates in Table 2 are based on the estimated β1 coefficient value of -2,537.59
reported in Table 1. “Marginal Cost Savings” can be interpreted at the partial slope coefficient
of cost (Y) with respect to percent privatization (X1). It is the dollar savings to be expected with
a marginal increase in percent privatization. Notice that the marginal value is lower at higher
levels of privatization. This is indicative of the diminishing marginal returns to privatization.
Any econometrician must be wary of the polysyllabic problems: multicollinearity and
heteroscedasticity.38 The first arises when dependent variables are collinearly related. This does
not appear to be a problem in this data, however.
Heteroscedasticity is also not likely to be a problem. Using the White test of
heteroscedasticity, we were not able to reject the hypothesis that there exists no relationship
between the explanatory variables, their squares, and the squared residuals. Park tests were also
run, assessing the relationship between the squared residuals and a) state population and b)
departments of correction population.39 Here, again, we cannot reject the hypothesis that the
squared residuals are unrelated to these variables. Homoscedasticity is a safe bet.
Part B. Variations on the Model
The model upon which this study is based is economically sound. No doubt, however,
additional variables might have been included (though given the limited number of observations,
38 See Gujarati, pp. 341-440 for a discussion of these problems. 39 See Table ST-2001EST-01-Time Series of State Population Estimates: April 1, 2000 to July 1, 2001 and Prison and Jail Inmates at Midyear.

18
parsimony is a virtue). Different approaches are also available. What follows is a short
discussion of some of these approaches.
This study is based entirely on 2001 data. Though time series data on all of the variables
proved too costly for us to gather, the subject might benefit from an industrious researcher
following a pooled-data approach.
The log model assumes a non-linear relationship between prison privatization and annual
per-prisoner cost. A linear approach yields comparable results, though the estimated coefficient
on privatization is less statistically significant (10% vs. 5%).
Among the other variables initially considered was type of prisoner. It was hypothesized that
the security level of prisoners might affect cost. Information was gathered on the percentage of
prisoners in each state classified as maximum security.40 The regression was then run with this
variable. Though the other coefficients were little affected and the overall explanatory power
was only slightly reduced (as measured by the adjusted R2), the security level variable did not
explain much of the variation in per-prisoner cost.
Crowding might not be linearly related to per-prisoner cost, as predicted by the model. Non-
linear approaches to crowding, however, do not appreciably change the results.
None of these alternative approaches improves the overall explanatory power of the model.
More importantly, none fundamentally alters the principle finding. In every model, privatization
is found to have a large impact on per prison spending.
The complete data set and findings are available upon request. The author may be reached at
[email protected]. Questions and comments are welcome.
40 See Number of Inmates in State and Federal Correctional Facilities, by Facility Security Level, Midyear 2000, Draft. These as-yet-unpublished figures were generously provided to the author by Bureau officials.
19
VI. About the Author
Matthew Mitchell is research economist at the Rio Grande Foundation. He has also written
for the Phoenix-based Goldwater Institute and Washington’s Heritage Foundation. His articles
have appeared in both Arizona and New Mexico newspapers and have received mention in the
Heritage Foundation publication, The Insider. Matthew graduated with honors from Arizona
State University in 2002. He holds a B.S. in economics and a B.A. in political science. Next
fall, he will enter a Ph.D. program in economics.
20
VII. Bibliography 2001 Directory. Washington, D.C.: American Correctional Association, 2001. Accredited Facilities and Programs. Washington, D.C.: American Correctional Association, 2001. Base salary for entry-level officer, Sergeant, and Chief, 1997. Washington, D.C.: U.S. Bureau of Justice Statistics,
http://149.101.22.40/dataonline/Search/Law/State/RunLawStateSelectedTables.cfm Benson, Bruce. To Serve and Protect: Privatization and Community in Criminal Justice. New York: New York
University Press, 1998. Chi, Keon and Cindy Jasper. Private Practices: A Review of Privatization in State Government. Lexington,
Kentucky: Council of State Governments, 1998. Comparing Costs of Public and Private Prisons. Office of Program Policy Analysis and Government Accountability. Tallahassee, Florida: March, 1997. Correctional Populations, 1980-2000. Washington, D.C.: U.S. Bureau of Justice Statistics,
http://www.ojp.usdoj.gov/bjs/glance/tables/corr2tab.htm Cost Comparison of Correctional Centers. Tennessee Legislature Fiscal Review Committee. Nashville, Tennessee: 1995. Department of Corrections Privatization Feasibility Study, Report 96-2. State of Washington Legislative Budget Committee. Olympia, Washington: 1996. Gifford, Sidra Lea. Justice Expenditure and Employment in the United States, 1999. Washington, D.C.: U.S. Bureau of Justice Statistics, February 2002. Gujarati, Damodar N. Basic Econometrics, 4th ed. New York: McGraw-Hill, 2003. Harrison, Paige M. and Allen J. Beck. Prisoners in 2001. Washington, D.C.: U.S. Bureau of Justice Statistics, July 2002. Historical National Population Estimates, 1900-1999. Washington, D.C.: U.S. Census Bureau, http://eire.census.gov/popest/archives/pre1980/popclockest.txt Landsburg, Steven. Price Theory and Applications. Minneapolis, Minnesota: St. Paul/West Publishing Company, 1995. Levinson, Robert B. and Raymon Chase. “Private Sector Involvement in Juvenile Justice,” Corrections Today, April, 2000. Levitt, Stephen. “The Effect of Prison Population Size On Crime Rates: Evidence from Prison Overcrowding Litigation.” The Quarterly Journal of Economics, Vol. 111, No. 2: May, 1996. pp. 319-351. McDonald, Douglas; Elizabeth Fournier; Malcolm Russell-Einhourn and Stephen Crawford. Private Prisons in the United States: An Assessment of Current Practice. Cambridge, Massachusetts: Abt. Associates, Inc., July, 1998. Number of Inmates in State and Federal Correctional Facilities, by Facility Security Level, Midyear 2000, Draft. Washington, D.C.: U.S. Bureau of Justice Statistics. Unpublished. Prison and Jail Inmates at Midyear. Washington D.C.: U.S. Bureau of Justice Statistics (data compiled by Jim Meade of Lattimore, Black, Morgan and Cain, PC of Tennessee). Public-Private Prison Comparison. Arizona Department of Corrections. Phoenix, Arizona: October, 2000. Schleifer, Andrei. “State versus Private Ownership,” in Symposium: The Firm and Its Boundaries, The Journal of Economic Perspectives, Vol. 12, No. 4: Autumn, 1998. pp. 133-150. Sechrest, Dale K. and David Shichor. Final Report: Exploratory Study of California’s Community Corrections Facilities. San Bernardino, California: California State University, 1994. Segal, Geoffrey and Adrian T. Moore. Weighing the Watchmen: Evaluating the Costs and Benefits of Outsourcing Correctional Services. Policy Study No. 289. Los Angeles, California: Reason Public Policy Institute, January 2002. State Expenditure Report. Washington, D.C.: National Association of State Budget Officers (data compiled by Jim Meade of Lattimore, Black, Morgan and Cain, PC of Tennessee). “Stumbling in the Dark.” The Economist. London: July 28, 2001. Table ST-2001EST-01-Time Series of State Population Estimates: April 1, 2000 to July 1, 2001. Washington, D.C.: U.S. Census Bureau. Thomas, Charles. Bibliography on Correctional Privatization. http://web.crim.ufl.edu/pcp/research/bib.html. May, 2001.

21
Thomas, Charles. Comparing the Cost and Performance of Public and Private Prisons in Arizona. Phoenix, Arizona: Arizona Joint Legislative Committee, August 1997.