the pro-poor factors, demographic factors, adoption and
TRANSCRIPT
THE PRO-POOR FACTORS, DEMOGRAPHIC FACTORS,
ADOPTION AND USAGE OF MOBILE FINANCIAL
SERVICES IN KENYA.
BY
ABDUBA IBRAHIM HALKANO
A DOCTORAL THESIS PRESENTED IN PARTIAL FULFILLMENT OF
THE REQUIREMENTS FOR THE AWARD OF THE DEGREE OF
DOCTOR OF PHILOSOPHY IN BUSINESS ADMINISTRATION,
SCHOOL OF BUSINESS, UNIVERSITY OF NAIROBI.
2017.

i
DECLARATION
This thesis is my own original work and has not been presented for an award of any
degree in any university.
Signature: ------------------------------------------- Date: ----------------------------
Abduba Ibrahim Halkano
D80/72703/2012
PhD Candidate.
This thesis has been submitted for examination with our approval as the university
supervisor.
Signature: ----------------------------------------- Date: --------------------------------
Dr. James Njihia
Supervisor
School of Business
University of Nairobi.
Signature: ----------------------------------------- Date: --------------------------------
Dr. Litondo Kate
Supervisor
School of Business
University of Nairobi.
ii
© COPYRIGHT
All rights reserved. No part of this thesis may be used or reproduced in any form by any
means, or stored in a database or retrieval system, without prior written permission of the
author except in the case of brief quotation embodied in reviews, articles and research
papers. Making copies of any part of this thesis for any purpose other than personal use is
a violation of the Kenyan and International copyright laws. For any information required
to contact the author.

iii
DEDICATION
This is dedicated to my dear wife Halima Saadia, Daughters Tume and Chule, Sons
Halkano and Kusu, little brother Guyo and the entire Dullos family.

iv
ACKNOWLEDGEMENTS
I acknowledge the multiple inputs, guidance, support and direction from Dr. Muranga
Njihia and Dr. Kate Litondo for their encouragement, great insights and motivation in
this journey. My colleagues in this journey have significantly contributed to this endeavor
who include Dr. Oredo, Dr. Borura, Dr. Muendo , Mr Kamau Mwangi and Mr Gabriel
Kamau.
Thank You All.
v
TABLE OF CONTENTS
Page
DECLARATION ......................................................................................................... i
© COPYRIGHT .......................................................................................................... ii
DEDICATION ........................................................................................................... iii
ACKNOWLEDGEMENTS ....................................................................................... iv
LIST OF TABLES ..................................................................................................... ix
LIST OF FIGURES .................................................................................................... x
ABBREVIATIONS AND ACRONYMS .................................................................. xi
ABSTRACT .............................................................................................................. xii
CHAPTER ONE: INTRODUCTION ..................................................................... 1
1.1 Background ................................................................................................... 1
1.1.1 Mobile Financial Services............................................................................. 3
1.1.2 The Pro-Poor Perspective ............................................................................ 5
1.1.3 Pro-Poor Factors and Mobile Financial Services.......................................... 6
1.1.4 Adoption and Mobile Financial Services ...................................................... 7
1.1.5 Demographic Factors and Mobile Financial Service .................................... 8
1.1.6 Usage and Mobile Financial Services ........................................................... 9
1.1.7 Poverty in Kenya......................................................................................... 10
1.1.8 Mobile Financial Services in Kenya ........................................................... 12
1.2 Research Problem ....................................................................................... 15
1.3 Research Objectives .................................................................................... 17
1.4 Value of the Study ...................................................................................... 18
1.5 Chapter Summary ....................................................................................... 19
CHAPTER TWO: LITERATURE REVIEW ...................................................... 20
2.1 Introduction ................................................................................................. 20
2.2 Theoretical Foundation ............................................................................... 20
2.2.1 Social Capital Theory ................................................................................. 20
2.2.2 Theories of Poverty ..................................................................................... 21
vi
2.2.3 Technology Adoption Theories .................................................................. 23
2.2.4 Technology Acceptance Model (TAM) ...................................................... 24
2.2.5 Unified Theory of Acceptance and Use of Technology ............................. 26
2.2.6 UTAUT Extension to Pro-Poor Perspective ............................................... 29
2.3 Empirical Review: Pro-Poor Perspective and Mobile Financial Services .. 32
2.3.1 Contextual Factors and Adoption of Mobile Financial Services ................ 33
2.3.2 Community Factors and Adoption of Mobile Financial Services .............. 35
2.3.3 Cultural Factors and Adoption of Mobile Financial Services .................... 37
2.3.4 Cultural, Community, Demographic Factors and Adoption of MFS.......... 37
2.3.5 Adoption and Usage of Mobile Financial Services .................................... 39
2.4 Research Gap .............................................................................................. 41
2.5 Conceptual Framework ............................................................................... 43
2.6 Hypothesis................................................................................................... 44
2.7 Chapter Summary ....................................................................................... 44
CHAPTER THREE: RESEARCH METHODOLOGY ..................................... 45
3.1 Introduction ................................................................................................. 45
3.2 Research Philosophy ................................................................................... 45
3.3 Research Design.......................................................................................... 46
3.4 Population and Sampling ............................................................................ 46
3.5 Data Collection ........................................................................................... 47
3.6 Pilot Study ................................................................................................... 48
3.7 Operationalization of Variables .................................................................. 49
3.8 Reliability and Validity ............................................................................... 50
3.9 Data Analysis .............................................................................................. 51
CHAPTER FOUR: DATA ANALYSIS AND FINDINGS.................................. 54
4.1 Introduction ................................................................................................. 54
4.2 Study Response Rate................................................................................... 54
4.3 Demographic Data ...................................................................................... 55
4.4 Contextual Factors ...................................................................................... 56
4.4.1 Factor Analysis of the Contextual factors ................................................... 58
4.5 Community Factors ..................................................................................... 61
vii
4.5.1 Factor Analysis of the Community Factors ................................................ 64
4.6 Cultural Factors ........................................................................................... 67
4.6.1 Factor Analysis of the Cultural Factors ...................................................... 69
4.7 Adoption of Mobile Financial Services ...................................................... 72
4.7.1 Factor Analysis on the Adoption Indicators ............................................... 74
4.8 Usage of Mobile Financial Services ........................................................... 77
4.8.1 Factor Analysis on the Usage indicators ..................................................... 80
4.9 Measurement Model Estimation ................................................................. 82
4.9.1 Construct Reliability ................................................................................... 85
4.9.2 Convergent Validity .................................................................................... 86
4.9.3 Discriminant Validity.................................................................................. 87
4.9.4 Collinearity ................................................................................................. 88
4.10 Measurement Model Overall Review ......................................................... 88
4.10.1 Factor Loadings .......................................................................................... 89
4.10.2 Path Coefficients ......................................................................................... 90
4.10.3 Summary of Path analysis ........................................................................... 94
4.10.4 The Modified Measurement Model ............................................................ 99
4.10.1 Chapter Summary ..................................................................................... 100
CHAPTER FIVE: DISCUSSION OF FINDINGS............................................. 101
5.1 Introduction ............................................................................................... 101
5.2 Contextual Factors, Adoption, and Usage ................................................ 102
5.3 Community Factors, Adoption, and Usage ............................................... 103
5.4 Cultural Factors, Adoption and Usage ...................................................... 105
5.5 The Demographic Factors on Adoption and Usage .................................. 106
5.6 Adoption and Usage .................................................................................. 108
5.7 Chapter Summary ..................................................................................... 110
CHAPTER SIX: CONCLUSIONS AND RECOMMENDATIONS ................ 111
6.1 Introduction ............................................................................................... 111
6.2 Summary of Findings ................................................................................ 111
6.3 Conclusions of the Study .......................................................................... 114
6.4 Implications of the Study .......................................................................... 117
viii
6.4.1 Theoretical Contributions ......................................................................... 117
6.4.2 Contributions of the Study to Knowledge ................................................ 118
6.5 Policy Recommendations.......................................................................... 119
6.6 Recommendations for Management Practice ........................................... 120
6.7 Limitations of the Study............................................................................ 121
6.8 Suggestions for Further Research ............................................................. 122
6.9 Chapter Summary ..................................................................................... 123
REFERENCES ...................................................................................................... 124
APPENDICES ....................................................................................................... 134
APPENDIX A: The SEM MODEL ........................................................................ 134
APPENDIX B: The Questionnaire ......................................................................... 135
APPENDIX C: The MPESA Tariff 2015 ............................................................... 144
APPENDIX D: The Research Output Data ............................................................ 145
ix
LIST OF TABLES
Table 2.1 Summary of Relevant Studies and Research Gaps ........................................... 41
Table 3.2 Operational Definitions and Measurement of Research Variables ................... 49
Table 3.3 Summary of Data Analysis and Procedures ..................................................... 53
Table 4.4 Contextual Factors Descriptive Statistics ......................................................... 56
Table 4.5 Contextual Factors Factor Analysis .................................................................. 59
Table 4.6 Community Factors Descriptive Statistics ........................................................ 61
Table 4.7 Community Factors Factor Analysis ................................................................ 65
Table 4.8 Cultural Factors Descriptive Statistics .............................................................. 67
Table 4.9 Cultural Factors Factor Analysis ...................................................................... 70
Table 4.10 Adoption Descriptive Statistics ...................................................................... 73
Table 4.11Adoption Factor Analysis ................................................................................ 75
Table 4.12 Usage Descriptive Statistics............................................................................ 78
Table 4.13 Usage Factor Analysis .................................................................................... 81
Table 4.14 Type of Constructs .......................................................................................... 84
Table 4.15 Reliability Analysis Data ................................................................................ 86
Table 4.16 Average Variance Extracted ........................................................................... 86
Table 4.17 Fornell-Larcker Criterion ................................................................................ 87
Table 4.18 Inner VIF Values ............................................................................................ 88
Table 4.19 Factor Loadings .............................................................................................. 90
Table 4.20 Path Coefficients ............................................................................................. 91
Table 4.21 Bootstrapping Results ..................................................................................... 92
Table 4.22 Summary of Path Coefficients ........................................................................ 93
Table 4.23 Summary of Hypothesis Testing Results ........................................................ 98
x
LIST OF FIGURES
Figure 2.1 Technology Acceptance Model- Davis (1989)................................................ 25
Figure 2.2UTAUT Model- Venkatesh, Morris, Davis, and Davis (2003). ....................... 27
Figure 2.3 Mobile Phone Technology Adoption Model- Van Biljon (2008) ................... 28
Figure 2.4 The Conceptual Model .................................................................................... 43
Figure 4.5 Adoption Scree Plot ......................................................................................... 60
Figure 4.6 Community Factors Scree Plot ........................................................................ 66
Figure 4.7 Cultural Factors Scree Plot .............................................................................. 71
Figure 4.8 Adoption Scree Plot ......................................................................................... 76
Figure 4.9 Usage Scree Plot .............................................................................................. 82
Figure 4.10 Average Variance Extracted .......................................................................... 87
Figure 4.11Measurement Model with Factor Loadings .................................................... 89
Figure 4.12 Measurement Model Showing Bootstrapping results.................................... 93
Figure 4.13 Measurement Model Showing the Paths ....................................................... 95
Figure 4.14 The Measurement Model(Boot Strapping) .................................................... 99
Figure 4. 15 The Modified Measurement Model(PLSAlgorithm).................................... 99
Figure 4.16 The Revised Final Conceptual Model with only Significant Relationships 100
xi
ABBREVIATIONS AND ACRONYMS
ICT Information Communication Technology
IS Information Systems
IT Information Technology
MFS Mobile Financial Services
PLS Partial Least Square Method
TAM Technology Adoption Model
TRA Theory of Reasoned Action
UN United Nations
UTAUT Unified Theory of Acceptance and Use of Technology
SEM Structural Equation Modelling
PLS Partial List Squares
xii
ABSTRACT
The unconventional growth and penetration of mobile financial services across the world
have led researchers to unearth the factors that influence or inhibit this growth. This study
focused on the effects of pro-poor factors, and demographic factors on adoption and
usage of mobile financial services among the poor in Kenya. The dominant paradigm has
been the conventional top-down approach where models such as, Technology Adoption
Model (TAM), and Unified Theory of Acceptance and Use of Technology (UTAUT).
These models are based on the evaluation of individual-specific factors which in itself
was insufficient to generalize for a particular context, culture or community. This study
adopted a bottom-up approach by looking at the communal, cultural and contextual pro-
poor factors to examine its effects on adoption and usage of mobile financial services
among the poor in Kenya. By seeking to explain the community, cultural and contextual
factors that are specific to the poor people the study aims to fill research gaps and
contribute knowledge in this area of mobile financial services. The study utilized
Theories of Poverty, the Social Capital Theory, and the Unified Theory of Acceptance
and Usage of Technology to provide sound theoretical background to this study. The
quantitative approach was adopted based on a cross-sectional study of the poor in Kenya.
Data collection was done through the use of a semi-structured questionnaire that was
administered to people living in the slums of Nairobi. Structural equation modeling was
utilized for data analysis using the partial least square analysis and hypothesis was tested
using data collected. The study results showed that the structural model showed a good fit
possessing good reliability, convergent and discriminant validity were also found to be
good. The results revealed that there exist relationships between contextual factors,
community factors, cultural factors, and adoption. The relationship between the
contextual factors, community factors, and usage were found to be significant.
Surprisingly the relationship between cultural factors and usage as well as adoption and
usage were found to be insignificant which is explained by the pressing need to adopt and
use mobile financial services. The demographic factors of age and gender did not
moderate the relationships between community factors and adoption as well as the
cultural factors and adoption. The study brings forth a fresh approach to adoption studies
in information system beyond the traditional theories such as TAM and UTAUT, it uses
bottom-up pro-poor perspective and proposes a new model suitable for a segment of the
society (the poor) largely ignored by existing theories. The findings contribute to the
existing body of knowledge by making contributions in enhancing the literature on
understanding the local context, effects of pro-poor factors on adoption and usage of
mobile financial services. It also fills the methodological gap by using a quantitative
study and suggest directions for future research while offering implications for academia
and policy makers. The results of the research provide information to the regulatory
agencies and government and the mobile telecommunication operators.
1
CHAPTER ONE: INTRODUCTION
1.1 Background
Half of the world‟s population lives below the poverty line of $2.50 a day while 80% of
humanity lives on less than $10 a day (Asli & Klapper, 2012). The increasing population
of the poor and widespread poverty is a global concern as poor people are deprived of the
means to participate in gainful activities due to lack of access to financial services. The
global concern also has a significant effect in Africa as well as in the Kenyan context.
Hughes and Lonie (2007) claim that the structural weakness in the formal financial
industry limits the access to Mobile Financial Services (MFS) especially to the poor. It
has been stated that most commercial banks are not serving the poor due to high costs of
establishing financial networks, lack of disposable income to save by the poor and their
inability to take up credit due to lack of collateral (Potnis, 2014) which has led to
financial exclusion.
The introduction of mobile financial services in Kenya has led to the provision of
financial services to all who can access a mobile phone both poor and rich. Wamuyu
(2014) observed that the usage of the mobile telephone in Kenya has greatly increased
due to the development of its capacity to offer additional advanced value added services
such as money transfers, internet access and managing bank accounts. Significant growth
in transaction volumes is being witnessed in Kenya as people no longer need to
physically visit the banks to perform financial transactions because they use mobile
financial services. There is growing evidence that mobile financial services are being
widely adopted and its usage in day to day business activities is rapidly increasing in
2
Kenya (Kirui, Okello, Njiraini & Nyikal, 2013).
There are many studies such as Yang (2004), Chung and Kwon (2009), Riquelme and
Rios (2010) and Yu (2012) that have been undertaken to understand the adoption of
mobile financial services. The various theories used in these studies are the unified theory
of acceptance and use of technology (Venkatesh et al., 2003). The dominant paradigm
has been the top-down approach which is explained as mainly investigates the individual
factors influencing adoption and usage of mobile financial services on a product made at
the top and pushed down to the mass market.
The top down approach basically follows the product into the market to investigate its
adoption and usage by individuals rather than by a specific group of community or
culture in a particular context. Potnis (2014) states that bottom-up approach does not
borrow or impose any predefined theoretical constructs to examine the phenomenon. This
study focused on bottom-up approach that seeks to investigate various factors in the
specific context, their effects on adoption and usage of mobile financial services rather
than just pushing products into the market and assessing its adoption and usage as it is the
case in top-down approach. The bottom-up approach after investigating the adoption and
usage of mobile financial services by a group of people such as the poor, it will provide
information about a group of people rather than the individuals thus providing insight on
factors that influence adoption and usage of mobile financial services by a group of
people such as the poor. This will resolve the issues with prior studies by bringing in the
pro-poor perspective that focuses on a broader bottom up approach.
3
1.1.1 Mobile Financial Services
Mobile financial services include a broad range of financial activities that users engage in
or access using a mobile device. Gencer (2011) described mobile financial services as the
ability to access and utilize electronic financial services using a mobile device. Mobile
financial services can be divided into three distinct categories of mobile banking, mobile
payments and mobile money (Boyd & Jacob, 2007). Mobile banking is defined as a
channel used by customers through a mobile device such as mobile phone to have
interactions with a bank (Barnes and Corbitt, 2003). It is an innovation which has been
perpetuated by widespread of mobile communication technology, it is financial services
delivered through mobile networks and performed on a mobile phone (Bangens and
Soderberg, 2008).
Kreyer, Pousttchi and Turowski (2003) define mobile payment as the processing of a
payment transaction using a mobile communication technique through a mobile device
such as mobile phone from initiation, authorization to payment realization. Wamuyu
(2014) defines mobile money services including mobile money transfer as using a mobile
phone to exchange monetary value from one mobile money transfer registered subscriber
to another.
The coming of mobile operators in the African market has led to the rapid deployment of
telecommunication infrastructure throughout the countries. The mobile operators and
their distribution channels were reaching the remote parts of the countries. This meant
that more and more places where it was not profitable to open a retail bank branch, now
have access to mobile phone and the operators' distribution networks; thus, making it
4
possible to extend financial services to large segments of the unbanked poor people. This
has led to financial inclusion, bringing on board poor people who had no access to
commercial bank accounts.
Extant research has shown that mobile communication technology has a potential of
leapfrogging the traditional infrastructure of financial institutions such as a bank, it has a
great potential to provide financial services to the poor unbanked people through familiar
and widespread technology (Isiah, Omwansa, Waema, 2012). The concept of mobile
financial services has been introduced to simplify and delocalize financial services such
that users can perform financial transactions without the need to visit a formal financial
institution. The pioneer mobile financial services were basic, easy and simple, it allowed
the use of mobile phones as a bank account and a debit card for essential services of
sending and receiving money. This leads to expanding of financial services to all those
who could not be able to access formal financial services. The mobile financial services
have become a necessity as it was addressing a fundamental societal problem, it was also
the only alternative solution thus its adoption and usage was a matter of societal need
rather than pushing of a particular product to the market.
The strategies employed by the innovators of these mobile financial services also tapped
into the existing entrepreneurial spirit of the Kenyan population as commission-based
agency network was put in place, where the amounts earned by the agents are based on
the number of transactions conducted through the agent. (Kirui, Okello, Njiraini &
Nyikal, 2013) observed the growth in the uptake of mobile financial services. Lower-
income earners registered to be an agent in a rural town or village as the early movers
5
were sure of cashing in on the first mover advantage. The journey from being a product
by the innovators to being a business opportunity by agents and to being a much needed
financial service by the rural communities gave mobile financial services the impetus to
diffuse into the Kenyan market both the rural and urban areas.
1.1.2 The Pro-Poor Perspective
The term pro-poor has been used by development partners since early 1990s, it was
initially introduced as pro-poor growth, which is defined by UN (2000) as growth that
benefits the poor thus pro-poor man's, “for the poor or towards the poor”. The pro-poor
concept has been around issues of the poor, influencing donor funding, government
policies and UN goals towards addressing the needs of the poor with the view of
improving their livelihood and economic well-being. Pro-poor perspective was coined in
a mobile banking study by Potnis (2014) borrowing from the theories of unified theory of
acceptance and usage of technology. Potnis operationalized UTAUT variables and
refocuses them on to a more bottom up perspective by gearing it towards the effects on
the poor coming up with pro-poor factors of context, culture, and community.
The adoption and usage of mobile financial services are dependent on the poor, the
circumstance they are in and their ability to comfortably use mobile devices. Potnis
(2014) states that a pro-poor perspective is a bottom-up approach which does not impose
or borrow any external predefined theoretical constructs. The pro-poor perspective
adopted in the study to investigate its effect on adoption and usage as they are not
influenced by mobile operators, government agencies or other stakeholders rather by pro-
poor factors such as contextual, community and cultural factors are discussed briefly
below.
6
1.1.3 Pro-Poor Factors and Mobile Financial Services
The first pro-poor factor is the contextual factors that concern study environment of the
poor. The contextual factors greatly contribute to the provision of access which in this
study is access factors that affect the provision of mobile financial services access in this
study. The concept of access has gained so much importance that the UN has set a goal of
50% access worldwide by 2015. For example, some commentators (Economist, 2005)
suggest that the digital divide exists between those without mobile network and those
with access. Access is a preliminary prerequisite for adoption, a mobile phone is an
essential tool in providing access among the poor who can only adopt mobile financial
services if they have access.
James and Versteeg (2007) defined access as a percentage of people who are within the
range of a mobile network who potentially could use mobile phones. Access challenges
are significantly prevalent in poor areas where mobile network coverage has not reached
due to lack facilitating conditions such as lack of electricity supply, limited investment in
last mile connectivity, unavailability of mobile network coverage (Potnis, 2014).
Regulatory and government policies also play a key role in the provision of access
(Bhavnani et al., 2008). The ability of the poor to overcome access challenges is crucial
for adoption, which is impossible without access given the facilitating conditions and
regulatory policies.
The second is cultural factors. Culture is a complex and multifaceted construct, it is
defined as the collective programming of the mind which uniquely identify one group
and differentiate it from another (Hofstede, 1980). Hofstede (1980) found there are
7
regional or national cultural groupings that affect the behavior of societies and the
difference is persistent across time.
Potnis (2014) asserts cultural differences and cultural practices leads to multiple
interpretations, usage, and appropriations of ICT. It has been pointed out by Bertolotti
(1984) that culture greatly affects the acceptance of technology through its belief and
values leading to social influence where members who share the same culture can
influence other members within that culture.
The final pro-poor factor is the community factors. The community is described as a
group of people with similar needs and values that foster believe that joining together
they are better able to satisfy their goals, needs, and priorities. (McMillan & Chavis,
1986). Community characteristics influence adoption of ICT (World Bank, 2012), which
presents community challenges that affect adoption of mobile financial services.
Community factors are represented by perceived ease of use, the level of literacy, and the
perceived financial cost (Potnis, 2014). These factors provides a fresh attempt to bring in
the social and demographic factors into the theories of information systems.
1.1.4 Adoption and Mobile Financial Services
Adoption as a concept has been significant in information system research. Rodgers
(1995) defined adoption as the decision to use innovation fully and regard it as the only
available course of action. It is also defined as a process of user accepting and utilizing
technology, making it part of their daily life (Renaud & Biljon, 2008). There is an
agreement with Rogers on technology acceptance as the only way to perform an action.
8
Adoption is dependent on the ability of the poor to use a mobile phone to access mobile
financial services which are dependent on their levels of literacy and their ability to
sustain the cost of using financial services. The perception of the poor that mobile
financial services are expensive or complex could lower the levels of adoption and usage.
Adoption is also dependent on the social-cultural influence of the poor, if there exist a
positive social influence and favorable cultural practices, adoption could be higher as
opposed to negative social-cultural influence on adoption.
Karahanna (1999) states that acceptance of technology innovation, according to their
psychological and demographic characters of the adopter group is adoption, a technology
that has not been accepted by the intended users, will not result in any sought after
benefits. The adoption of the mobile financial services has been relatively easy due to the
existence of the need to utilize this service to solve an existing problem in the Kenyan
community. There are numerous studies that have made the argument that MFS are
adapted because they fit into an existing need and interest of the poor people (Donner,
2005; 2006; Horst & Miller, 2006).
1.1.5 Demographic Factors and Mobile Financial Service
Venkatesh et al (2003) identified age and gender as part of UTUAT is significantly
moderating usage and acceptance of technology. The factors such as age and gender
commonly known as the demographic factors are known to influence technology
adoption. Rogers (2003) found that early adopters are young, have high social status,
better educated and have high incomes. Demographic factors could play a key role in
moderating the relationships between community factors and adoption as well as the
9
relationship between cultural factors and adoption thus it is important to understand the
influence of age and gender on these relationships. The demographic factors of age and
gender has been seen to moderate the relationships in prior studies, it is crucial to test the
moderating effects of age and gender in determining the effects of pro-poor factors on
adoption and usage of mobile financial services among the poor in Kenya.
1.1.6 Usage and Mobile Financial Services
Bhattacherjee (2001) defined the continued usage of technology as the long-term usage
of an innovation. He stated that the eventual success of new innovation is more
dependent on the continued usage than the initial adoption as infrequent or ineffective
usage after the initial adoption could lead to undesirable cost or investment in IT
(Bhattacherjee, 2001). To the service provider's usage leads to retaining of existing
subscribers which impact the profitability of the firm (Parthasarathy & Bhattacherjee,
1998).
The usage of mobile financial services provides an opportunity for inclusion and
enjoyment of financial services benefits by poor, examples usage benefits are access to
financial services, ability to save and ability to move money securely from one person to
another Wamuyu (2014). All these lead to increase in their participation in economic
activities, thus improving their livelihood and reduction in poverty. Adoption serves as
the prerequisite for usage of mobile financial services, the ability of the poor to overcome
the adoption challenges will significantly influence how they use mobile financial
services.
10
1.1.7 Poverty in Kenya
Poverty has been an important goal for development effort since the 1900s by the
development partners such as the World Bank and the United Nations. The percentage of
poverty in Kenya is 45.9 percent (World Bank, 2014). Poverty is categorized into
absolute poverty and relative poverty; the Copenhagen Declaration defined absolute
poverty as the condition of severe lack of basic needs.
Todaro (2000) defined relative poverty as the minimum social, political, cultural and
economic goods needed to maintain an acceptable way of life in a particular society.
Poverty is economically referred to as a circumstance of lack of wealth, material goods,
and resources, socially described as a state of social exclusion, dependency, and inability
to live a normal life in a society (Adongo, 2006). The poor are those who lack the ability
to accumulate assets and create wealth thus the lack of money is an indication of poverty
and not the cause.
Kristjanson et al (2010) stated that since Kenyan independence the development efforts
have focused on poverty reduction through basic service provision, the creation of
employment and economic growth, but poverty has remained strong with more than half
of the population remaining mired in poverty. The World Bank statistics (2014) put the
poor at 45.9% of the Kenyan Population. The poor are not a homogeneous group
consisting of indigenous people, herders, farmers, fishermen, pastoralist, and artisan, but
their common element is a lack of access to relevant information and knowledge services
which lead to poverty (Bhavnani, Chiu, Janakiram & Silarszky, 2008).
11
Poverty can be reduced by financial inclusion, which plays an important role in enabling
the poor to borrow, save, smooth consumption and insure against vulnerabilities (Asli &
Klapper, 2012). As stated by Adongo (2006) poverty alleviation is a strategy used to
increase the ability of the poor to accumulate assets, which can be achieved by educating
the masses and increasing financial services. Asli and Klapper (2012) observed that a
large fraction of the poor population lack access to basic financial services. This restricts
the ability of the poor to engage in economic activities aimed at curbing poverty (Dupas
& Robinson, 2009).
The mobile phone‟s capacity to include semi-illiterate mass who are not connected to
traditional networks such as landline phone or computer has a major impact on the poor
people in the developing countries (Townsend, 2000). The poorest people in developing
countries are predicted to be more likely than rich to use mobile financial services as they
have less option to access formal financial services (Ivantuary & Mas, 2008).
Mobile financial services products are not pro-poor for example Safaricom charges a
higher percentage for Mpesa withdrawals for smaller amounts at 10% for 100 shillings
compared to 0.47% for 70,000 shillings (Safaricom, 2015). Similarly, higher interests are
charged on loans of smaller amount compared to higher amounts by the lenders despite
the majority of the poor being excluded due to inability to provide collateral for loans.
Mobile financial services have an opportunity for resolving the problem of financial
exclusion and poverty reduction as adoption and usage of MFS can lead to higher
profitability for the providers, when the cost of using MFS is reduced poorer will be able
to use the services.
12
1.1.8 Mobile Financial Services in Kenya
In Kenya, mobile financial services are offered by many telecommunication companies
and banks, for example, MPESA service by Safaricom, Airtel money service by Airtel,
Equitel by Equity and Orange money service by Orange. Most of the Banks in Kenya
have introduced mobile financial services and now offer services such as mobile banking
services, mobile payment services like a credit card, debit card, and prepaid cards. The
mobile financial services are categorized into mobile money transfer services and mobile
banking services.
Mobile Money services were the pioneer service introduced into the Kenyan market, it
was basic, simple and included only the essential services of sending and receiving
money. One could deposit money into their mobile money account and send the money to
another mobile account; by use of the agent it was also possible to withdraw cash from
the mobile account.
The agent‟s network and other micro businesses are spread throughout the country with
huge clusters in the market areas and near shopping centers. This enables the common
people to easily access the mobile money agents for registration and perform various
transactions from their mobile phone. The mobile payment providers‟ agents are well
distributed and easily accessible to the micro business owners for support Otiso et al,
(2013).The mobile money transfer services also allow people to pay for goods and
services using the electronic monetary value by sending money owed to another across
this facilitating the payment for goods and services.
13
Mobile money was first introduced by Safaricom in 2004 in partnership with Commercial
Bank of Africa and Faulu Kenya a microfinance company in Kenya. The service, dubbed
M-PESA is a micro-payment platform that uses the mobile phone and is facilitated
through the airtime retail agents. At first, it was developed for microloans issuance at
reduced interest rates as a result of the reduction of overhead cost of managing the
microloans. It‟s quick adoption by skilled workers to send money to their relatives who
live in rural areas lead to the launching of M-Pesa services in 2007 (Hughes & Lonie,
2007). This was followed by Celtel‟s Zap (now Airtel) service in February 2009 and
Orange money in November 2010.
Safaricom introduced a mobile financial service application called M-PESA where M
stands for Mobile and PESA is a Swahili word for Money. It is a mobile phone
application that provides the service for sending, receiving and storing money, this
application is developed and being offered by Safaricom, which is the largest Mobile
Telecommunication Operator in Kenya. Morawczynski (2008) observed that by use of
M-PESA application the customers can register for M-PESA by visiting agents for
opening the account, depositing and withdrawing cash. The transaction is done by a way
of short text message that always acknowledges receipt and transfer of money whenever
there is a deposit, transfer of money to another mobile phone number or agent number or
receipt of cash for bills paid for goods and services.
Taking the world by surprise, the mobile financial services innovation continuously
sustains unprecedented growth and is now expanding to the rest Africa, it has taken
strong roots in many other countries around the world and most of the mobile
14
telecommunication companies are now banking on mobile financial services and mobile
related value-added services to increase their revenues.
Omwansa (2009), argues that the benefits associated with mobile money are so enormous
that those who try to place regulatory pressure on it might feel guilty if they appear to
frustrate it. “The extent to which the mobile payment usage would impact on
performance depends largely on whether there is an enabling environment” (Porteous,
2006).
Mobile banking provides opportunity for the banks to extend its services to new
customers (Lee, Lee, and Kim, 2007), the banks have invested in mobile applications
which enables the user to access their banks, make all the banking transactions such as
deposit, withdrawals and transfer through the use of the mobile banking applications.
Customers can use the mobile banking features to conduct their banking transactions
leading to branchless banking where one can get access to most of the banking services
from their mobile phones through the use of mobile banking applications. Significant
growth in transaction volumes is being witnessed as a result of the introduction of mobile
banking (Kirui, Okello, Njiraini & Nyikal, 2013).
Mobile financial services have grown from the initial money transfer services to now a
mature financial service. The Kenya Commercial Bank example, the general population
is now able to open a bank account by dialing *522# on their phone which will
interactively guide the user on how to open a bank account, make deposits and
withdrawals and even immediately take loans. Introductions of mobile financial services
have changed the lives of the people living in Kenya, especially among the poor who
have only mobile financial services as their way to financial inclusion.
15
1.2 Research Problem
Mobile commerce emergence is as a result of the opportunity offered by the convergence
of telecommunication and banking services (Lee, Lee & Kim, 2007). Applications that
aim to alleviate poverty are being developed in the developing countries due to the rapid
spread of the mobile phones (Morawczynski & Miscione, 2008). This has led to the
introduction of mobile financial services which are fast spreading across the world.
Omwansa (2009) states that besides innovation products, the local bank and mobile
telephony sectors greatly contributed to successful adoption and diffusion of mobile
financial services. Litondo (2013) observed that mobile phone is the most preferred
technology innovation by the informal sectors through there is limited quantitative
information on the factors that enables operators in the informal sector to adopt and use
mobile financial services.
Kenya is leading the world and proving to be the successful model for mobile financial
services adoption and usage. GSMA (2012) found that 90 percent of Kenya‟s population
is covered by mobile networks. Current statistics show that as at December 2014 the
number of mobile phone subscribers has grown to 33.6 million of which 26 million have
subscribed to mobile money transfer services, making mobile penetration in Kenya at
82.6 percent (Communication Authority, 2015). World Bank (2014) estimates that about
45.9% of the population live below the poverty line. Kenya has for many years had the
problem of financial exclusion. The lack of access to financial services restricts the
ability of the poor to engage in economic activities aimed at curbing poverty (Dupas &
Robinson, 2009). According to FSD (2015), 96% of all transactions in Kenya are done in
cash, of which only 2.2% are done through mobile financial services meaning that there
16
is a huge opportunity for mobile financial services to grow with the Kenyan cash
economy.
Extant literature is rich with top-down theoretical perspective studies. Puschel, Mazzon &
Hernandez (2010), in their study of mobile banking found that the intention to use mobile
banking was significantly impacted by subjective norm, attitude and perceived behavioral
control. Similarly, Yu (2012) in the study of factors affecting mobile banking found that
individual intention to adopt was influenced by perceived financial cost, performance
expectancy, social influence and perceived credibility while behavior is affected by
intention and facilitating conditions.
Most of these studies based on the dominant paradigm such as Technology Adoption
Model (Davis, 1989) and Unified Theory of Acceptance and Use of Technology
(Venkatesh et al., 2003). These uses a top-down approach (Potnis, 2014) which is based
on technology products innovated by the manufactures and pushed to the users in the
market. While they are all significant in their ability to explain the individual user
behavior or intentions to the adoption of technology innovations, they focus on the
individual behaviors with no consideration of their context, culture or community. It may
thus be incomplete in its generalization as each of these dimensions affect how mobile
financial services are adopted and used by the poor.
Bhavnani, et al. (2008) identified institutional environment, ICT infrastructure constraints
as cause‟s exclusion of poor from technology innovations. Wamuyu (2014) found that
contextual factors and cultural practices influence usage of mobile money in Kenya.
Since most of the studies focus on individual factors, this study uses an alternative to top-
17
down theoretical perspective by adopting a bottom-up approach using Potnis (2014) pro-
poor perspective.
The bottom-up approach incorporates the community, cultural and contextual factors as
the interaction between context and individual influences their behavior to adoption and
usage which is further affected by cultural and community factors. The pro-poor
perspective dimensions may provide us with constructs to understand the effects of pro-
poor factors such as cultural factors, community factors and contextual factors in the
adoption of mobile financial services, thus the question is the relationship between pro-
poor factors and the adoption and usage of mobile financial services by the poor in
Kenya?.
1.3 Research Objectives
This study‟s general objective was to establish the relationship between pro-poor factors
and the adoption and usage of mobile financial services by the poor in Kenya. This study
was guided by the following specific objectives.
i. To examine the relationship between pro-poor factors and adoption of mobile
financial services by the poor in Kenya.
ii. To investigate the relationship between adoption and usage of mobile financial
services by the poor in Kenya.
iii. To determine the influence of demographic factors on the relationship between
community factors and adoption of mobile financial services by poor in Kenya
iv. To investigate the influence of demographic factors on the relationship between
cultural factors and adoption of mobile financial services by the poor in Kenya.
v. To establish the relationship between pro-poor factors, demographic factors and
usage of mobile financial services by the poor in Kenya.
18
1.4 Value of the Study
The main purpose of this study was to contribute to the understanding of the effects of
pro-poor factors, demographic factors on adoption and usage of mobile financial services
among the poor in Kenya. The research finding was aimed at contributing to filling the
knowledge gap by exploring the relationships and influence of the pro-poor perspective
on the adoption and usage of mobile financial services in Kenya. In a further contribution
to filling the knowledge gap, this study modeled an alternative conceptual model that can
better address the pro-poor perspective of adoption and usage of mobile financial services
by the poor thus theorizing the pro-poor perspective and the bottom up approach. The
result further contributes to filling the contextual gap by unearthing the influence of pro-
poor perspective on adoption and usage of mobile financial services among the poor in
Kenya. This study also contributes to filling the methodological gap by conducting a
quantitative study on pro-poor factors and mobile financial services among the poor in
Kenya.
The outcome of this study has value for mobile financial service providers such as
telecom operators, innovators, and banks by providing them with information on how
pro-poor perspective influence adoption and usage of mobile financial services by the
poor. This will guide them in designing innovative pro-poor products, come up pro-poor
go to market strategies to rope in the poor.
The study informs government departments, agencies, regulators and lawmakers in
addressing the financial inclusion gaps by taking affirmative investment actions such as
the last mile connectivity to resolve the contextual factors, formulation of pro-poor
policies and laws that will address access, community and cultural factors.
19
1.5 Chapter Summary
This chapter comprised of introduction of the studies main concepts, the study
background, the research problem, the research objectives and the value of the study.
Further this study is organized as follows chapter two comprise of literature review and
research gap leading to conceptual model and hypothesis, chapter three is research
methodology, chapter is data analysis and findings, chapter five is discussion of findings
and chapter six is conclusions and recommendations.
20
CHAPTER TWO: LITERATURE REVIEW
2.1 Introduction
The theoretical foundation, empirical studies, and conceptual framework are presented in
this chapter. The theoretical foundation was geared to illuminate the theoretical backup of
the research; meanwhile the empirical study is reviewed in order to ascertain the study
gaps which this study aims to address by crafting a conceptual model.
2.2 Theoretical Foundation
This study was anchored on multiple theoretical perspectives to enhance the theoretical
base and cover the multi-dimensional and multi-disciplinary nature of this study. The
theories of significance to the study are Theory of Reasoned Action, Theory of Planned
Behavior, Technology Adoption Model, Unified Theory of Acceptance and Use of
Technology (UTAUT), Theories of Poverty and Social Capital Theory which are
discussed in the following subsections.
2.2.1 Social Capital Theory
The social capital theory was first introduced by Hanifan (1916), stating that it matters
who you know not what you know (Woolcock & Narayan, 2000). They stated that one‟s
family, friends, and associates constitute an important asset that can be leveraged for
material gain, called upon in a crisis or enjoyed for its own sake. Communities that have
a diverse stock of social networks and civic associations will be in a stronger position to
overcome poverty and their vulnerabilities by addressing disputes by taking advantage of
new opportunities (Narayan 1996).
21
Trust and reciprocity are salient constructs in all conceptualization of social capital
(Hawe & Shiell, 2000) as they arise from the relationships or association among the
members of the community or groups. Wilson (1996) observed that poor is not being a
member of or actively excluded from certain social networks and institutions that could
be used to secure good jobs and decent housing. Thus, poverty has implications on the
ability of the poor to adopt and continue using mobile financial services. Through the use
of their social capital, the poor have been able to overcome access challenges by
borrowing mobile phones from members of their communities. This theory is relevant as
it explains how the communities relate to each other and it can be deduced from this that
if the community adopts and use mobile financial services, members of the community
will also be significantly influenced to adopt and use mobile financial services.
2.2.2 Theories of Poverty
Poverty as the concept relates closely to inequality (Sen, 1973), a higher level of
inequality will tend to be associated with high level of poverty. The theories of poverty
are categorized into cultural and structural theories (Elish, 1973). Cultural theories
explain that it is the traits of the poor such as behavioral, attitudinal and valuation
patterns that prevent them from being socially mobile. In contrast, the structural theories
explain poverty in terms of the condition they live in such poor health, poor education,
and unemployment. Both cultural and structural theorists believe that the cyclic nature of
poverty forms the poverty syndrome leading to successive generations of the same family
remain poor. The cultural theorists argue that the poverty cycle can be interrupted by
directly attacking the behaviors and values that support the poverty syndrome.
22
On the other hand, structural theorists assume that change of employment, education,
health and the housing market is required to eliminate the poverty syndrome. The need to
identify, locate, extract, convert and consume resources for survival is the main challenge
for human being, they can be overcome by the use of technology to do these better, faster
and more economically (Lotter, 2007). The poor lack financial, material resources as
well as the opportunities to convert the resources they possess into a value-creating
activity (McNamara, 2003). Therefore change can occur through innovations that address
the needs of the poor to enable the poor to convert their resources and opportunities to
create value and reduce poverty (McNamara, 2003).
Mobile financial services will border on the structural theories of poverty as lack of
access limits the participation of the poor in the financial service this provision of
infrastructure and introduction of mobile financial services could help the poor convert
resources they possess to value creating activity, although the structure is criticized for
over-emphasis on the individualistic aspect of poverty and focus mainly on material
means to eradicate it (Sanchez-Martinez & Davis, 2014). This theory is relevant as it puts
forth the definition and characteristic of the poor, identify important issues affecting the
poor people. This understanding will help in identifying the study population and
understanding the findings of the study based on their traits and characteristics.
23
2.2.3 Technology Adoption Theories
The first theory of technology adoption discussed is Theory of Reasoned Action (TRA)
by Fishbein and Ajzen developed in 1975. The “intention” to adopt is the best predictor
for the adoption of technology (Lam & Hsu, 2004). The “behavioral intention” concept is
central to TRA with two basic determinants of intention which are the subjective norm
and attitude towards act or behavior. Lam & Hsu (2004) defined attitude as the
individual‟s behavior positive or negative feelings about performing an act, while the
subjective norm is defined to be the perception of the individual on how people important
to them consider whether to perform a certain behavior
From a mobile financial services adoption perspective, subjective norm and attitude may
be possible important factors in helping to study the behavior of an individual in a
society. TRA is only concerned with behaviors and not the outcomes as a result of these
behaviors. It is, therefore, According to Sheppard, Hartwick, & Warshaw (1989) TRA
model is only helpful in studying factors affecting behavior that may lead to mobile
financial services adoption and diffusion, but it does not provide variables to study the
consequence of these behaviors that is whether they encourage or inhibit the adoption and
diffusion of mobile financial services.
Another limitation of TRA it assumes that when an individual has got intention to act,
they will act without considering other limitations such as demographics, time, alternate
choices, ability and technological environment and the organizational environment
Nysveen, Pedersen, & Thorbjørnsen (2005). However, these factors explicitly or
implicitly might play a significant role in the adoption and diffusion of mobile financial
24
services. This theory is relevant as it is the base from which many information systems
theories have been formulated.
The Second theory of technology adoption is derived from extending the Theory of
Reasoned Action by Ajzen (1991) proposing the Theory of Planned Behavior (TPB) to
take into consideration conditions under which people lack control over their behavior
(Nysveen, Pedersen, & Thorbjørnsen, 2005). Two new variables which are control beliefs
and perceived behavioral control has been introduced by Azjen which influence
behavioral intention and ultimately the possibility of performing the act, which could be
performing the act to adopt mobile financial services.
The perceived control beliefs and behavioral control may be used as additional measures
of determining the user adoption of mobile financial services. According to Nysveen,
Pedersen, and Thorbjørnsen (2005), TPB can be used to investigate whether or not
consumer use of mobile financial services depending on their resources. It is relevant to
this study as it was significantly extended by the technology adoption model that
significantly contributes constructs to this study.
2.2.4 Technology Acceptance Model (TAM)
Technology adoption model by Davis (1989) was adopted from the Theory of Reasoned
Action (TRA). TAM has the ability to predict the new technology acceptance by an
individual, and has two constructs, the perceived usefulness and perceived ease of use.
Perceived usefulness refers to the degree of persons believes that the use of a certain
system enhances their performance, while the perceived ease of use is the degree of
believing that a person has that they will be free mental and physical effort if by using a
25
certain system (Davis, 1989).
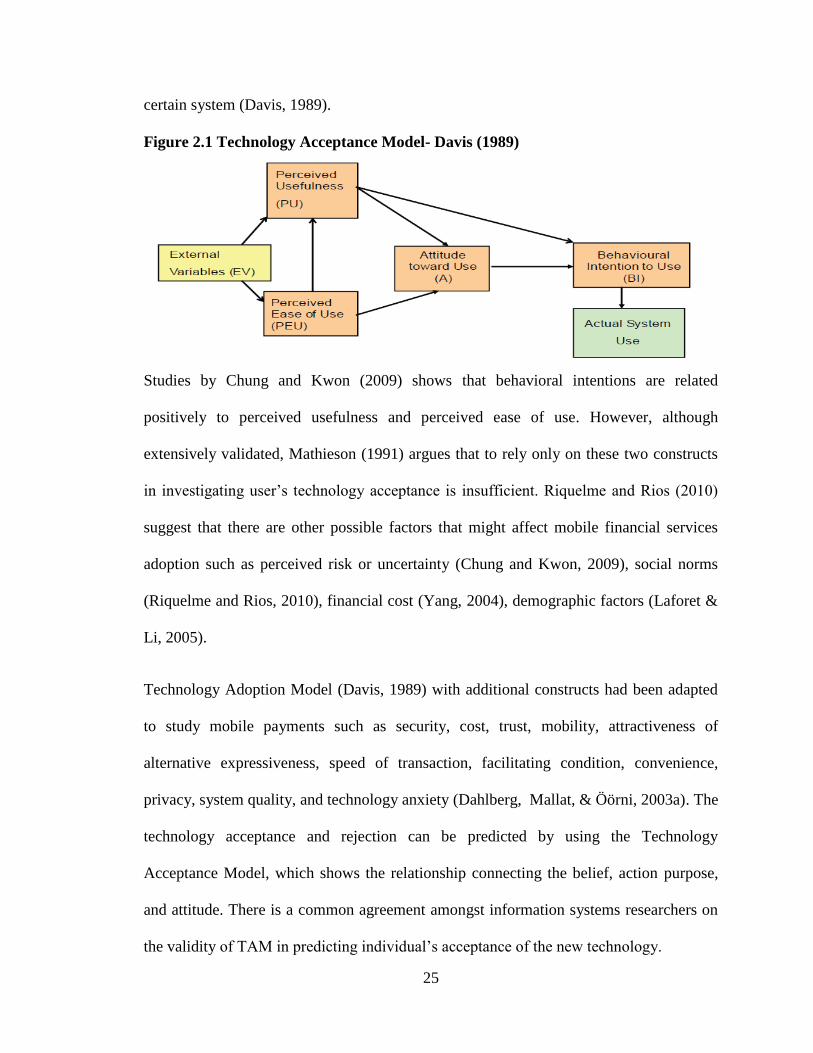
Figure 2.1 Technology Acceptance Model- Davis (1989)
Studies by Chung and Kwon (2009) shows that behavioral intentions are related
positively to perceived usefulness and perceived ease of use. However, although
extensively validated, Mathieson (1991) argues that to rely only on these two constructs
in investigating user‟s technology acceptance is insufficient. Riquelme and Rios (2010)
suggest that there are other possible factors that might affect mobile financial services
adoption such as perceived risk or uncertainty (Chung and Kwon, 2009), social norms
(Riquelme and Rios, 2010), financial cost (Yang, 2004), demographic factors (Laforet &
Li, 2005).
Technology Adoption Model (Davis, 1989) with additional constructs had been adapted
to study mobile payments such as security, cost, trust, mobility, attractiveness of
alternative expressiveness, speed of transaction, facilitating condition, convenience,
privacy, system quality, and technology anxiety (Dahlberg, Mallat, & Öörni, 2003a). The
technology acceptance and rejection can be predicted by using the Technology
Acceptance Model, which shows the relationship connecting the belief, action purpose,
and attitude. There is a common agreement amongst information systems researchers on
the validity of TAM in predicting individual‟s acceptance of the new technology.
26
TAM has some limitations as a model to study the adoption of mobile financial services
as it does not consider the social economic factors that promote or inhibit the adoption as
well as it focuses only on the organizational technology acceptance as argued by Baron,
Patterson, and Harris (2006). Based on the strengths and weakness of the models
described earlier, there have been several attempts to extend the models or combine some
variable to come up with a new model which is more relevant and useful.
Venkatesh and Davis (2000) proposed TAM2 which added social influence process and
the cognitive instrumental process to TAM. The social influence process was comprising
subjective norm, image, and voluntarism while the cognitive instrumental process
included job relevance, perceived ease of use, output quality and result demonstrability.
Wu and Wang (2005) also proposed an extension of TAM2 to integrate it with the
diffusion of innovation and addition of cost and perceived risk variables.
Renaud and Biljon (2008) introduced the mobile phone technology acceptance model
which was an extension of TAM by the addition of mediating factors and determining
factors. This theory is relevant to the study as it shows the various factors that affect
adoption of mobile financial services. TAM limitation is that it does not put into
consideration a group of people such as the poor.
2.2.5 Unified Theory of Acceptance and Use of Technology
Unified Theory of Acceptance and Use of Technology (UTAUT) was next evolution of
TAM and is the most comprehensive information system adoption theory, it was
proposed by Venkatesh et al. (2003). They did so after reviewing eight IT adoption
theories by incorporating factors included in Reasoned Action Theory, Planned Behavior
27
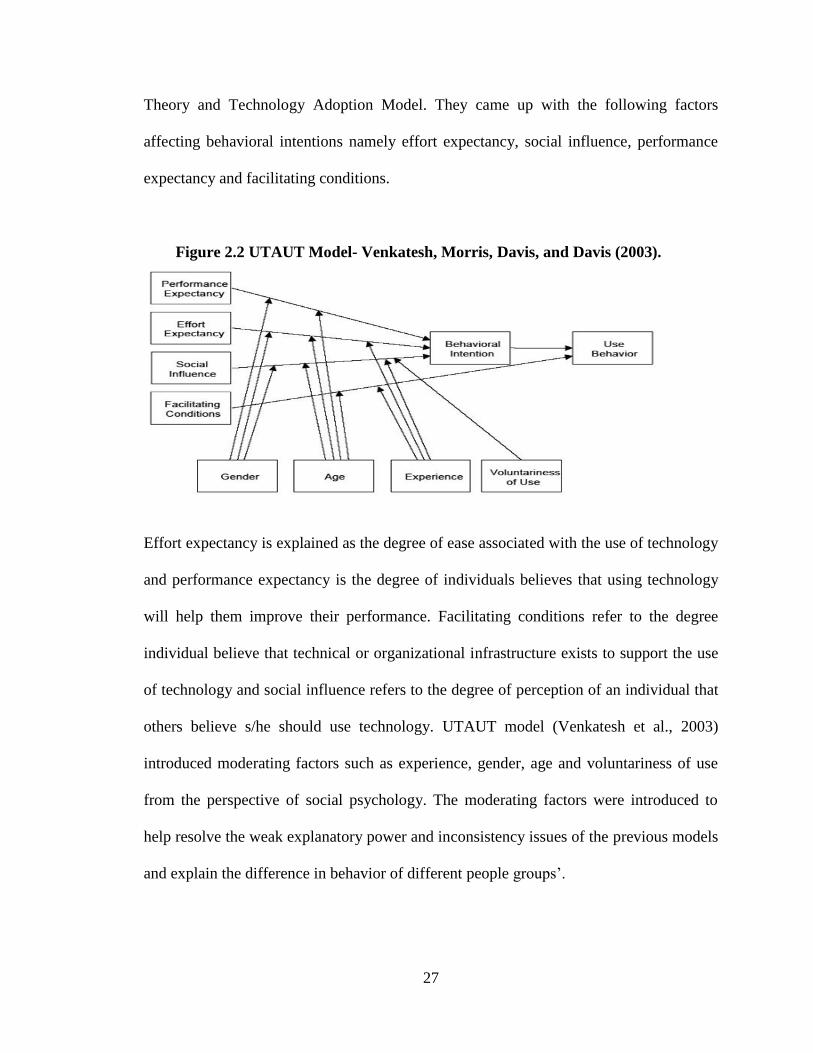
Theory and Technology Adoption Model. They came up with the following factors
affecting behavioral intentions namely effort expectancy, social influence, performance
expectancy and facilitating conditions.
Figure 2.2 UTAUT Model- Venkatesh, Morris, Davis, and Davis (2003).
Effort expectancy is explained as the degree of ease associated with the use of technology
and performance expectancy is the degree of individuals believes that using technology
will help them improve their performance. Facilitating conditions refer to the degree
individual believe that technical or organizational infrastructure exists to support the use
of technology and social influence refers to the degree of perception of an individual that
others believe s/he should use technology. UTAUT model (Venkatesh et al., 2003)
introduced moderating factors such as experience, gender, age and voluntariness of use
from the perspective of social psychology. The moderating factors were introduced to
help resolve the weak explanatory power and inconsistency issues of the previous models
and explain the difference in behavior of different people groups‟.
28
UTUAT was extended to propose a model for mobile phone acceptance and use by Kwon
and Chidambaram (2000), it was also a TAM extension which is made up of the
following components: ease of use, extent of use, demographic factors, intrinsic
motivation, social pressure, socioeconomic factors, extrinsic motivation (perceived
usefulness), and apprehensiveness. Kwon and Chidambaram (2000) found that perceived
ease of use significantly affected users‟ intrinsic and extrinsic motivation, while
apprehensiveness about cellular technology had a negative effect on intrinsic motivation.
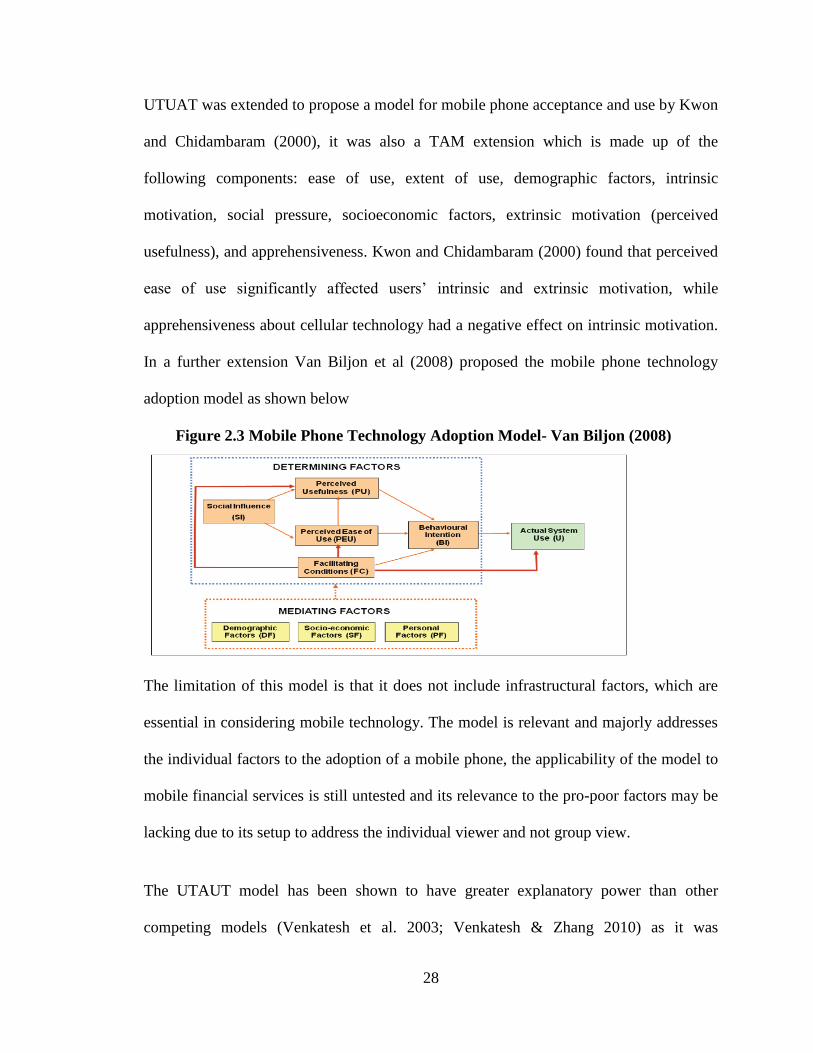
In a further extension Van Biljon et al (2008) proposed the mobile phone technology
adoption model as shown below
Figure 2.3 Mobile Phone Technology Adoption Model- Van Biljon (2008)
The limitation of this model is that it does not include infrastructural factors, which are
essential in considering mobile technology. The model is relevant and majorly addresses
the individual factors to the adoption of a mobile phone, the applicability of the model to
mobile financial services is still untested and its relevance to the pro-poor factors may be
lacking due to its setup to address the individual viewer and not group view.
The UTAUT model has been shown to have greater explanatory power than other
competing models (Venkatesh et al. 2003; Venkatesh & Zhang 2010) as it was
29
formulated by incorporating all the previous theories, but only a little UTAUT-based
research exists, particularly compared huge TAM/TPB-based research (Yu, 2012).
However, in the study of factors affecting individuals to adopt mobile banking Yu (2012)
extended the UTAUT Model to add the factors perceived credibility, perceived financial
cost and perceived self-efficacy in their study. UTAUT has been extended to capture the
pro-poor perspectives as explained in the next section
2.2.6 UTAUT Extension to Pro-Poor Perspective
This study is anchored greatly on the unified theory of acceptance and usage of
technology which had come up with the following factors affecting behavioral intentions
namely effort expectancy, social influence, performance expectancy, facilitating
conditions and had age and gender as the moderators. This theory was significantly
extended by Potnis (2014) to operationalize its variables in the pro-poor perspective
which adopted effort expectancy. Performance expectancy is part of the community
factors. Potnis (2014) also included financial cost and levels of literacy that were
Bhavnani, et al. (2008) and Yu (2012) as indicators of community factor. This study
could adopt community factors as operationalized by Potnis (2014) as part of pro-poor
factors.
Potnis (2014) further proposed contextual factors which is also an extension of unified
theory of acceptance and usage of technology. Venkatesh et al (2003) in the unified
theory of acceptance and usage of technology defined facilitating conditions as the degree
to which an individual believes that an organization and technical infrastructure exists to
support technology use. Bhavani et al. (2008) and Potnis (2014) proposed context
30
indicators as part of pro-poor factors to measure contextual challenges and
operationalized them as Technology infrastructure (such as supply of electricity, mobile
network spread and signal strength), Type of government policies ( such as investments
allowed in telecom and banking sector, regulation for mobile network service providers
and know your customer policy), technology standards (such as communication standards
and protocols like 3G,4G and biometrics), and Banking policies (such as ratio of urban
to rural branches).
This study could then adopt Potnis (2014) and Venkatesh et al (2003) operationalization
to propose contextual factors which will have indicators of facilitating condition and
regulatory policies as the context indicators. Facilitating condition includes technology
infrastructure such as mobile network, supply of electricity and signal strength.
Regulatory policies will include type of government policies, banking policies and
technology standards. This shows how the study has used the contributions from prior
studies to come up with contextual factors which are part of pro-poor factors having
indicators of facilitating conditions and regulatory policies.
Potnis (2014) proposed cultural factors by incorporating social influence from the unified
theory of acceptance and usage of technology. Venkatesh et al, (2003) used social
influence to represent social norm which has been part of all prior information systems
theories and defined social influence as the degree to which an individual perceives that
important others believe s/he should use the technology. Puschel et al. (2010), Riquelme
and Rios (2010) indicated that subjective norm was a salient influence on adoption of
mobile banking.
31
Potnis (2014) in the study of pro-poor perspective borrowing from Hofstede, (1980)
identified social cultural practices influence the user behavior to adoption and usage of
ICT. The cultural factors include pre-existing social cultural practices such as male
dominated societies where men would easily influence women‟s ability to use mobile
financial services, women‟s tendency to avoid risk, type of culture (individualism vs
collectivism) and expected roles to be carried out by men and women influence the
adoption and usage of mobile financial services. This study could adopt cultural factors
operationalized as one of the pro-poor factors from the study by Potnis (2014). The
indicators for cultural factors are type of culture as identified by Potnis (2014) and social
influence as identified by Venkatesh et al. (2003).
This study could adopt demographic factors with indicators of age operationalized by
Rogers (2003), Puschel et al. (2010), Laforet and Li (2005) and Yu (2012), and indicator
of gender as operationalized by Riquelme and Rios (2010), Puschel et al. (2010) and Yu
(2012). Venkatesh et al. (2003) found that UTAUT allows researchers to analyze the
contingencies from the moderators that would amplify or constraint the effects of the core
determinants. This study thus could adopt cultural factors and community factors that
could be affected by the moderators of age and gender thus it is important to analyze
whether demographic factors would moderate the relationship between community
factors and adoption as well as cultural factors and adoption of mobile financial services
by the poor.
32
This study could adopt most of the study variables from unified theory of acceptance and
usage of technology as extended by Potnis (2014) to propose the pro-poor factors which
includes community factors, cultural factors and contextual factors. This study could also
adopt the demographic factors from the unified theory of acceptance and usage of
technology to investigate the moderating effect of the age and gender indicators on the
relationship between pro-poor factors (community and cultural factors) and adoption of
mobile financial services. This theory is relevant to the study as it provides indicators that
could be adopted in the conceptual framework, performance and effort expectancy as part
of community factors, social influence part of the cultural factors, facilitating condition
part of contextual factors and the moderating factors of age and gender part of
demographic factors. This study also reviewed the theories of poverty to understand the
traits and characteristic of the poor who are the population for this study, the social
capital theory was also reviewed to understand the influence of a community in adoption
of mobile financial services.
2.3 Empirical Review: Pro-Poor Perspective and Mobile Financial Services
Poverty reduction through the creation of employment, basic social service provision and
economic growth has dominated Kenya‟s development efforts (Kimalu et al., 2002).
These efforts have not brought about the desired results as more than half of the
population are still in poverty (Kabubo-Mariara, 2007) and the number of people who
escaped poverty is less than the number who became poor over the same period
(Kristjanson et al., 2009).
33
The pro-poor terminology has been widely used to mean towards the poor or for the
benefit of the poor by the donor communities. It is from this background that the concept
of pro-poor perspective that focuses on context, culture, and communities was introduced
by Potnis (2014). He stated that mobile banking being a social informatics phenomenon
is embedded in social context, its adoption and usage is dependent on poor‟s ability to
overcome challenges to using a mobile phone and mobile financial services. World Bank
(2012) stated that contextual and cultural characteristic of the communities significantly
influences the adoption and usage of ICT.
The pro-poor perspective is informed by the three dimensions of context, culture, and
communities and not by mobile operators, government agencies or other stakeholders,
thus a bottom-up approach which does not impose or borrow any external predefined
theoretical constructs, unlike several other theoretical top-down perspectives that have
been used to study mobile financial services. Potnis (2014) identified pro-poor factors
such as contextual, community and cultural factors affecting adoption of mobile banking
in developing nations. This study adopted pro-poor factors to investigate its effects on
adoption of mobile financial services as detailed below.
2.3.1 Contextual Factors and Adoption of Mobile Financial Services
Sanfilippo and Fichman (2014) stated that by providing contextual evidence the common
conception and expectation of social informatics are examined. Context is a critical
dimension of the pro-poor perspective for examining social informatics phenomenon
(Potnis, 2014). The context details the study environment inhabited by the poor,
characterized by prevalent contextual factors. Telecom operators are profit driven, thus
have been unwilling to invest in areas inhabited by the poor due to high network
34
infrastructure investment cost and little returns on their investment due to poverty,
denying the poor access to mobile financial services without which adoption and usage
may not arise.
The empirical literature is rich with various studies identifying contextual factors.
Bhavnani, et al. (2008) observed that the rural poor population characteristics are not
conducive to ICT adoption. They identified constraints that exclude the poor from ICT
innovations such as institutional environmental constraints such as lack of local content
in local language, lack of skilled human resource to develop applications and service end
user, as well as the lack of an institutional mechanism that is developed well and
functioning to implement policies and regulation. They further identified rural
infrastructure constraint which is undeveloped due high cost of last mile connectivity,
intermittent and unreliable power if any, and low priority of ICT investments due to more
pressing needs.
Potnis (2014) found under-developed technology infrastructures such as the limited
supply of electricity, unavailable mobile network coverage and signal strength as the
biggest contextual challenge of mobile financial services. This is due to under-developed
formal banking infrastructure, resulting in fewer branches, automated teller machines,
and low internet penetration.
Potnis (2014) further stated types of government policies such as regulation for mobile
network providers, know your customer policies and percentage of foreign direct
investment allowed in telecom and banking sector as contextual factors. Technology
standards such as communication standards and protocols like 3G and 4G and banking
35
policies such as the ratio of rural and urban bank branches are other contextual factors
(Potnis, 2014). Mohan and Potnis (2015) found that the high cost of the mobile phone,
poor technology infrastructure hampers the use of mobile banking.
Provision of access to mobile financial services for the poor is therefore influenced by
contextual factors such as facilitating conditions and regulatory policies. Formal financial
service providers were unable or unwilling to provide financial services due to the profit
and/or policy constraints. This study adopted contextual factors to study its effects on
adoption of mobile financial services by the poor and the contextual factor indicators of
facilitating condition and regulatory policies would be used to measure the relationship
between contextual factors and adoption. Accordingly, following hypothesis is posited.
H1A: There is a relationship between contextual factors and adoption of mobile financial
services among the poor in Kenya.
2.3.2 Community Factors and Adoption of Mobile Financial Services
McMillan and Chavis (1986) stated that community is formed when people with similar
values and believe that by joining together their goals, needs and priorities are better
satisfied. Mas and Kumar (2008) stated that for poor communities, mobile financial
services presents a delicate balance between a conceptually powerful opportunity and
practical challenges thus community factors could influence adoption and usage of
mobile financial services.
The empirical literature has identified community factors, Bhavnani, et al. (2008)
identified rural poor population constraints such as low level of functional literacy, low
awareness, none or basic computer literacy, low disposable income, a constant struggle
36
for survival, poor health, poor living conditions, remoteness and low population density.
They further pointed out rural poverty reduction strategies constraints such as ICT not
well integrated into rural poverty reduction strategies. Yu (2012) found that individual
intention to adopt mobile banking is influenced by perceived financial cost, performance
expectancy and not effort expectancy. Potnis (2014) identified community factors such as
perceived ease of use, the level of language literacy and level of financial literacy. Mohan
and Potnis (2015) also found low literacy levels hamper the use of mobile banking. This
study adopted community factors that have indicators of performance expectancy and
effort expectancy from Yu (2012), literacy levels from Mohan & Potnis (2015) and
financial cost from study by Bhavnani et al (2008).
Adoption is dependent on the ability of the poor to use a mobile phone to access mobile
financial services which are dependent on their levels of literacy and their ability to
sustain the cost of using financial services. The perception that mobile financial services
are expensive or complex could lower the levels of adoption, thus there is a relationship
between community factors and adoption. This study adopted community factors to
examine its effect on adoption of mobile financial services by the poor using the
community factor indicators such as performance expectancy, effort expectancy, literacy
levels and financial cost. These indicators were used to measure the relationship between
community factors and adoption. This study thus hypothesized.
H1B: There is a relationship between community factors and adoption of mobile
financial services among the poor in Kenya.
37
2.3.3 Cultural Factors and Adoption of Mobile Financial Services
Culture is described as values that are shared across people in a society and these
underlying values influence individuals' attitudes and behaviors (Straub, Loch, Evaristo,
Karahanna & Srite, 2002). Various empirical literatures has identified cultural factors,
Bertolotti (1984) pointed out that culture greatly affects the acceptance of technology
through its belief and values, thus culture leads a social influence where members who
share the same culture can influence other members within that culture.
Adoption is dependent on the social-cultural influence of the poor if there exist a positive
social influence and favorable cultural practices adoption could be higher as opposed to
negative social-cultural influence on adoption. The dependency of adoption on social and
cultural influence makes the relationship between cultural factors and adoption important.
This study adopted cultural factors to investigate the effects of cultural factors on the
adoption of mobile financial services by poor. The cultural factor indicators such as
social influence and types of culture would be used to measure the relationship between
cultural factors and adoption accordingly posit this hypothesis.
H1C: There is a relationship between cultural factors and adoption of mobile
financial services among the poor in Kenya.
2.3.4 Cultural, Community, Demographic Factors and Adoption of MFS
The influence of demographic factors such as age and gender on adoption has been
significantly researched, Rogers (2003) found that early technology adopters are young,
have high social status, better educated and have high incomes. Puschel et al. (2010)
found that most mobile banking users are less than 30years old and Yu (2012) observed
38
that there is a high-performance expectancy in older respondents and the effect of social
influence was significantly amplified in younger respondents, however, studies like
Laforet and Li (2005) found that the main users of mobile banking were not necessarily
young and highly educated. Though inconsistent in various studies, it is important to test
whether age moderates adoption of mobile financial services among the poor in Kenya.
The empirical studies have also significantly tested the influence of gender on adoption,
Riquelme and Rios (2010) found among women stronger social norm influence intention
to adopt than in men, in contrast, Puschel et al. (2010) males are predominantly users of
mobile banking. Yu (2012) found that performance expectancy and perceived financial
cost were more crucial to men. Yu (2012) adopted unified theory of acceptance and use
of technology with age and gender as moderating effects to investigate what affecting
individuals to adopt mobile banking. This study adopted demographic factors to
investigate the influence of demographic factors on the relationships between cultural
factors and adoption as well as between community factors and adoption using the
demographic factor indicators such as age and gender. Accordingly, hypothesis below is
formulated.
H2A: Demographic factors have a significant influence on the relationship
between community factors and adoption of mobile financial services among the
poor.
H2B: Demographic factors have a significant influence on the relationship
between cultural factors and adoption of mobile financial services among the
poor in Kenya.
39
2.3.5 Adoption and Usage of Mobile Financial Services
Technology adoption is defined as a set of sequential activities that lead to initial
acceptance or adoption followed by technology usage (Karahanna, 1999). The
introduction of mobile financial services brought forth the opportunity for the poor to
adopt, but not without challenges as Yu (2012) in a study of mobile banking found that
individual intention to adopt is influenced by perceived financial cost, performance
expectancy, social influence and perceived credibility while usage behavior is affected by
intention and facilitating conditions. Therefore the ability of the poor to overcome the
individual behavioral intention and usage behavioral factors determine adoption of
mobile financial services, this study adopts usage intention and behavioral intention as an
indicator to measure adoption.
Usage builds on initial adoption of mobile financial services, but Bhattacherjee (2001)
states that the eventual success of new IT is more dependent on the continued usage than
the initial adoption. Lee, Shin, & Lee. (2009) in their study of the post-adoption usage of
mobile data services, found that usage can be measured by change in usage frequencies
such as increase or decrease in usage. The usage of mobile financial services can be for
various purposes leads to usage benefits for the poor, which in turn lead to an
improvement in their livelihood and reduction in poverty.
This study adopted a change in usage frequency and usage purposes as the indicators for
measuring usage of mobile financial services by the poor to ascertain levels of usage,
where high usage frequency will mean high levels of usage and examine if usage of
mobile financial services has been beneficial to the poor. Usage is dependent on adopting
40
as it could significantly influence how they use mobile financial services. It is thus
possible that successful adoption could lead to higher levels of usage, thus exist a
relationship between adoption and usage. Adoption and usage could be explored further
to establish the relationships and effects that adoption has on usage. This study
accordingly hypothesized. H3: There is a relationship between adoption and usage of
mobile financial services among the poor in Kenya.
H4: There is a relationship between pro-poor factors and usage of MFS by the poor in
Kenya.
H5: There is a relationship between pro-poor factors, demographic factors, adoption and
usage of mobile financial services among the poor in Kenya.
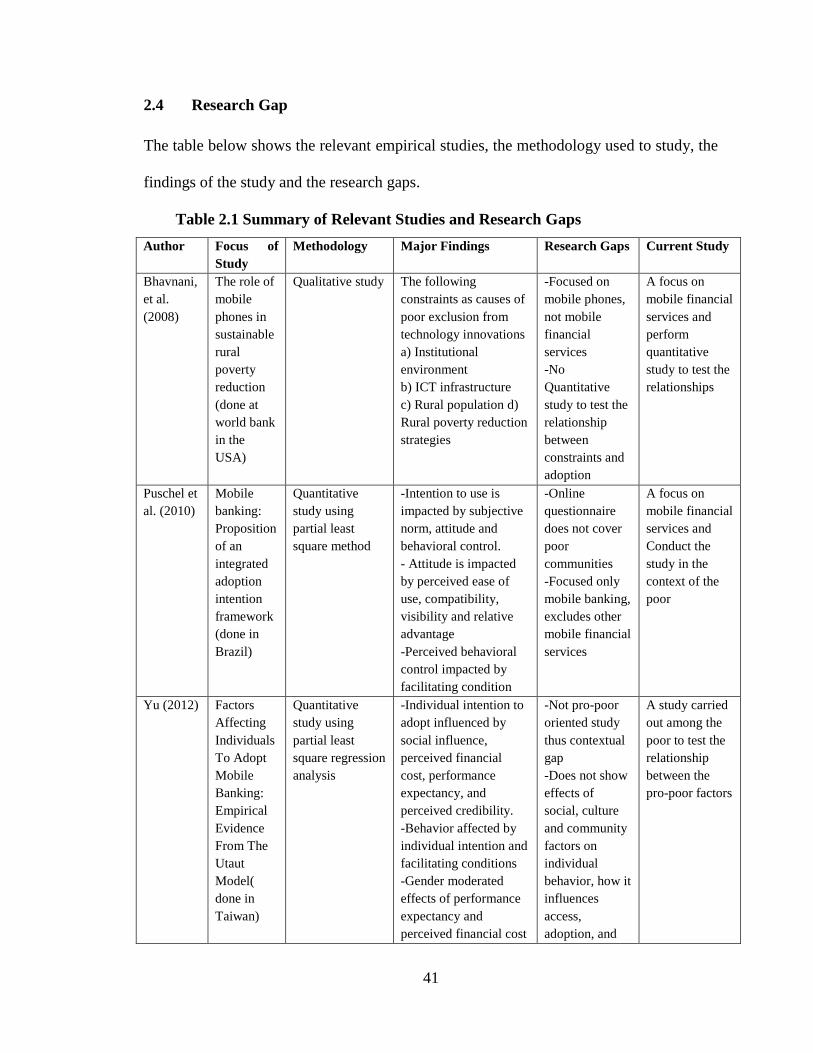
41
2.4 Research Gap
The table below shows the relevant empirical studies, the methodology used to study, the
findings of the study and the research gaps.
Table 2.1 Summary of Relevant Studies and Research Gaps
Author Focus of
Study
Methodology Major Findings Research Gaps Current Study
Bhavnani,
et al.
(2008)
The role of
mobile
phones in
sustainable
rural
poverty
reduction
(done at
world bank
in the
USA)
Qualitative study The following
constraints as causes of
poor exclusion from
technology innovations
a) Institutional
environment
b) ICT infrastructure
c) Rural population d)
Rural poverty reduction
strategies
-Focused on
mobile phones,
not mobile
financial
services
-No
Quantitative
study to test the
relationship
between
constraints and
adoption
A focus on
mobile financial
services and
perform
quantitative
study to test the
relationships
Puschel et
al. (2010)
Mobile
banking:
Proposition
of an
integrated
adoption
intention
framework
(done in
Brazil)
Quantitative
study using
partial least
square method
-Intention to use is
impacted by subjective
norm, attitude and
behavioral control.
- Attitude is impacted
by perceived ease of
use, compatibility,
visibility and relative
advantage
-Perceived behavioral
control impacted by
facilitating condition
-Online
questionnaire
does not cover
poor
communities
-Focused only
mobile banking,
excludes other
mobile financial
services
A focus on
mobile financial
services and
Conduct the
study in the
context of the
poor
Yu (2012) Factors
Affecting
Individuals
To Adopt
Mobile
Banking:
Empirical
Evidence
From The
Utaut
Model(
done in
Taiwan)
Quantitative
study using
partial least
square regression
analysis
-Individual intention to
adopt influenced by
social influence,
perceived financial
cost, performance
expectancy, and
perceived credibility.
-Behavior affected by
individual intention and
facilitating conditions
-Gender moderated
effects of performance
expectancy and
perceived financial cost
-Not pro-poor
oriented study
thus contextual
gap
-Does not show
effects of
social, culture
and community
factors on
individual
behavior, how it
influences
access,
adoption, and
A study carried
out among the
poor to test the
relationship
between the
pro-poor factors
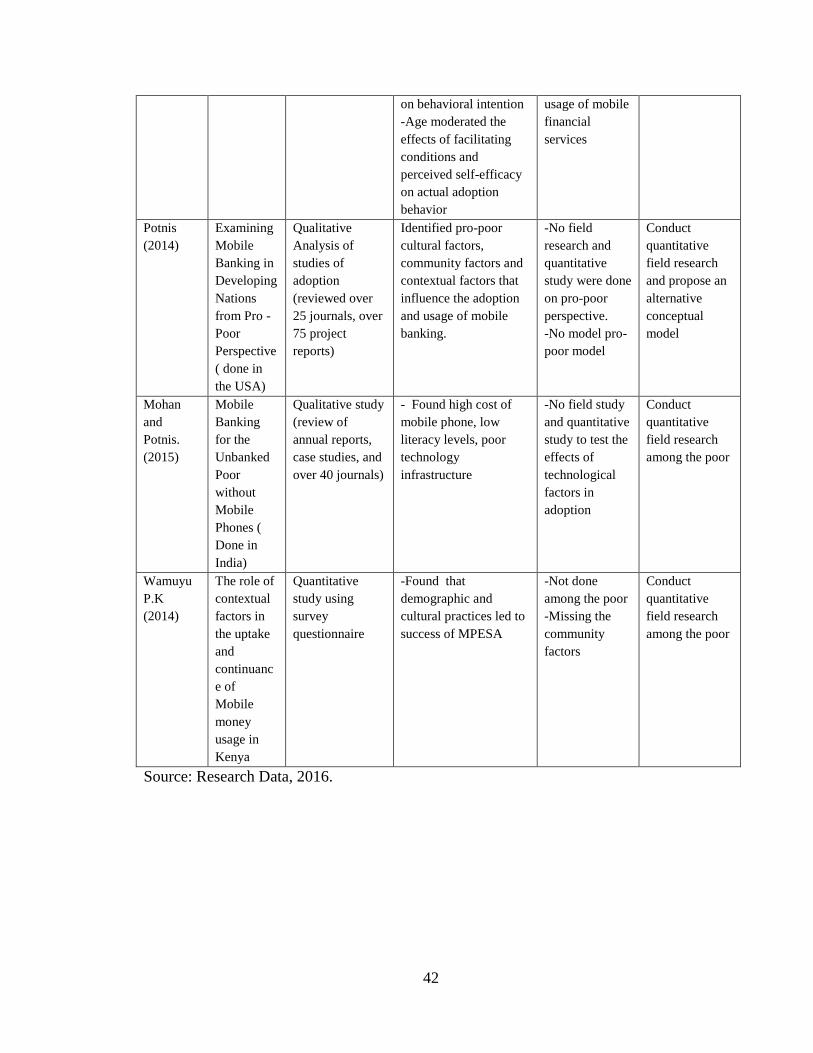
42
on behavioral intention
-Age moderated the
effects of facilitating
conditions and
perceived self-efficacy
on actual adoption
behavior
usage of mobile
financial
services
Potnis
(2014)
Examining
Mobile
Banking in
Developing
Nations
from Pro -
Poor
Perspective
( done in
the USA)
Qualitative
Analysis of
studies of
adoption
(reviewed over
25 journals, over
75 project
reports)
Identified pro-poor
cultural factors,
community factors and
contextual factors that
influence the adoption
and usage of mobile
banking.
-No field
research and
quantitative
study were done
on pro-poor
perspective.
-No model pro-
poor model
Conduct
quantitative
field research
and propose an
alternative
conceptual
model
Mohan
and
Potnis.
(2015)
Mobile
Banking
for the
Unbanked
Poor
without
Mobile
Phones (
Done in
India)
Qualitative study
(review of
annual reports,
case studies, and
over 40 journals)
- Found high cost of
mobile phone, low
literacy levels, poor
technology
infrastructure
-No field study
and quantitative
study to test the
effects of
technological
factors in
adoption
Conduct
quantitative
field research
among the poor
Wamuyu
P.K
(2014)
The role of
contextual
factors in
the uptake
and
continuanc
e of
Mobile
money
usage in
Kenya
Quantitative
study using
survey
questionnaire
-Found that
demographic and
cultural practices led to
success of MPESA
-Not done
among the poor
-Missing the
community
factors
Conduct
quantitative
field research
among the poor
Source: Research Data, 2016.
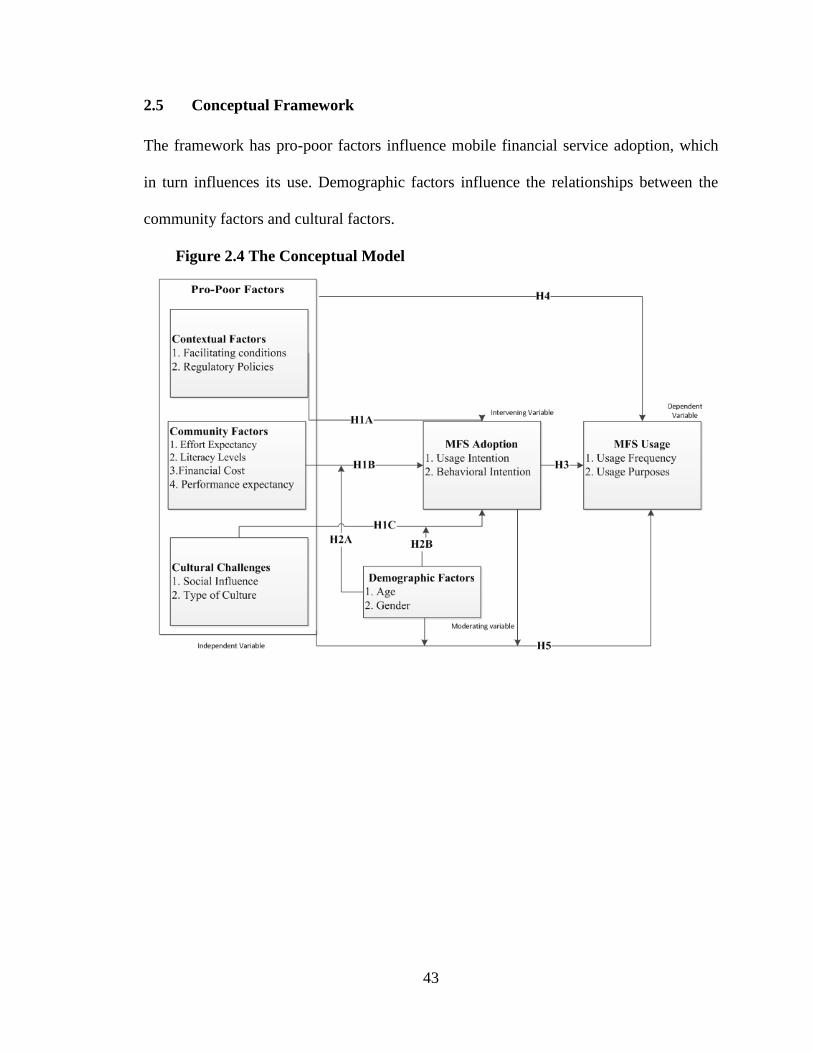
43
2.5 Conceptual Framework
The framework has pro-poor factors influence mobile financial service adoption, which
in turn influences its use. Demographic factors influence the relationships between the
community factors and cultural factors.
Figure 2.4 The Conceptual Model
44
2.6 Hypothesis
Based on the conceptual framework this study posits the following hypothesis
H1A: There is a relationship between contextual factors and adoption of mobile financial
services.
H1B: There is a relationship between community factors and adoption of mobile financial
services.
H1C: There is a relationship between cultural factors and adoption of mobile financial
services.
H2A: Demographic factors have a significant influence on the relationship between
community factors and adoption of mobile financial services.
H2B: Demographic factors have a significant influence on the relationship between
cultural factor and adoption of mobile financial services.
H3: There is a relationship between adoption and usage of mobile financial services.
H4: There is a relationship between pro-poor factors and usage of mobile financial
services.
H5: There is a relationship between pro-poor factors, demographic factors, and usage of
mobile financial services.
2.7 Chapter Summary
This chapter was a review of existing literature focusing on various relevant theories such
as UTAUT, Poverty Theories and Social Capital theory. The empirical review and
relationships between variables was identified, research gap established, conceptual
model drawn and hypothesis was posited.
45
CHAPTER THREE: RESEARCH METHODOLOGY
3.1 Introduction
This chapter covers research philosophy, research design, research population, decides on
the sampling design and procedures, then choose a method of data collection and
analysis.
3.2 Research Philosophy
The three main philosophical approaches that dominate information system research are
the critical theory, interpretivism, and positivist approach. Orlikowski and Baroudi
(1991) discuss critical realism as attempting to evaluate critically and transforming the
social reality through the provision of an evaluative dimension. Byrman (2001) states that
the interpretive approach has been described as the reality that is socially constructed to
understand the inter-subjective meaning embedded in social life. Its main critic is it
ignores possible conflict structures that can generate change.
Orlikowski and Baroudi (1991) state that the positivist approach believes in the existence
of a physical and social world that is independent of human being. It assumes that
knowledge, reality, and instruments are quantifiable, measurable and objective using
properties which are independent of the researcher. Somasundaram and Karlsbjerg (2003)
states that positivist approach is over simplification and abstraction of complex
phenomena through few unilateral relationships. Despite the criticism, this approach has
been widely used in the literature due to its strengths in offering explanations. This study
adopted a positivist philosophy as the best way to answer the research questions by
testing the hypothesis statements backed by facts obtained from the primary data and
deductive logic.
46
3.3 Research Design
Levin (2006) states that cross-sectional study is appropriate as it is robust to the effects of
relationship studies that aims to establish the associations among variables and enhances
the credence of results by providing a conclusion on data at a specific point in time. This
study adopted a cross-sectional survey design as the study is best by collecting data at apt
in time and correlating to test the hypotheses. This design has been used in other studies
such as Barnes and Corbitt (2003), and Baron, Patterson, and Harris (2006).
3.4 Population and Sampling
The target population of the study was the adult poor living in the slums of Nairobi, the
poor are defined by Alsi and Klaper (2012) as those living below poverty line of 2.5$ a
day and World Bank (2014) puts the percentage of poor in Kenya at 45.9%. As a result of
low income they live in slums which is an informal settlement characterized by lack of
proper sanitation and deplorable living conditions. The characteristic of the poor living in
Nairobi is a representative of the poor living in Kenya as they possess similar
characteristics such as low income. Nairobi County hosts Kenya‟s political, commercial
and industrial capital and has an adult population of 2,042,769 (Census, 2009), with the
percentage of the poor at 22% (Economic Survey, 2014), the calculated adult poor
population is 449,409 and taking further consideration that the mobile penetration is
82.6% the calculated adult poor population with mobile phone access is 371,212. Using
the Cochran‟s 1977 sample size formula, with a confidence level of 95% and confidence
interval of 5 the sample size is 384 people and adding 16 for none response and
heterogeneity the sample size is 400 people

47
The sampling method adopted by this study was stratified random sampling, Nairobi is
stratified into nine sub-counties of Nairobi namely Starehe, Kamukunji, Kasarani,
Makadara, Embakasi, Njiru, Dagoretti, Langata, and Westlands. Slums in the sub-
counties of Langata, Embakasi, and Makadara are selected as they are representative of
the slums of Nairobi as they have similar characteristics, living standards and are
inhabited by the poor. The respondents from the three slums were selected using random
sampling and responses from each of the three slums were obtained.
3.5 Data Collection
The study collected primary data from respondents with the aim of answering the
research questions. Data was collected using a semi-structured survey questionnaire
which contains a mixture of open-ended questions that permit the respondents to give
detailed answers and close ended questions. Leedy and Ormrod (2005) state that survey
questionnaire is apt as it assists in understanding the phenomena that are occurring in the
present situation and useful obtaining information from different locations.
The questionnaire was structured into six sections. Section A covers the demographic
information, while section B to F covers the questions based on the research questions.
Some items on the questionnaire will be measured in 7 point Likert scales ranging from
strongly agree to strongly disagree and included closed and open-ended questions.
48
The questionnaire was administered with the help of trained research assistants to slum
residents in the three sub-counties. Kibera slum from Langata, Lunga Lunga slum from
Makadara and Mukuru Kwa Njenga slum from Embakasi in Nairobi County was
randomly selected to get a response from the adult poor. The interviews were conducted
home visits, people sitting near shops and approaching people walking on the streets.
3.6 Pilot Study
The pilot study to pretest the questionnaire was conducted where it was reviewed by
colleagues, practitioners in telecommunication companies and scholars who reviewed and
suggested various adjustments, refinements, modifications and corrections in the content,
adequacy of the questions, clarity, and wording which were immediately done. The final
questionnaire accompanied by introduction letter was sent out for data collection with the
help of trained research assistants who were first trained for two days on the
questionnaire testing their understanding of the questions and the ability to communicate
with the respondents to clarify respondent‟s queries.
The data were collected from respondents in the identified areas by random sampling,
where people on the streets, others sitting around the shops and others in their houses
were approached, shown the letter and requested for their time to help to respond to the
questionnaire. Despite the explanations that this was purely for academic purpose some
still wanted to know if they will be paid to respond to which the researcher and the
research assistants explained that there was no payment, thus some walked away
indicating they are busy while others spent the time to respond to the questionnaire.
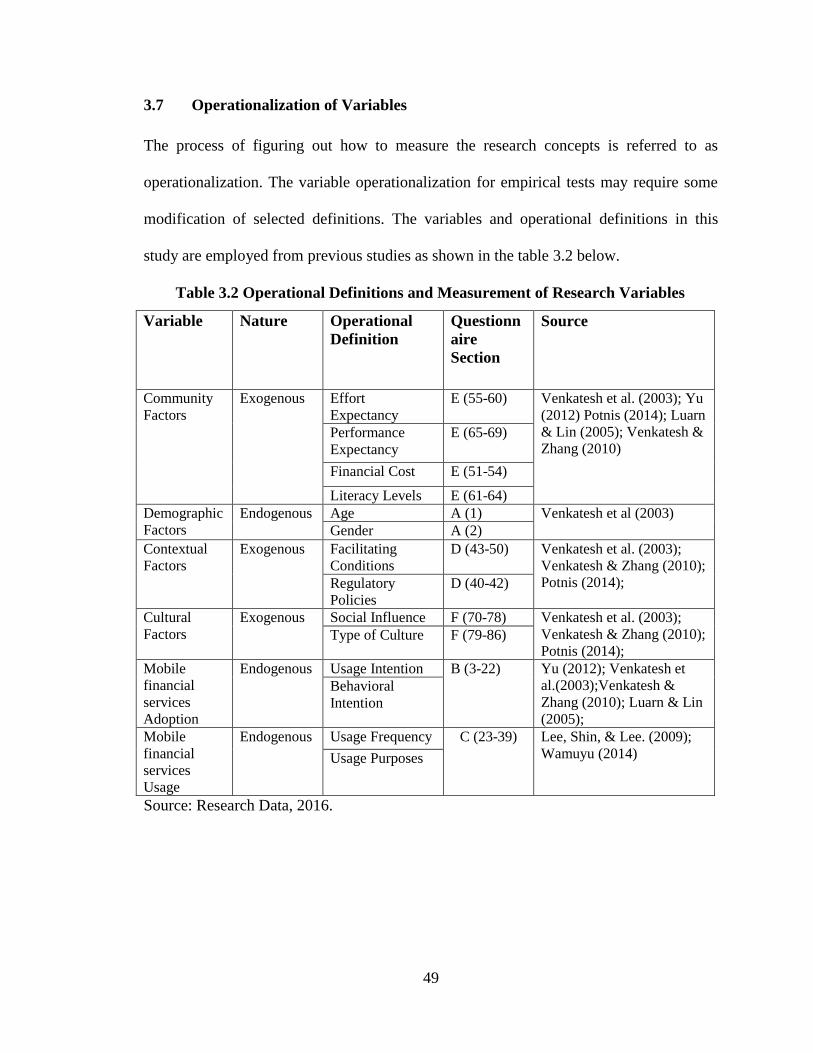
49
3.7 Operationalization of Variables
The process of figuring out how to measure the research concepts is referred to as
operationalization. The variable operationalization for empirical tests may require some
modification of selected definitions. The variables and operational definitions in this
study are employed from previous studies as shown in the table 3.2 below.
Table 3.2 Operational Definitions and Measurement of Research Variables
Variable Nature Operational
Definition
Questionn
aire
Section
Source
Community
Factors
Exogenous Effort
Expectancy
E (55-60) Venkatesh et al. (2003); Yu
(2012) Potnis (2014); Luarn
& Lin (2005); Venkatesh &
Zhang (2010) Performance
Expectancy
E (65-69)
Financial Cost E (51-54)
Literacy Levels E (61-64)
Demographic
Factors
Endogenous
Age A (1) Venkatesh et al (2003)
Gender A (2)
Contextual
Factors
Exogenous Facilitating
Conditions
D (43-50) Venkatesh et al. (2003);
Venkatesh & Zhang (2010);
Potnis (2014); Regulatory
Policies
D (40-42)
Cultural
Factors
Exogenous Social Influence F (70-78) Venkatesh et al. (2003);
Venkatesh & Zhang (2010);
Potnis (2014); Type of Culture F (79-86)
Mobile
financial
services
Adoption
Endogenous Usage Intention B (3-22) Yu (2012); Venkatesh et
al.(2003);Venkatesh &
Zhang (2010); Luarn & Lin
(2005);
Behavioral
Intention
Mobile
financial
services
Usage
Endogenous Usage Frequency C (23-39) Lee, Shin, & Lee. (2009);
Wamuyu (2014) Usage Purposes
Source: Research Data, 2016.
50
3.8 Reliability and Validity
DeVellis (1991) stated that reliability is the degree to which the measure is free of
variable error. Reliability is enhanced by the accuracy and precision of the measurement
procedure. The survey questionnaires were tested for reliability and validity and have the
same questions for all the respondents‟ in order to provide consistent results. The
constructs internal consistency loading and values was inspected to assess the individual
item's reliability.
The Cronbach‟s alpha test for internal consistency was used to test the findings of the
data to indicate the extent to which a set of items can be treated as using a latent variable
and a coefficient of 0.6 was considered for this study to determine the reliability of the
scales and the result Goodhue (1998). To establish whether the constructs are
represented by the indicators in the measurement model, composite reliability was
assessed noting the threshold of 0.6 and above. The measurement scale reliability was
also assessed using an item to total correlation with a threshold of 0.5 and the inter-item
correlation of 0.3 (Bryne, 2001).
The validity of the instrument was tested for face and content validity. Since the
measurement scales are derived from extensive review of conceptual and empirical
literature review the instrument was deemed to have face validity as they reflect the key
component of pro-poor factors, demographic factors, adoption and usage of mobile
financial services. The content validity was ensured through review and verification of
extant literature for the items contained in the questionnaire and carefully reworded to fit
the context of this study. The questionnaire was reviewed by supervisors, other doctoral
51
students, and practitioners in the banks and mobile telecommunication companies.
The convergent validity test was done using Smartpls and the obtained average variances
explained were checked against the threshold of 0.5. Discriminant validity assessed
whether the constructs analyzed are distinguishable by measuring the average variance
explained being within the acceptable range of the constructs and found that the
constructs passed discriminant validity Fornell and Larcker (1981). Other studies such as
Puschel et al. (2010), Yu (2012) and Lu (2005) used these tests for reliability and
validity.
3.9 Data Analysis
The data collected through questionnaires were coded and summarized ready for analysis.
This study employed structural equation modeling (SEM) technique to model and
analyze relationships and parameters of all constructs of the conceptual framework.
Urbach and Ahlemann (2010) state that SEM is a single systemic statistical technique for
the testing and estimation casual relationships among latent variables.
SEM Partial Least Squares (SEM-PLS) approach was employed to estimate the
relationship between pro-poor factors, adoption and usage of mobile financial services by
the poor in Kenya. SEM-PLS is an approach that uses empirical data to simultaneously
test multivariate models (Hair, Hult, Ringle & Sarstedt, 2013). It estimates both the
52
causal and linear relationships between the multiple independent or dependent,
endogenous or exogenous constructs by simultaneous multiple equation estimation
processes (Babin & Svensson, 2012).
The actual analysis started after data collection in a systematic way, the questionnaires
were coded and data transferred from the paper questionnaire into an excel file where all
the questions are captured and the responses are recorded for each question tracking each
question using a unique identifier. The data were then screened to check for mistakes
such as one question having two responses where one was expected, or having no
feedback for this question, the general rule was in any such cases the questionnaire will
be removed from the list and considered as spoilt depending on the extent of the mistake.
The responses were fed into SPSS 20 and descriptive analysis is performed to get the
response rates, general characteristics of the responses and identification of missing
values. This was followed by checking to see if there are any outliers and testing of
normality of the data and the presence of multi-collinearity problems using descriptive
statistics.
The measurement model was developed in SmartPLS 3.0 to perform the model analysis
by performing various tests such as reliability and validity tests. Data purification using
exploratory factor analysis was performed to refine the variables into the most effective
number by choosing to retain variables with high corrections among self but low with
other variables. This was done using principle component analysis using varimax
rotation. The results of exploratory factor analysis were reviewed and items with high
cross-loadings, low item to total correlations were removed. This method was relevant for
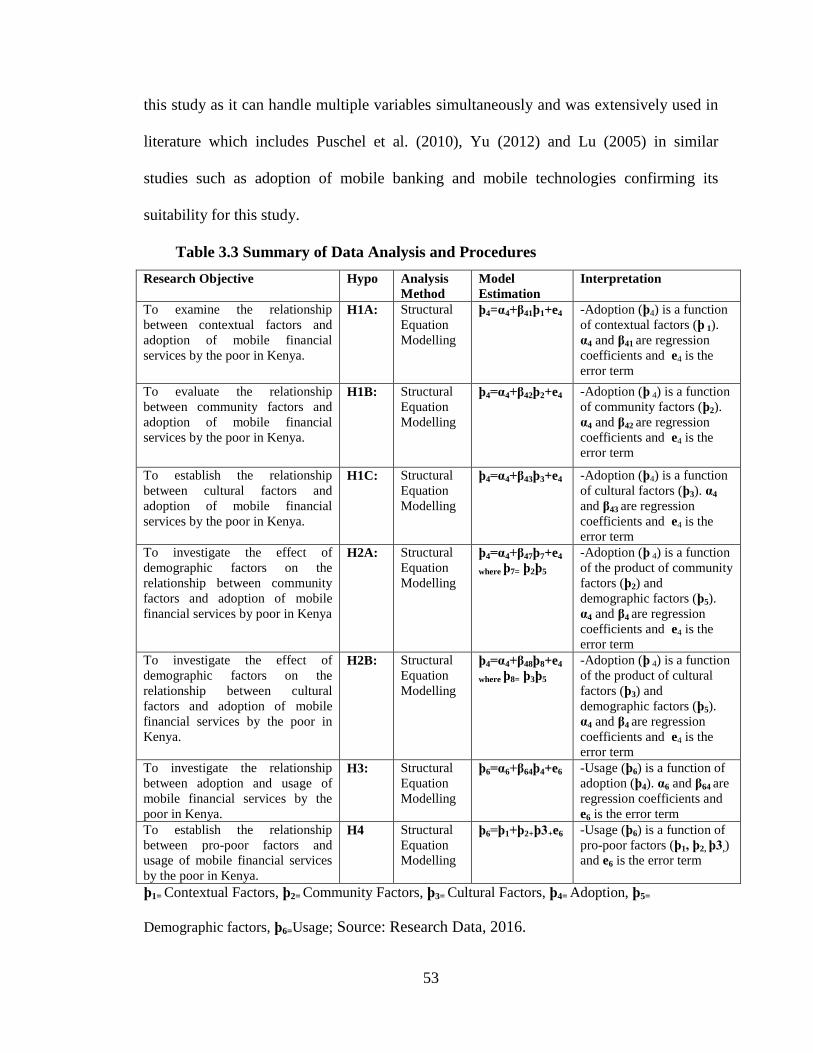
53
this study as it can handle multiple variables simultaneously and was extensively used in
literature which includes Puschel et al. (2010), Yu (2012) and Lu (2005) in similar
studies such as adoption of mobile banking and mobile technologies confirming its
suitability for this study.
Table 3.3 Summary of Data Analysis and Procedures
Research Objective Hypo Analysis
Method
Model
Estimation
Interpretation
To examine the relationship
between contextual factors and
adoption of mobile financial
services by the poor in Kenya.
H1A: Structural
Equation
Modelling
ϸ4=α4+β41ϸ1+e4
-Adoption (ϸ4) is a function
of contextual factors (ϸ 1).
α4 and β41 are regression
coefficients and e4 is the
error term
To evaluate the relationship
between community factors and
adoption of mobile financial
services by the poor in Kenya.
H1B: Structural
Equation
Modelling
ϸ4=α4+β42ϸ2+e4
-Adoption (ϸ 4) is a function
of community factors (ϸ2).
α4 and β42 are regression
coefficients and e4 is the
error term
To establish the relationship
between cultural factors and
adoption of mobile financial
services by the poor in Kenya.
H1C: Structural
Equation
Modelling
ϸ4=α4+β43ϸ3+e4
-Adoption (ϸ4) is a function
of cultural factors (ϸ3). α4
and β43 are regression
coefficients and e4 is the
error term
To investigate the effect of
demographic factors on the
relationship between community
factors and adoption of mobile
financial services by poor in Kenya
H2A: Structural
Equation
Modelling
ϸ4=α4+β47ϸ7+e4
where ϸ7= ϸ2ϸ5
-Adoption (ϸ 4) is a function
of the product of community
factors (ϸ2) and
demographic factors (ϸ5).
α4 and β4 are regression
coefficients and e4 is the
error term
To investigate the effect of
demographic factors on the
relationship between cultural
factors and adoption of mobile
financial services by the poor in
Kenya.
H2B: Structural
Equation
Modelling
ϸ4=α4+β48ϸ8+e4
where ϸ8= ϸ3ϸ5
-Adoption (ϸ 4) is a function
of the product of cultural
factors (ϸ3) and
demographic factors (ϸ5).
α4 and β4 are regression
coefficients and e4 is the
error term
To investigate the relationship
between adoption and usage of
mobile financial services by the
poor in Kenya.
H3: Structural
Equation
Modelling
ϸ6=α6+β64ϸ4+e6
-Usage (ϸ6) is a function of
adoption (ϸ4). α6 and β64 are
regression coefficients and
e6 is the error term
To establish the relationship
between pro-poor factors and
usage of mobile financial services
by the poor in Kenya.
H4 Structural
Equation
Modelling
ϸ6=ϸ1+ϸ2+ϸ3+e6 -Usage (ϸ6) is a function of
pro-poor factors (ϸ1, ϸ2, ϸ3,)
and e6 is the error term
ϸ1= Contextual Factors, ϸ2= Community Factors, ϸ3= Cultural Factors, ϸ4= Adoption, ϸ5=
Demographic factors, ϸ6=Usage; Source: Research Data, 2016.
54
CHAPTER FOUR: DATA ANALYSIS AND FINDINGS
4.1 Introduction
The main objective of this chapter is to present the statistical analysis results of the
measurement model, interpretations, and findings. The presentation of the analysis
conducted to test the conceptual model and present its results. The chapter provides the
information on the response rates, respondents‟ demographics and respondents‟
characteristics, data screening procedure, test results for non-response bias and
measurement differences, hypothesis testing and model estimation using PLS regression.
4.2 Study Response Rate
The target population was 400 poor people living in the sampled slums of Nairobi a total
of 398 questionnaires was returned resulting in a response rate of 99.5%. On preliminary
analysis, 13 questionnaires had some sections of the questionnaire not responded to thus
consider as incomplete and removed from the analysis. There were 5 questionnaires that
had a total of 11 missing responses which could be as a result of the rush to fill in all the
questions or intentionally skipped by the respondents. The missing response was replaced
using the sub-group mean value replacement function (Ringle, Wende & Will, 2005;
Hair, Hult, Ringle & Sarstedt, 2013).
On removing the 13 incomplete cases, 385 questionnaires were used and the adjusted
response rate of 96.25%, which was a high response rate compared to Micheni, Lule, and
Muketha (2013) who had a response rate of 83.3%. This was a result of researcher
moving along with the research assistant from one slum to another to request the
respondents to spend a few minutes to respond to the questionnaire, the introductory
55
letter from the university significantly helped in convincing some respondents who
appeared suspicious of our movement in the slums.
4.3 Demographic Data
This study seeks to understand the adoption of mobile financial services among the poor,
the results show that out of the 385 respondents, 54% are male and 46% are female this
finding shows that this study was not gender biased, it is reflective of the population
numbers in the country. The age of the respondents also reveals an interesting pattern
43.2% are under 25 years, 52% between 26-40 years and 5% above 40 years. The finding
that the majority of the respondents who are randomly sampled are young confirms the
census numbers that the young population in Kenya is relatively high and since this study
was done during the day most of the elderly were out of the slum working.
The study found that 20.3% of the respondents have their highest level of education as
primary school level, 45.5% secondary school level, 26.8% as the college Diploma level
and only 7.5% as the University Degree level, revealing that 65.8% have the basic
education of secondary and below while only 34.3 have accessed higher education. The
study further revealed that 90.6% own a mobile phone while only 9.4% do not own a
mobile phone; this confirms the mobile penetration number of 87.7% given by
Communication Authority. The inability to own a phone does not mean that one does not
have access as the study shows that 23.9% are sharing their phone with other people, the
study further shows that of the 23.9% who are sharing their phone, 18.7% (which is
78.2% of the 23.9%) are sharing with one or two other people indicating that a mobile
phone is a private and personal device.
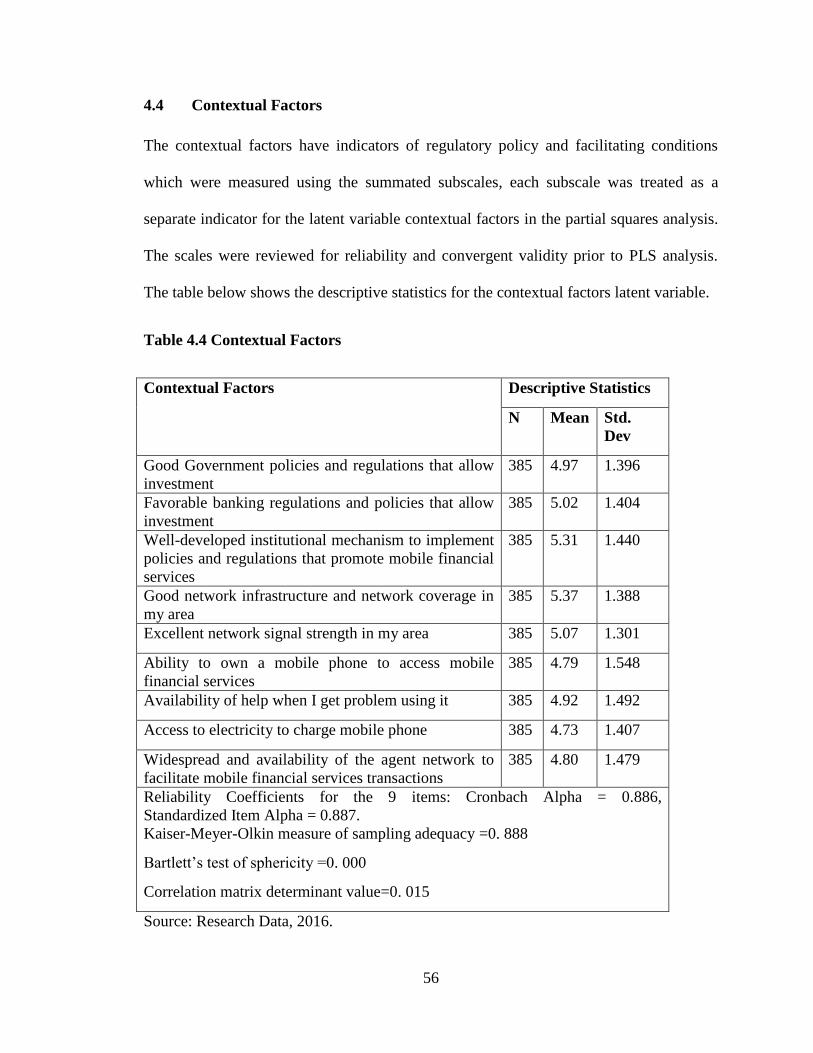
56
4.4 Contextual Factors
The contextual factors have indicators of regulatory policy and facilitating conditions
which were measured using the summated subscales, each subscale was treated as a
separate indicator for the latent variable contextual factors in the partial squares analysis.
The scales were reviewed for reliability and convergent validity prior to PLS analysis.
The table below shows the descriptive statistics for the contextual factors latent variable.
Table 4.4 Contextual Factors
Contextual Factors Descriptive Statistics
N Mean Std.
Dev
Good Government policies and regulations that allow
investment
385 4.97 1.396
Favorable banking regulations and policies that allow
investment
385 5.02 1.404
Well-developed institutional mechanism to implement
policies and regulations that promote mobile financial
services
385 5.31 1.440
Good network infrastructure and network coverage in
my area
385 5.37 1.388
Excellent network signal strength in my area 385 5.07 1.301
Ability to own a mobile phone to access mobile
financial services
385 4.79 1.548
Availability of help when I get problem using it 385 4.92 1.492
Access to electricity to charge mobile phone 385 4.73 1.407
Widespread and availability of the agent network to
facilitate mobile financial services transactions
385 4.80 1.479
Reliability Coefficients for the 9 items: Cronbach Alpha = 0.886,
Standardized Item Alpha = 0.887.
Kaiser-Meyer-Olkin measure of sampling adequacy =0. 888
Bartlett‟s test of sphericity =0. 000
Correlation matrix determinant value=0. 015
Source: Research Data, 2016.
57
The regulatory policies consisted of 4 statements in the questionnaires that were related
to the level of agreement with the statements on the regulatory policies that enable the
adoption of mobile financial services. Each scale was rated on a seven-point Linkert type
scale response framework ((1) = Strongly Disagree to (7) = Strongly Agree). The average
scale ranged from 4.97 to 5.37. This indicated that the respondents highly agree that they
were able to adopt mobile financial services due to the availability of favorable
regulatory policies.
The highest rating of 5.37 was the statement “I am able to adopt mobile financial services
due to good network infrastructure and network coverage in my area” (SD=1. 388,
N=385). The statement with the lowest mean rating of 4.97 is “I am able to adopt mobile
financial services due to good government policies and regulations that allow
investments” (SD=1. 396, N=385). This shows that respondents agree that there exist
good network infrastructure and network coverage in the country due to the completion
between the mobile telephone operators. The respondents further appreciate that there
exist sufficient regulatory policies that allow mobile financial service provision, but the
lower mean rating could be attributed to the expectation that there is room for improving
the existing regulatory policies.
The facilitating condition scale consisted of five items, the statement in the questionnaire
relates to the ability to adopt due to the availability of the facilitating condition that
enables the adoption of mobile financial services. Each scale was rated on a seven-point
Linkert type scale ranging from 1denoting “strongly disagree” and 7 denoting “strongly
agree”. The average rating scale ranging from 4.73 to 5.07, this showed that respondents
58
believe that there are sufficient facilitating conditions that allow adoption of mobile
financial services in Kenya.
The highest mean rating of 5.07 was the statement “I am able to adopt mobile financial
services due to excellent network signal strength in my area” (SD=1. 301, N=385) and
the lowest mean rating of 4.73 was the statement “ I am able to adopt mobile financial
services due to access to electricity to charge mobile phone”. The findings for facilitating
conditions shows that the respondent experience excellent network coverage and signal
strength, but they are let down by the unavailability of electricity to charge their mobile
phones which are a typical problem in the slums.
4.4.1 Factor Analysis of the Contextual factors
Contextual factors have the indicators of regulatory policies which has three items and
facilitating conditions which has eight items has three items totaling to eleven items
which seeks to measure the adoption of mobile financial services by the poor.
Exploratory factor analysis was used to regroup and reduce the number of items to
manageable factor and categorization, principal component analysis was used to extract
factors with greater than 1 eigenvalue. Factor matrix with varimax rotation was used,
Kaiser-Meyer-Olkin test of sampling adequacy was examined to validate the factor
analysis as shown in table 4.5 below.
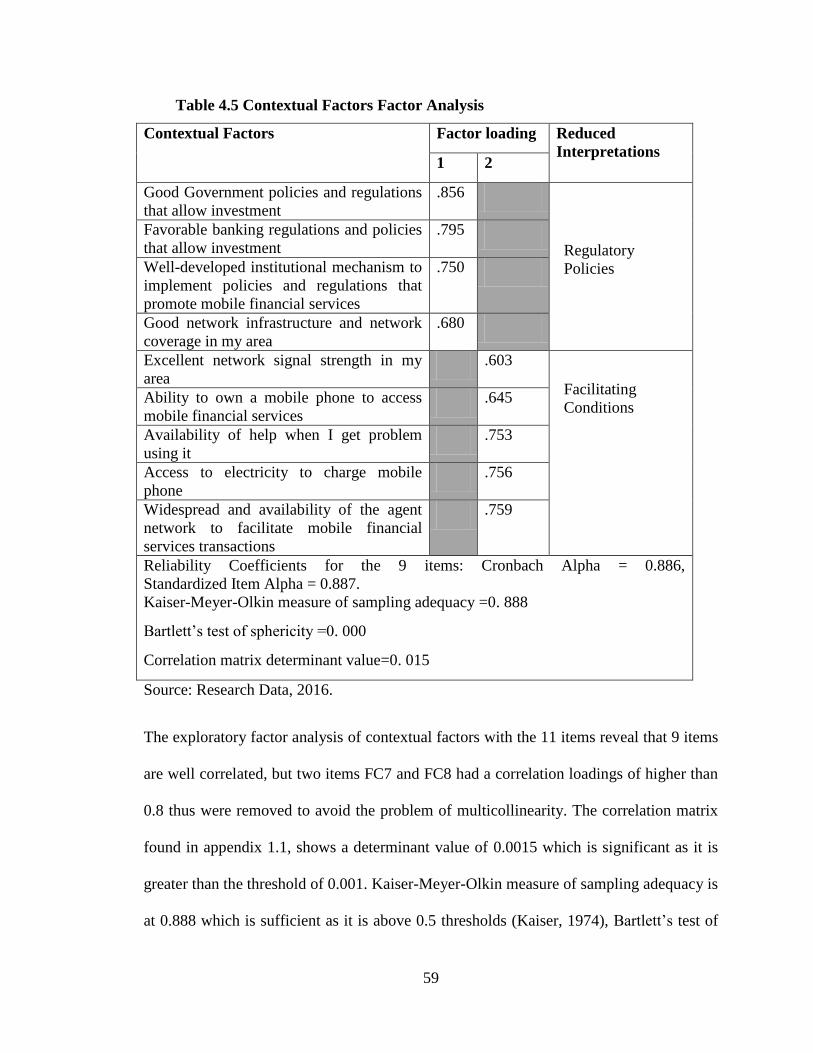
59
Table 4.5 Contextual Factors Factor Analysis
Contextual Factors Factor loading Reduced
Interpretations 1 2
Good Government policies and regulations
that allow investment
.856
Regulatory
Policies
Favorable banking regulations and policies
that allow investment
.795
Well-developed institutional mechanism to
implement policies and regulations that
promote mobile financial services
.750
Good network infrastructure and network
coverage in my area
.680
Excellent network signal strength in my
area
.603
Facilitating
Conditions Ability to own a mobile phone to access
mobile financial services
.645
Availability of help when I get problem
using it
.753
Access to electricity to charge mobile
phone
.756
Widespread and availability of the agent
network to facilitate mobile financial
services transactions
.759
Reliability Coefficients for the 9 items: Cronbach Alpha = 0.886,
Standardized Item Alpha = 0.887.
Kaiser-Meyer-Olkin measure of sampling adequacy =0. 888
Bartlett‟s test of sphericity =0. 000
Correlation matrix determinant value=0. 015
Source: Research Data, 2016.
The exploratory factor analysis of contextual factors with the 11 items reveal that 9 items
are well correlated, but two items FC7 and FC8 had a correlation loadings of higher than
0.8 thus were removed to avoid the problem of multicollinearity. The correlation matrix
found in appendix 1.1, shows a determinant value of 0.0015 which is significant as it is
greater than the threshold of 0.001. Kaiser-Meyer-Olkin measure of sampling adequacy is
at 0.888 which is sufficient as it is above 0.5 thresholds (Kaiser, 1974), Bartlett‟s test of
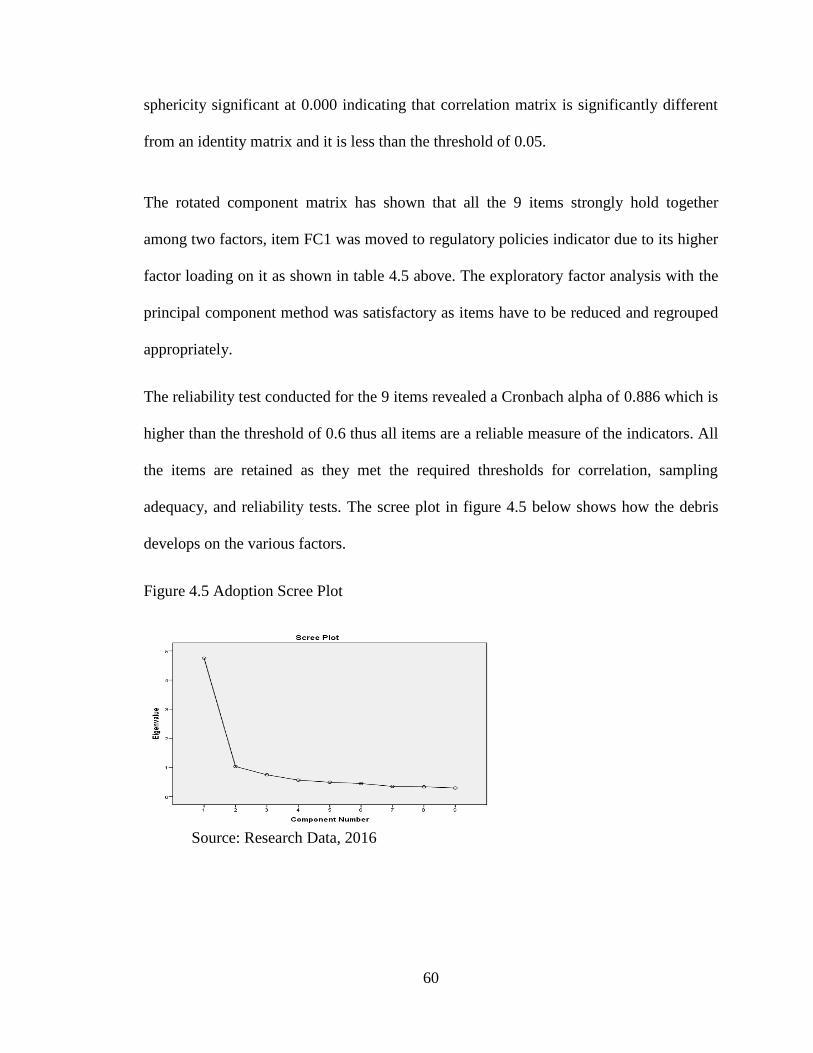
60
sphericity significant at 0.000 indicating that correlation matrix is significantly different
from an identity matrix and it is less than the threshold of 0.05.
The rotated component matrix has shown that all the 9 items strongly hold together
among two factors, item FC1 was moved to regulatory policies indicator due to its higher
factor loading on it as shown in table 4.5 above. The exploratory factor analysis with the
principal component method was satisfactory as items have to be reduced and regrouped
appropriately.
The reliability test conducted for the 9 items revealed a Cronbach alpha of 0.886 which is
higher than the threshold of 0.6 thus all items are a reliable measure of the indicators. All
the items are retained as they met the required thresholds for correlation, sampling
adequacy, and reliability tests. The scree plot in figure 4.5 below shows how the debris
develops on the various factors.
Figure 4.5 Adoption Scree Plot
Source: Research Data, 2016
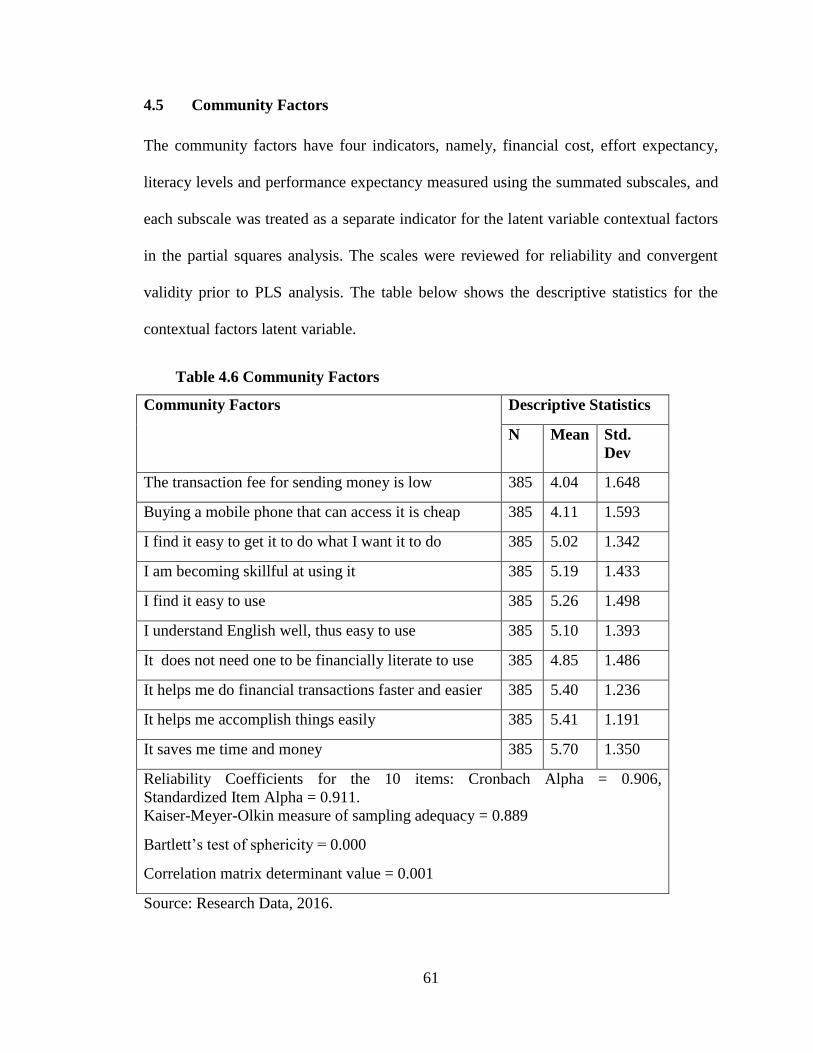
61
4.5 Community Factors
The community factors have four indicators, namely, financial cost, effort expectancy,
literacy levels and performance expectancy measured using the summated subscales, and
each subscale was treated as a separate indicator for the latent variable contextual factors
in the partial squares analysis. The scales were reviewed for reliability and convergent
validity prior to PLS analysis. The table below shows the descriptive statistics for the
contextual factors latent variable.
Table 4.6 Community Factors
Community Factors Descriptive Statistics
N Mean Std.
Dev
The transaction fee for sending money is low 385 4.04 1.648
Buying a mobile phone that can access it is cheap 385 4.11 1.593
I find it easy to get it to do what I want it to do 385 5.02 1.342
I am becoming skillful at using it 385 5.19 1.433
I find it easy to use 385 5.26 1.498
I understand English well, thus easy to use 385 5.10 1.393
It does not need one to be financially literate to use 385 4.85 1.486
It helps me do financial transactions faster and easier 385 5.40 1.236
It helps me accomplish things easily 385 5.41 1.191
It saves me time and money 385 5.70 1.350
Reliability Coefficients for the 10 items: Cronbach Alpha = 0.906,
Standardized Item Alpha = 0.911.
Kaiser-Meyer-Olkin measure of sampling adequacy = 0.889
Bartlett‟s test of sphericity = 0.000
Correlation matrix determinant value = 0.001
Source: Research Data, 2016.
62
The financial cost indicator consisted of two statements in the questionnaires that were
related to the level of agreement with the statements on the financial cost incurred to
adopt mobile financial services. Each scale was rated on a seven-point Linkert type scale
response framework 1 denoting strongly disagree to 7 denoting strongly agree. The
average scale ranged from 4.04 to 4.11. This indicated that the respondents agree that
they were able to adopt mobile financial services despite the financial cost involved.
The highest rating of 4.25 was the statement “I am able to adopt mobile financial services
because buying a mobile phone that can access it is cheap” (SD = 1.593, N = 385). The
statement with the lowest mean rating of 4.04 was the statement “I am able to adopt
mobile financial services because the transaction fee for sending money is low” (SD =
1.648, N = 385). This shows that respondents agree that buying a mobile phone is cheap
thus increasing access to mobile financial services, thus increased access enables
adoption and usage of mobile financial services. The respondents further reject the
statement that the transaction fees charged for performing a financial transaction are low,
thus indicating their concern with the financial cost.
The effort expectancy scale consisted of three items, the statement in the questionnaire
relate to the degree of ease associated with mobile financial services adoption and usage.
Each scale was rated on a seven-point Linkert type scale ranging from 1denoting
“strongly disagree” and 7 denoting “strongly agree”. The average rating scale ranging
from 5.02 to 5.26, this showed that respondents believe that there is a high degree of ease
associated with the adoption and use of mobile financial services.
63
The highest mean rating of 5.26 was the statement “I am able to adopt mobile financial
services because I find it easy to use” (SD =1. 498, N = 385) and the lowest mean rating
of 5.02 was the statement “I am able to adopt mobile financial services because it is easy
to get it to do what I want it to do”. The findings for effort expectancy shows that the
respondents finds it easy to use mobile financial services and are able to get it to do what
they want it to do.
The performance expectancy scale consisted of three items, the statement in the
questionnaire relate to the degree to which individuals believe that adopting and using
mobile financial services will help them attain better performance outcome or results.
Each scale was rated on a seven-point Linkert type scale ranging from 1denoting
“strongly disagree” and 7 denoting “strongly agree”. The average rating scale ranging
from 5.40 to 5.70, this showed that respondents believe that they are able to perform
better by adopting and using mobile financial services.
The highest mean rating of 5.73 was the statement “I am able to adopt mobile financial
services because it saves me money and time” (SD = 1.436, N = 385) and the lowest
mean rating of 5.40 was the statement “I am able to adopt mobile financial services
because it helps me do financial transactions easier and faster”. The findings for
performance expectancy shows that the respondent find it easier and faster to do financial
transactions as mobile financial services as significantly easier and faster to any other
legacy methods of doing a financial transaction and this leads to time and money savings
for the users of mobile financial services.
64
The literacy level scale consisted of two items, the statement in the questionnaire relate to
the literacy levels of the respondents and its influence on adoption and usage of mobile
financial services. Each scale was rated on a seven-point Linkert type scale ranging from
1denoting “strongly disagree” and 7 denoting “strongly agree”. The average rating scale
ranging from 4.85 to 5.10, this showed that respondents have medium to high levels of
literacy, which enables them to adopt and use mobile financial services.
The highest mean rating of 5.10 was the statement “I am able to adopt mobile financial
services because I understand English well thus easy to use it” (SD = 1.393, N = 385) and
the lowest mean rating of 4.85 was the statement “I am able to adopt mobile financial
services because it does not need one to be financial literate to us it”. The findings for
literacy levels indicate that the respondents have a sufficient level of English language
literacy to be able to understand the mobile financial service instructions and how to use
guides and it does not require one to be financially literate. This can be confirmed from
the reported level of education where 65.7% have primary or secondary school level of
education which is enough literacy to use mobile financial services.
4.5.1 Factor Analysis of the Community Factors
Community factors have a financial cost, effort expectancy, literacy levels and
performance expectancy which had a total of 20 items which seeks to measure the
adoption of mobile financial services by the poor. Exploratory factor analysis was used to
regroup and reduce the number of items to manageable factor and categorization,
principal component analysis was used to extract factors with greater than 1 eigenvalue.
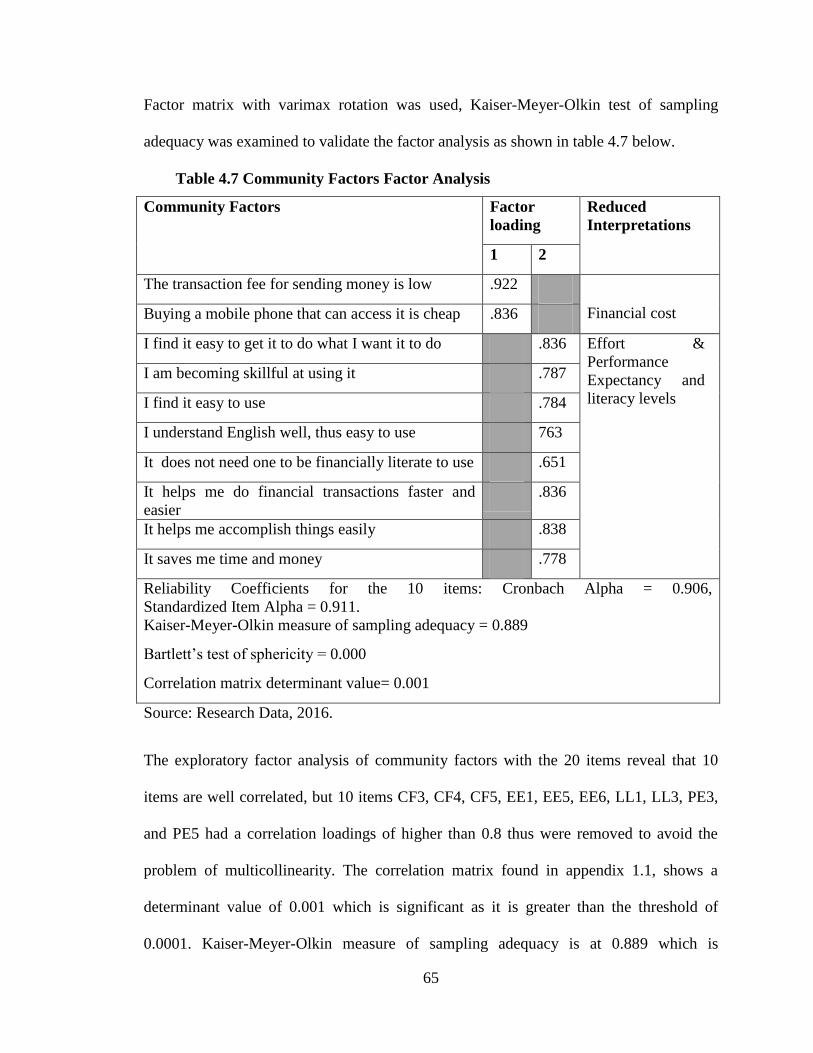
65
Factor matrix with varimax rotation was used, Kaiser-Meyer-Olkin test of sampling
adequacy was examined to validate the factor analysis as shown in table 4.7 below.
Table 4.7 Community Factors Factor Analysis
Community Factors Factor
loading
Reduced
Interpretations
1 2
The transaction fee for sending money is low .922
Financial cost Buying a mobile phone that can access it is cheap .836
I find it easy to get it to do what I want it to do .836 Effort &
Performance
Expectancy and
literacy levels
I am becoming skillful at using it .787
I find it easy to use .784
I understand English well, thus easy to use 763
It does not need one to be financially literate to use .651
It helps me do financial transactions faster and
easier
.836
It helps me accomplish things easily .838
It saves me time and money .778
Reliability Coefficients for the 10 items: Cronbach Alpha = 0.906,
Standardized Item Alpha = 0.911.
Kaiser-Meyer-Olkin measure of sampling adequacy = 0.889
Bartlett‟s test of sphericity = 0.000
Correlation matrix determinant value= 0.001
Source: Research Data, 2016.
The exploratory factor analysis of community factors with the 20 items reveal that 10
items are well correlated, but 10 items CF3, CF4, CF5, EE1, EE5, EE6, LL1, LL3, PE3,
and PE5 had a correlation loadings of higher than 0.8 thus were removed to avoid the
problem of multicollinearity. The correlation matrix found in appendix 1.1, shows a
determinant value of 0.001 which is significant as it is greater than the threshold of
0.0001. Kaiser-Meyer-Olkin measure of sampling adequacy is at 0.889 which is
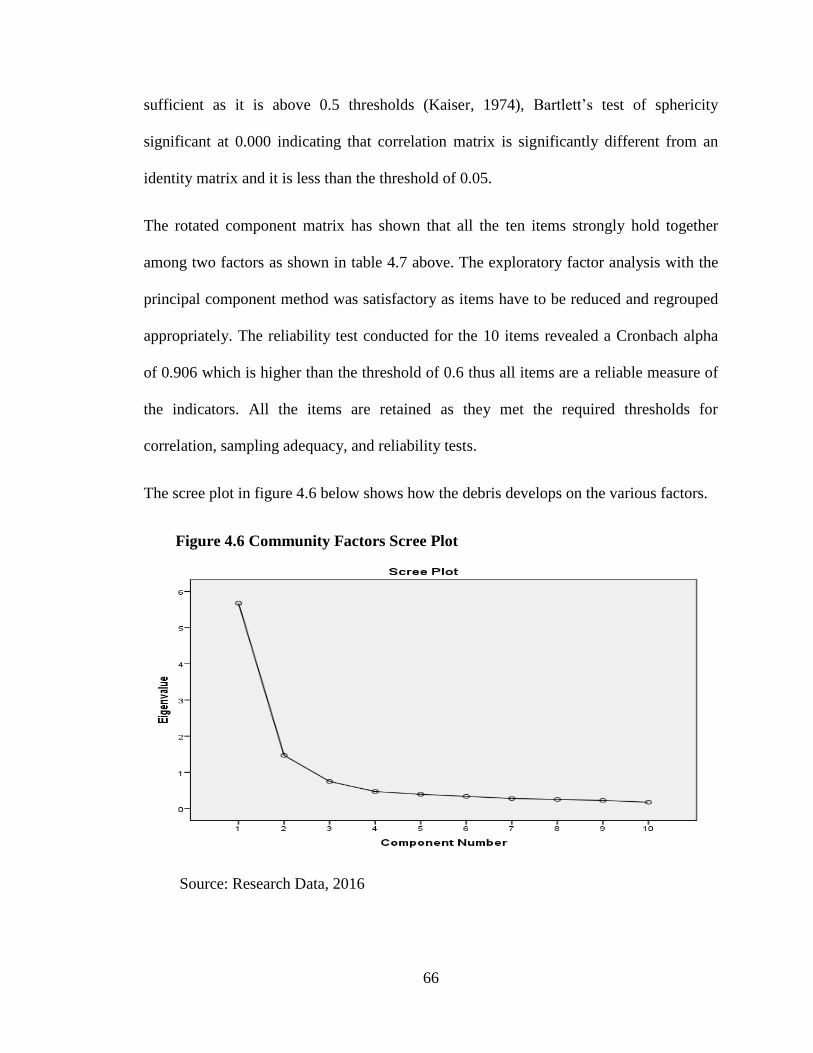
66
sufficient as it is above 0.5 thresholds (Kaiser, 1974), Bartlett‟s test of sphericity
significant at 0.000 indicating that correlation matrix is significantly different from an
identity matrix and it is less than the threshold of 0.05.
The rotated component matrix has shown that all the ten items strongly hold together
among two factors as shown in table 4.7 above. The exploratory factor analysis with the
principal component method was satisfactory as items have to be reduced and regrouped
appropriately. The reliability test conducted for the 10 items revealed a Cronbach alpha
of 0.906 which is higher than the threshold of 0.6 thus all items are a reliable measure of
the indicators. All the items are retained as they met the required thresholds for
correlation, sampling adequacy, and reliability tests.
The scree plot in figure 4.6 below shows how the debris develops on the various factors.
Figure 4.6 Community Factors Scree Plot
Source: Research Data, 2016
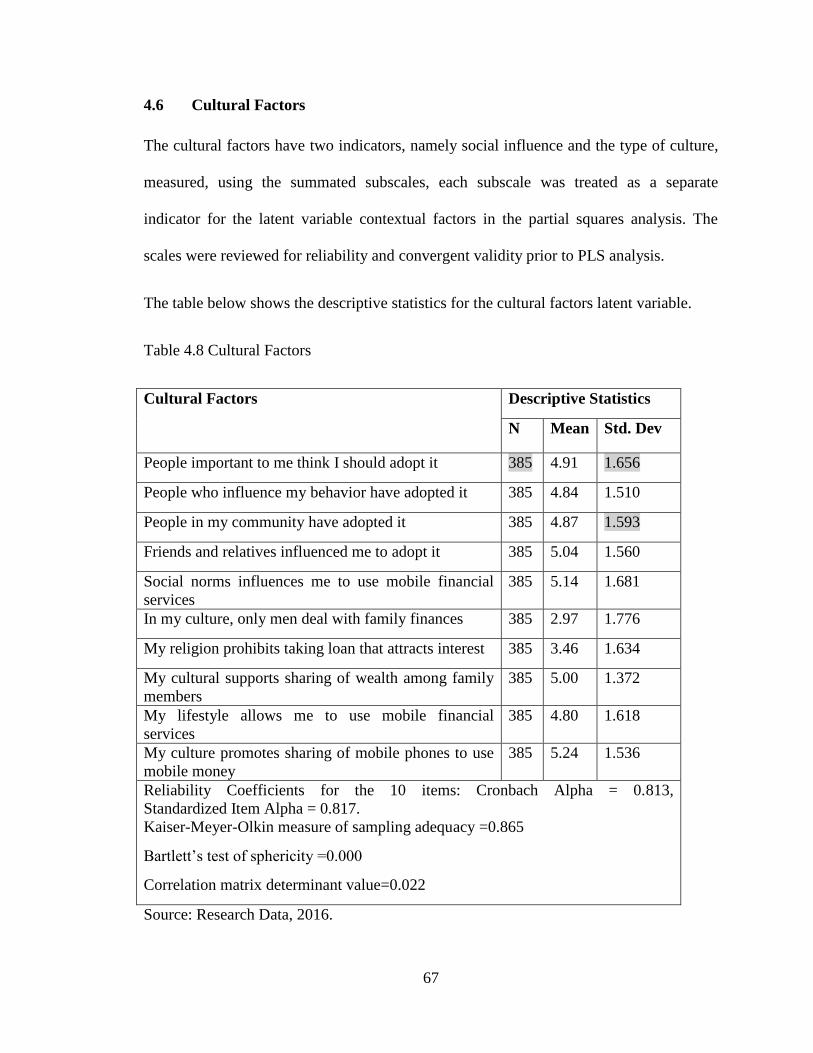
67
4.6 Cultural Factors
The cultural factors have two indicators, namely social influence and the type of culture,
measured, using the summated subscales, each subscale was treated as a separate
indicator for the latent variable contextual factors in the partial squares analysis. The
scales were reviewed for reliability and convergent validity prior to PLS analysis.
The table below shows the descriptive statistics for the cultural factors latent variable.
Table 4.8 Cultural Factors
Cultural Factors Descriptive Statistics
N Mean Std. Dev
People important to me think I should adopt it 385 4.91 1.656
People who influence my behavior have adopted it 385 4.84 1.510
People in my community have adopted it 385 4.87 1.593
Friends and relatives influenced me to adopt it 385 5.04 1.560
Social norms influences me to use mobile financial
services
385 5.14 1.681
In my culture, only men deal with family finances 385 2.97 1.776
My religion prohibits taking loan that attracts interest 385 3.46 1.634
My cultural supports sharing of wealth among family
members
385 5.00 1.372
My lifestyle allows me to use mobile financial
services
385 4.80 1.618
My culture promotes sharing of mobile phones to use
mobile money
385 5.24 1.536
Reliability Coefficients for the 10 items: Cronbach Alpha = 0.813,
Standardized Item Alpha = 0.817.
Kaiser-Meyer-Olkin measure of sampling adequacy =0.865
Bartlett‟s test of sphericity =0.000
Correlation matrix determinant value=0.022
Source: Research Data, 2016.
68
The social influence indicator consisted of five statements in the questionnaires that were
related to the level of agreement with the statements on the respondent‟s ability to adopt
mobile financial services as a result of social influence. Each scale was rated on a seven-
point Linkert type scale response framework 1 denoting strongly disagree to 7 denoting
strongly agree. The average scale ranged from 4.84 to 5.14. These results indicate that
there is a high social influence among the respondents to adopt mobile financial services.
The highest rating of 5.14 was the statement “I am able to adopt mobile financial services
because social norms influence me to use mobile financial services” (SD=1.681, N=385).
The statement with the lowest mean rating of 4.84 was the statement “I am able to adopt
mobile financial services because people who influence my behavior have adopted it”
(SD=1.510, N=385). This result shows that there is a high social influence which is more
by the social norm which influences the poor to adopt mobile financial services.
The responses to a question requiring respondents to indicate other cultural reasons came
up with reasons such as peer influence, children influencing their parents to adopt, not
wanting to be left behind by technology advancement and sharing financial resources
with the rest of the community. The type of culture scale consisted of five items, the
statement in the questionnaire relate to the influence of a particular cultural practice on
adoption and usage of mobile financial services. Each scale was rated on a seven-point
Linkert type scale ranging from 1denoting “strongly disagree” and 7 denoting “strongly
agree”. The average rating scale ranging from 2.97 to 5.24, this showed that there is high
influence by the type of culture on the adoption and use of mobile financial services.
69
The highest mean rating of 5.24 was the statement “I am able to adopt mobile financial
services because my culture promotes sharing of mobile phones to use mobile money”
(SD=1.536, N=385) and the lowest mean rating of 2.97 was the statement “I am able to
adopt mobile financial services because in my culture it is only men who deal with
finances in the family”. The findings for the type of culture shows that culture promotes
usage of mobile financial services highly and enables access through sharing of mobile
phones, the respondents further reject the culture that only the male deal with finances in
the family. This can be confirmed by the existence of women entrepreneurs, the existence
of small Sacco or the Mary-go-round contributions among the women where one woman
in the group receives a lump sum amount contributed by the rest of the group members
on a rotational basis.
4.6.1 Factor Analysis of the Cultural Factors
Cultural factors have social influence and type of culture indicators which had a total of
10 items which seeks to measure the adoption of mobile financial services by the poor.
Exploratory factor analysis was used to regroup and reduce the number of items to
manageable factor and categorization, principal component analysis was used to extract
factors with greater than 1 eigenvalue. Factor matrix with varimax rotation was used,
Kaiser-Meyer-Olkin test of sampling adequacy was examined to validate the factor
analysis as shown in table 4.9 below.
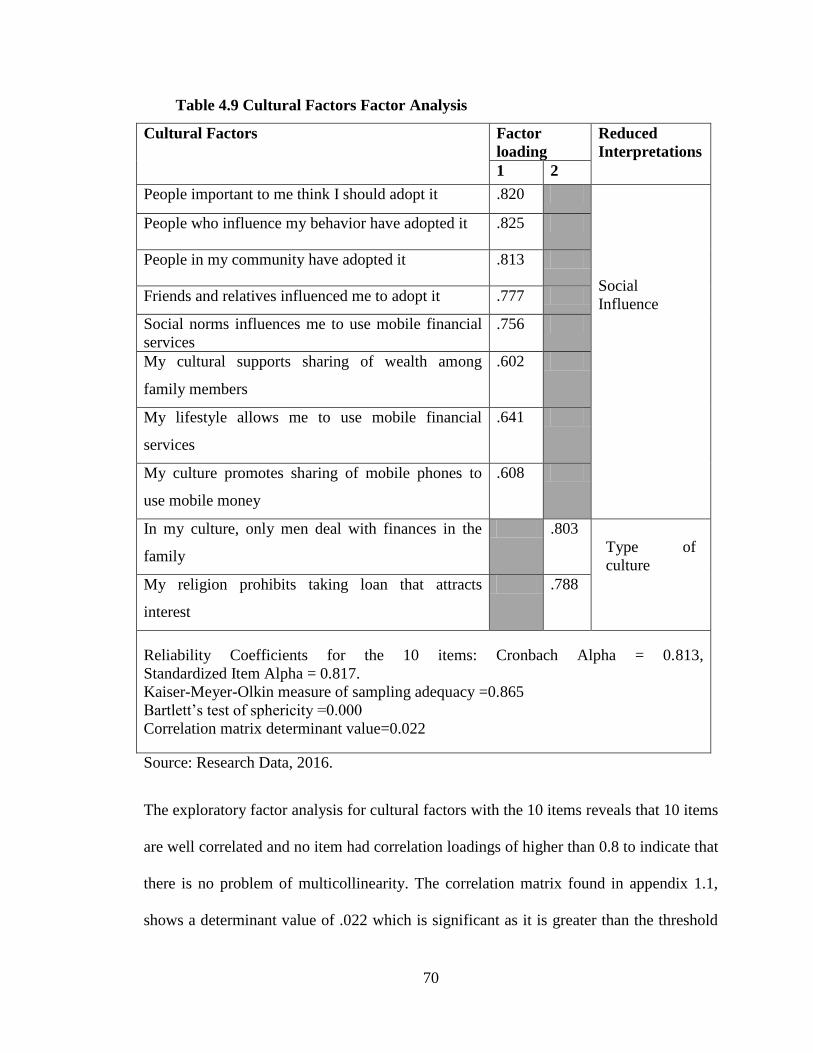
70
Table 4.9 Cultural Factors Factor Analysis
Cultural Factors Factor
loading
Reduced
Interpretations
1 2
People important to me think I should adopt it .820
Social
Influence
People who influence my behavior have adopted it .825
People in my community have adopted it .813
Friends and relatives influenced me to adopt it .777
Social norms influences me to use mobile financial
services
.756
My cultural supports sharing of wealth among
family members
.602
My lifestyle allows me to use mobile financial
services
.641
My culture promotes sharing of mobile phones to
use mobile money
.608
In my culture, only men deal with finances in the
family
.803
Type of
culture
My religion prohibits taking loan that attracts
interest
.788
Reliability Coefficients for the 10 items: Cronbach Alpha = 0.813,
Standardized Item Alpha = 0.817.
Kaiser-Meyer-Olkin measure of sampling adequacy =0.865
Bartlett‟s test of sphericity =0.000
Correlation matrix determinant value=0.022
Source: Research Data, 2016.
The exploratory factor analysis for cultural factors with the 10 items reveals that 10 items
are well correlated and no item had correlation loadings of higher than 0.8 to indicate that
there is no problem of multicollinearity. The correlation matrix found in appendix 1.1,
shows a determinant value of .022 which is significant as it is greater than the threshold
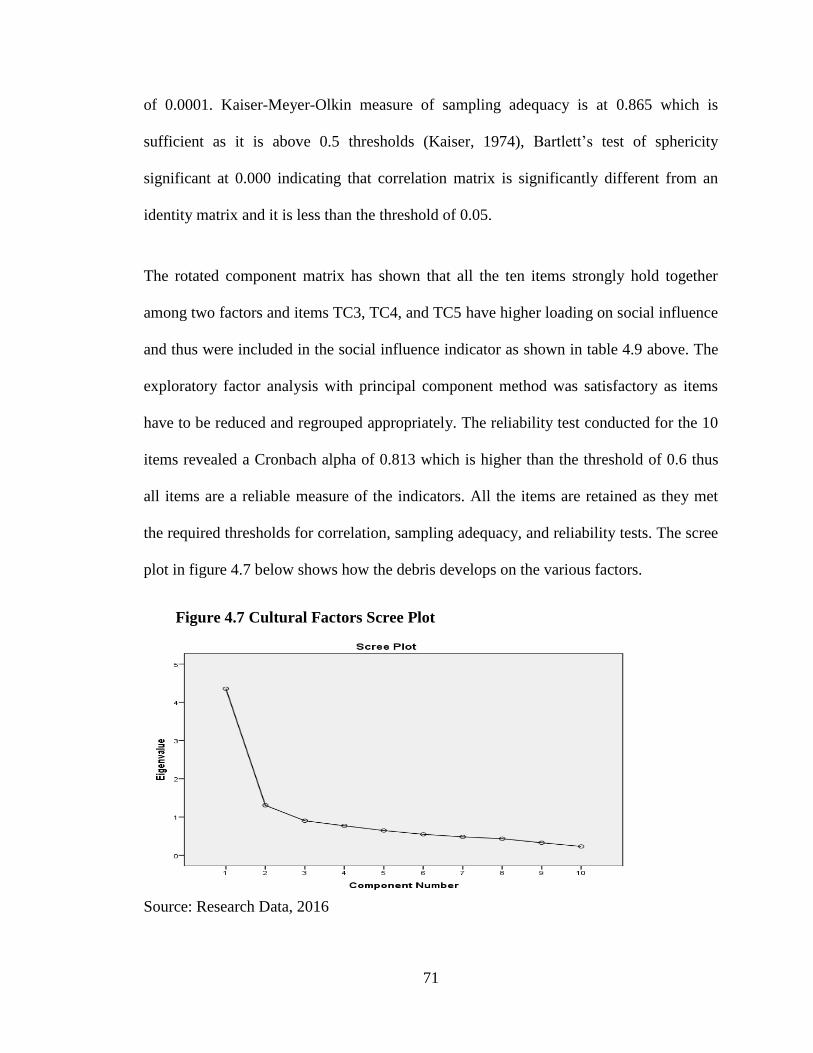
71
of 0.0001. Kaiser-Meyer-Olkin measure of sampling adequacy is at 0.865 which is
sufficient as it is above 0.5 thresholds (Kaiser, 1974), Bartlett‟s test of sphericity
significant at 0.000 indicating that correlation matrix is significantly different from an
identity matrix and it is less than the threshold of 0.05.
The rotated component matrix has shown that all the ten items strongly hold together
among two factors and items TC3, TC4, and TC5 have higher loading on social influence
and thus were included in the social influence indicator as shown in table 4.9 above. The
exploratory factor analysis with principal component method was satisfactory as items
have to be reduced and regrouped appropriately. The reliability test conducted for the 10
items revealed a Cronbach alpha of 0.813 which is higher than the threshold of 0.6 thus
all items are a reliable measure of the indicators. All the items are retained as they met
the required thresholds for correlation, sampling adequacy, and reliability tests. The scree
plot in figure 4.7 below shows how the debris develops on the various factors.
Figure 4.7 Cultural Factors Scree Plot
Source: Research Data, 2016
72
4.7 Adoption of Mobile Financial Services
The study results reveal high levels of adoption of mobile financial services, 87% have
adopted mobile money services and 67.3% have adopted mobile banking. Only 6.2%
have adopted internet banking, this is explained by the lack of cyber cafes to access the
internet in the slums.
Mobile phones have significantly enabled the poor to access and adopt mobile financial
services, this is evident from the results as only 60.8% have actual bank accounts with the
banks meaning that out of the 87% who have adopted mobile money 26.2% do not have a
bank account thus dependent entirely on mobile financial services as a means of financial
inclusion.
The adoption construct was measured using the summated subscales of behavioral
intention and usage intention, each subscale was treated as a separate indicator for the
latent variable adoption in the partial squares analysis. The scales were reviewed for
reliability and convergent validity prior to PLS analysis.
The table below shows the descriptive statistics for the adoption latent variable.
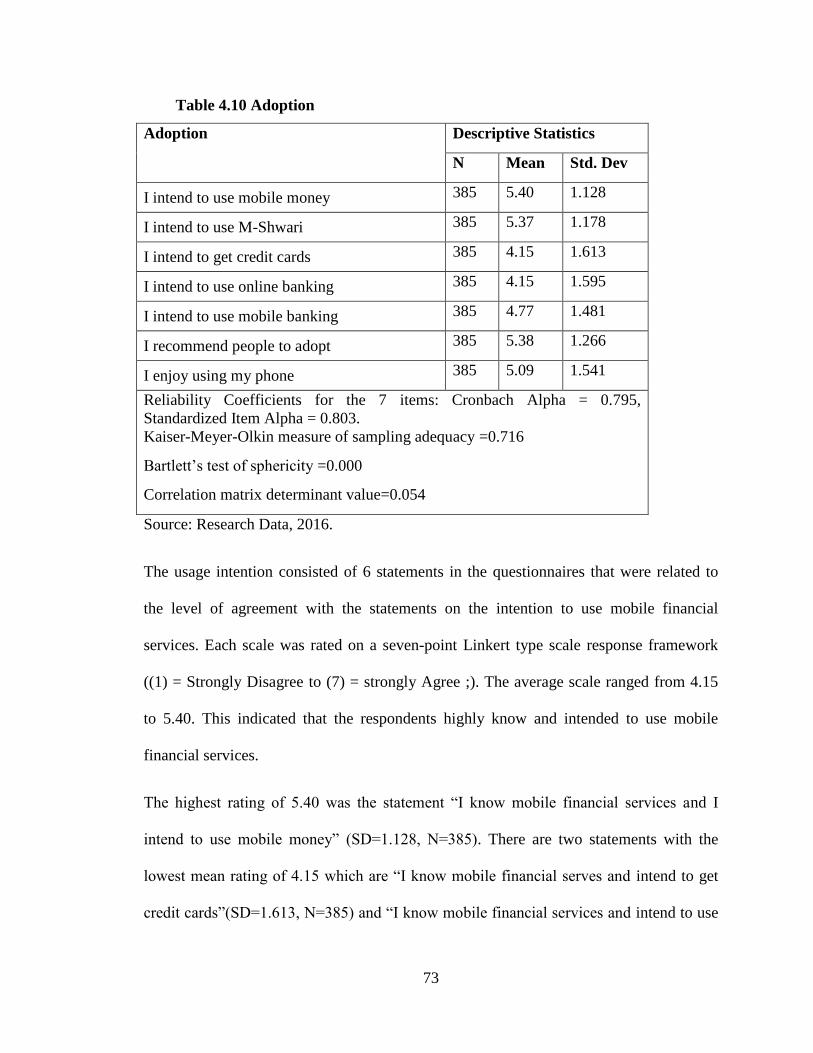
73
Table 4.10 Adoption
Adoption Descriptive Statistics
N Mean Std. Dev
I intend to use mobile money 385 5.40 1.128
I intend to use M-Shwari 385 5.37 1.178
I intend to get credit cards 385 4.15 1.613
I intend to use online banking 385 4.15 1.595
I intend to use mobile banking 385 4.77 1.481
I recommend people to adopt 385 5.38 1.266
I enjoy using my phone 385 5.09 1.541
Reliability Coefficients for the 7 items: Cronbach Alpha = 0.795,
Standardized Item Alpha = 0.803.
Kaiser-Meyer-Olkin measure of sampling adequacy =0.716
Bartlett‟s test of sphericity =0.000
Correlation matrix determinant value=0.054
Source: Research Data, 2016.
The usage intention consisted of 6 statements in the questionnaires that were related to
the level of agreement with the statements on the intention to use mobile financial
services. Each scale was rated on a seven-point Linkert type scale response framework
((1) = Strongly Disagree to (7) = strongly Agree ;). The average scale ranged from 4.15
to 5.40. This indicated that the respondents highly know and intended to use mobile
financial services.
The highest rating of 5.40 was the statement “I know mobile financial services and I
intend to use mobile money” (SD=1.128, N=385). There are two statements with the
lowest mean rating of 4.15 which are “I know mobile financial serves and intend to get
credit cards”(SD=1.613, N=385) and “I know mobile financial services and intend to use
74
online banking” (SD=1.595, N=385). This shows that both credit cards and online
banking are not common among the poor people in the slums. There are limitations to
obtaining a credit card and there are very few poor people who have access to the internet
for use in online banking.
The behavioral intention scale consisted of one item, the statement in the questionnaire
relates to the behavioral intentions of the poor to adopt mobile financial services. Each
scale was rated on a seven-point Linkert type scale ranging from 1denoting “strongly
disagree” and 7 denoting “strongly agree”. The average rating scale was 5.09 this showed
that respondents believe that they have high intentions to adopt mobile financial services.
The highest mean rating of 5.09 was the statement “I know mobile financial services and
I enjoy using my phone” (SD=1.541, N=385). The findings for behavioral intention
shows that the intention to adopt mobile financial services was high as they highly
enjoyed using their phone. Since 90.6% of the respondents own a phone and the highest
mean rating imply that all those who own a phone enjoy using it thus easier to adopt
mobile financial services that are delivered using a mobile phone as 87% of the
respondents have adopted it.
4.7.1 Factor Analysis on the Adoption Indicators
Adoption has the indicators of usage intention which has six items and behavioral
intention which has three items totaling to nine items which seek to measure the adoption
of mobile financial services by the poor. Exploratory factor analysis was used to regroup
and reduce the number of items to manageable factor and categorization, principal
component analysis was used to extract factors with greater than 1 eigenvalue. Factor
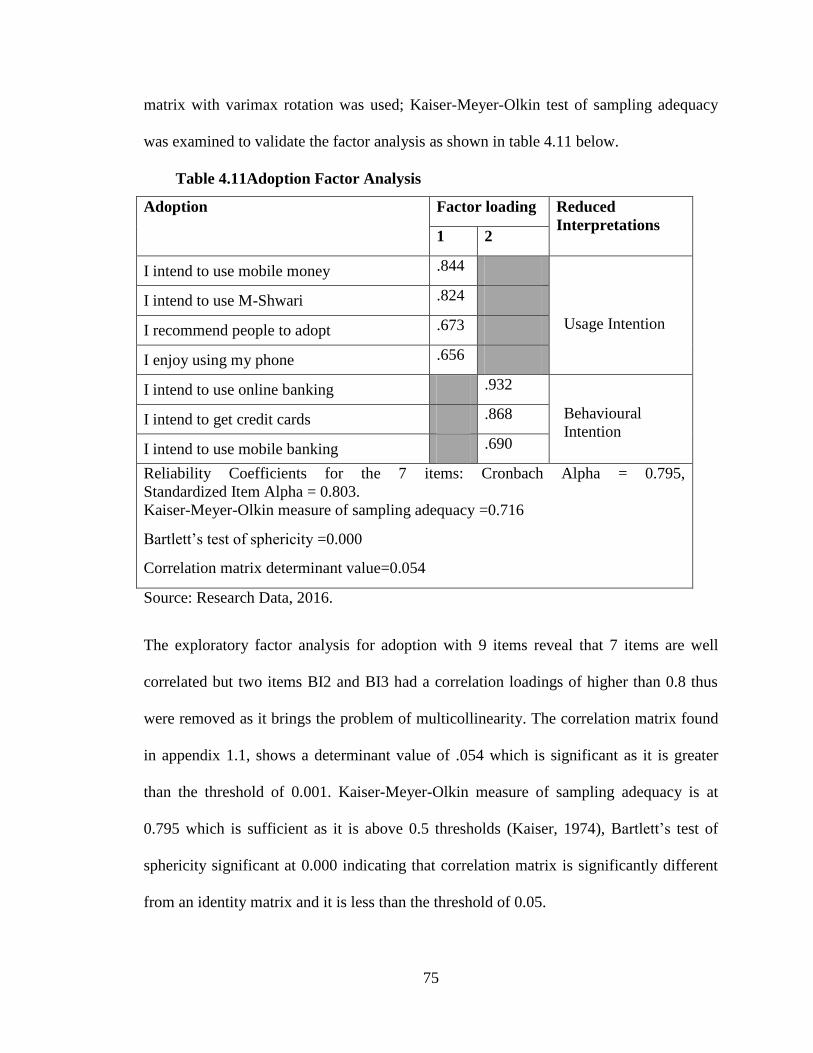
75
matrix with varimax rotation was used; Kaiser-Meyer-Olkin test of sampling adequacy
was examined to validate the factor analysis as shown in table 4.11 below.
Table 4.11Adoption Factor Analysis
Adoption Factor loading Reduced
Interpretations 1 2
I intend to use mobile money .844
Usage Intention
I intend to use M-Shwari .824
I recommend people to adopt .673
I enjoy using my phone .656
I intend to use online banking .932
Behavioural
Intention I intend to get credit cards .868
I intend to use mobile banking .690
Reliability Coefficients for the 7 items: Cronbach Alpha = 0.795,
Standardized Item Alpha = 0.803.
Kaiser-Meyer-Olkin measure of sampling adequacy =0.716
Bartlett‟s test of sphericity =0.000
Correlation matrix determinant value=0.054
Source: Research Data, 2016.
The exploratory factor analysis for adoption with 9 items reveal that 7 items are well
correlated but two items BI2 and BI3 had a correlation loadings of higher than 0.8 thus
were removed as it brings the problem of multicollinearity. The correlation matrix found
in appendix 1.1, shows a determinant value of .054 which is significant as it is greater
than the threshold of 0.001. Kaiser-Meyer-Olkin measure of sampling adequacy is at
0.795 which is sufficient as it is above 0.5 thresholds (Kaiser, 1974), Bartlett‟s test of
sphericity significant at 0.000 indicating that correlation matrix is significantly different
from an identity matrix and it is less than the threshold of 0.05.
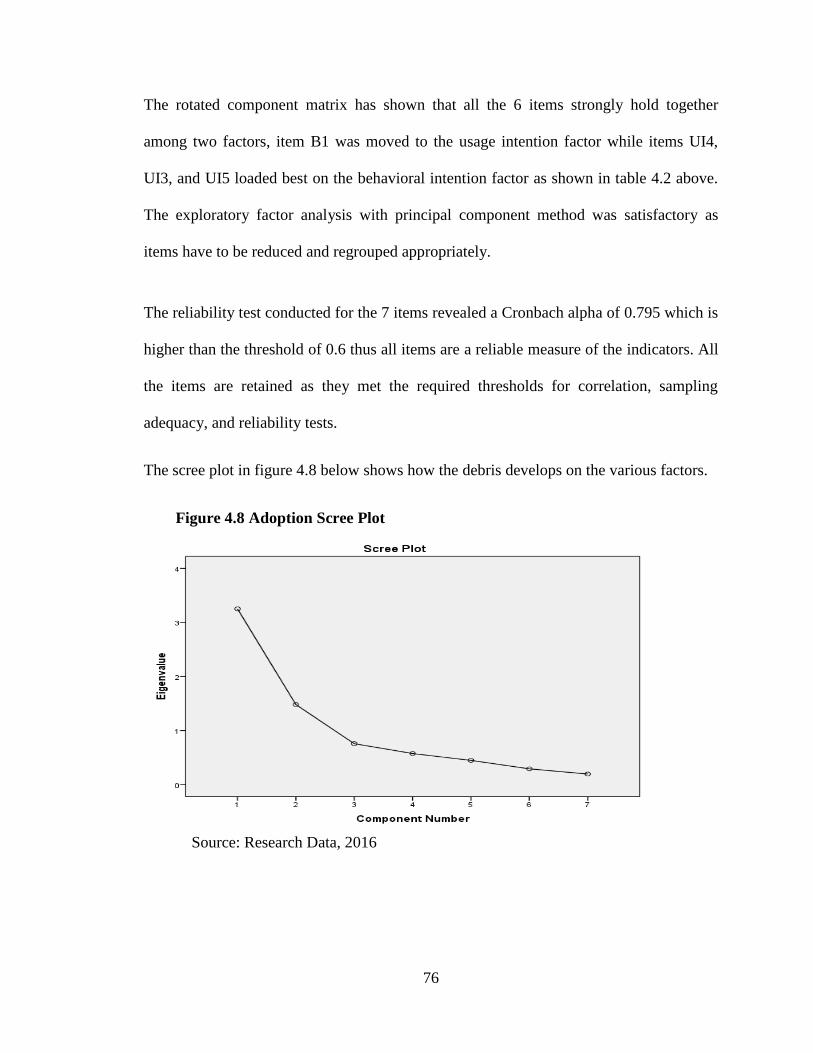
76
The rotated component matrix has shown that all the 6 items strongly hold together
among two factors, item B1 was moved to the usage intention factor while items UI4,
UI3, and UI5 loaded best on the behavioral intention factor as shown in table 4.2 above.
The exploratory factor analysis with principal component method was satisfactory as
items have to be reduced and regrouped appropriately.
The reliability test conducted for the 7 items revealed a Cronbach alpha of 0.795 which is
higher than the threshold of 0.6 thus all items are a reliable measure of the indicators. All
the items are retained as they met the required thresholds for correlation, sampling
adequacy, and reliability tests.
The scree plot in figure 4.8 below shows how the debris develops on the various factors.
Figure 4.8 Adoption Scree Plot
Source: Research Data, 2016
77
4.8 Usage of Mobile Financial Services
The study results reveal high levels of mobile financial services usage, 89.4% have used
one or another type of mobile financial services that is 32.5% use it to send money,26.5%
use it to withdraw cash,11.2% use it to buy airtime and19% use it to buy goods or
services. It is also shown that 74.8% of the respondents are mobile money users and
21.8% use it to pay for food, 8.8% use it to pay school fees, 20.8% use it to pay rent and
22.9% use it to pay for utilities such as water and electricity, this indicate that mobile
money is heavily used by the poor to meet their basic needs.
The results further show that 89.9% use these services periodically that is 34.8% use it
daily, 22.9% use it weekly and 32.2% use it monthly. Only 3.9% use credit cards and
only 11.2% use debit cards which clearly shows the low uptake of the mobile payment
services offered by financial institutions by the poor living in the slums.
This shows a high level of usage of mobile financial services by the poor people living in
the slums, this can be explained by the fact that it is not safe to carry cash in the slums
due to multiple incidents of robbery thus mobile financial services have come up to be an
alternate safe way of using and carrying money.
The slow uptake and usage of mobile payment and mobile banking services can be
explained as a result of unavailability of banks in the slums, the restrictions on obtaining
credit cards as well as the lack of the need to use such services now that mobile money
service is readily available and accessible to all who can own or borrow a mobile phone.
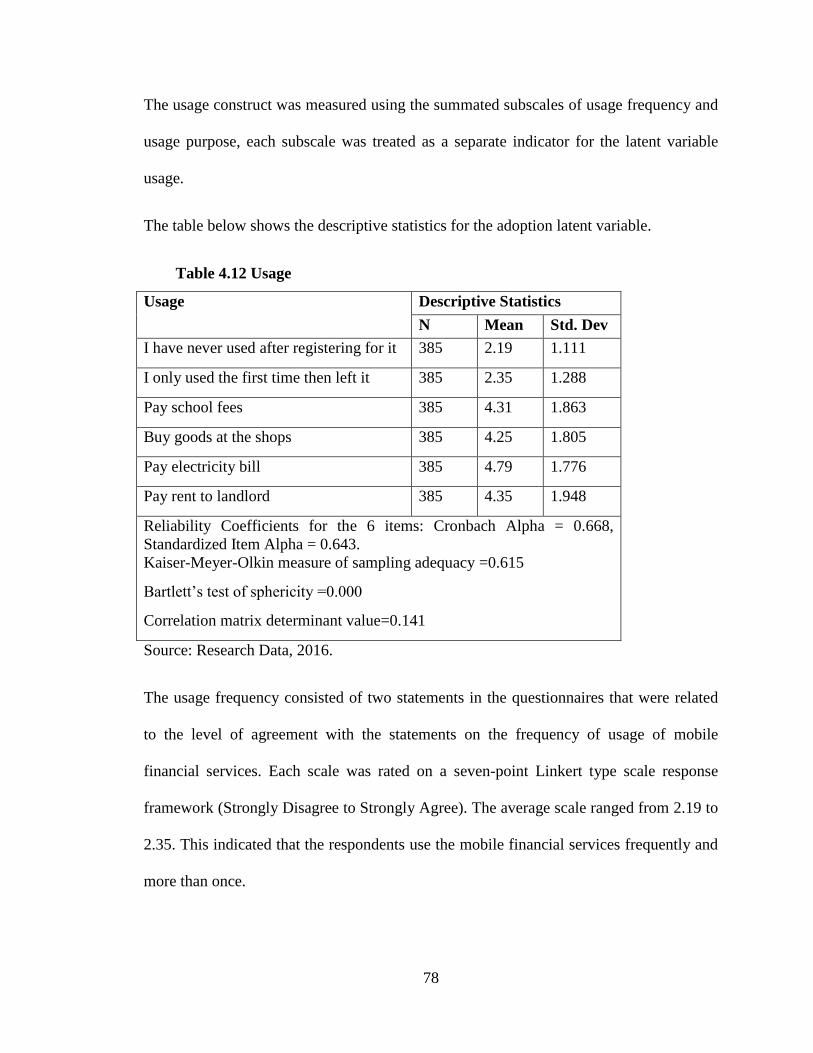
78
The usage construct was measured using the summated subscales of usage frequency and
usage purpose, each subscale was treated as a separate indicator for the latent variable
usage.
The table below shows the descriptive statistics for the adoption latent variable.
Table 4.12 Usage
Usage Descriptive Statistics
N Mean Std. Dev
I have never used after registering for it 385 2.19 1.111
I only used the first time then left it 385 2.35 1.288
Pay school fees 385 4.31 1.863
Buy goods at the shops 385 4.25 1.805
Pay electricity bill 385 4.79 1.776
Pay rent to landlord 385 4.35 1.948
Reliability Coefficients for the 6 items: Cronbach Alpha = 0.668,
Standardized Item Alpha = 0.643.
Kaiser-Meyer-Olkin measure of sampling adequacy =0.615
Bartlett‟s test of sphericity =0.000
Correlation matrix determinant value=0.141
Source: Research Data, 2016.
The usage frequency consisted of two statements in the questionnaires that were related
to the level of agreement with the statements on the frequency of usage of mobile
financial services. Each scale was rated on a seven-point Linkert type scale response
framework (Strongly Disagree to Strongly Agree). The average scale ranged from 2.19 to
2.35. This indicated that the respondents use the mobile financial services frequently and
more than once.
79
The highest rating of 2.35 was the statement “I know mobile financial services and I used
it once and left it” (SD=1.288, N=385). The statement with the lowest mean rating of
2.19 which are “I know mobile financial serves and I have never used it after registering
for it” (SD=1.111, N=385). This shows that the respondents highly use mobile financial
services more than the initial adoption or registration; the respondents also reject the
statement that they have used it once and left it implying that there is a high usage
frequency of mobile financial services by the poor. This has earlier been reported that
89.9% of the respondent use mobile money services periodically with high percentage
using it daily and weekly.
The usage purposes scale consisted of four items, the statement in the questionnaire
relates to the purpose of mobile financial services use by the poor. Each scale was rated
on a seven-point Linkert type scale ranging from 1 denoting “strongly disagree” and 7
denoting “strongly agree”. The average rating scale ranged from 4.25 to 4.79 this showed
that respondents believe that they have medium to high usage of mobile financial services
for various usage purposes. The highest mean rating of 4.79 was the statement “I use
mobile financial services to pay electricity bill” (SD=1.528, N=385) and the statement
with the lowest mean rating of 4.25 was “I use mobile financial services to buy goods at
the shop” (SD=1.805, N=385).
The findings for usage purposes shows that the poor people use mobile financial services
highly for paying electricity bill which could be explained as a result of the convenience
of paying the electricity bill and the urgency of getting back the light. Since the pre-paid
meters automatically disconnect once the units bought are depleted thus the need to pay
80
for electricity bill quickly to regain the electric power which can easily be achieved by
the use of mobile money services. It is also common that in slums the utility bills are paid
by landlords thus the use indicated by the users could be attributed to sending money to
the landlord to pay utility bills. The lowest rating for buying goods and services can be
explained by the unavailability of till numbers to the merchants who operate in the slums
and the added cost of withdrawal fees that have to be added by the buyer if the seller
accepts that the money is transferred to their telephone numbers.
4.8.1 Factor Analysis on the Usage indicators
Usage has the indicators of usage frequency which has three items and usage purpose
which has seven items totaling to ten items which seek to measure the usage of mobile
financial services by the poor. Exploratory factor analysis was used to regroup and reduce
the number of items to manageable factor and categorization, principal component
analysis with varimax rotation was used to extract factors with greater than 1 eigenvalue.
Kaiser-Meyer-Olkin test of sampling adequacy was examined to validate the factor
analysis and the rotated component matrix is shown in table 4.13 below.
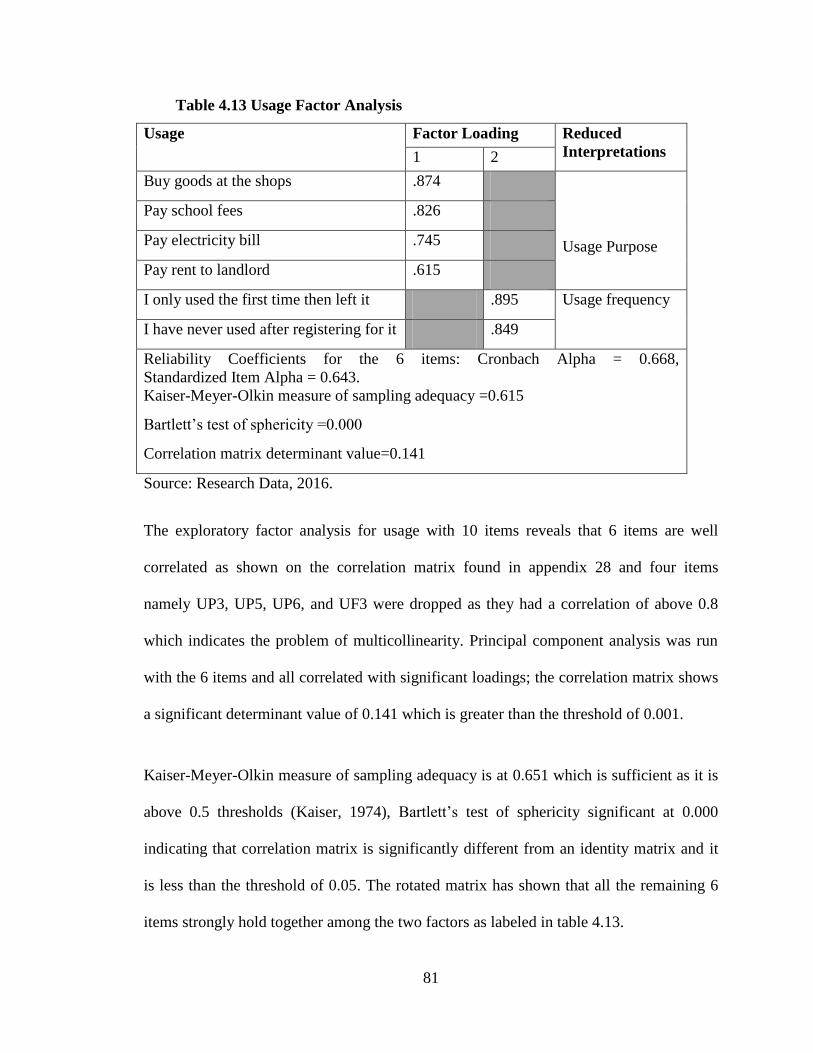
81
Table 4.13 Usage Factor Analysis
Usage Factor Loading Reduced
Interpretations 1 2
Buy goods at the shops .874
Usage Purpose
Pay school fees .826
Pay electricity bill .745
Pay rent to landlord .615
I only used the first time then left it .895 Usage frequency
I have never used after registering for it .849
Reliability Coefficients for the 6 items: Cronbach Alpha = 0.668,
Standardized Item Alpha = 0.643.
Kaiser-Meyer-Olkin measure of sampling adequacy =0.615
Bartlett‟s test of sphericity =0.000
Correlation matrix determinant value=0.141
Source: Research Data, 2016.
The exploratory factor analysis for usage with 10 items reveals that 6 items are well
correlated as shown on the correlation matrix found in appendix 28 and four items
namely UP3, UP5, UP6, and UF3 were dropped as they had a correlation of above 0.8
which indicates the problem of multicollinearity. Principal component analysis was run
with the 6 items and all correlated with significant loadings; the correlation matrix shows
a significant determinant value of 0.141 which is greater than the threshold of 0.001.
Kaiser-Meyer-Olkin measure of sampling adequacy is at 0.651 which is sufficient as it is
above 0.5 thresholds (Kaiser, 1974), Bartlett‟s test of sphericity significant at 0.000
indicating that correlation matrix is significantly different from an identity matrix and it
is less than the threshold of 0.05. The rotated matrix has shown that all the remaining 6
items strongly hold together among the two factors as labeled in table 4.13.
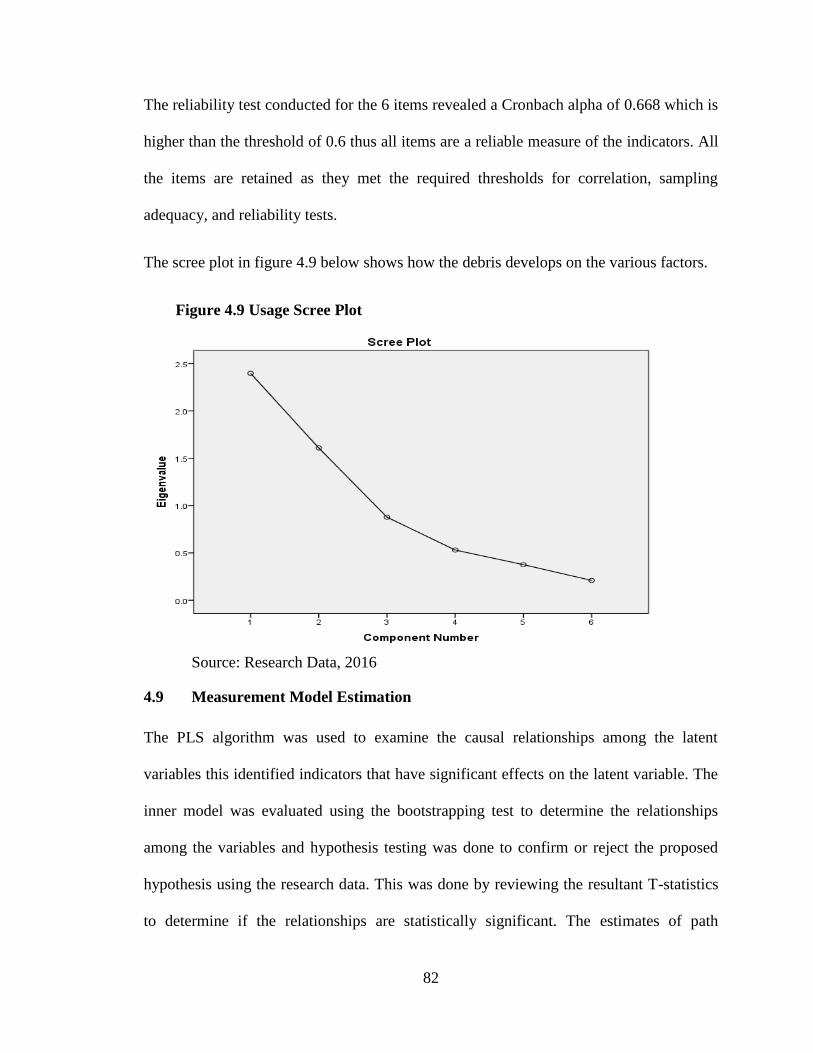
82
The reliability test conducted for the 6 items revealed a Cronbach alpha of 0.668 which is
higher than the threshold of 0.6 thus all items are a reliable measure of the indicators. All
the items are retained as they met the required thresholds for correlation, sampling
adequacy, and reliability tests.
The scree plot in figure 4.9 below shows how the debris develops on the various factors.
Figure 4.9 Usage Scree Plot
Source: Research Data, 2016
4.9 Measurement Model Estimation
The PLS algorithm was used to examine the causal relationships among the latent
variables this identified indicators that have significant effects on the latent variable. The
inner model was evaluated using the bootstrapping test to determine the relationships
among the variables and hypothesis testing was done to confirm or reject the proposed
hypothesis using the research data. This was done by reviewing the resultant T-statistics
to determine if the relationships are statistically significant. The estimates of path
83
coefficients, the T-values, significance levels for the paths and the model fit were
evaluated to confirm the causal relationships among the constructs.
SEM-PLS regression tests the predictive model using a two stage procedure which
included the initial stage of outer model evaluation to determine its reliability and
availability and the second stage is the structural model assessment to the relationships
under the investigation (Ringel et al., 2011).
The partial least square analysis was done after the reliability testing and purification of
the measurement scale. To test the relationship between constructs and determine the
predictive power of the conceptual model, partial least square analysis was used.
SmartPLS software (Ringel et al., 2005) was used. Previous use of this methodology has
been indicated in previous research and literature (Hensler et al., 2009; Hulland, 1999).
The outer model estimation was done to assess the relationship between the observable
variable and the represented theoretical construct. The structural model specification,
testing of the proposed relationship and the hypothesis ((Bryne, 2001) was done. There is
a total of 82 items representing 13 Indicators and 6 factors in the research for which
confirmatory factor analysis (CFA) was done to examine how each indicator relates to
the respective latent variable. The details on the type of constructs are shown in table
4.14 below.
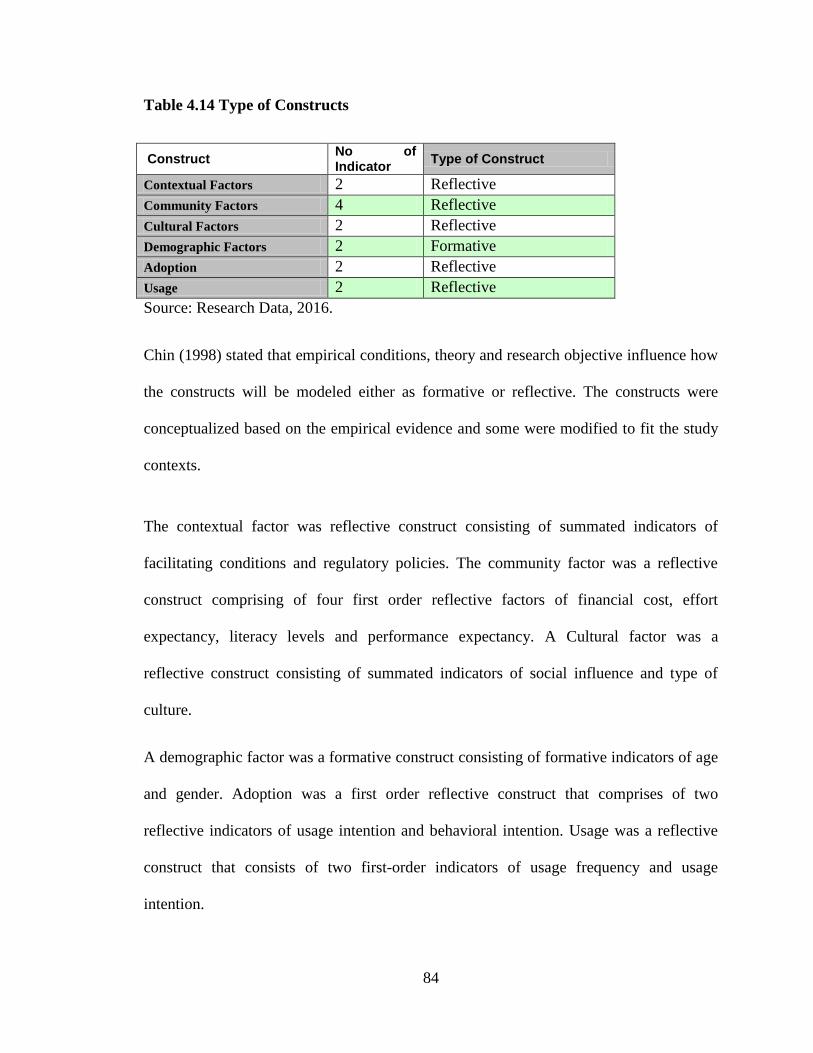
84
Table 4.14 Type of Constructs
Construct No of Indicator
Type of Construct
Contextual Factors 2 Reflective
Community Factors 4 Reflective
Cultural Factors 2 Reflective
Demographic Factors 2 Formative
Adoption 2 Reflective
Usage 2 Reflective
Source: Research Data, 2016.
Chin (1998) stated that empirical conditions, theory and research objective influence how
the constructs will be modeled either as formative or reflective. The constructs were
conceptualized based on the empirical evidence and some were modified to fit the study
contexts.
The contextual factor was reflective construct consisting of summated indicators of
facilitating conditions and regulatory policies. The community factor was a reflective
construct comprising of four first order reflective factors of financial cost, effort
expectancy, literacy levels and performance expectancy. A Cultural factor was a
reflective construct consisting of summated indicators of social influence and type of
culture.
A demographic factor was a formative construct consisting of formative indicators of age
and gender. Adoption was a first order reflective construct that comprises of two
reflective indicators of usage intention and behavioral intention. Usage was a reflective
construct that consists of two first-order indicators of usage frequency and usage
intention.
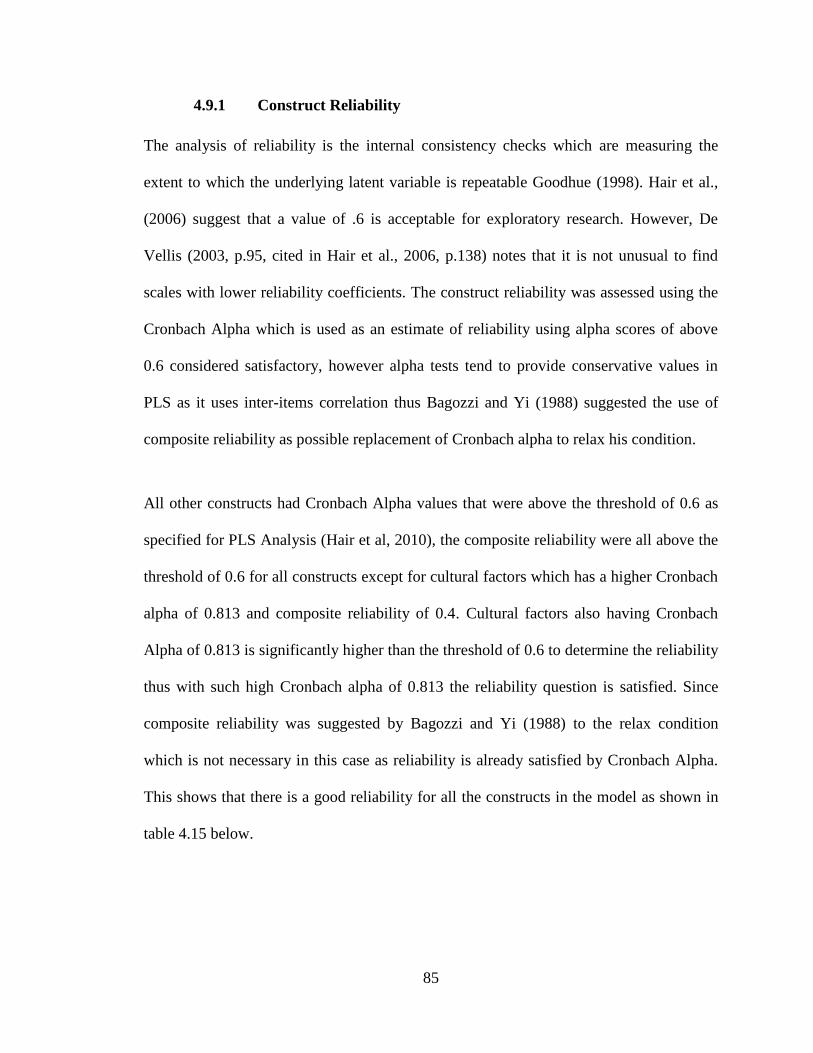
85
4.9.1 Construct Reliability
The analysis of reliability is the internal consistency checks which are measuring the
extent to which the underlying latent variable is repeatable Goodhue (1998). Hair et al.,
(2006) suggest that a value of .6 is acceptable for exploratory research. However, De
Vellis (2003, p.95, cited in Hair et al., 2006, p.138) notes that it is not unusual to find
scales with lower reliability coefficients. The construct reliability was assessed using the
Cronbach Alpha which is used as an estimate of reliability using alpha scores of above
0.6 considered satisfactory, however alpha tests tend to provide conservative values in
PLS as it uses inter-items correlation thus Bagozzi and Yi (1988) suggested the use of
composite reliability as possible replacement of Cronbach alpha to relax his condition.
All other constructs had Cronbach Alpha values that were above the threshold of 0.6 as
specified for PLS Analysis (Hair et al, 2010), the composite reliability were all above the
threshold of 0.6 for all constructs except for cultural factors which has a higher Cronbach
alpha of 0.813 and composite reliability of 0.4. Cultural factors also having Cronbach
Alpha of 0.813 is significantly higher than the threshold of 0.6 to determine the reliability
thus with such high Cronbach alpha of 0.813 the reliability question is satisfied. Since
composite reliability was suggested by Bagozzi and Yi (1988) to the relax condition
which is not necessary in this case as reliability is already satisfied by Cronbach Alpha.
This shows that there is a good reliability for all the constructs in the model as shown in
table 4.15 below.
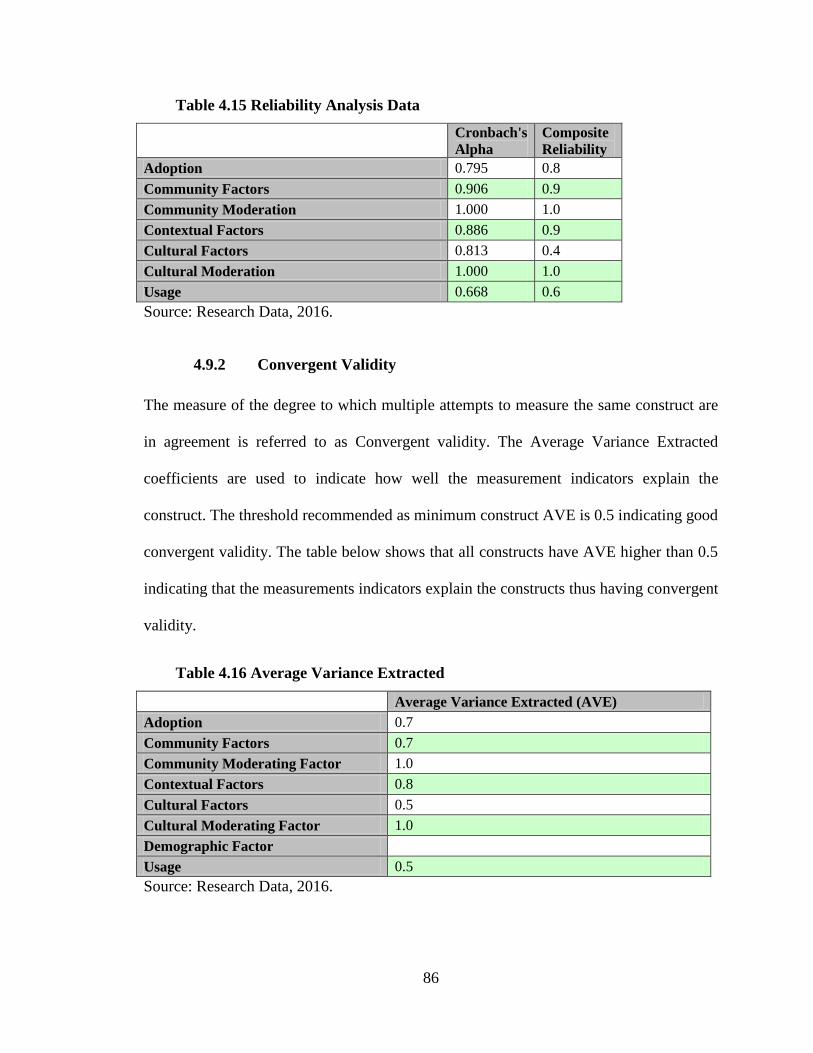
86
Table 4.15 Reliability Analysis Data
Cronbach's
Alpha
Composite
Reliability
Adoption 0.795 0.8
Community Factors 0.906 0.9
Community Moderation 1.000 1.0
Contextual Factors 0.886 0.9
Cultural Factors 0.813 0.4
Cultural Moderation 1.000 1.0
Usage 0.668 0.6
Source: Research Data, 2016.
4.9.2 Convergent Validity
The measure of the degree to which multiple attempts to measure the same construct are
in agreement is referred to as Convergent validity. The Average Variance Extracted
coefficients are used to indicate how well the measurement indicators explain the
construct. The threshold recommended as minimum construct AVE is 0.5 indicating good
convergent validity. The table below shows that all constructs have AVE higher than 0.5
indicating that the measurements indicators explain the constructs thus having convergent
validity.
Table 4.16 Average Variance Extracted
Average Variance Extracted (AVE)
Adoption 0.7
Community Factors 0.7
Community Moderating Factor 1.0
Contextual Factors 0.8
Cultural Factors 0.5
Cultural Moderating Factor 1.0
Demographic Factor
Usage 0.5
Source: Research Data, 2016.
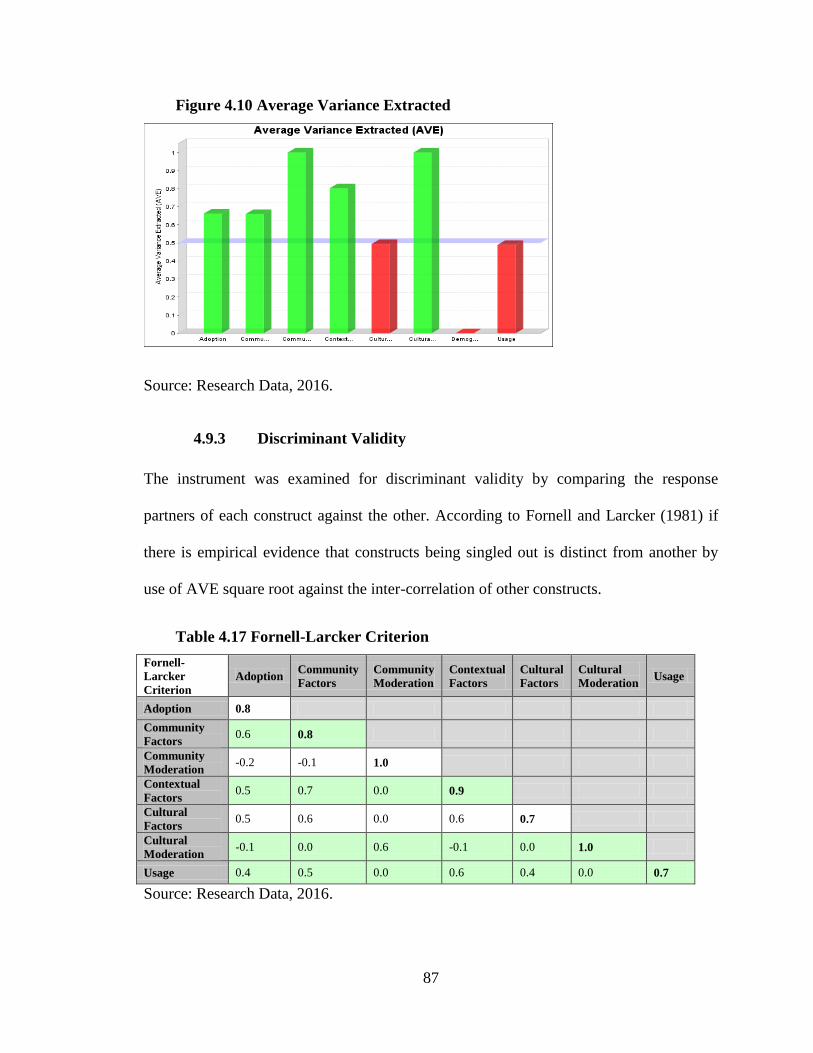
87
Figure 4.10 Average Variance Extracted
Source: Research Data, 2016.
4.9.3 Discriminant Validity
The instrument was examined for discriminant validity by comparing the response
partners of each construct against the other. According to Fornell and Larcker (1981) if
there is empirical evidence that constructs being singled out is distinct from another by
use of AVE square root against the inter-correlation of other constructs.
Table 4.17 Fornell-Larcker Criterion
Fornell-
Larcker
Criterion
Adoption Community
Factors
Community
Moderation
Contextual
Factors
Cultural
Factors
Cultural
Moderation Usage
Adoption 0.8
Community
Factors 0.6 0.8
Community
Moderation -0.2 -0.1 1.0
Contextual
Factors 0.5 0.7 0.0 0.9
Cultural
Factors 0.5 0.6 0.0 0.6 0.7
Cultural
Moderation -0.1 0.0 0.6 -0.1 0.0 1.0
Usage 0.4 0.5 0.0 0.6 0.4 0.0 0.7
Source: Research Data, 2016.
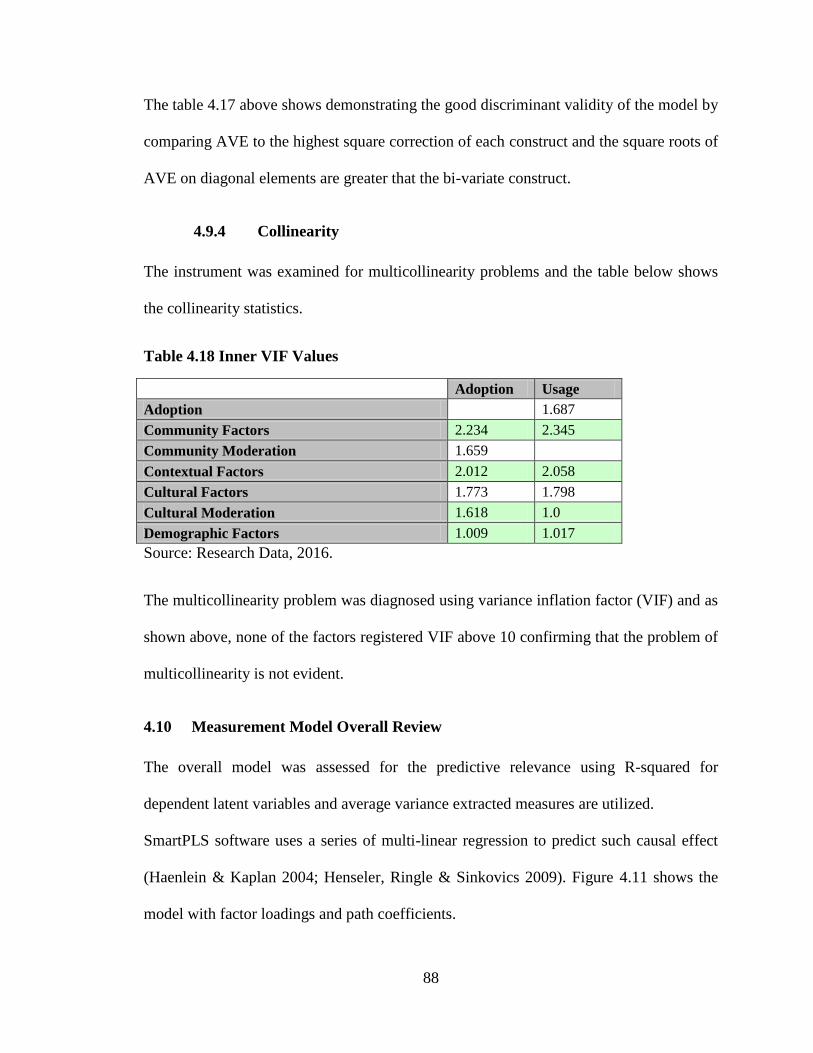
88
The table 4.17 above shows demonstrating the good discriminant validity of the model by
comparing AVE to the highest square correction of each construct and the square roots of
AVE on diagonal elements are greater that the bi-variate construct.
4.9.4 Collinearity
The instrument was examined for multicollinearity problems and the table below shows
the collinearity statistics.
Table 4.18 Inner VIF Values
Adoption Usage
Adoption
1.687
Community Factors 2.234 2.345
Community Moderation 1.659
Contextual Factors 2.012 2.058
Cultural Factors 1.773 1.798
Cultural Moderation 1.618 1.0
Demographic Factors 1.009 1.017
Source: Research Data, 2016.
The multicollinearity problem was diagnosed using variance inflation factor (VIF) and as
shown above, none of the factors registered VIF above 10 confirming that the problem of
multicollinearity is not evident.
4.10 Measurement Model Overall Review
The overall model was assessed for the predictive relevance using R-squared for
dependent latent variables and average variance extracted measures are utilized.
SmartPLS software uses a series of multi-linear regression to predict such causal effect
(Haenlein & Kaplan 2004; Henseler, Ringle & Sinkovics 2009). Figure 4.11 shows the
model with factor loadings and path coefficients.
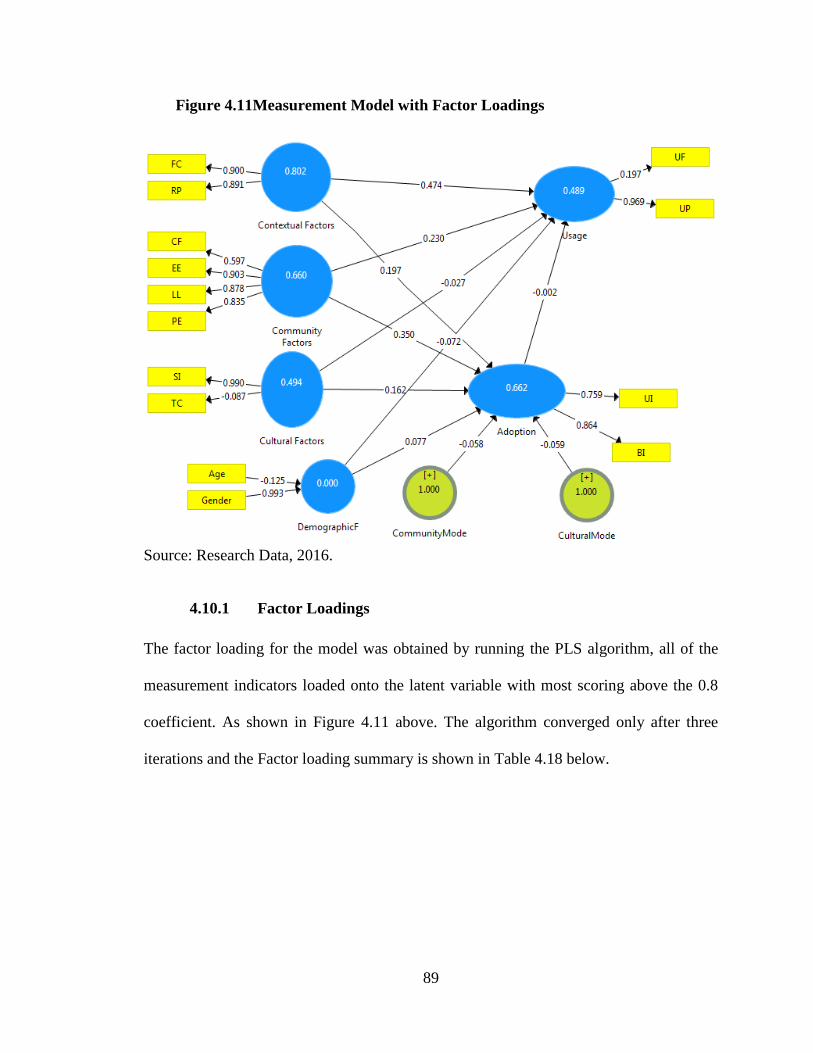
89
Figure 4.11Measurement Model with Factor Loadings
Source: Research Data, 2016.
4.10.1 Factor Loadings
The factor loading for the model was obtained by running the PLS algorithm, all of the
measurement indicators loaded onto the latent variable with most scoring above the 0.8
coefficient. As shown in Figure 4.11 above. The algorithm converged only after three
iterations and the Factor loading summary is shown in Table 4.18 below.
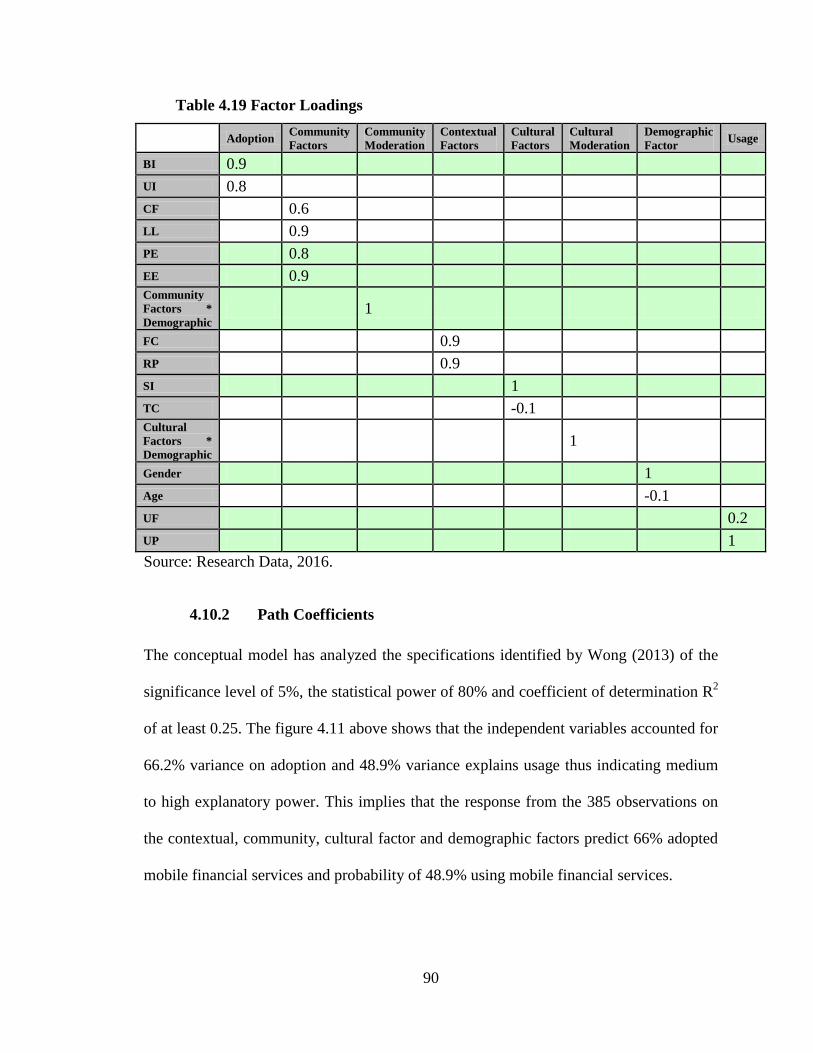
90
Table 4.19 Factor Loadings
Adoption Community
Factors
Community
Moderation
Contextual
Factors
Cultural
Factors
Cultural
Moderation
Demographic
Factor Usage
BI 0.9
UI 0.8
CF 0.6
LL 0.9
PE 0.8
EE 0.9 Community
Factors *
Demographic 1
FC 0.9
RP 0.9
SI 1
TC -0.1 Cultural
Factors *
Demographic 1
Gender 1
Age -0.1
UF 0.2
UP 1
Source: Research Data, 2016.
4.10.2 Path Coefficients
The conceptual model has analyzed the specifications identified by Wong (2013) of the
significance level of 5%, the statistical power of 80% and coefficient of determination R2
of at least 0.25. The figure 4.11 above shows that the independent variables accounted for
66.2% variance on adoption and 48.9% variance explains usage thus indicating medium
to high explanatory power. This implies that the response from the 385 observations on
the contextual, community, cultural factor and demographic factors predict 66% adopted
mobile financial services and probability of 48.9% using mobile financial services.
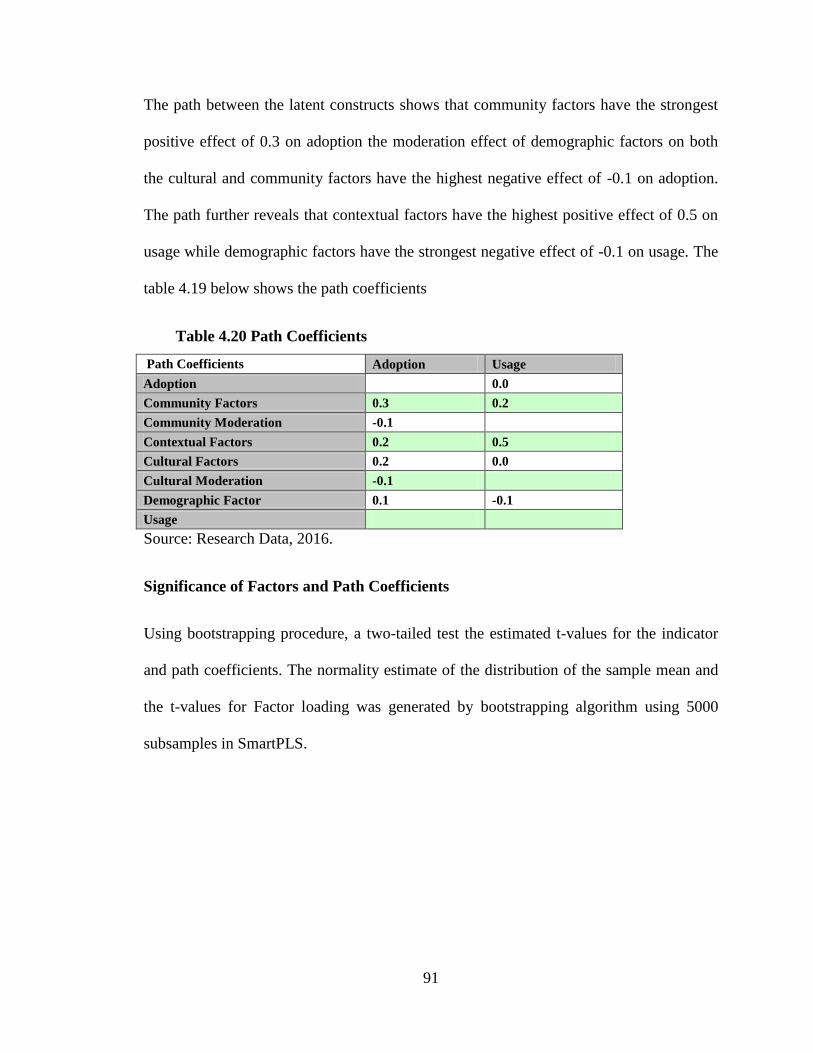
91
The path between the latent constructs shows that community factors have the strongest
positive effect of 0.3 on adoption the moderation effect of demographic factors on both
the cultural and community factors have the highest negative effect of -0.1 on adoption.
The path further reveals that contextual factors have the highest positive effect of 0.5 on
usage while demographic factors have the strongest negative effect of -0.1 on usage. The
table 4.19 below shows the path coefficients
Table 4.20 Path Coefficients
Path Coefficients Adoption Usage
Adoption 0.0
Community Factors 0.3 0.2
Community Moderation -0.1
Contextual Factors 0.2 0.5
Cultural Factors 0.2 0.0
Cultural Moderation -0.1
Demographic Factor 0.1 -0.1
Usage
Source: Research Data, 2016.
Significance of Factors and Path Coefficients
Using bootstrapping procedure, a two-tailed test the estimated t-values for the indicator
and path coefficients. The normality estimate of the distribution of the sample mean and
the t-values for Factor loading was generated by bootstrapping algorithm using 5000
subsamples in SmartPLS.
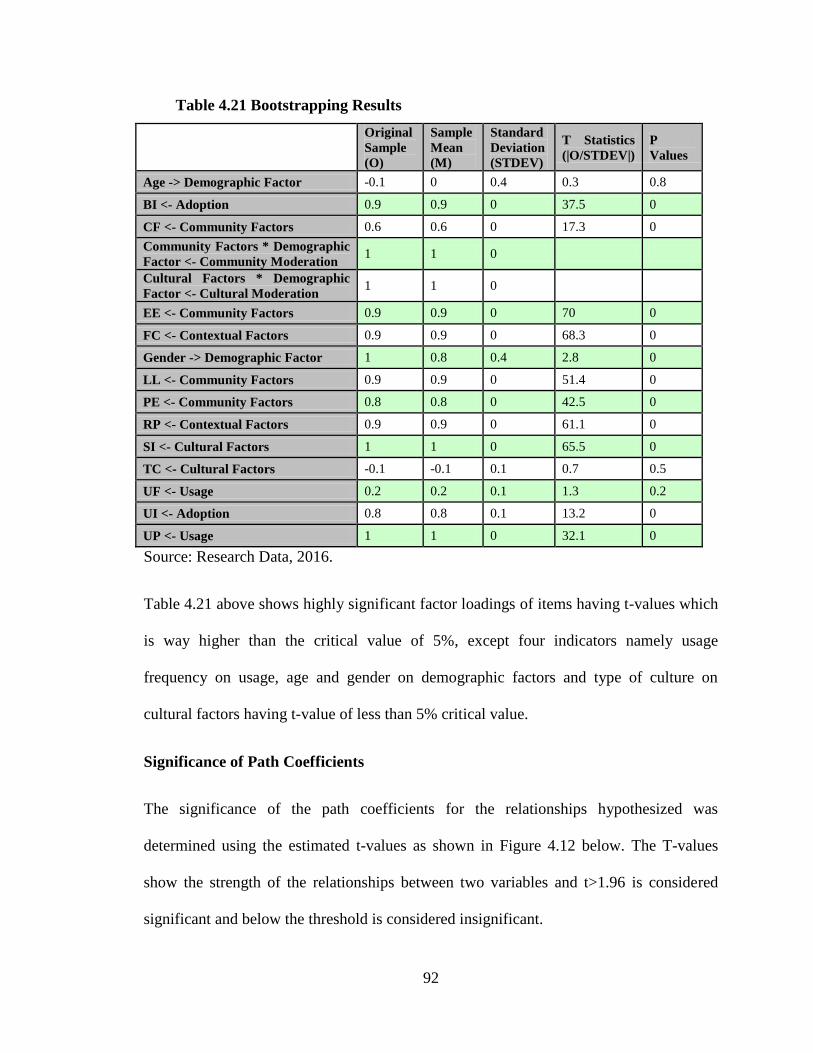
92
Table 4.21 Bootstrapping Results
Original
Sample
(O)
Sample
Mean
(M)
Standard
Deviation
(STDEV)
T Statistics
(|O/STDEV|)
P
Values
Age -> Demographic Factor -0.1 0 0.4 0.3 0.8
BI <- Adoption 0.9 0.9 0 37.5 0
CF <- Community Factors 0.6 0.6 0 17.3 0
Community Factors * Demographic
Factor <- Community Moderation 1 1 0
Cultural Factors * Demographic
Factor <- Cultural Moderation 1 1 0
EE <- Community Factors 0.9 0.9 0 70 0
FC <- Contextual Factors 0.9 0.9 0 68.3 0
Gender -> Demographic Factor 1 0.8 0.4 2.8 0
LL <- Community Factors 0.9 0.9 0 51.4 0
PE <- Community Factors 0.8 0.8 0 42.5 0
RP <- Contextual Factors 0.9 0.9 0 61.1 0
SI <- Cultural Factors 1 1 0 65.5 0
TC <- Cultural Factors -0.1 -0.1 0.1 0.7 0.5
UF <- Usage 0.2 0.2 0.1 1.3 0.2
UI <- Adoption 0.8 0.8 0.1 13.2 0
UP <- Usage 1 1 0 32.1 0
Source: Research Data, 2016.
Table 4.21 above shows highly significant factor loadings of items having t-values which
is way higher than the critical value of 5%, except four indicators namely usage
frequency on usage, age and gender on demographic factors and type of culture on
cultural factors having t-value of less than 5% critical value.
Significance of Path Coefficients
The significance of the path coefficients for the relationships hypothesized was
determined using the estimated t-values as shown in Figure 4.12 below. The T-values
show the strength of the relationships between two variables and t>1.96 is considered
significant and below the threshold is considered insignificant.
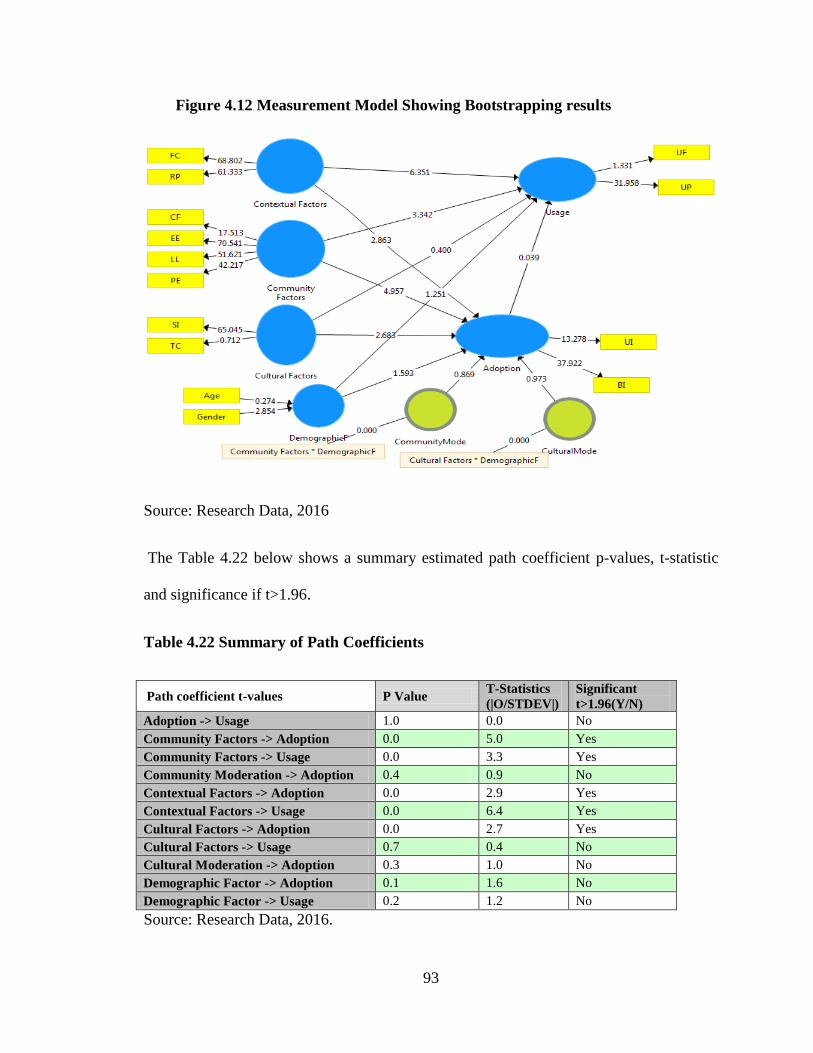
93
Figure 4.12 Measurement Model Showing Bootstrapping results
Source: Research Data, 2016
The Table 4.22 below shows a summary estimated path coefficient p-values, t-statistic
and significance if t>1.96.
Table 4.22 Summary of Path Coefficients
Path coefficient t-values P Value T-Statistics
(|O/STDEV|)
Significant
t>1.96(Y/N)
Adoption -> Usage 1.0 0.0 No
Community Factors -> Adoption 0.0 5.0 Yes
Community Factors -> Usage 0.0 3.3 Yes
Community Moderation -> Adoption 0.4 0.9 No
Contextual Factors -> Adoption 0.0 2.9 Yes
Contextual Factors -> Usage 0.0 6.4 Yes
Cultural Factors -> Adoption 0.0 2.7 Yes
Cultural Factors -> Usage 0.7 0.4 No
Cultural Moderation -> Adoption 0.3 1.0 No
Demographic Factor -> Adoption 0.1 1.6 No
Demographic Factor -> Usage 0.2 1.2 No
Source: Research Data, 2016.
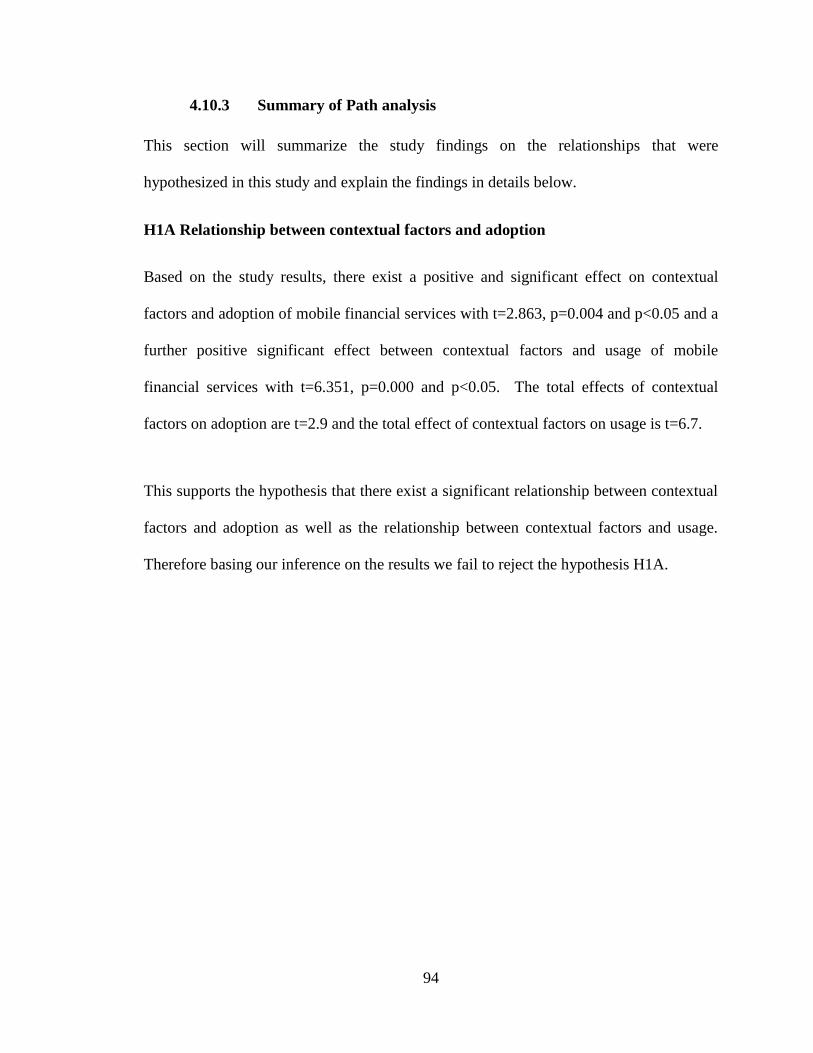
94
4.10.3 Summary of Path analysis
This section will summarize the study findings on the relationships that were
hypothesized in this study and explain the findings in details below.
H1A Relationship between contextual factors and adoption
Based on the study results, there exist a positive and significant effect on contextual
factors and adoption of mobile financial services with t=2.863, p=0.004 and p<0.05 and a
further positive significant effect between contextual factors and usage of mobile
financial services with t=6.351, p=0.000 and p<0.05. The total effects of contextual
factors on adoption are t=2.9 and the total effect of contextual factors on usage is t=6.7.
This supports the hypothesis that there exist a significant relationship between contextual
factors and adoption as well as the relationship between contextual factors and usage.
Therefore basing our inference on the results we fail to reject the hypothesis H1A.
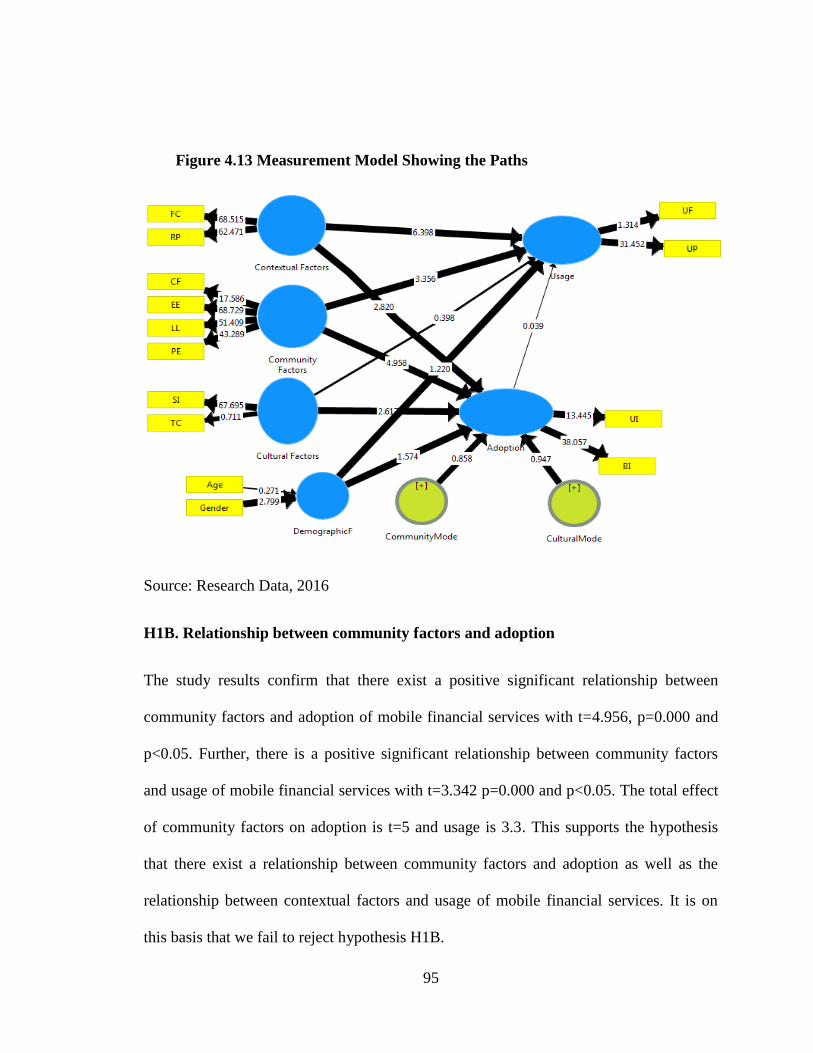
95
Figure 4.13 Measurement Model Showing the Paths
Source: Research Data, 2016
H1B. Relationship between community factors and adoption
The study results confirm that there exist a positive significant relationship between
community factors and adoption of mobile financial services with t=4.956, p=0.000 and
p<0.05. Further, there is a positive significant relationship between community factors
and usage of mobile financial services with t=3.342 p=0.000 and p<0.05. The total effect
of community factors on adoption is t=5 and usage is 3.3. This supports the hypothesis
that there exist a relationship between community factors and adoption as well as the
relationship between contextual factors and usage of mobile financial services. It is on
this basis that we fail to reject hypothesis H1B.
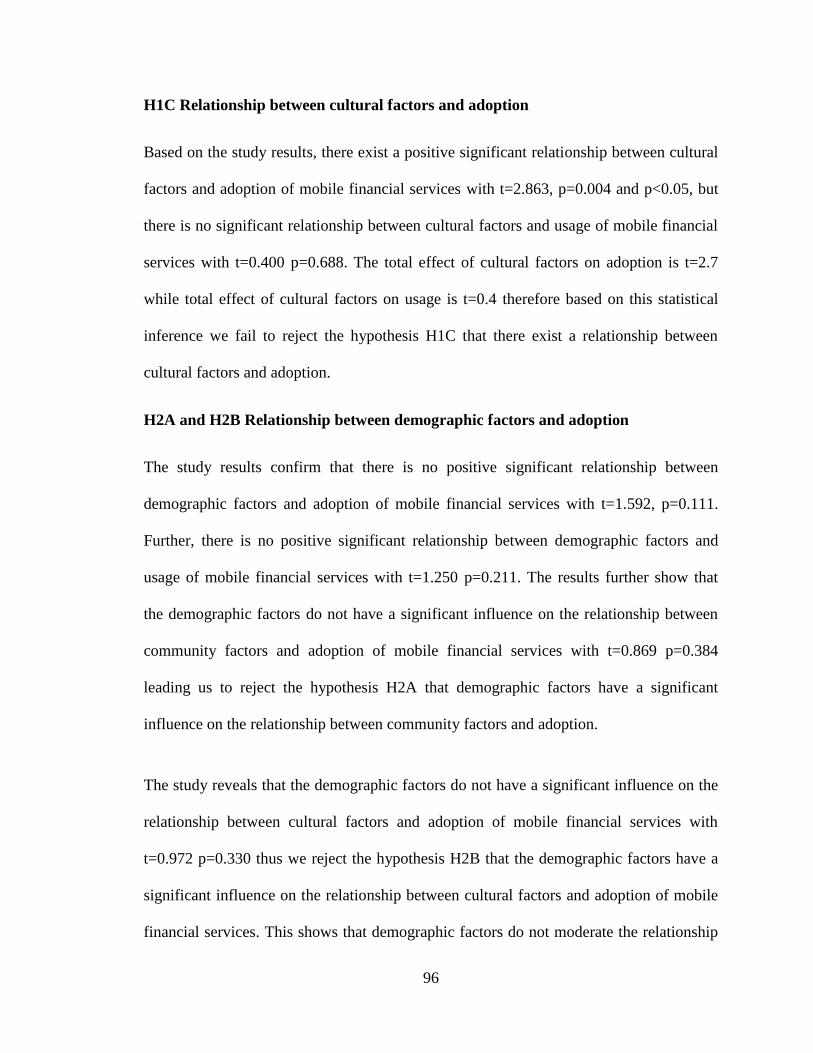
96
H1C Relationship between cultural factors and adoption
Based on the study results, there exist a positive significant relationship between cultural
factors and adoption of mobile financial services with t=2.863, p=0.004 and p<0.05, but
there is no significant relationship between cultural factors and usage of mobile financial
services with t=0.400 p=0.688. The total effect of cultural factors on adoption is t=2.7
while total effect of cultural factors on usage is t=0.4 therefore based on this statistical
inference we fail to reject the hypothesis H1C that there exist a relationship between
cultural factors and adoption.
H2A and H2B Relationship between demographic factors and adoption
The study results confirm that there is no positive significant relationship between
demographic factors and adoption of mobile financial services with t=1.592, p=0.111.
Further, there is no positive significant relationship between demographic factors and
usage of mobile financial services with t=1.250 p=0.211. The results further show that
the demographic factors do not have a significant influence on the relationship between
community factors and adoption of mobile financial services with t=0.869 p=0.384
leading us to reject the hypothesis H2A that demographic factors have a significant
influence on the relationship between community factors and adoption.
The study reveals that the demographic factors do not have a significant influence on the
relationship between cultural factors and adoption of mobile financial services with
t=0.972 p=0.330 thus we reject the hypothesis H2B that the demographic factors have a
significant influence on the relationship between cultural factors and adoption of mobile
financial services. This shows that demographic factors do not moderate the relationship
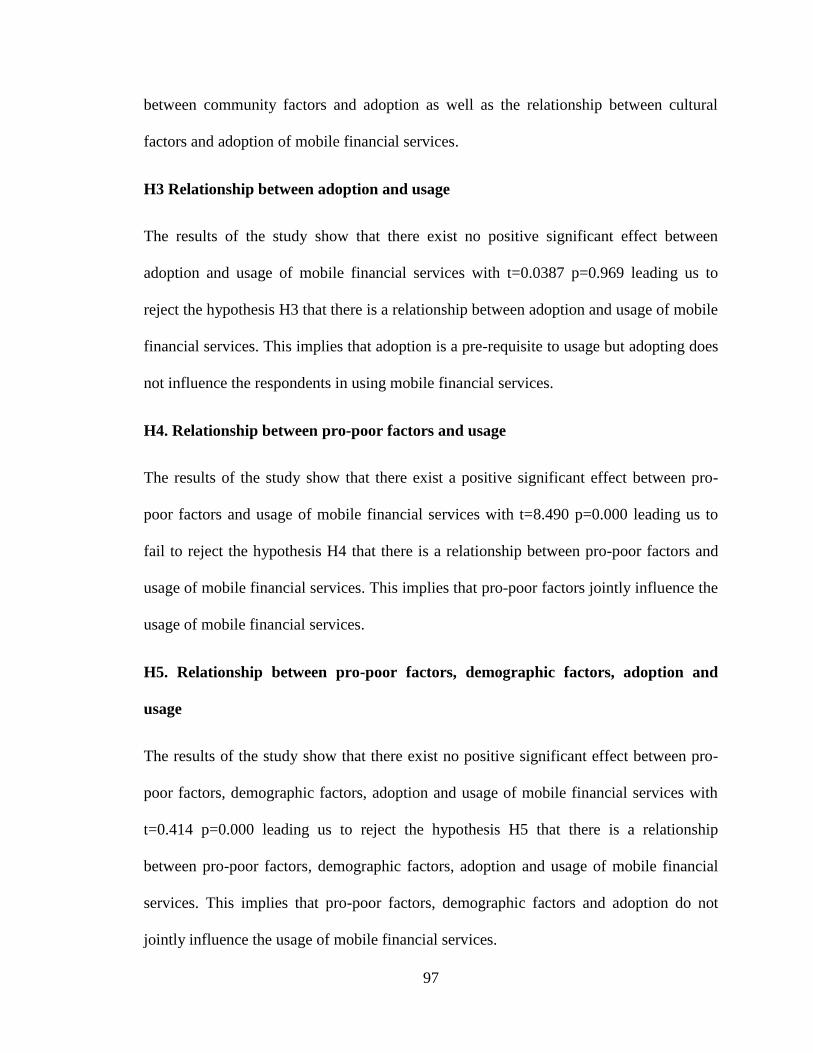
97
between community factors and adoption as well as the relationship between cultural
factors and adoption of mobile financial services.
H3 Relationship between adoption and usage
The results of the study show that there exist no positive significant effect between
adoption and usage of mobile financial services with t=0.0387 p=0.969 leading us to
reject the hypothesis H3 that there is a relationship between adoption and usage of mobile
financial services. This implies that adoption is a pre-requisite to usage but adopting does
not influence the respondents in using mobile financial services.
H4. Relationship between pro-poor factors and usage
The results of the study show that there exist a positive significant effect between pro-
poor factors and usage of mobile financial services with t=8.490 p=0.000 leading us to
fail to reject the hypothesis H4 that there is a relationship between pro-poor factors and
usage of mobile financial services. This implies that pro-poor factors jointly influence the
usage of mobile financial services.
H5. Relationship between pro-poor factors, demographic factors, adoption and
usage
The results of the study show that there exist no positive significant effect between pro-
poor factors, demographic factors, adoption and usage of mobile financial services with
t=0.414 p=0.000 leading us to reject the hypothesis H5 that there is a relationship
between pro-poor factors, demographic factors, adoption and usage of mobile financial
services. This implies that pro-poor factors, demographic factors and adoption do not
jointly influence the usage of mobile financial services.
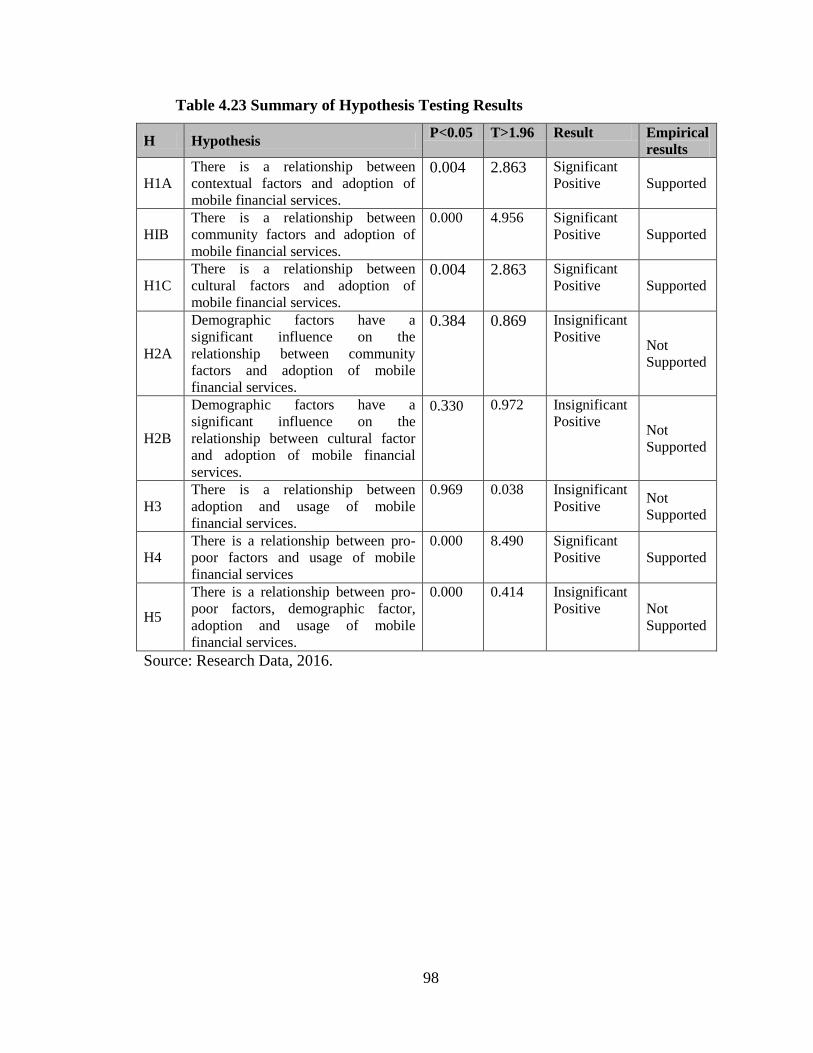
98
Table 4.23 Summary of Hypothesis Testing Results
H Hypothesis P<0.05 T>1.96 Result Empirical
results
H1A
There is a relationship between
contextual factors and adoption of
mobile financial services.
0.004 2.863 Significant
Positive Supported
HIB
There is a relationship between
community factors and adoption of
mobile financial services.
0.000 4.956 Significant
Positive Supported
H1C
There is a relationship between
cultural factors and adoption of
mobile financial services.
0.004 2.863 Significant
Positive Supported
H2A
Demographic factors have a
significant influence on the
relationship between community
factors and adoption of mobile
financial services.
0.384 0.869 Insignificant
Positive Not
Supported
H2B
Demographic factors have a
significant influence on the
relationship between cultural factor
and adoption of mobile financial
services.
0.330 0.972 Insignificant
Positive Not
Supported
H3
There is a relationship between
adoption and usage of mobile
financial services.
0.969 0.038 Insignificant
Positive Not
Supported
H4
There is a relationship between pro-
poor factors and usage of mobile
financial services
0.000 8.490 Significant
Positive Supported
H5
There is a relationship between pro-
poor factors, demographic factor,
adoption and usage of mobile
financial services.
0.000 0.414 Insignificant
Positive Not
Supported
Source: Research Data, 2016.
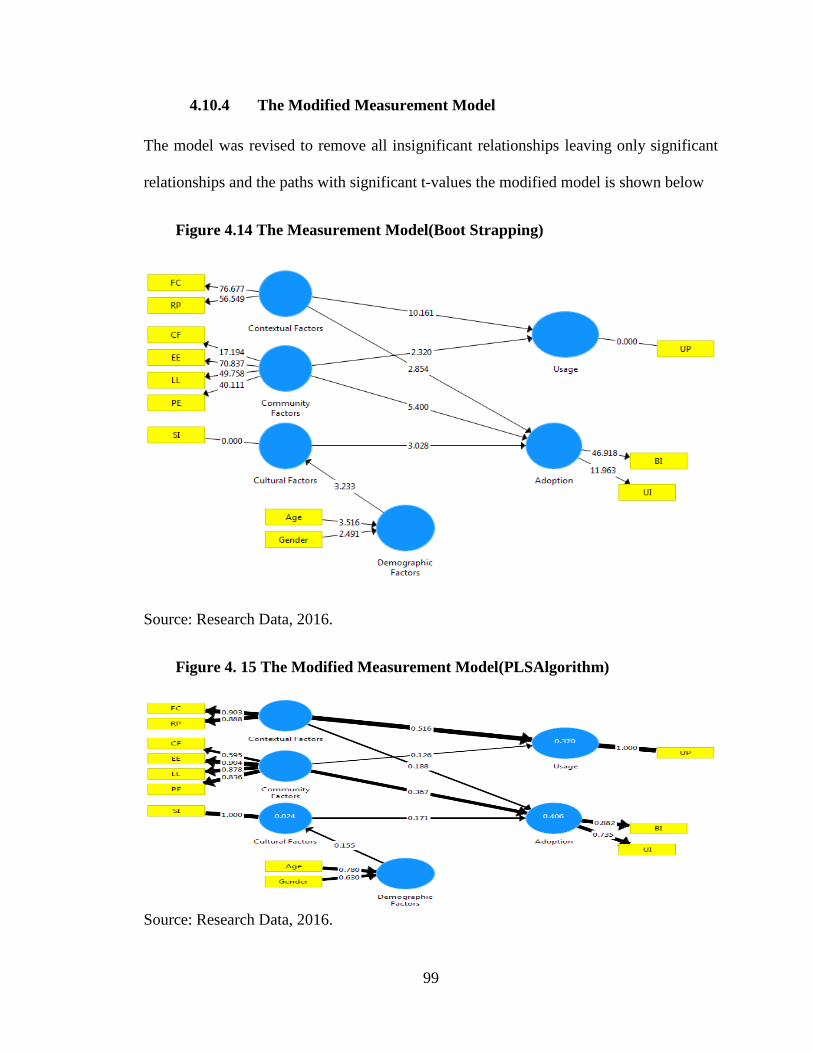
99
4.10.4 The Modified Measurement Model
The model was revised to remove all insignificant relationships leaving only significant
relationships and the paths with significant t-values the modified model is shown below
Figure 4.14 The Measurement Model(Boot Strapping)
Source: Research Data, 2016.
Figure 4. 15 The Modified Measurement Model(PLSAlgorithm)
Source: Research Data, 2016.
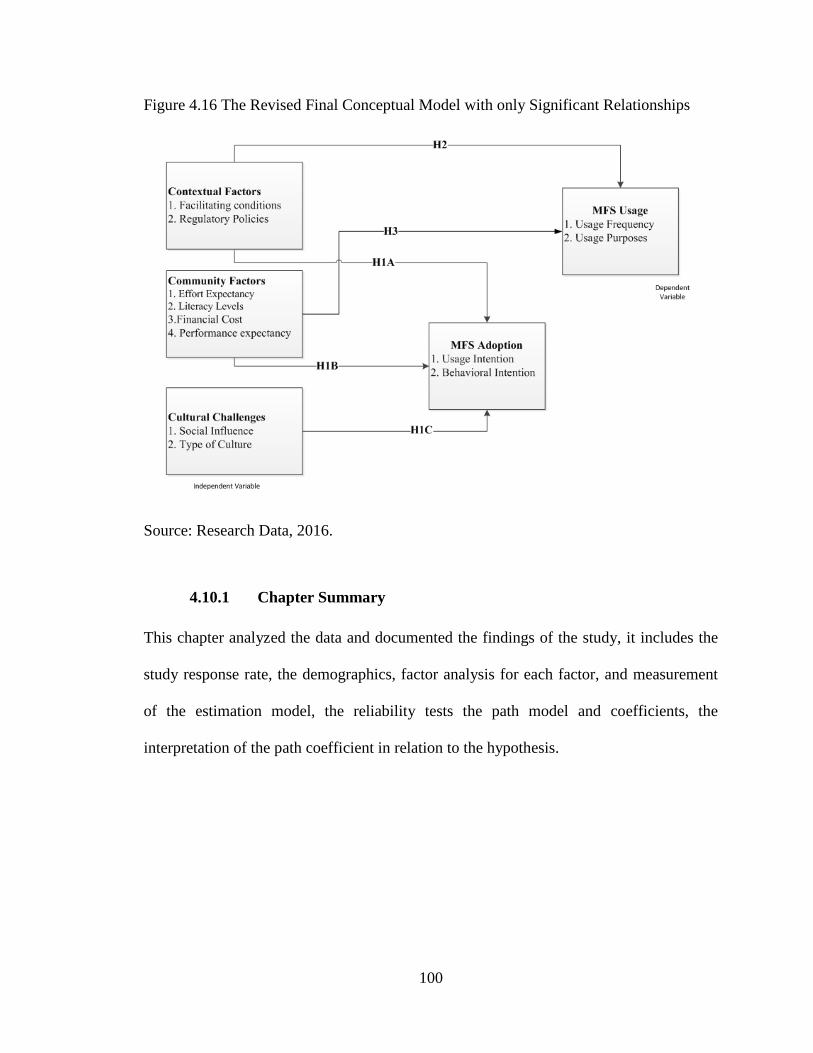
100
Figure 4.16 The Revised Final Conceptual Model with only Significant Relationships
Source: Research Data, 2016.
4.10.1 Chapter Summary
This chapter analyzed the data and documented the findings of the study, it includes the
study response rate, the demographics, factor analysis for each factor, and measurement
of the estimation model, the reliability tests the path model and coefficients, the
interpretation of the path coefficient in relation to the hypothesis.
101
CHAPTER FIVE: DISCUSSION OF FINDINGS
5.1 Introduction
This chapter presents the discussions of the findings; this study‟s general objective is to
establish the effects of pro-poor factors on the adoption and usage of mobile financial
services by the poor in Kenya. The pro-poor factors included contextual factors,
community factors, and cultural factors. The study sought to establish the effects of pro-
poor factors on adoption and usage of mobile financial services as well as the moderating
effects of demographic factors of age and gender on the relationships between pro-poor
factors and adoption.
The key objective of this chapter is to present the statistical analysis results of the
measurement model, interpretations of the results and findings. The analysis is presented
for the test of the conceptual model and presents the test results and the findings on the
specific objectives shown below
i. To examine the relationship between pro-poor factors and adoption of mobile
financial services by the poor in Kenya.
ii. To investigate the relationship between adoption and usage of mobile financial
services by the poor in Kenya.
iii. To determine the influence of demographic factors on the relationship between
community factors and adoption of mobile financial services by poor in Kenya
iv. To investigate the influence of demographic factors on the relationship between
cultural factors and adoption of mobile financial services by the poor in Kenya.
v. To investigate the relationship between pro-poor factors and usage of mobile
102
financial services by the poor in Kenya
vi. To establish the joint relationship between pro-poor factors, adoption,
demographic factors and usage of mobile financial services by the poor in Kenya.
5.2 Contextual Factors, Adoption, and Usage
The specific objective of the study was to examine the relationship between pro-poor
factors and adoption of mobile financial services. The specific pro-poor factors are
contextual factors, community factors, and cultural factors. We discuss the findings of the
relationship between contextual factors and adoption as well as the relationship between
contextual factors and usage.
The study focused on the two indicators of facilitating condition and regulatory policies
which were identified by Bhavnani, et al. (2008) and Potnis (2014). The study found that
there is a significant positive relationship between contextual factors and adoption as
shown in Table 4.22. This could be attributed to the importance of having available the
facilitating conditions such as the network infrastructure, electricity supply, and signal
strength that are required to access mobile financial services for which without access to
the mobile network or electricity to charge the phone adoption of mobile financial
services are impossible.
The study reveals that contextual factors enable the adoption of mobile financial services
as both the indicators significantly explain the latent variable contextual factors. This is
consistent with the findings of Bhavnani, et al. (2008) and Potnis (2014) which confirms
that contextual factors influence adoption of mobile financial services. Wamuyu (2014)
states that mobile money success is as a result of two contextual factors namely
103
demographic characteristic and cultural practices of Kenyan people. Mas and Radcliffe
(2010) found that several country-level environmental factors were necessary for the
development of mobile money. Joshua and Koshy (2011) found that the more available
the facilitating conditions such as infrastructure the higher the rate of adoption and use of
mobile banking. This study supports the previous literature and confirms that there is a
positive significant relationship between contextual factors and adoption of mobile
financial services.
The study results show in Table 4.22 that there is a significant positive relationship
between contextual factors and usage of mobile financial services. This being derived
from the joint objective of determining the effect of pro-poor factors on usage. The
existing literature is supported by these findings as Liang and Yeh (2011) confirm that
the contextual factors influence continuous usage of mobile services. Mallat et al. (2008)
found that contextual factors influence the use of mobile services. The current study
supports the theory of unified theory of technology acceptance and usage of technology
and the existing literature by confirming the existence of a significant positive
relationship between contextual factors and usage of mobile financial services.
5.3 Community Factors, Adoption, and Usage
The specific objective of the study was to examine the relationship between pro-poor
factors and adoption of mobile financial services. The specific pro-poor factors are
contextual factors, community factors, and cultural factors. We discuss the findings of the
relationship between community factors and adoption as well as the relationship between
community factors and usage.
104
The study focused on the four indicators identified as effort expectancy by Yu (2012),
performance expectancy Yu (2012), literacy levels by Mohan and Potnis (2015), financial
cost by Yu (2012). The study as shown in Table 4.22 found that there is a significant
positive relationship between community factors and adoption, all the indicators
significantly explain the latent variable adoption. This can be explained from the study
results by most of the respondents confirming that they are able to adopt mobile financial
services due to the indicators, even the financial cost indicator was not seen to be an issue
that deters adoption of mobile financial services as the poor had to adopt mobile financial
services so that they can access financial services as this was their only route to financial
inclusion.
This study supports the unified theory of acceptance and usage of technology and is
consistent with the findings of Yu (2012), Mohan and Potnis (2015) which confirms that
community factors influence adoption of mobile financial services. Park et al. (2007), Lu
et al. (2009) found that effort expectancy and performance expectancy influenced
adoption and use of mobile technology. Luarn and Lin (2005) found that financial cost
negatively influenced adoption and usage of mobile banking. This study confirms that
there is a positive significant relationship between community factors and adoption of
mobile financial services and further finds that there is a significant positive relationship
between community factors and usage of mobile financial services as shown in Table
4.22.
105
5.4 Cultural Factors, Adoption and Usage
The specific objective of the study was to examine the relationship between pro-poor
factors and adoption of mobile financial services. The specific pro-poor factors are
contextual factors, community factors, and cultural factors. We discuss the findings of the
relationship between cultural factors and adoption as well as the relationship between
cultural factors and usage.
The study focused on the two indicators of social influence identified by Puschel et al.
(2010) and type of culture proposed by Potnis (2014). The study found that there is a
significant positive relationship between cultural factors and adoption as shown in Table
4.22; this could be explained by finding that the peers influence their peers as well as
children influencing their parents in the adoption of mobile financial services. The study
reveals that the indicator type of culture has a negative insignificant effect on the latent
variable cultural factors as shown in Table 4.21.
This study supports the social capital theory as social influences significantly influences
adoption, the finding that others who do not own a mobile phone are able to borrow from
their social associates to enjoy the benefits of mobile financial services confirms the
usage and importance of social capital as proposed by social capital theory. This study
further supports the unified theory of acceptance and usage of technology and its finding
is consistent with the extant literature, Van Bilijon and Kotze (2008) confirm that culture
influence adoption and usage of mobile phone. De Silva et al. (2009) confirms that social
influence significantly affects adoption. Singh et al. (2010), Yu (2012), Amin et al.
(2007) all found that social influence significantly affects the adoption and usage of
106
mobile banking. This study confirms that there exist a significant positive relationship
between cultural factors and adoption of mobile financial services as shown in Figure
4.12 the t-value for the path cultural factor and adoption is t=2.683 which is higher than
the threshold of t=>1.96. Despite finding by Amin et al. (2007) this study finds that as
part of testing H4 there is an insignificant positive relationship between cultural factors
and usage of mobile financial services as the path has a t-value of 0.400 which is less
than the threshold as seen in Figure 4.12.
5.5 The Demographic Factors on Adoption and Usage
The specific objective of the study was to investigate the influence of demographic
factors on the relationship between cultural factors and adoption as well as the influence
of demographic factors on the relationship between community factors and adoption of
mobile financial services by the poor in Kenya.
The study focused on two indicators of age identified by Rogers (2003), Laforet and Li
(2005) and Puschel et al. (2010) as well as gender identified by Riquelme and Rios
(2010), Puschel et al. (2010) and Yu (2012). The study found that demographic factors
have an insignificant positive influence on the relationship between community factors
and adoption as it can be seen from Figure 4.12 that the t-value is 0.869 which is below
the threshold of 1.96. The study also revealed demographic factors have an insignificant
positive influence on the relationship between cultural factors and adoption of mobile
financial services as it can be seen from Figure 4.12 that the t-value is 0.973 which is less
than the threshold of 1.96.
107
The gender indicator significantly explains the latent variable demographic factors as it
can be seen from Figure 4.13 the loading for gender is 2.799 while age does not
significantly explain the demographic factors as it has a loading of 0.271. This can be
explained that as a result of the need and lack of other alternatives to the adoption of
mobile financial services, the age and gender factor is significantly suppressed and the
research findings shows t-value of 1.574 which is less than the threshold thus do not
support the moderating effect of demographic factors of age and gender on adoption of
mobile financial services.
The case of the relationship between demographic factors and usage is not too different
either as there is an insignificant positive relationship of t-value of 1.220 between
demographic factors and usage of mobile financial services as shown in Figure 4.13.This
finding can also be attributed to the existing need of the poor to access financial services
only through mobile financial services.
This study supports the unified theory of acceptance and usage of technology and its
findings is consistent with the findings of Yu (2012) that gender and age do not
significantly moderate the effect performance expectancy which is part of the community
factors. Yu (2012) found that social influence part of the cultural factors was not
significantly moderated by gender. This is in line with the study finding that the
demographic factors do not moderate the relationships between community factors and
adoption and also the relationship between cultural factors and adoption of mobile
financial services. The study finds that as part of testing H5 there is an insignificant
108
positive relationship of t=1.220 between demographic factors and usage of mobile
financial services.
5.6 Adoption and Usage
The specific objective of the study was to investigate the relationship between adoption
and usage of mobile financial services. The study focused on two indicators of usage
intention and behavioral intention identified by Yu (2012).
The study found as shown in Figure 4.12 that there is an insignificant positive of t=0.039
relationship between adoption and usage of mobile financial services. All the indicators
significantly explain the latent variable adoption. This can be explained from the study
results by most of the respondents confirming that they are able to adopt mobile financial
services due to both the indicators of behavioral intention having loading of 38.057 and
usage intention having a loading of 13.445 as shown in figure 4.13 but the insignificant
relationship can be attributed to the need by the poor people to use mobile financial
services. It is not the adoption that leads to increasing in usage but rather the need of the
poor to send and receive money that drives the usage. This study has further found that
pro-poor factors have significantly influenced users to use mobile financial services has
there is a positive relationship between usage and the pro-poor contextual, community
and cultural factors tested as part of the H4 as shown in Table 4.22.
Bhattacherjee (2001a) found that acceptance or pre-adoption refers to individual‟s
decision to use technology for the first time while continuous usage refers to the
individual‟s decision to use and continuously exploit it beyond the first use. The extant
literature confirms that there are limited studies that relate adoption and usage and no
109
empirical evidence exist as to the influence of initial adoption to continue usage of
mobile financial services.
This study as shown in Table 4.22 found that there is an insignificant positive
relationship between adoption and usage thus revealing that there exist no significant
relationship between adoption and usage. This can be attributed to initial adoption not
influencing the future use. The empirical literature is rich with indicators such as
satisfaction that determines the usage. This provides directions for future research to
confirm the relationship between adoption and usage of mobile financial services.
The overall model compared to UTUAT it has revealed that the moderating effects of age
and gender that are significant in UTUAT are not significant in the current study model.
The variables that were part of the UTUAT model such as the effort expectancy,
performance expectancy have all significant relations with the adoption as shown in
Figure 4.13. This confirms that our model and UTUAT are related to some extent but
some of the UTAUT variables have no significant positive relationships in our model.
Though by extending UTAUT to mobile financial services adoption and usage our model
is stronger as it goes beyond acceptance to adoption and usage of mobile financial
services among the poor. UTAUT focuses on the individual factors as stated by Yu
(2012) but our model extends it to community by incorporating the aspects of pro-poor
perspective introduced by Potnis (2014). This is a significant extension of UTAUT to
operationalize pro-poor perspectives in information systems studies thus enabling focus
on a community rather than an individual perspective.
110
The overall model has operationalized the use of social capital theory in information
systems studies as it provides parameters to measure effects of social relationships by
away of social influence thus expanding the information systems theories to bring on
board the social capital theory. The study found that 23.9% who did not have a phone
borrowed from their social contacts thus enabling adoption and usage of the mobile
financial services by utilizing their social capital confirming the social capital theory.
5.7 Chapter Summary
This chapter presented the findings outlining the study objective and showing the
existence of both positive and negative relationships among the variables under study.
The hypothesis posited have all be discussed and accordingly accepted or rejected based
on their statistical significance.
111
CHAPTER SIX: CONCLUSIONS AND RECOMMENDATIONS
6.1 Introduction
The summary of the findings, conclusion, theoretical and empirical contributions of the
study are presented. Then policy and managerial implications of the study is discussed
followed by the limitations of the study and future research directions.
6.2 Summary of Findings
The current research set out to investigate the influence pro-poor factors on adoption and
usage of mobile financial services among the poor in Kenya. The study specifically
delved into the investigation of the relationships between pro-poor contextual,
community and cultural factors, demographic factors and adoption and usage of mobile
financial services among the poor.
The first specific object of the study was to examine the relationship between pro-poor
factors and adoption of mobile financial services by the poor in Kenya. This included
three other sub-objectives such as the relationship between contextual factors and
adoption of mobile financial services, the relationship between community factors and
adoption of mobile financial services and the relationship between cultural factors and
adoption of mobile financial services.
The objective of examining the relationship between contextual factors and adoption of
mobile financial services was tested using partial least square analysis. The details of the
hypothesis and the results are presented in Table 4.24. The relationship between
contextual factors and adoption was tested and found to have a significant positive
112
relationship with the adoption of mobile financial services. The relationship between
community factors and adoption was tested and found to have a significant positive
relationship with the adoption of mobile financial services. The relationship between
cultural factors and adoption was tested and found to have a significant positive
relationship with the adoption of mobile financial services as shown in Table 4.22.
All the relationships between pro-poor factors of context, community, and cultural factors
are found to have a significant positive relationship with adoption, the relationship
between community factors and adoption was found to have the highest positive effect on
adoption of mobile financial services which was closely followed by contextual factors
and finally the cultural factors as shown in Table 4.22.
It can be seen from Figure 4.11 indicators facilitating condition and regulatory policy
have a positive effect on contextual factors with facilitating condition having the highest
positive effect on the latent variable contextual factors. The indicators financial cost,
effort expectancy, literacy levels and performance expectancy have all a positive effect
on the latent variable community factors with effort expectancy having the high positive
effect while financial cost having the low positive effect. The indicator social influence
have a positive effect on cultural factors while the type of culture has a negative effect on
the cultural factors. All the three hypothesis of the relationship between pro-poor factors
and adoption were supported.
The second objective was to investigate the relationship between adoption and usage of
mobile financial services by the poor in Kenya. The results of testing the hypothesis
found that adoption had an insignificant negative effect on usage of mobile financial
113
services as shown in Table 4.22. The indicators usage intention and behavioral intention
had a positive effect on the latent variable adoption where behavioral intention had the
highest positive effect as shown in Figure 4.11. The hypothesis on the relationship
between adoption and usage is not supported.
The third objective was to determine the influence of demographic factors on the
relationship between community factors and adoption of mobile financial services by
poor in Kenya. The result of testing the hypothesis found that influence of demographic
factors on the relationship between community factors and adoption is a statistically
insignificant positive influence as shown in Table 4.22. The indicators of gender have a
significant positive effect on demographic factors while age had an insignificant negative
effect on demographic factors as shown in Figure 4.11. The hypothesis on the influence
of demographic factors on the relationship between community factors and adoption was
not supported.
The fourth objective was to investigate the influence of demographic factors on the
relationship between cultural factors and adoption of mobile financial services by the
poor in Kenya. The result of testing the hypothesis found that influence of demographic
factors on the relationship between cultural factors and adoption is a statistically
insignificant positive influence as shown in Table 4.22. The indicators of gender have a
significant positive effect on demographic factors while age had an insignificant negative
effect on demographic factors as shown in Figure 4.11. The hypothesis on the influence
of demographic factors on the relationship between cultural factors and adoption was not
supported.
114
The fifth objective was to establish the joint relationship between pro-poor factors,
adoption, demographic factors and usage of mobile financial services by the poor in
Kenya. The result of testing the hypothesis found that all contextual factors have a
significant positive relationship with usage, community factors have a significant positive
relationship with usage, cultural factors have an insignificant positive relationship with
usage, demographic factors have an insignificant positive influence on usage and finally
adoption has an insignificant positive relationship with usage as shown in Table 4.23.
It can be seen from Figure 4.12 that contextual factors have the highest significant
positive relationship with usage while adoption has the lowest insignificant positive
relationship with usage. The indicators of usage are usage frequency and usage purpose,
the usage purpose has the highest positive effect on usage while usage frequency has the
lowest positive effect on usage. The hypothesis under the fourth objective is partially
supported by contextual factors and community factors have a significant positive
relationship with usage while cultural factors, demographic factors, and adoption have an
insignificant positive relationship with usage.
6.3 Conclusions of the Study
The following conclusions can be made as a result of the study findings, firstly the
contextual factors influence both usage and adoption thus a lot of focus should be put in
ensuring that there are available facilitating condition and favorable regulatory conditions
to enhance the adoption and usage of mobile financial services by the poor. Secondly, the
community factors significantly influence the adoption and usage of mobile financial
services thus the effort expectancy, financial cost, performance expectancy and literacy
115
levels matter and should be considered when introducing mobile financial services to the
poor.
Yang (2004) and Yu (2012) found that financial cost negatively influences adoption but
on the contrary, this study found that financial cost did not have a significant influence on
adoption of mobile financial services. This finding those regardless of the cost of
transactions the poor were willing to use mobile financial services as they have the need
to utilize these services which underplay the effect of the cost involved in transacting.
This finding defers with previous studies as the impact of financial cost is only important
when there are alternative avenues to satisfy the need, in this case the poor had only the
mobile financial services as a medium to access financial services thus get financial
inclusion. It is the need to access financial services, the lack of alternatives that could
have led to the finding that financial cost was not significant to adoption and usage of
mobile financial services.
Thirdly the social influence is a significant indicator of cultural factors and significantly
influences the adoption and usage of mobile financial services and the type of culture
negatively affect the cultural factors. Despite significantly influencing adoption cultural
factors do not significantly affect usage of mobile financial services. This shows that
mobile financial services adoption and usage is not limited to type of culture as the
underlying need for financial inclusion or transfer of money is not dependent on the type
of culture.
116
Fourthly age and gender do not significantly relate to both adoption and usage and do not
significantly moderate the relationship between community factors and adoption as well
as cultural factors and adoption. Thus the study reveals that gender or age do not
influence adoption or usage of mobile financial services, this is against the findings of
Laforet & Li (2005) that shows the influence of these factors on adoption is significant.
Fifthly usage of mobile financial services is not influenced by the initial adoption thus
confirming that adoption is just pre-requisite to usage as one can adopt mobile financial
services and subscribe to or register for such services but not to use them. Sixthly the
adoption and usage of mobile financial services could help reduce poverty among the
user community as it encourages financial inclusion providing the poor with access to
financial services as well as enabling easy flow of capital between urban and rural or rich
as poor through the use of social capital that can be easily transferred to relatives and
reduction in distances travelled to access financial services.
Lastly the pro-poor perspective that is more of bottom up helps identify the factors that
are influencing adoption and usage of mobile financial services thus developers of mobile
financial services products can be able to customize their products to take full advantage
of the majority market who are poor by putting into consideration those factors that
influence adoption and usage of mobile financial services before the actual development
of these products.
117
6.4 Implications of the Study
The contribution of the study is filling the knowledge gap, the contextual gap, the
methodological gap, and theory by providing empirical evidence. The study further has
implications for mobile telecom operators, innovators, and financial institutions each of
these contributions and implications are discussed in details below.
6.4.1 Theoretical Contributions
The main theoretical contribution is extension of UTAUT theory by inclusion of pro-poor
perspectives as proposed by Potnis (2014). This study provides empirical evidence to the
UTAUT modification with the suggestions of Potnis (2014) of a mobile financial services
adoption and usage framework in the context of the poor people within a developing
country.
The study reveals the important role that the pro-poor factors such as community factors,
cultural factors, and contextual factors play in the adoption and usage of mobile financial
services by the poor. The effects of demographic factors on the relationships between
community factors, cultural factors and adoption are demonstrated by the results of this
study.
The study built on the unified theory of acceptance and use of technology theoretical
framework to come up with a conceptual model that demonstrated a medium to high
predictive and explanatory power thereby expanding our understanding of the influence
of pro-poor factors on the adoption and usage of mobile financial services among the
poor and within the Kenyan context. The extant literature identified the factors that
influence adoption and usage of technology, this study extends that by empirically
118
confirming those factors and documenting the relationships. The investigation of the
influence of the community, cultural and community factors contributes to the
understanding of adoption and usage in relation to the Kenyan poor.
The study extended the application of social capital theory by operationalizing it to be
used in information systems study, this study provides empirical evidence that 24% of the
respondent adopted and usage mobile financial services due to use of their social capital
by borrowing access to mobile financial services to people they know in their social
cycles. The study contributes to the social capital theory by providing the parameters to
estimate the use of social capital by the respondents thus enhancing the utilization of the
theory by future studies. By providing the measurement instrument to explore this
theoretical perspective the study extends the existing body of knowledge and enables
further studies in the new theoretical perspective of social capital theory.
The conceptualization and measurement of adoption and usage of mobile financial
services are enhanced by the contribution of empirical support by this study. This study
developed measurement framework to understand the influence of pro-poor factors on
adoption and usage of mobile financial services thus enriching literature in the context of
poor people in Kenya.
6.4.2 Contributions of the Study to Knowledge
The conceptualization of the adoption and usage of mobile financial services was based
on five theories and their arguments to obtain a better inference of the effects of the
community, cultural, contextual and demographic factors on adoption and usage leading
to the development of a conceptual framework which was validated by the study finding.
119
The study contributes to filling the knowledge gap by putting forth findings on the
influence of pro-poor factors on adoption and usage of mobile financial services. For
example, the literature indicates that the demographic factors influence technology
adoption (Laforet & Li, 2005) but this is not the case in this study. The age and gender
did not influence the adoption and usage of mobile financial services as shown in Table
4.22 providing a different view from the findings of Lafort and Li (2005). This finding
provides a new finding in the context of the poor in Kenya.
The study of mobile financial services in the aspects of adoption and usage is not very
common in the African or further in the Kenyan context. The specific study about the
poor people in Kenya is an attempt to fill the contextual gaps in literature as it provides
an insight as well as empirical evidence about the effects of the pro-poor factors,
demographic factors on adoption and usage of mobile financial services among the poor.
This enables comparison of adoption and usage of mobile financial services between a
developing country and developed country, between the poor people and the not so poor
people thereby expanding our understanding of the factors that affect the adoption and
usage of the various mobile financial services.
6.5 Policy Recommendations
The findings of this study provide information for policy makers both international and
local to refine the existing policies as a result of the information provided by this
research. Locally the study reveals the factors that are affecting the adoption and usage
by the poor thus introductions of national policies to enable access to mobile financial
services by ensuring that the contextual factors are significantly addressed.

120
The provision of a conducive regulatory environment that allows investment in
telecommunication and banking sectors will significantly expand the reach of mobile
financial services technologies. The mobile network coverage should be increased by
giving incentives to the operators to go on with last mile connectivity and expand the
coverage of electricity, the internet, and mobile network.
The international policy makers such as the world bank that have previously focused on
issues such as financial inclusion, poverty eradication now have empirical evidence that
should be used when developing policies and products that can influence the national
policy framework. This study recommends provision of affirmative action type solutions
by the government regulators and the operators in expanding the access, adoption, and
usage of mobile financial services.
6.6 Recommendations for Management Practice
The banks, mobile telecom operators, mobile phone manufacturers have an interest in
understanding the factors that promote or hinder the adoption and usage of mobile
financial services. This study recommends that the findings of this study be used by the
operators in identifying solutions to the factors that hinder the adoption and usage of
mobile financial services and accordingly come up with strategies to engage the market
with aim of promoting their products through the elimination of the bottlenecks.
The bottom-up approach used in this study has identified the factors that are influencing
the adoption and usage of mobile financial services thus it is of value to the operators and
it is recommended that they should be considered before releasing the mobile financial
121
products to the markets. At the innovation stage, these factors can influence the
development of the products that are more suitable to the poor people.
The results of this study show that demographic factors such as age and gender do not
significantly impact the adoption and usage of mobile financial services. The study
recommends that the practitioners to consider the influence of demographic factors
before targeting a specific demography as the study findings reveal that demography does
not influence adoption and usage of mobile financial services. The study has also
revealed that the type of culture has a negative influence on the cultural factors, the study
recommends the understanding the cultural orientation of the poor people in their market
to mitigating the adverse effects that type of culture could have on the adoption and usage
of their mobile financial services products.
The community factors have been found to be having a very significant effect on
adoption, the study recommends that operators should direct their corporate social
responsibility investment in addressing the issue of low literacy levels that are prevalent
among the poor people. The study recommends that financial cost is reduced to allow
many more poor people to be able to adopt and usage mobile financial services. The
review of financial cost could lead to many more poor people adopting and using the
mobile financial services.
6.7 Limitations of the Study
The study has several limitations few of which are highlighted in this section. The
generalizability of the results is limited by the collection of data only from Nairobi
County in Kenya. The study could be enriched by a collection of data from most of the
122
counties in Kenya so that the results can be more generalizable. The comparative analysis
can be done by sampling rural and urban poor to determine the effects of pro-poor factors
on adoption and usage of mobile financial services. Such comparative analysis could
enrich the study more and provide sufficient empirical evidence that included both the
urban poor and the rural poor. The study could also be carried out in multiple countries
especially in East African Community partner countries who share common mobile
telecom operators and banks with poor people of similar characteristics to come up with a
multi-country study that can provide insight about the partner countries in the East
African Community.
This study was based on cross-sectional data possibly limiting the direction of effects due
to respondent‟s predisposition of any past event or conditions at the time of responding to
the questionnaire though the model supports the empirical results from previous studies
and the theoretical perspectives. The sample size is 400 and the response rate of 98% is
adequate to draw conclusions about the sampled population. The limitations did not
affect the quality of the study as the developed framework is authenticated in the research
despite acknowledging these limitations.
6.8 Suggestions for Further Research
The future research could focus on addressing the shortcomings of this study or
extending it to other applications and finally explore new areas of relevance to the
industry or academics. There is a number of possible future research such as increasing
the coverage of this study by obtaining data from multiple counties in Kenya.
123
Comparative studies can be done by obtaining data from rural poor and urban poor as
well as comparing data from multiple countries. Since this study focused on the poor
future studies can focus on the rich so that literature can be enriched.
Since this is a cross-sectional data, future studies can be of longitudinal data so to
establish if the scales are generalizable at different times. Also, future research could be
done using the qualitative technique to obtain results using different methodology. This
study provides a good foundation for future research given the study‟s implication for
academics, researchers, policy makers, innovators and products manufacturers.
6.9 Chapter Summary
This chapter summarized the study findings, composed study conclusions, defined the
implications of the study, provided recommendations for policy and practices, identified
study limitations and suggested directions for future research.
124
REFERENCES
Adongo, J. & Deen-Swarray, M. (2006). Poverty Alleviation in Rural Namibia through
Improved Access to Financial Services. NEPRU WORKING PAPER NO.109.
Amin, H., Baba, R., and Muhammad, M. Z. (2007). An analysis of mobile banking
acceptance by Malaysian customers. Sunway University College Academic
Journal, 4, 1-12.
Ajzen, I. (1991). The theory of planned behavior. Organizational behavior and human
decision process 50, 179-211.
Babin, B., & Svensson, G. (2012). Structural equation modeling in social science
research: Issues of validity and reliability in the research process. European
Business Review, 24(4), 320-330.
Bagozzi, RP & Yi, Y 1988, „On the evaluation of structural equation models‟, Journal of
the Academy of Marketing Science, vol. 16, no. 1, pp. 74-94.
Bångens, L., & Söderberg, B. (2008). Mobile banking–Financial services for the
unbanked?” report from The Swedish Program for ICT in Developing Regions
Barnes, S. J., & Corbitt, B. (2003). Mobile banking: Concept and potential. International
Journal of Mobile Communications, 1(3), 273-288.
Baron, S., Patterson, A., & Harris, K. (2006). Beyond technology acceptance:
understanding consumer practice. International Journal of Service Industry
Management, 17(2), 111 - 135.
Bertolotti, D. (1984). Culture and technology. Bowling Green State Univ Popular press.
Bhattacherjee, A. (2001), Understanding information systems continuance: an
expectation-confirmation model, MIS Quarterly 25 (3) 351–370.
Bhavnani, A., Chiu, R., Janakiram, S. & Silarszky, P. (2008). The role of mobile phones
in sustainable rural poverty reduction. ICT policy division global information and
communications department (GICT) World Bank, Washington, D.C.
Boyd, C., & Jacob, K. (2007). Mobile financial services and the underbanked:
opportunities and challenges for M-banking and m-payments. Chicago, IL: The
Center for Financial Services Innovation.
125
Bryman, A. (2001), Social Research Methods, Oxford, UK, Oxford University Press.
Byrne, B. M. (2001). Structural equation modeling with AMOS: Basic concepts,
applications, and programming. Mahwah, NJ: Lawrence Erlbaum Associates, Inc.
Chin, W. (2013). The partial least squares approach to structural equation modeling. In
Modern methods for business research (pp. 295). New York: Psychology Press
Chung, N., & Kwon, S. (2009). The effect of customers' mobile experience and technical
support on the intention to use mobile banking. CyberPsychology and Behavior,
12(5), 539-543.
Chung, N., & Kwon, S. J. (2009). Effect of trust level on mobile banking satisfaction: a
multi-group analysis of information system success instruments. Behaviour &
Information Technology, 28(6), 549-562.
Communication Authority (2015).Quarterly Sector Statistics Report. Second Quarter of
the financial year2014/15. Communication Authority Kenya.
Davis, F. D. (1989). Perceived usefulness, perceived ease of use and user acceptance of
information technology. MIS Quarterly, 13, 319-340.
Dahlberg, T., Mallat, N., & Öörni, A. (2003a). Consumer acceptance of mobile payment
solutions - ease of use, usefulness, and trust. Paper presented at the 2nd
International Conference on Mobile Business, Vienna, Austria, 23-24.
Demirgüç-Kunt, A., & Klapper, L. F. (2012). Measuring financial inclusion: The global
index database. World Bank Policy Research Working Paper, (6025).
De Silva, H., Ratnadiwakara, D., & Zainudeen, A. (2009). Social influence in mobile
phone adoption: Evidence from the bottom of the pyramid in emerging Asia.
Available at SSRN 1564091.
DeVellis, R. F. (1991). Scale Development. Theory and Practice. Newbury Park, Sage
Publications.
Donner, J. (2005). Research Approaches to Mobile Phone Use in developing world: A
Review of the literature. The Information Society, 24, 140-159.
Donner, J. (2006). The use of mobile phones by micro-entrepreneurs in Kigali, Rwanda:
Changes to social and business networks. Information Technologies and
International Development, 3(2), 3-19.
126
Dupas, P., & Robinson, J. (2009). Savings constraints and microenterprise development:
Evidence from a field experiment in Kenya. NBER Working Paper 14693,
National Bureau of Economic Research, Cambridge, MA.
Elesh, D. (1973). Poverty theories and income maintenance: validity and policy
relevance. Social science quarterly, 359-373.
Fishbein, M., & Ajzen, I. (1975). Belief, Attitude, Intention and Behavior: An
Introduction of Theory and Research. Reading, MA, USA: Addison-Wesley.
Fornell, C., & Larcker, D. F. (1981). Evaluating Structural Equation Models with
Unobservable Variables and Measurement Error. Journal of Marketing Research,
18, 39-50.
Goodhue, DL 1998, „Development and measurement validity of task-technology fit
instrument for user evaluation of information systems‟, Decision Sciences, vol.
29, no 1 pp.105-138.
Gencer, M. (2011). The mobile money movement: Catalyst to jump-start emerging
markets. Innovations: Technology, Governance, Globalization, 6(1), 101–117.
Hair, J.F., Hult, G. T. M., Ringle, C.M., Sarstedt, M. (2013). A Primer on Partial Least
Squares Structural Equation Modelling (PLS-SEM) Sage, Thousand Oaks.
Hanifan, L. (1916). The rural school community center, Annals of the American Academy
of Political and Social Science 67: 130-138
Hawe, P., & Shiell, A. (2000). Social capital and health promotion: a review. Social
science & medicine, 51(6), 871-885.
Henseler, J., Ringle, C.M., Sinkovics, R.R. (2009): The use of partial least squares path
modeling in international marketing, in: Sinkovics, R. R. / Ghauri, P. N. (eds.),
Advances in International Marketing 20, 277-320
Hofstede, G. (1980). Culture‟s consequences: International differences in work-related
values. Beverly Hills, CA: Sage Publications.
Horst, H., & Miller, D. (2006). The cell phone: An anthropology of communication. Berg
127
Hughes, N. & Lonie, S. (2007). „M-pesa: mobile money for the “unbanked” turning
cellphones into 24-hour tellers in Kenya‟. Innovations: Technology, Governance,
Globalization. In: MIT Press 2 (1-2), 63-81.
Hulland, J. (1999). Use of Partial Least Squares (PLS) in Strategic Management
Research: A Review of Four Recent Studies. Strategic Management Journal, 20,
195-224.
International Fund for Agricultural Development (IFAD). (2011). Enabling poor rural
people to overcome poverty in Kenya. Rome, Italy
Ivatury, G., & Mas, I. (2008). The early experience with branchless banking. CGAP
Focus Note, (46).
Ivatury, G., & Pickens, M. (2006). Mobile phone banking and low-income customers:
evidence from South Africa. Consultative Group to Assist the Poor.
James, J., & Versteeg, M. (2007). Mobile phones in Africa: how much do we really
know? Social indicators research, 84(1), 117-126.
Joshua, A. J., & Koshy, M. P. (2011). Usage patterns of electronic banking services by
urban educated customers: Glimpses from India. Journal of Internet Banking and
Commerce, 16(1), 1-12.
Kabubo-Mariara J. (2007). Poverty and Policy in Kenya: Proceedings of a National
Workshop. University of Nairobi Press, Nairobi, Kenya.
Kaiser, H.F. (1974) an index of factorial simplicity. Psychometrika, 39, 31-36.
Karahanna, E., Straub, D. & Chervany, N. (1999). Information technology adoption
across time: A cross-sectional comparison of post adoption and preadoption
beliefs. MIS Quarterly; 23, 2; ABI/INFORM Global pg. 183.
Kimalu P, Nafula N, Manda D, Mwabu G, Kimenyi M. (2002). A Situational Analysis of
Poverty in Kenya. Kenya Institute of Public Policy Research Working Paper No.
6. KIPPRA, Nairobi Kenya.
Kirui, O.K., J.J. Okello, G.W Njiraini and R.A. Nyikal (2013): Impact of mobile phone-
based money transfer services in agriculture: evidence from Kenya. Quarterly
Journal of International Agriculture 52, No. 2: 141-162.
128
Kreyer, N., Pousttchi, K., & Turowski, K. (2003). Mobile Payment Procedures: Scope
and Characteristic. E-Service Journal, 2(3), 7-22.
Kristjanson P, Mango N, Krishna A, Radeny M, Johnson N. (2009).Understanding
poverty dynamics in Kenya. Journal of International Development, in press.
http://dx.doi.org/10.1002/jid.1598
Kwon, H. S., & Chidambaram, L. (2000). A test of the technology acceptance model: the
case of cellular telephone adoption. System Sciences. Proceedings of the 33rd
Annual Hawaii International Conference on (p. 7–pp).
Laforet, S., & Li, X. (2005). Consumers' attitudes towards online and mobile banking in
China. International Journal of Bank Marketing, 23(5), 362-380.
Lam, T., & Hsu, C. H. (2004). Theory of planned behavior: Potential travelers from
China. Journal of Hospitality & Tourism Research, 28(4), 463-482.
Lee, K. S., Lee, H. S., & Kim, S. Y. (2007). Factors Influencing the Adoption Behavior
of Mobile Banking: A South Korean perspective. Journal of Internet Banking &
Commerce, 12(2), 1-9.
Lee, S., Shin, B., & Lee, H. G. (2009). Understanding post-adoption usage of mobile data
services: the role of supplier-side variables. Journal of the Association for
Information Systems, 10(12), 2.
Leedy, P. & Ormrod, J. (2005). Practical research: Planning and Design, Prentice Hall,
NJ
Levin, K. A. (2006). Study design III: Cross-sectional studies. Evidence-based dentistry,
7(1), 24-25. doi:10.1038/sj.ebd.6400375.
Liang, T. P., & Yeh, Y. H. (2011). Effect of use contexts on the continuous use of mobile
services: the case of mobile games. Personal and Ubiquitous Computing, 15(2),
187-196.
Litondo, K. O., & Ntale, J. F. (2013). Determinants of Mobile Phone Usage for E-
Commerce among Micro and Small Enterprises in the Informal Sector of Kenya.
International Journal of Applied, 3(6).
Lötter, H. (2007). Are ICTs Prerequisites for the Eradication of Poverty? International
Review of Information Ethics Vol.7.
129
Luarn, P., & Lin, H. H. (2005). Toward an understanding of the behavioral intention to
use mobile banking. Computers in human behavior, 21(6), 873-891.
Lu, J., Yao, J., & Yu, C. (2005) Personal innovativeness, social influences, and adoption
of wireless Internet services via mobile technology. Journal of Strategic
Information Systems 14 (2005) 245–268. doi:10.1016/j.jsis.2005.07.003
Lu, J., Yu, C. S., & Liu, C. (2009). Mobile data service demographics in urban China.
Journal of Computer Information Systems, 50(2), 117-126.
Lule, Isaiah; Omwansa, Tonny Kerage and Prof. Waema, Timothy Mwololo. Application
of Technology Acceptance Model (TAM) in M-Banking Adoption in Kenya.
International Journal of Computing and ICT Research, Vol. 6 Issue 1, pp 31-43.
Mallat N, Rossi M, Tuunainen VK, Oorni A (2008) an empirical investigation of mobile
ticketing service adoption in public transportation. Personal and Ubiquitous
Computing 12:57–65.
Mas, I. & Kumar, K. (2008). Banking on mobiles: Why, how, for whom? CGAP Focus
Note, (48).
Mas, I. and Radcliffe, D. (2010) Mobile Payments go Viral: M-PESA in Kenya. In
ChuhanPole, P. & Angwafo, M. (Eds.) Yes Africa Can: Success Stories from a
Dynamic Continent. Washington, DC: World Bank.
Mathieson, K. (1991). Predicting user intentions: comparing the technology acceptance
model with the theory of planned behavior. Information systems research, 2(3).
McNamara, K. (2003). Information and Communication Technologies, Poverty and
Development: Learning from experience, Background paper for the infoDev
Annual Symposium, Swiss State Secretariat for Economic Affairs.
McMillan, D and Chavis D (1986).Sense of Community: A Definition and Theory.
American Journal of Community Psychology, 14 (1), 6-23.
Micheni, E. M., Lule, I., & Muketha, G. M. (2013). Transaction costs and facilitating
conditions as indicators of the adoption of mobile money services in Kenya.
International Journal of Advanced Trends in Computer Science and Engineering
(IJATCSE), 2(5), 09-15.
130
Mohan, L. and Potnis, D. (2015). Mobile Banking for the Unbanked Poor without Mobile
Phones: Comparing Three Innovative Mobile Banking Services in India. 48th
Hawaii International Conference on System Sciences, p.2168-2176.
Morawczynski, O. (2008). Surviving in the “dual system”: How M-PESA is fostering
urban-to-rural remittances in a Kenyan Slum. Proceedings of IFIP WG Vol. 9.
Morawczynski, O., & Miscione, G. (2008). Examining trust in mobile banking
transactions: The case of M-PESA in Kenya. In Social dimensions of information
and communication technology policy (pp. 287-298). Springer US.
Narayan, D. & Nyamwaya, D. (1996). “Learning from the Poor: A Participatory Poverty
Assessment in Kenya” Washington, DC: The World Bank.
Nysveen, H., Pedersen, P. E., & Thorbjørnsen, H. (2005). Intentions to Use Mobile
Services: Antecedents and Cross-Service Comparisons. Journal of the Academy of
Marketing Science, 33(3), 330-346.
Omwansa, T. (2009). M-PESA: Progress and prospects. Innovations, 107-123.
Orlikowski, W., & Baroudi, J. (1991). Studying Information Technology in
organizations: Research approaches and Assumptions. Information system
research, 2(1), 1-28
Park, J. K., Yang, S. I. and Lehto, X. (2007). Adoption of mobile technologies for
Chinese consumers. Journal of Electronic Commerce Research, 8 (3), 196-206.
Potnis, D. D.(2014) Examining Mobile Banking in Developing Nations from Pro-Poor
“Context, Culture, and Community” Perspective. ASIST 2014 Seattle, WA, USA.
Punch, K. F. (2006). Developing Effective Research Proposals (2nd Ed.). Sage
Publication Ltd. London.
Pulver, R. (2009): The economics of branchless banking. In: Innovations 4 (2): 57-76.
MIT Press, Cambridge, Massachusetts.
Puschel, J., Mazzon, J. & Hernandez, J. M. (2010). Mobile banking: Proposition of an
integrated adoption intention framework. International Journal of Bank
Marketing, Vol. 28, No. 5: 389-409.
131
Renaud, K., & Biljon, J.V. (2008). Predicting technology acceptance and adoption
Elderly: A qualitative study. ACM International Conference Proceeding Series,
338, 210.
Ringle, C. M., Wende, S., & Will, S. (2005). SmartPLS 2.0 (M3) Beta,
Hamburg,http://www.smartpls.de.
Riquelme, H. E., & Rios, R. E. (2010). The moderating effect of gender in the adoption
of mobile banking. International Journal of Bank Marketing, 28(5), 328-341.
Rogers, E. M. (1995). Diffusion of Innovations (4th Ed.). New York: Free Press.
Sanchez-Martinez, M., & Davis, P. (2014). A review of the economic theories of poverty
(No. 435). National Institute of Economic and Social Research.
Sanfillippo, M., & Fichman, P. (2014). The evolution of social informatics research
(1984-2013): Challenges and opportunities. Social Informatics: Past, Present, and
Future (pp. 1-26). Cambridge, United Kingdom: Cambridge Scholars Publishing.
Sen, A. (1973).Poverty, Inequality, and Unemployment Some Conceptual Issues in
Measurement Economic and Political Weekly, Vol. 8, No. 31/33, Special Number
(Aug. 1973), pp.1457-1459.
Sheppard, B. H., Hartwick, J., and Warshaw, P. R. (1988). The Theory of Reasoned
Action: A Meta-Analysis of Past Research with Recommendations for
Modifications and Future Research, Journal of Consumer Research 15: 325-343.
Singh, S., Srivastava, V., and Srivastava, R. K. (2010). Customer acceptance of mobile
banking: A conceptual framework. SIES Journal of Management, 7(1), 55-64.
Somasundaram, R., & Karlsbjerg, J. (2003). Research philosophies in the IOS Adoption
fields. ECIS 2003 proceedings.
Straub, M., Loch, K., Evaristo, R., Karahanna, E. & Srite, M. (2002). 'Toward a theory-
based measurement of culture', Journal of Global Information Management, Vol.
10, No. 1, pp. 13–23.
Todaro, M.P. (2000). Economic Development. Addison Wesley Longman, Inc. Seventh
Ed.
Townsend, A M. 2000. Life in the Real-Time City: Mobile Telephones and Urban
Metabolism. Journal of Urban Technology, pp. 85-104.
132
Urbach, N., & Ahlemann, F. (2010). Structural equation modeling in information systems
research using partial least squares. Journal of Information Technology Theory
and Application, 11(2), 5-40.
Van Biljon, J., & Kotzé, P. (2008). Cultural Factors in a Mobile Phone Adoption and
Usage Model. Journal of Universal Computer Science, vol. 14, no. 16, 2650-
2679.
Venkatesh, V. & Zhang, X. (2010) “Unified theory of acceptance and use of technology:
U.S. vs. China,” Journal o*f Global Information Technology Management, Vol.
13, No. 1: 5-27, 2010.
Venkatesh, V. and Davis, F.D. (2000). A theoretical extension of the technology
acceptance model: four longitudinal field studies, Management Science, Vol. 46,
no. (2), 186-204.
Venkatesh, V., Morris M. G., Davis, G. B., & Davis, F. D. (2003) “User acceptance of
information technology: Toward a unified view,” MIS Quarterly, Vol. 27, no. 3,
425-478.
Wamuyu, P.K. (2014). The role of contextual factors in the uptake and continuance of
mobile money usage in Kenya, The Electronic Journal of Information Systems in
Developing Countries 64, 4, 1-19.
Wilson, W. J. (1996). When work disappears. Political Science Quarterly, 567-595.
Woolcock, M., & Narayan, D. (2000). Social capital: Implications for development
theory, research, and policy. The World Bank research observer, 15(2), 225-249.
Wold, S., A. Ruhe, H. Wold, & W. J. Dunn III, “The Collinearity Problem in Linear
Regression: The Partial Least Squares (PLS) Approach to Generalized Inverses,”
SIAM Journal of Scientific and Statistic Computing, Vol. 5: 735-743, 1984.
Wu, J.-H., & Wang, S. (2005).What drives mobile commerce? An empirical evaluation
of the revised technology acceptance model. Information & Management, 42(5),
719.
Yang, K. (2004). A comparison of attitudes towards Internet advertising among lifestyle
segments in Taiwan. Journal of Marketing Communications, Vol. 10, No. 1: 195.
133
Yu, C. (2012) "Factors Affecting Individuals to Adopt Mobile Banking: Empirical
Evidence from the UTAUT Model," Journal of Electronic Commerce Research,
Vol. 13, No. 2: 104-121, 2012.
Zheng, X., & Chen, D. (2003, June). Study of mobile payments system. In E-Commerce,
2003. CEC 2003. IEEE International Conference on (pp. 24-27). IEEE.
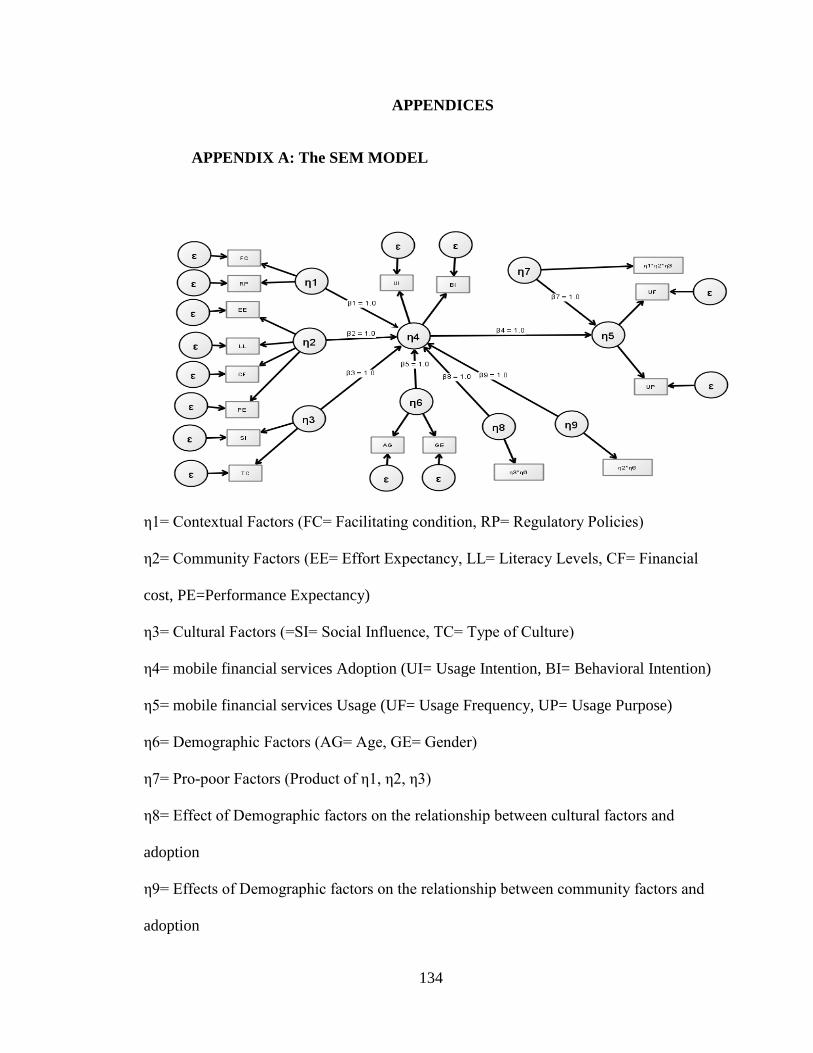
134
APPENDICES
APPENDIX A: The SEM MODEL
η1= Contextual Factors (FC= Facilitating condition, RP= Regulatory Policies)
η2= Community Factors (EE= Effort Expectancy, LL= Literacy Levels, CF= Financial
cost, PE=Performance Expectancy)
η3= Cultural Factors (=SI= Social Influence, TC= Type of Culture)
η4= mobile financial services Adoption (UI= Usage Intention, BI= Behavioral Intention)
η5= mobile financial services Usage (UF= Usage Frequency, UP= Usage Purpose)
η6= Demographic Factors (AG= Age, GE= Gender)
η7= Pro-poor Factors (Product of η1, η2, η3)
η8= Effect of Demographic factors on the relationship between cultural factors and
adoption
η9= Effects of Demographic factors on the relationship between community factors and
adoption

135
APPENDIX B: The Questionnaire
Dear respondent,
I am a Doctoral candidate at the University of Nairobi pursuing PhD in Business
Administration. The purpose of this survey is to investigate the effects of pro-poor factors
on adoption and usage of mobile financial services by the poor in Kenya. The
information you provide will be used strictly for academic purpose and will be treated
with utmost confidentiality. Thank you for your participation. Please answer ALL
questions in ALL sections in this questionnaire. Completion of this form will take you
10-15 minutes.
Date: Location: ………………………..
Section A: Demographics Factors
In this section, we would like you to fill in some of your personal details. Please tick your
answer and your answers will be kept strictly confidential.
1. What is your gender?
Male Female
2. What is your age …………………….?
Section B: Adoption of Mobile Financial Services
Please respond to the questions below by ticking the appropriate box
3. What is your level of education?
Primary School
Secondary School
College Diploma
University Degree
4. Do you have a phone?
Yes No
5. Are u sharing a phone with someone else?
Yes No
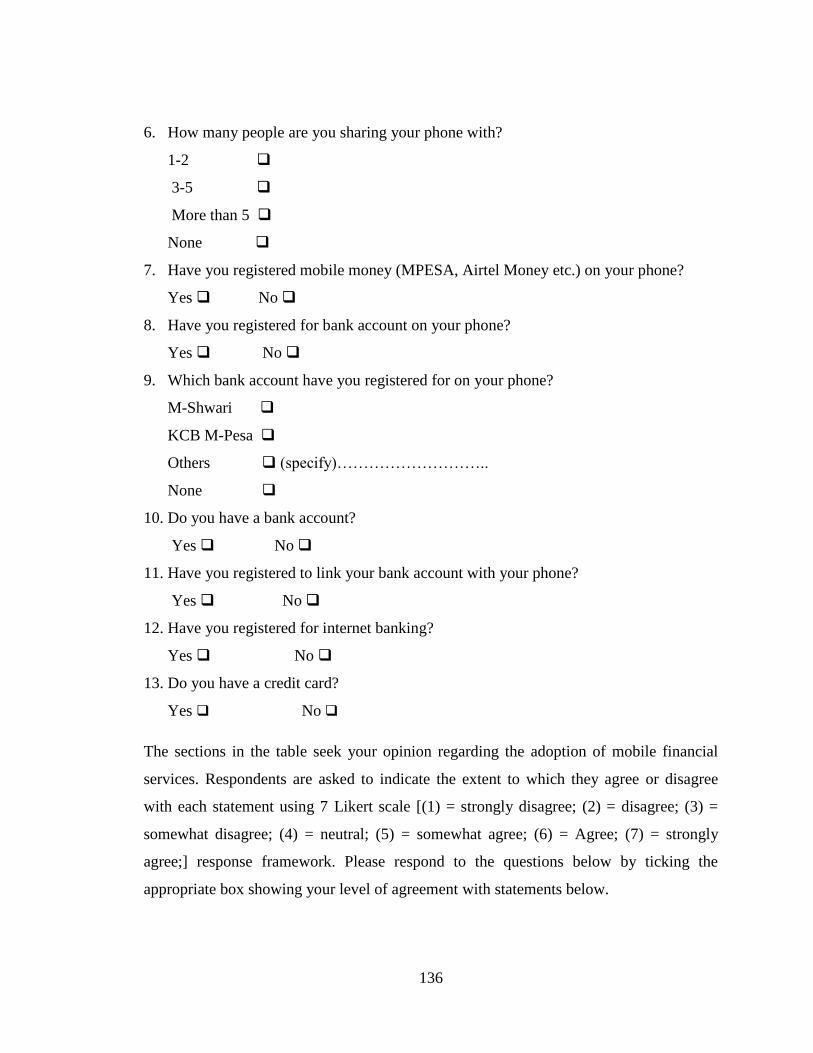
136
6. How many people are you sharing your phone with?
1-2
3-5
More than 5
None
7. Have you registered mobile money (MPESA, Airtel Money etc.) on your phone?
Yes No
8. Have you registered for bank account on your phone?
Yes No
9. Which bank account have you registered for on your phone?
M-Shwari
KCB M-Pesa
Others (specify)………………………..
None
10. Do you have a bank account?
Yes No
11. Have you registered to link your bank account with your phone?
Yes No
12. Have you registered for internet banking?
Yes No
13. Do you have a credit card?
Yes No
The sections in the table seek your opinion regarding the adoption of mobile financial
services. Respondents are asked to indicate the extent to which they agree or disagree
with each statement using 7 Likert scale [(1) = strongly disagree; (2) = disagree; (3) =
somewhat disagree; (4) = neutral; (5) = somewhat agree; (6) = Agree; (7) = strongly
agree;] response framework. Please respond to the questions below by ticking the
appropriate box showing your level of agreement with statements below.
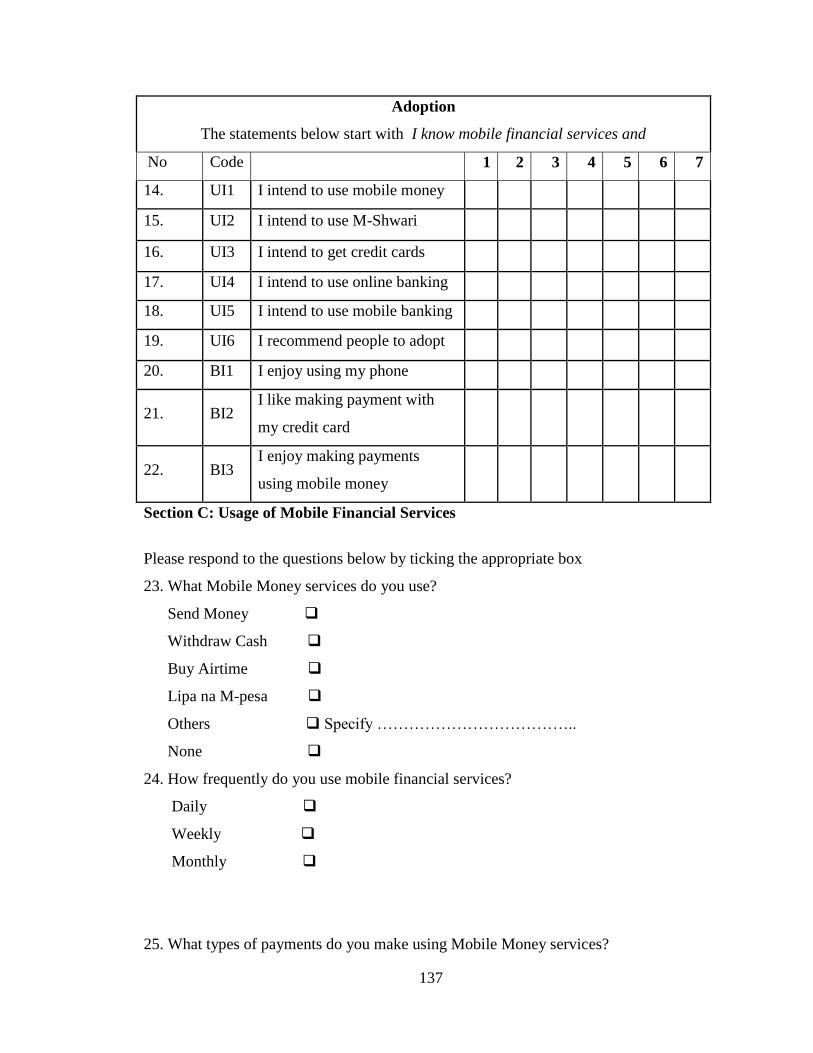
137
Adoption
The statements below start with I know mobile financial services and
No Code 1 2 3 4 5 6 7
14. UI1 I intend to use mobile money
15. UI2 I intend to use M-Shwari
16. UI3 I intend to get credit cards
17. UI4 I intend to use online banking
18. UI5 I intend to use mobile banking
19. UI6 I recommend people to adopt
20. BI1 I enjoy using my phone
21. BI2 I like making payment with
my credit card
22. BI3 I enjoy making payments
using mobile money
Section C: Usage of Mobile Financial Services
Please respond to the questions below by ticking the appropriate box
23. What Mobile Money services do you use?
Send Money
Withdraw Cash
Buy Airtime
Lipa na M-pesa
Others Specify ………………………………..
None
24. How frequently do you use mobile financial services?
Daily
Weekly
Monthly
25. What types of payments do you make using Mobile Money services?
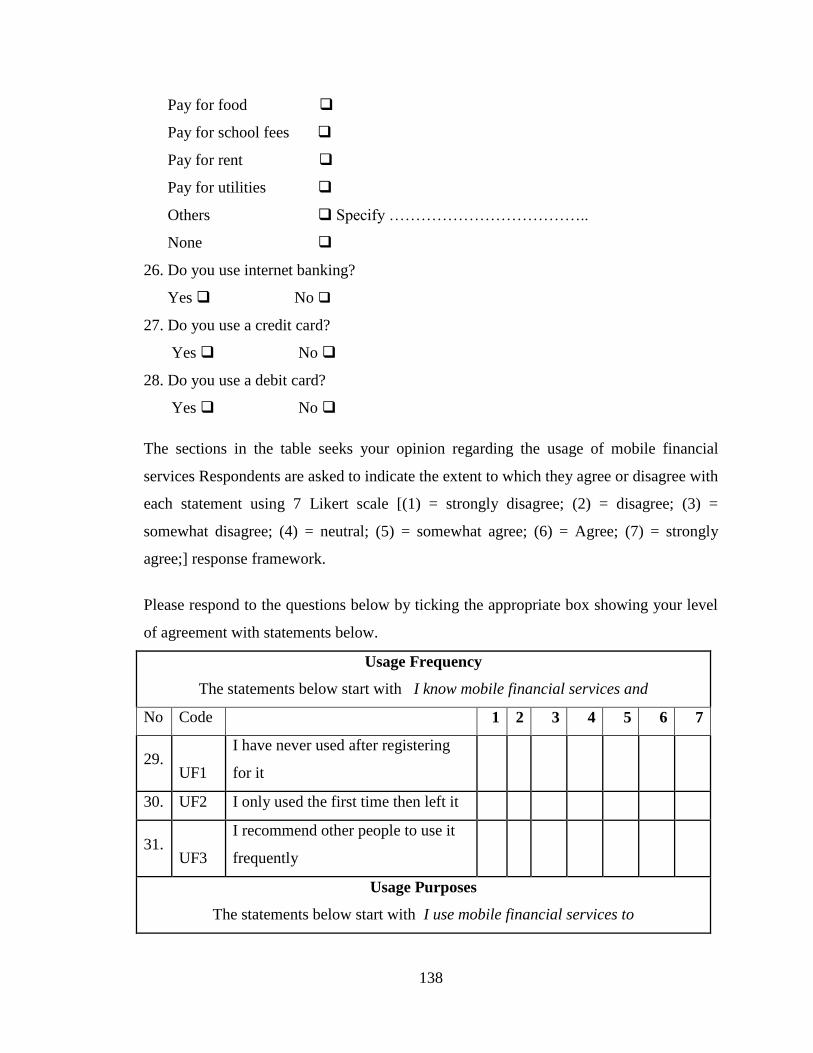
138
Pay for food
Pay for school fees
Pay for rent
Pay for utilities
Others Specify ………………………………..
None
26. Do you use internet banking?
Yes No
27. Do you use a credit card?
Yes No
28. Do you use a debit card?
Yes No
The sections in the table seeks your opinion regarding the usage of mobile financial
services Respondents are asked to indicate the extent to which they agree or disagree with
each statement using 7 Likert scale [(1) = strongly disagree; (2) = disagree; (3) =
somewhat disagree; (4) = neutral; (5) = somewhat agree; (6) = Agree; (7) = strongly
agree;] response framework.
Please respond to the questions below by ticking the appropriate box showing your level
of agreement with statements below.
Usage Frequency
The statements below start with I know mobile financial services and
No Code 1 2 3 4 5 6 7
29. UF1
I have never used after registering
for it
30. UF2 I only used the first time then left it
31. UF3
I recommend other people to use it
frequently
Usage Purposes
The statements below start with I use mobile financial services to
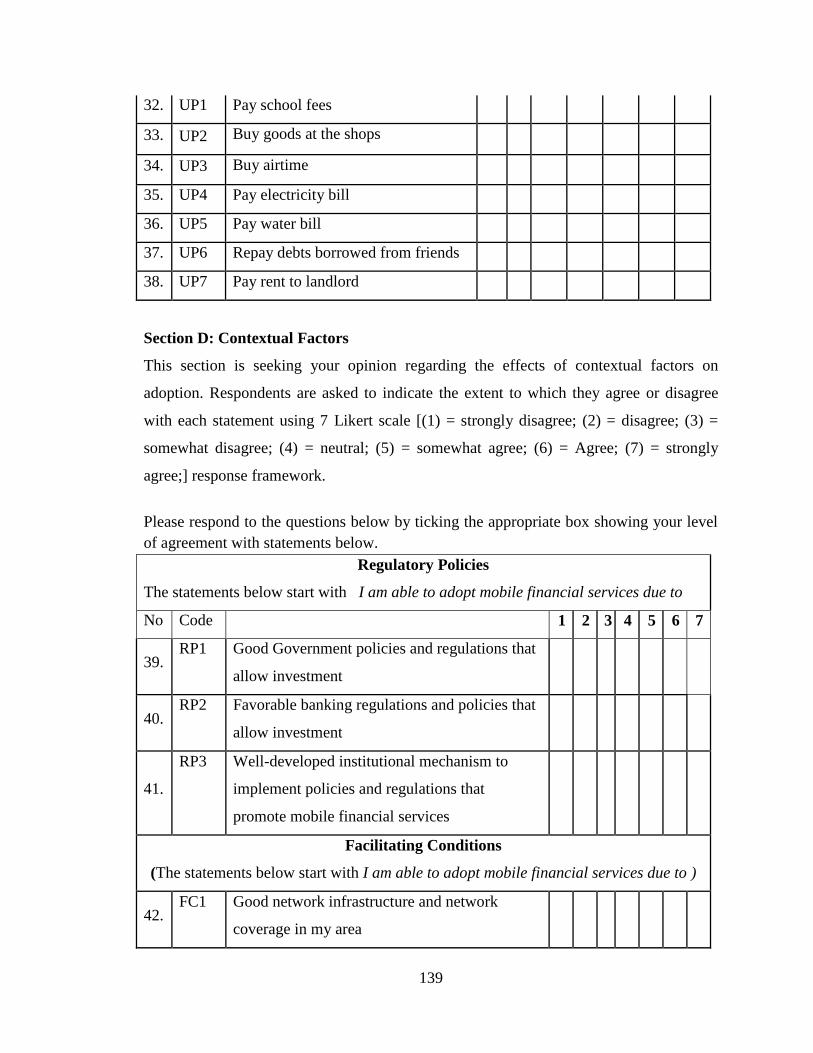
139
32. UP1 Pay school fees
33. UP2 Buy goods at the shops
34. UP3 Buy airtime
35. UP4 Pay electricity bill
36. UP5 Pay water bill
37. UP6 Repay debts borrowed from friends
38. UP7 Pay rent to landlord
Section D: Contextual Factors
This section is seeking your opinion regarding the effects of contextual factors on
adoption. Respondents are asked to indicate the extent to which they agree or disagree
with each statement using 7 Likert scale [(1) = strongly disagree; (2) = disagree; (3) =
somewhat disagree; (4) = neutral; (5) = somewhat agree; (6) = Agree; (7) = strongly
agree;] response framework.
Please respond to the questions below by ticking the appropriate box showing your level
of agreement with statements below.
Regulatory Policies
The statements below start with I am able to adopt mobile financial services due to
No Code 1 2 3 4 5 6 7
39. RP1 Good Government policies and regulations that
allow investment
40. RP2 Favorable banking regulations and policies that
allow investment
41.
RP3 Well-developed institutional mechanism to
implement policies and regulations that
promote mobile financial services
Facilitating Conditions
(The statements below start with I am able to adopt mobile financial services due to )
42. FC1 Good network infrastructure and network
coverage in my area
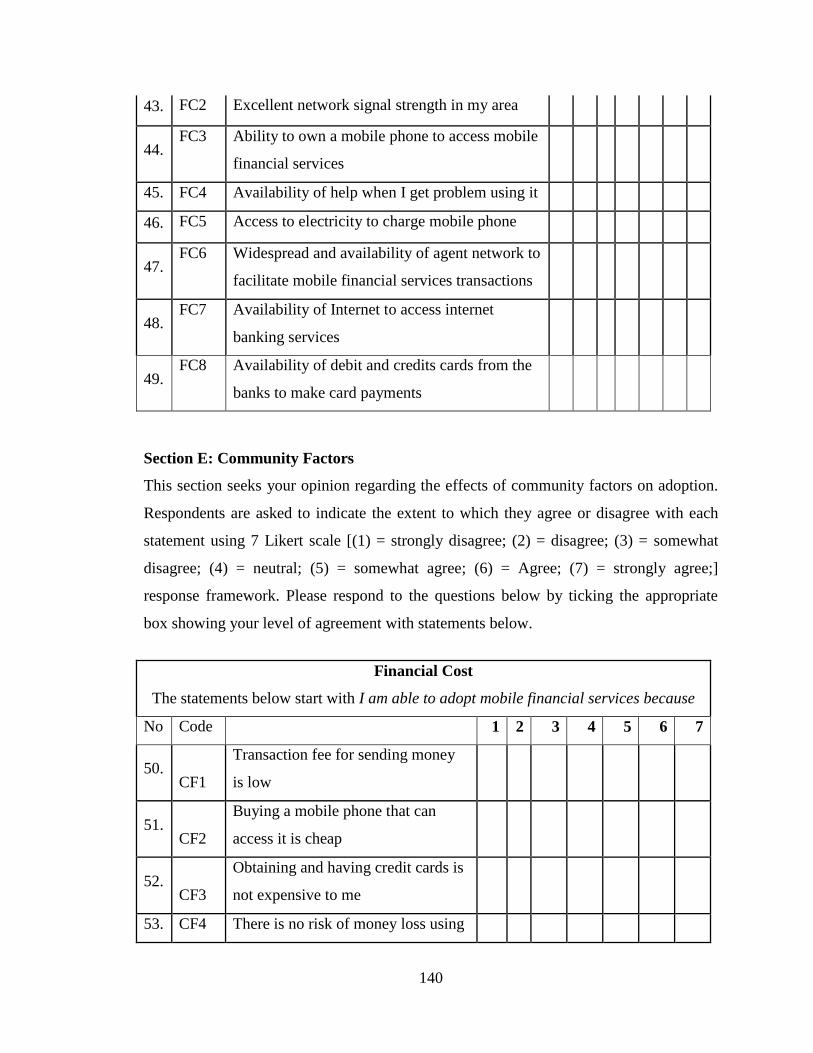
140
43. FC2 Excellent network signal strength in my area
44. FC3 Ability to own a mobile phone to access mobile
financial services
45. FC4 Availability of help when I get problem using it
46. FC5 Access to electricity to charge mobile phone
47. FC6 Widespread and availability of agent network to
facilitate mobile financial services transactions
48. FC7 Availability of Internet to access internet
banking services
49. FC8 Availability of debit and credits cards from the
banks to make card payments
Section E: Community Factors
This section seeks your opinion regarding the effects of community factors on adoption.
Respondents are asked to indicate the extent to which they agree or disagree with each
statement using 7 Likert scale [(1) = strongly disagree; (2) = disagree; (3) = somewhat
disagree; (4) = neutral; (5) = somewhat agree; (6) = Agree; (7) = strongly agree;]
response framework. Please respond to the questions below by ticking the appropriate
box showing your level of agreement with statements below.
Financial Cost
The statements below start with I am able to adopt mobile financial services because
No Code 1 2 3 4 5 6 7
50. CF1
Transaction fee for sending money
is low
51. CF2
Buying a mobile phone that can
access it is cheap
52. CF3
Obtaining and having credit cards is
not expensive to me
53. CF4 There is no risk of money loss using
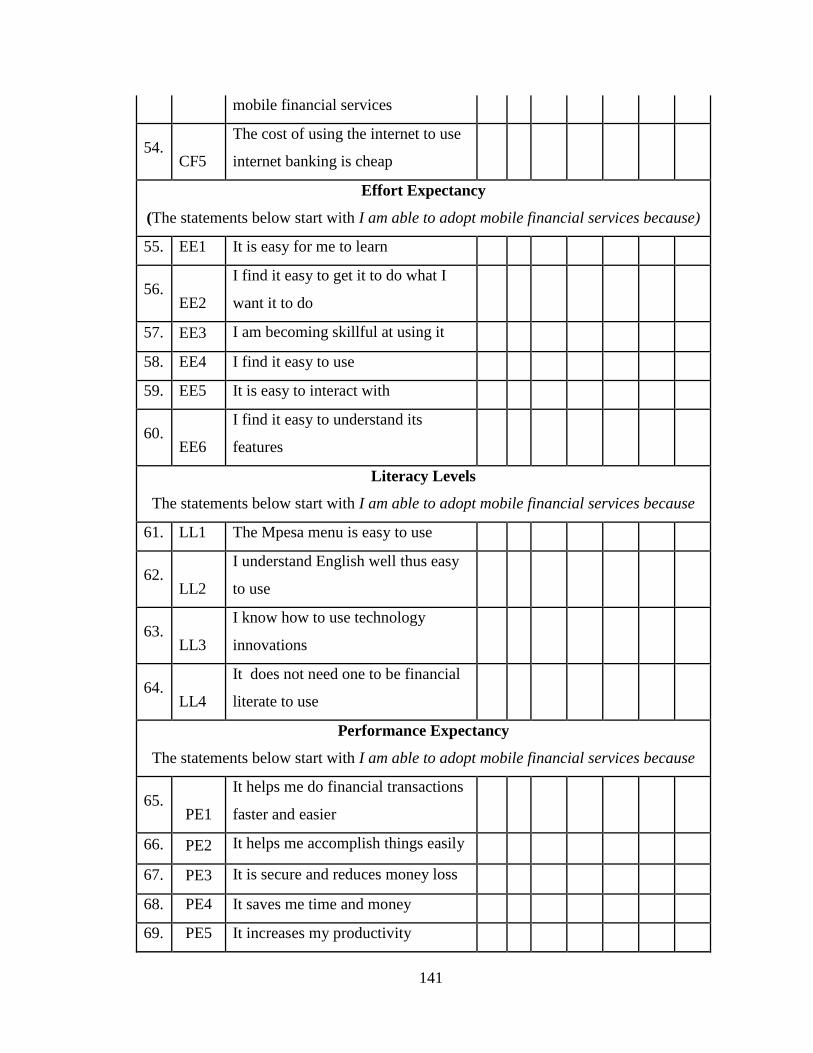
141
mobile financial services
54. CF5
The cost of using the internet to use
internet banking is cheap
Effort Expectancy
(The statements below start with I am able to adopt mobile financial services because)
55. EE1 It is easy for me to learn
56. EE2
I find it easy to get it to do what I
want it to do
57. EE3 I am becoming skillful at using it
58. EE4 I find it easy to use
59. EE5 It is easy to interact with
60. EE6
I find it easy to understand its
features
Literacy Levels
The statements below start with I am able to adopt mobile financial services because
61. LL1 The Mpesa menu is easy to use
62. LL2
I understand English well thus easy
to use
63. LL3
I know how to use technology
innovations
64. LL4
It does not need one to be financial
literate to use
Performance Expectancy
The statements below start with I am able to adopt mobile financial services because
65. PE1
It helps me do financial transactions
faster and easier
66. PE2 It helps me accomplish things easily
67. PE3 It is secure and reduces money loss
68. PE4 It saves me time and money
69. PE5 It increases my productivity
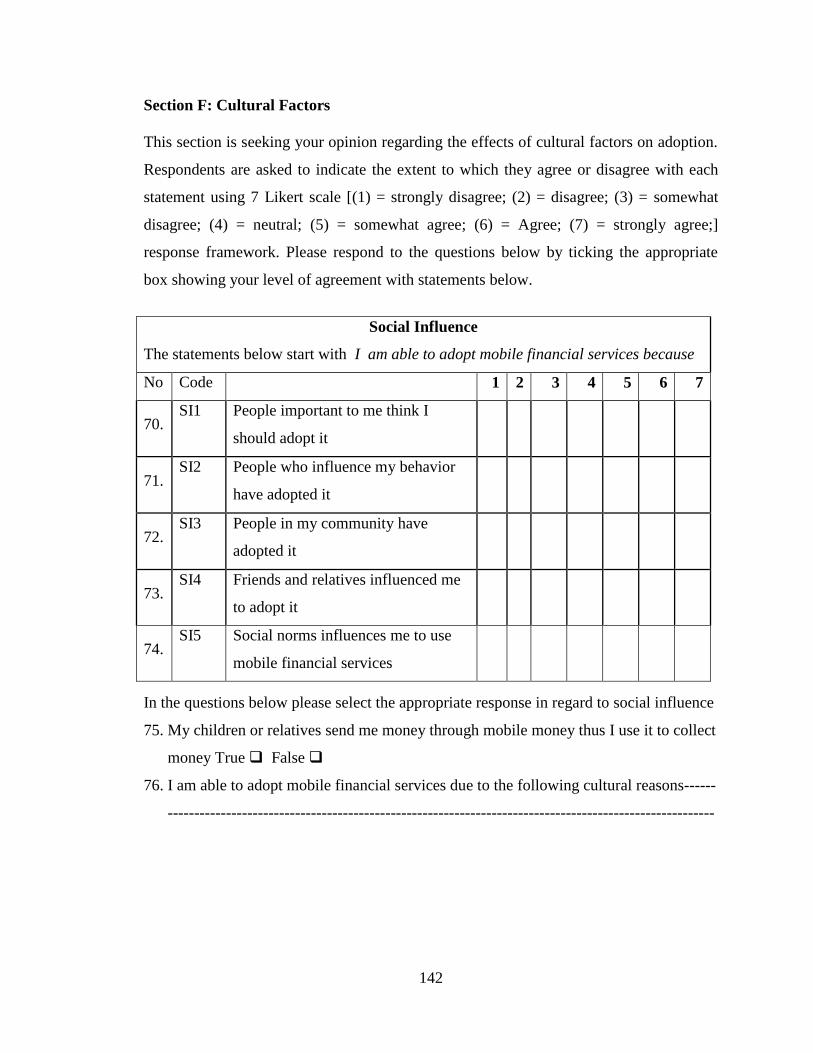
142
Section F: Cultural Factors
This section is seeking your opinion regarding the effects of cultural factors on adoption.
Respondents are asked to indicate the extent to which they agree or disagree with each
statement using 7 Likert scale [(1) = strongly disagree; (2) = disagree; (3) = somewhat
disagree; (4) = neutral; (5) = somewhat agree; (6) = Agree; (7) = strongly agree;]
response framework. Please respond to the questions below by ticking the appropriate
box showing your level of agreement with statements below.
Social Influence
The statements below start with I am able to adopt mobile financial services because
No Code 1 2 3 4 5 6 7
70. SI1 People important to me think I
should adopt it
71. SI2 People who influence my behavior
have adopted it
72. SI3 People in my community have
adopted it
73. SI4 Friends and relatives influenced me
to adopt it
74. SI5 Social norms influences me to use
mobile financial services
In the questions below please select the appropriate response in regard to social influence
75. My children or relatives send me money through mobile money thus I use it to collect
money True False
76. I am able to adopt mobile financial services due to the following cultural reasons------
-------------------------------------------------------------------------------------------------------
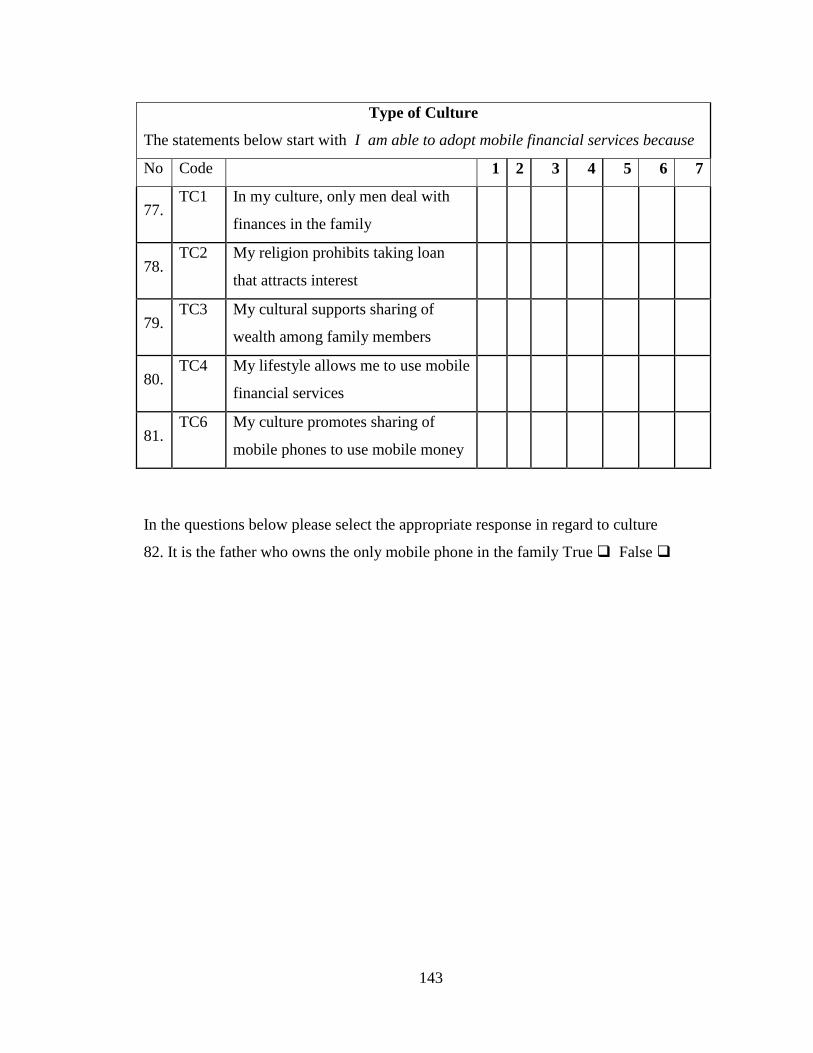
143
Type of Culture
The statements below start with I am able to adopt mobile financial services because
No Code 1 2 3 4 5 6 7
77. TC1 In my culture, only men deal with
finances in the family
78. TC2 My religion prohibits taking loan
that attracts interest
79. TC3 My cultural supports sharing of
wealth among family members
80. TC4 My lifestyle allows me to use mobile
financial services
81. TC6 My culture promotes sharing of
mobile phones to use mobile money
In the questions below please select the appropriate response in regard to culture
82. It is the father who owns the only mobile phone in the family True False
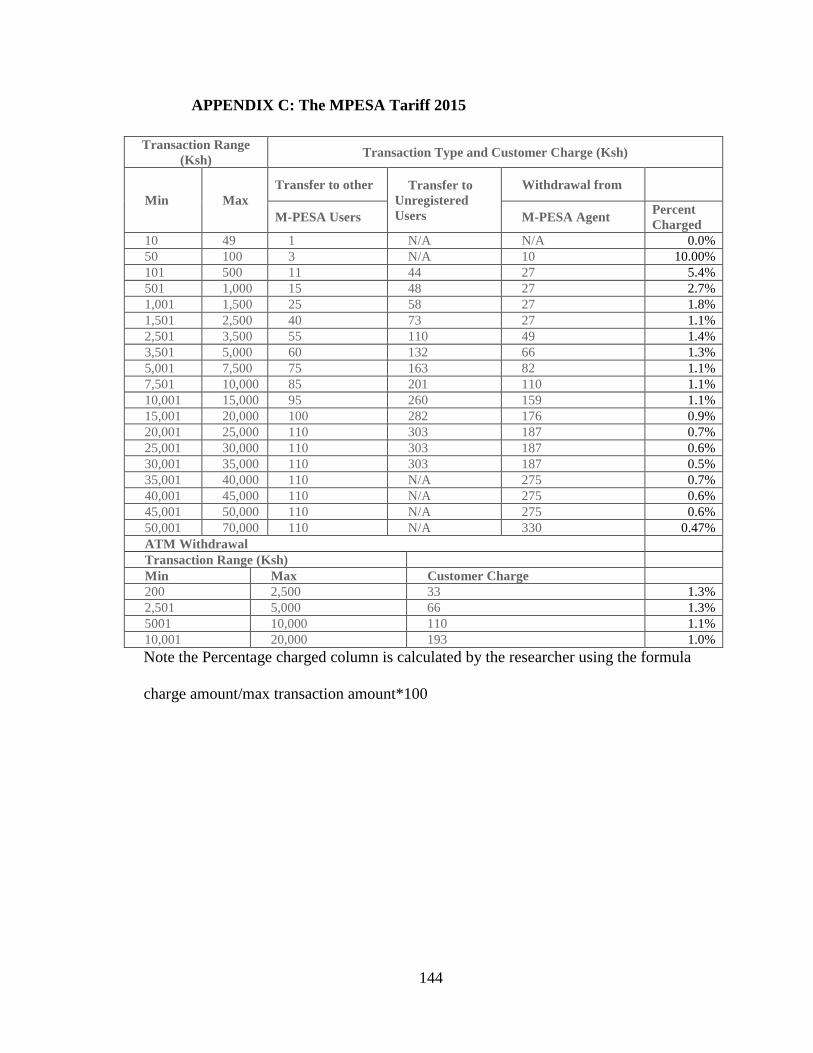
144
APPENDIX C: The MPESA Tariff 2015
Transaction Range
(Ksh) Transaction Type and Customer Charge (Ksh)
Min Max
Transfer to other Transfer to
Unregistered
Users
Withdrawal from
M-PESA Users M-PESA Agent Percent
Charged
10 49 1 N/A N/A 0.0%
50 100 3 N/A 10 10.00%
101 500 11 44 27 5.4%
501 1,000 15 48 27 2.7%
1,001 1,500 25 58 27 1.8%
1,501 2,500 40 73 27 1.1%
2,501 3,500 55 110 49 1.4%
3,501 5,000 60 132 66 1.3%
5,001 7,500 75 163 82 1.1%
7,501 10,000 85 201 110 1.1%
10,001 15,000 95 260 159 1.1%
15,001 20,000 100 282 176 0.9%
20,001 25,000 110 303 187 0.7%
25,001 30,000 110 303 187 0.6%
30,001 35,000 110 303 187 0.5%
35,001 40,000 110 N/A 275 0.7%
40,001 45,000 110 N/A 275 0.6%
45,001 50,000 110 N/A 275 0.6%
50,001 70,000 110 N/A 330 0.47%
ATM Withdrawal
Transaction Range (Ksh)
Min Max Customer Charge
200 2,500 33 1.3%
2,501 5,000 66 1.3%
5001 10,000 110 1.1%
10,001 20,000 193 1.0%
Note the Percentage charged column is calculated by the researcher using the formula
charge amount/max transaction amount*100
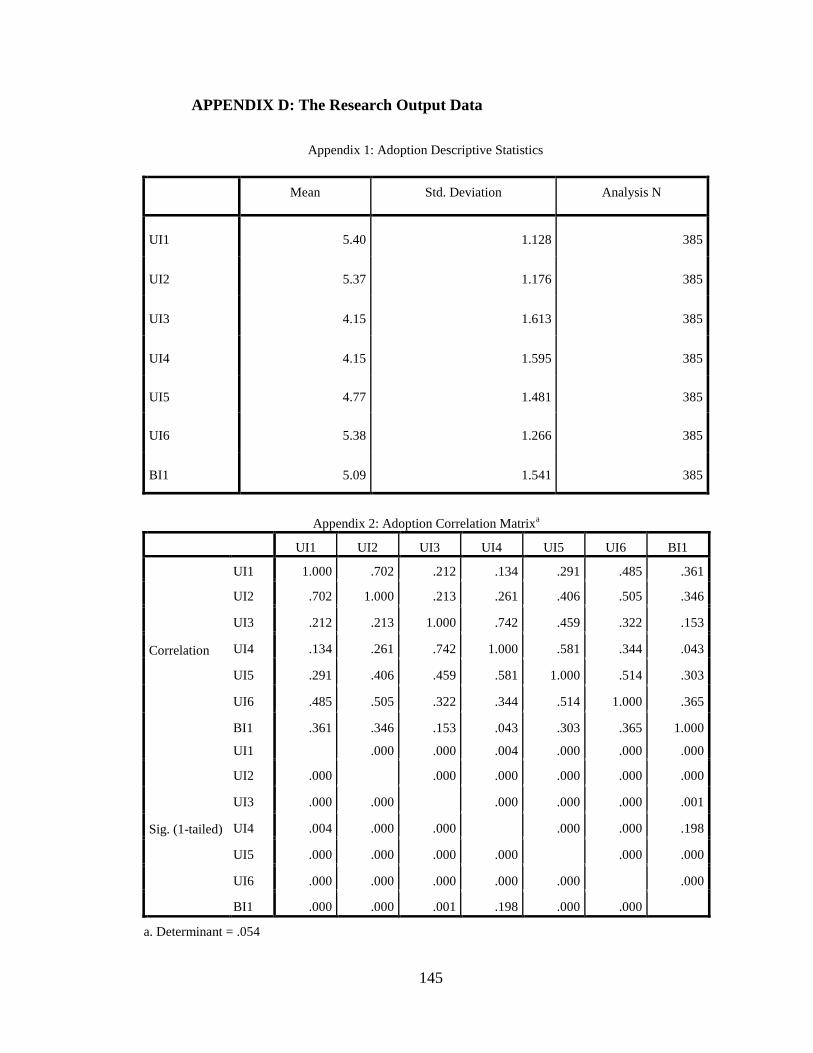
145
APPENDIX D: The Research Output Data
Appendix 1: Adoption Descriptive Statistics
Mean Std. Deviation Analysis N
UI1 5.40 1.128 385
UI2 5.37 1.176 385
UI3 4.15 1.613 385
UI4 4.15 1.595 385
UI5 4.77 1.481 385
UI6 5.38 1.266 385
BI1 5.09 1.541 385
Appendix 2: Adoption Correlation Matrixa
UI1 UI2 UI3 UI4 UI5 UI6 BI1
Correlation
UI1 1.000 .702 .212 .134 .291 .485 .361
UI2 .702 1.000 .213 .261 .406 .505 .346
UI3 .212 .213 1.000 .742 .459 .322 .153
UI4 .134 .261 .742 1.000 .581 .344 .043
UI5 .291 .406 .459 .581 1.000 .514 .303
UI6 .485 .505 .322 .344 .514 1.000 .365
BI1 .361 .346 .153 .043 .303 .365 1.000
Sig. (1-tailed)
UI1
.000 .000 .004 .000 .000 .000
UI2 .000
.000 .000 .000 .000 .000
UI3 .000 .000
.000 .000 .000 .001
UI4 .004 .000 .000
.000 .000 .198
UI5 .000 .000 .000 .000
.000 .000
UI6 .000 .000 .000 .000 .000
.000
BI1 .000 .000 .001 .198 .000 .000
a. Determinant = .054
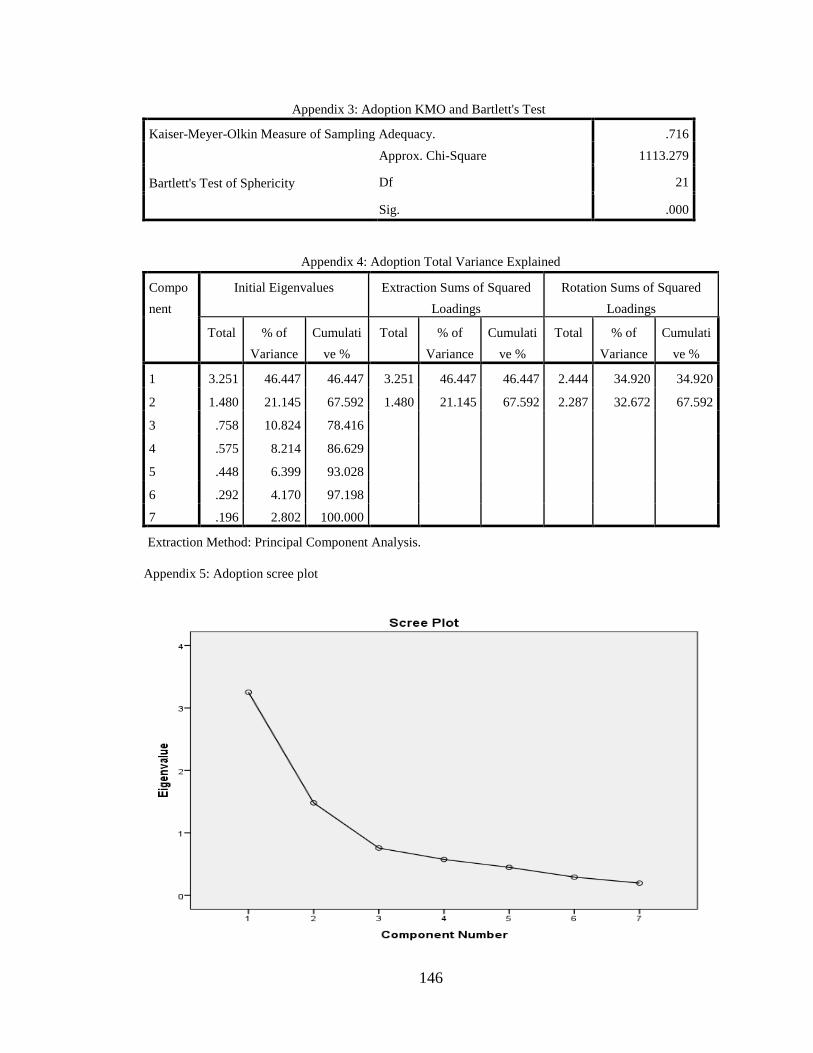
146
Appendix 3: Adoption KMO and Bartlett's Test
Kaiser-Meyer-Olkin Measure of Sampling Adequacy. .716
Bartlett's Test of Sphericity
Approx. Chi-Square 1113.279
Df 21
Sig. .000
Appendix 4: Adoption Total Variance Explained
Compo
nent
Initial Eigenvalues Extraction Sums of Squared
Loadings
Rotation Sums of Squared
Loadings
Total % of
Variance
Cumulati
ve %
Total % of
Variance
Cumulati
ve %
Total % of
Variance
Cumulati
ve %
1 3.251 46.447 46.447 3.251 46.447 46.447 2.444 34.920 34.920
2 1.480 21.145 67.592 1.480 21.145 67.592 2.287 32.672 67.592
3 .758 10.824 78.416
4 .575 8.214 86.629
5 .448 6.399 93.028
6 .292 4.170 97.198
7 .196 2.802 100.000
Extraction Method: Principal Component Analysis.
Appendix 5: Adoption scree plot
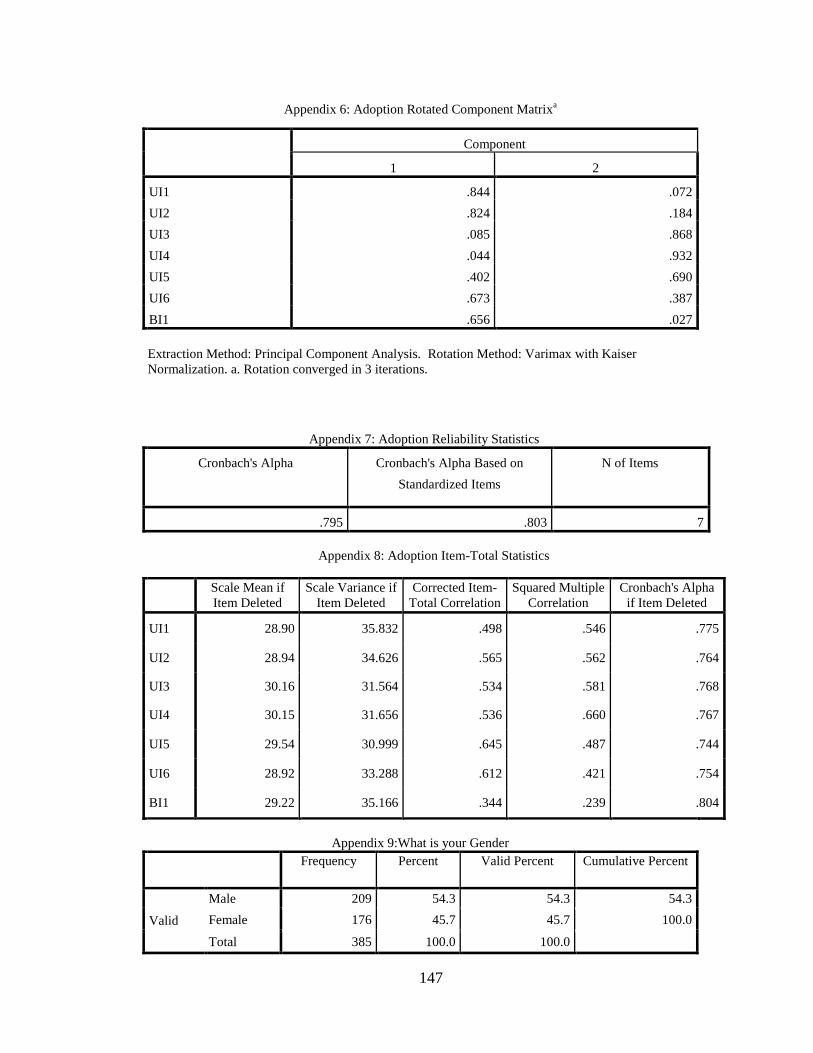
147
Appendix 6: Adoption Rotated Component Matrixa
Component
1 2
UI1 .844 .072
UI2 .824 .184
UI3 .085 .868
UI4 .044 .932
UI5 .402 .690
UI6 .673 .387
BI1 .656 .027
Extraction Method: Principal Component Analysis. Rotation Method: Varimax with Kaiser
Normalization. a. Rotation converged in 3 iterations.
Appendix 7: Adoption Reliability Statistics
Cronbach's Alpha Cronbach's Alpha Based on
Standardized Items
N of Items
.795 .803 7
Appendix 8: Adoption Item-Total Statistics
Scale Mean if
Item Deleted
Scale Variance if
Item Deleted
Corrected Item-
Total Correlation
Squared Multiple
Correlation
Cronbach's Alpha
if Item Deleted
UI1 28.90 35.832 .498 .546 .775
UI2 28.94 34.626 .565 .562 .764
UI3 30.16 31.564 .534 .581 .768
UI4 30.15 31.656 .536 .660 .767
UI5 29.54 30.999 .645 .487 .744
UI6 28.92 33.288 .612 .421 .754
BI1 29.22 35.166 .344 .239 .804
Appendix 9:What is your Gender
Frequency Percent Valid Percent Cumulative Percent
Valid
Male 209 54.3 54.3 54.3
Female 176 45.7 45.7 100.0
Total 385 100.0 100.0
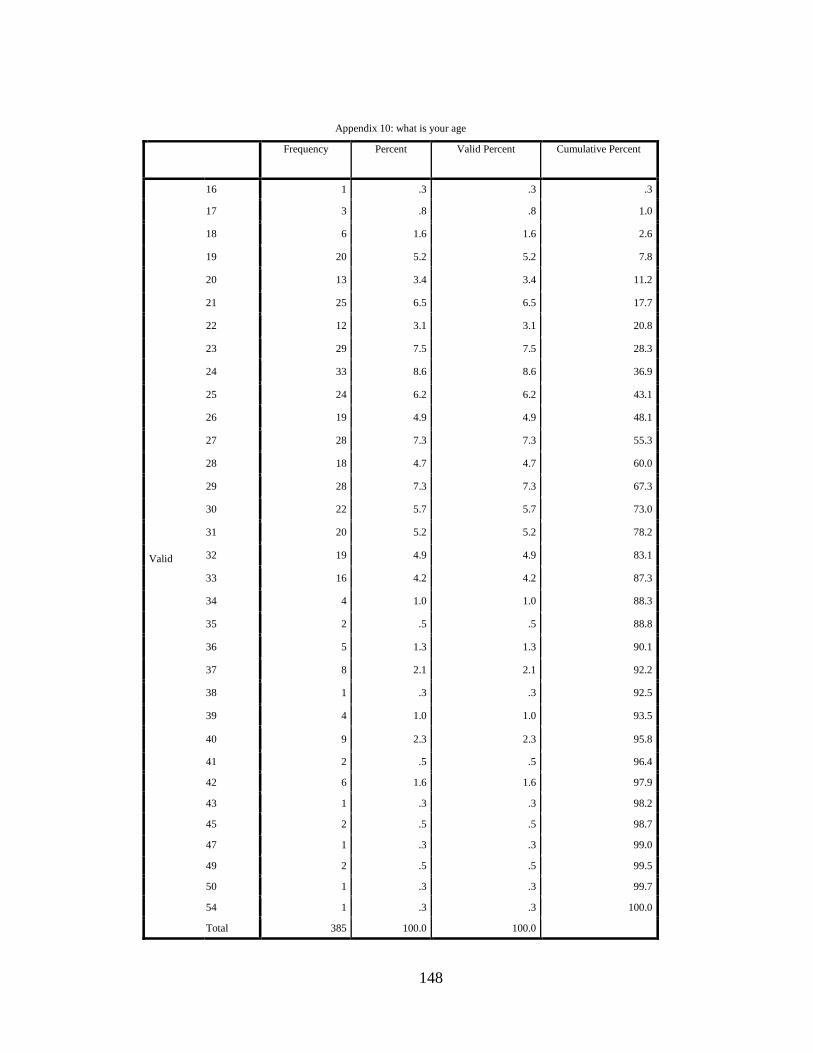
148
Appendix 10: what is your age
Frequency Percent Valid Percent Cumulative Percent
Valid
16 1 .3 .3 .3
17 3 .8 .8 1.0
18 6 1.6 1.6 2.6
19 20 5.2 5.2 7.8
20 13 3.4 3.4 11.2
21 25 6.5 6.5 17.7
22 12 3.1 3.1 20.8
23 29 7.5 7.5 28.3
24 33 8.6 8.6 36.9
25 24 6.2 6.2 43.1
26 19 4.9 4.9 48.1
27 28 7.3 7.3 55.3
28 18 4.7 4.7 60.0
29 28 7.3 7.3 67.3
30 22 5.7 5.7 73.0
31 20 5.2 5.2 78.2
32 19 4.9 4.9 83.1
33 16 4.2 4.2 87.3
34 4 1.0 1.0 88.3
35 2 .5 .5 88.8
36 5 1.3 1.3 90.1
37 8 2.1 2.1 92.2
38 1 .3 .3 92.5
39 4 1.0 1.0 93.5
40 9 2.3 2.3 95.8
41 2 .5 .5 96.4
42 6 1.6 1.6 97.9
43 1 .3 .3 98.2
45 2 .5 .5 98.7
47 1 .3 .3 99.0
49 2 .5 .5 99.5
50 1 .3 .3 99.7
54 1 .3 .3 100.0
Total 385 100.0 100.0
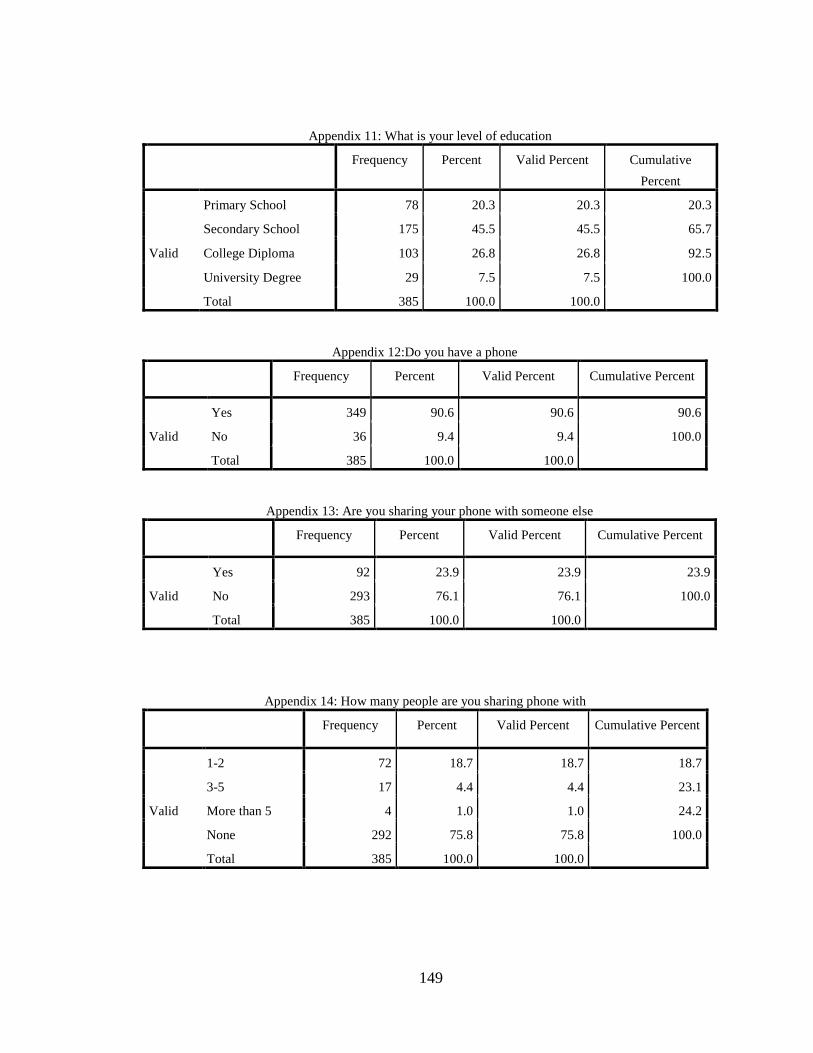
149
Appendix 11: What is your level of education
Frequency Percent Valid Percent Cumulative
Percent
Valid
Primary School 78 20.3 20.3 20.3
Secondary School 175 45.5 45.5 65.7
College Diploma 103 26.8 26.8 92.5
University Degree 29 7.5 7.5 100.0
Total 385 100.0 100.0
Appendix 12:Do you have a phone
Frequency Percent Valid Percent Cumulative Percent
Valid
Yes 349 90.6 90.6 90.6
No 36 9.4 9.4 100.0
Total 385 100.0 100.0
Appendix 13: Are you sharing your phone with someone else
Frequency Percent Valid Percent Cumulative Percent
Valid
Yes 92 23.9 23.9 23.9
No 293 76.1 76.1 100.0
Total 385 100.0 100.0
Appendix 14: How many people are you sharing phone with
Frequency Percent Valid Percent Cumulative Percent
Valid
1-2 72 18.7 18.7 18.7
3-5 17 4.4 4.4 23.1
More than 5 4 1.0 1.0 24.2
None 292 75.8 75.8 100.0
Total 385 100.0 100.0
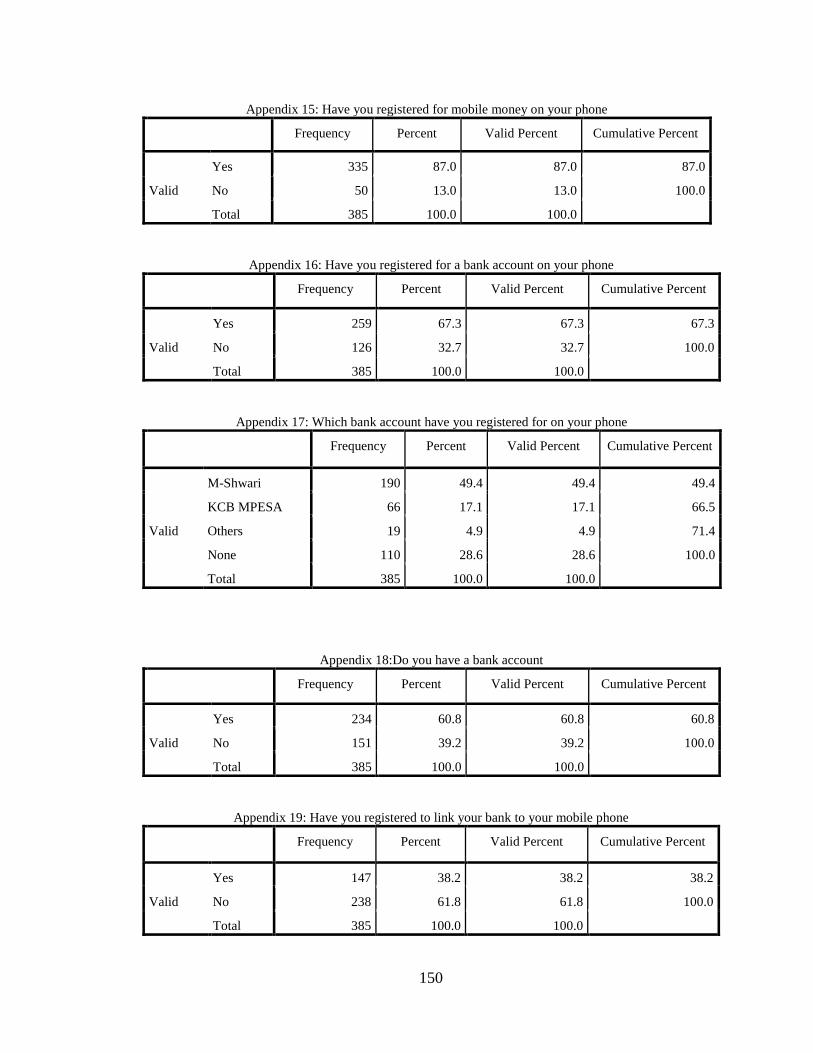
150
Appendix 15: Have you registered for mobile money on your phone
Frequency Percent Valid Percent Cumulative Percent
Valid
Yes 335 87.0 87.0 87.0
No 50 13.0 13.0 100.0
Total 385 100.0 100.0
Appendix 16: Have you registered for a bank account on your phone
Frequency Percent Valid Percent Cumulative Percent
Valid
Yes 259 67.3 67.3 67.3
No 126 32.7 32.7 100.0
Total 385 100.0 100.0
Appendix 17: Which bank account have you registered for on your phone
Frequency Percent Valid Percent Cumulative Percent
Valid
M-Shwari 190 49.4 49.4 49.4
KCB MPESA 66 17.1 17.1 66.5
Others 19 4.9 4.9 71.4
None 110 28.6 28.6 100.0
Total 385 100.0 100.0
Appendix 18:Do you have a bank account
Frequency Percent Valid Percent Cumulative Percent
Valid
Yes 234 60.8 60.8 60.8
No 151 39.2 39.2 100.0
Total 385 100.0 100.0
Appendix 19: Have you registered to link your bank to your mobile phone
Frequency Percent Valid Percent Cumulative Percent
Valid
Yes 147 38.2 38.2 38.2
No 238 61.8 61.8 100.0
Total 385 100.0 100.0
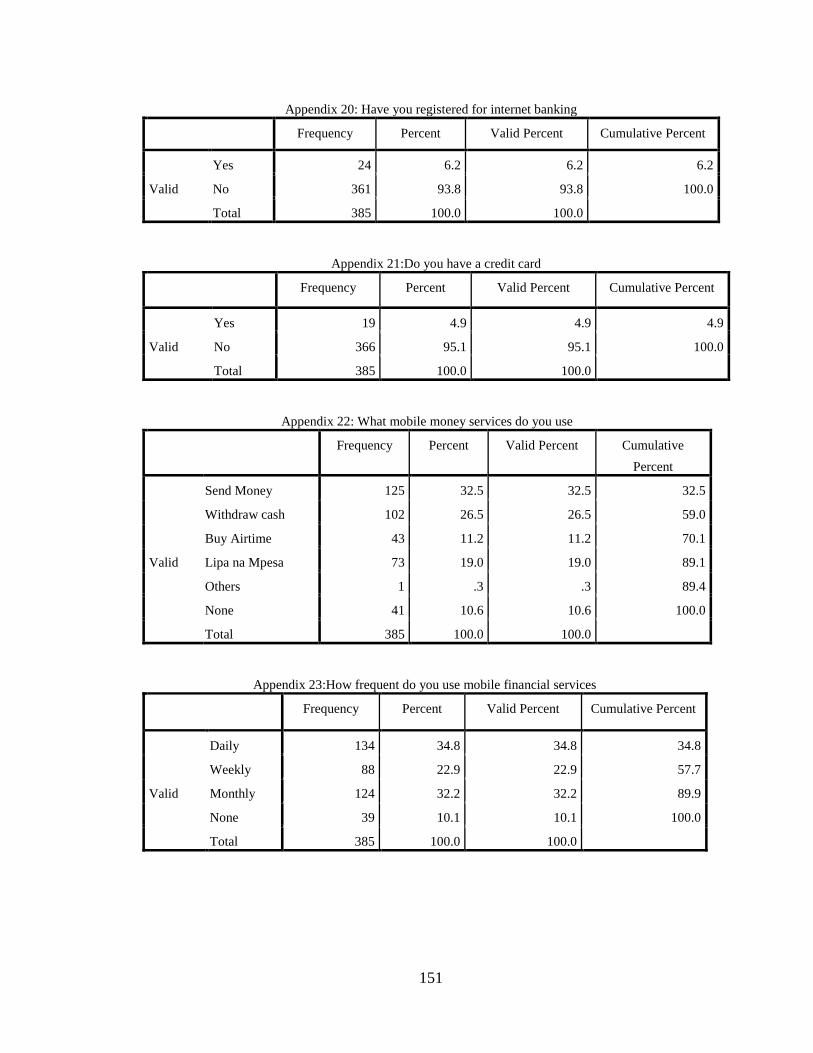
151
Appendix 20: Have you registered for internet banking
Frequency Percent Valid Percent Cumulative Percent
Valid
Yes 24 6.2 6.2 6.2
No 361 93.8 93.8 100.0
Total 385 100.0 100.0
Appendix 21:Do you have a credit card
Frequency Percent Valid Percent Cumulative Percent
Valid
Yes 19 4.9 4.9 4.9
No 366 95.1 95.1 100.0
Total 385 100.0 100.0
Appendix 22: What mobile money services do you use
Frequency Percent Valid Percent Cumulative
Percent
Valid
Send Money 125 32.5 32.5 32.5
Withdraw cash 102 26.5 26.5 59.0
Buy Airtime 43 11.2 11.2 70.1
Lipa na Mpesa 73 19.0 19.0 89.1
Others 1 .3 .3 89.4
None 41 10.6 10.6 100.0
Total 385 100.0 100.0
Appendix 23:How frequent do you use mobile financial services
Frequency Percent Valid Percent Cumulative Percent
Valid
Daily 134 34.8 34.8 34.8
Weekly 88 22.9 22.9 57.7
Monthly 124 32.2 32.2 89.9
None 39 10.1 10.1 100.0
Total 385 100.0 100.0
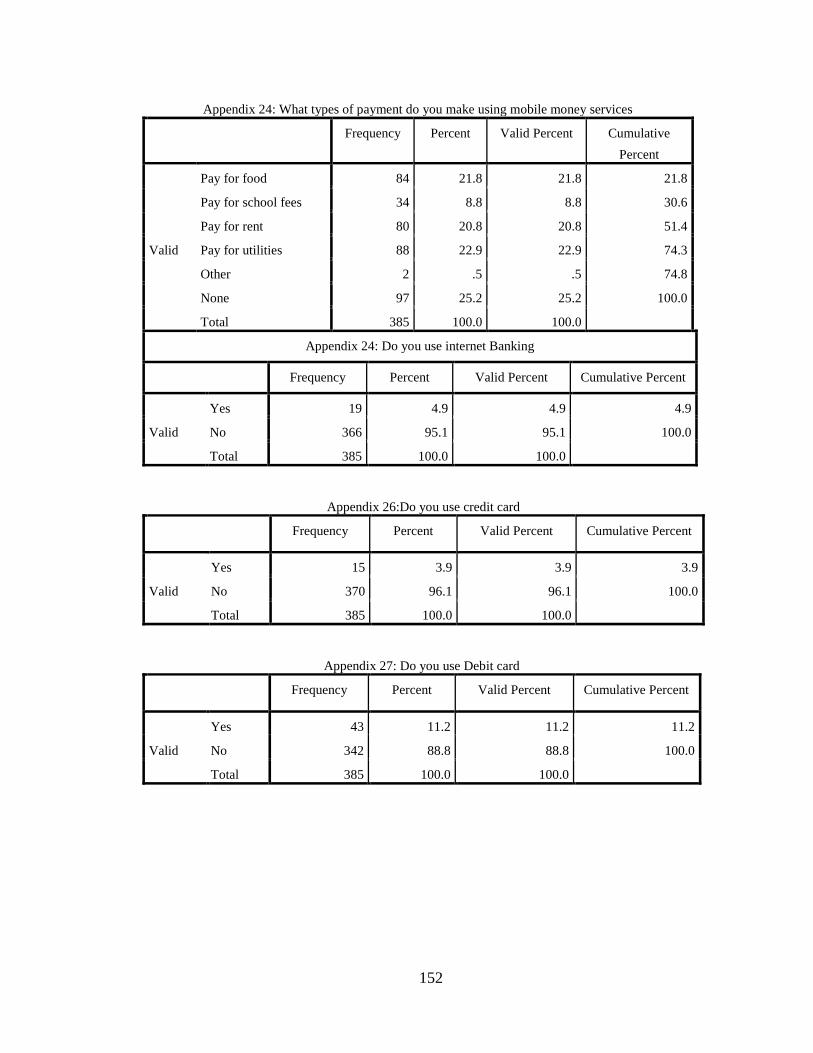
152
Appendix 24: What types of payment do you make using mobile money services
Frequency Percent Valid Percent Cumulative
Percent
Valid
Pay for food 84 21.8 21.8 21.8
Pay for school fees 34 8.8 8.8 30.6
Pay for rent 80 20.8 20.8 51.4
Pay for utilities 88 22.9 22.9 74.3
Other 2 .5 .5 74.8
None 97 25.2 25.2 100.0
Total 385 100.0 100.0
Appendix 24: Do you use internet Banking
Frequency Percent Valid Percent Cumulative Percent
Valid
Yes 19 4.9 4.9 4.9
No 366 95.1 95.1 100.0
Total 385 100.0 100.0
Appendix 26:Do you use credit card
Frequency Percent Valid Percent Cumulative Percent
Valid
Yes 15 3.9 3.9 3.9
No 370 96.1 96.1 100.0
Total 385 100.0 100.0
Appendix 27: Do you use Debit card
Frequency Percent Valid Percent Cumulative Percent
Valid
Yes 43 11.2 11.2 11.2
No 342 88.8 88.8 100.0
Total 385 100.0 100.0
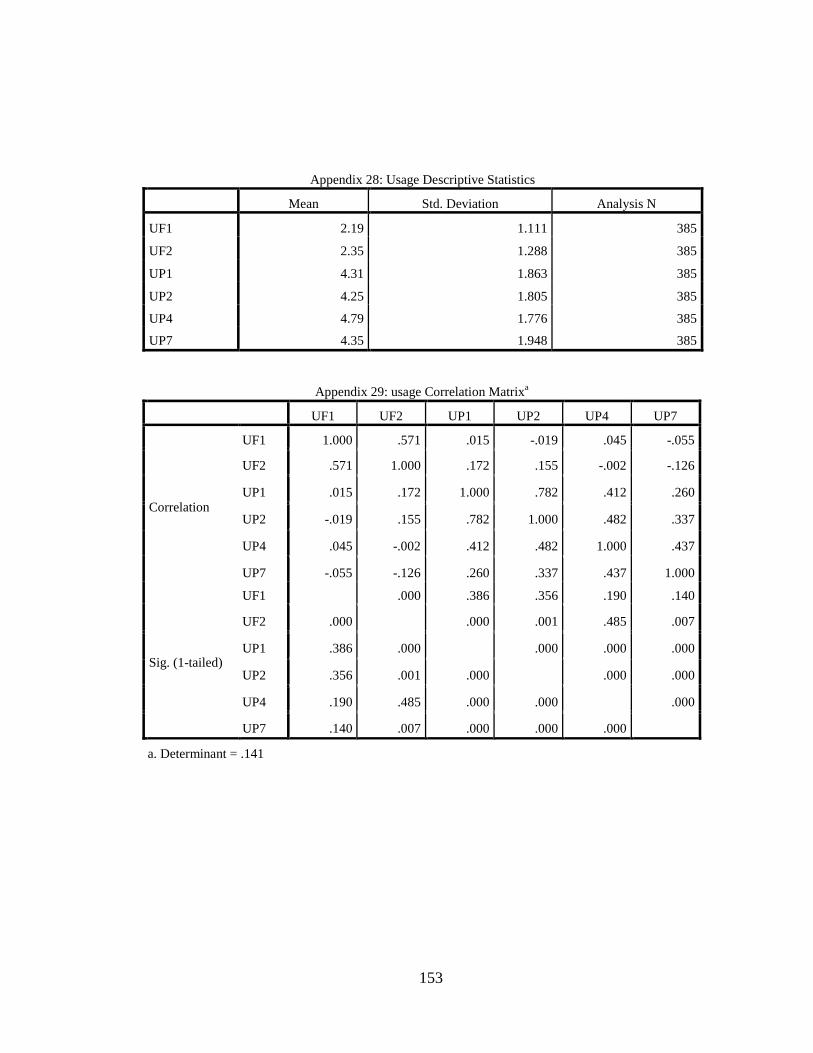
153
Appendix 28: Usage Descriptive Statistics
Mean Std. Deviation Analysis N
UF1 2.19 1.111 385
UF2 2.35 1.288 385
UP1 4.31 1.863 385
UP2 4.25 1.805 385
UP4 4.79 1.776 385
UP7 4.35 1.948 385
Appendix 29: usage Correlation Matrixa
UF1 UF2 UP1 UP2 UP4 UP7
Correlation
UF1 1.000 .571 .015 -.019 .045 -.055
UF2 .571 1.000 .172 .155 -.002 -.126
UP1 .015 .172 1.000 .782 .412 .260
UP2 -.019 .155 .782 1.000 .482 .337
UP4 .045 -.002 .412 .482 1.000 .437
UP7 -.055 -.126 .260 .337 .437 1.000
Sig. (1-tailed)
UF1
.000 .386 .356 .190 .140
UF2 .000
.000 .001 .485 .007
UP1 .386 .000
.000 .000 .000
UP2 .356 .001 .000
.000 .000
UP4 .190 .485 .000 .000
.000
UP7 .140 .007 .000 .000 .000
a. Determinant = .141
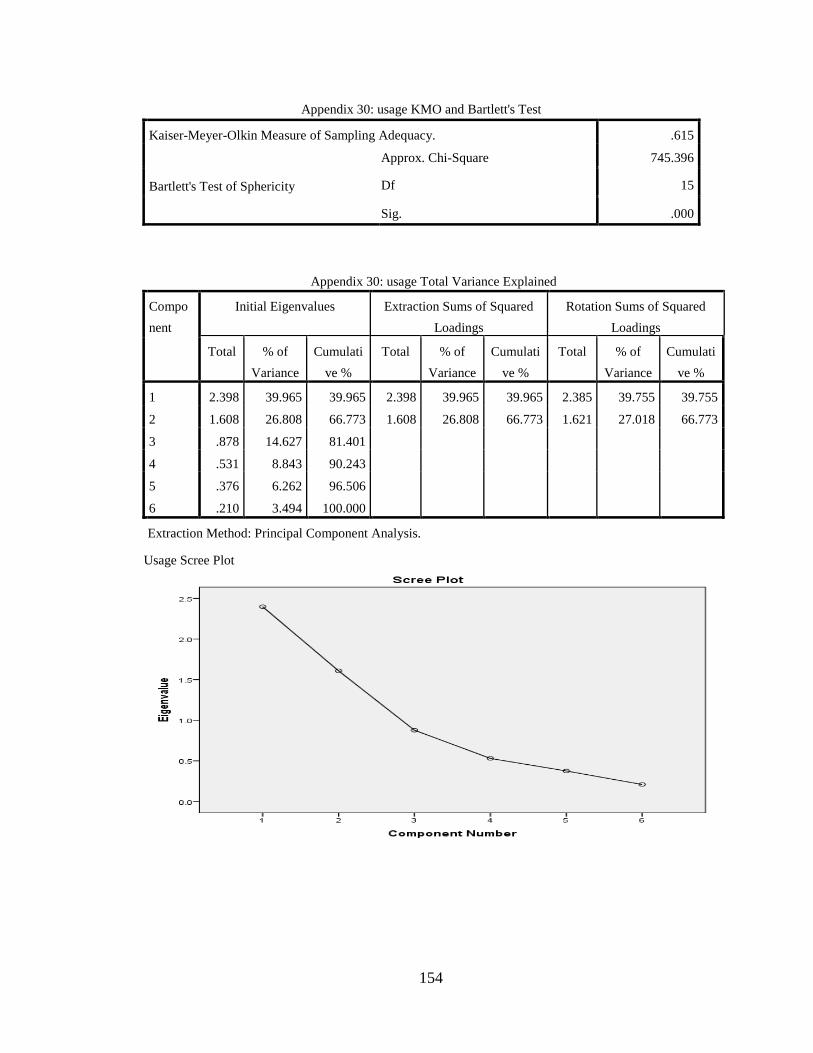
154
Appendix 30: usage KMO and Bartlett's Test
Kaiser-Meyer-Olkin Measure of Sampling Adequacy. .615
Bartlett's Test of Sphericity
Approx. Chi-Square 745.396
Df 15
Sig. .000
Appendix 30: usage Total Variance Explained
Compo
nent
Initial Eigenvalues Extraction Sums of Squared
Loadings
Rotation Sums of Squared
Loadings
Total % of
Variance
Cumulati
ve %
Total % of
Variance
Cumulati
ve %
Total % of
Variance
Cumulati
ve %
1 2.398 39.965 39.965 2.398 39.965 39.965 2.385 39.755 39.755
2 1.608 26.808 66.773 1.608 26.808 66.773 1.621 27.018 66.773
3 .878 14.627 81.401
4 .531 8.843 90.243
5 .376 6.262 96.506
6 .210 3.494 100.000
Extraction Method: Principal Component Analysis.
Usage Scree Plot
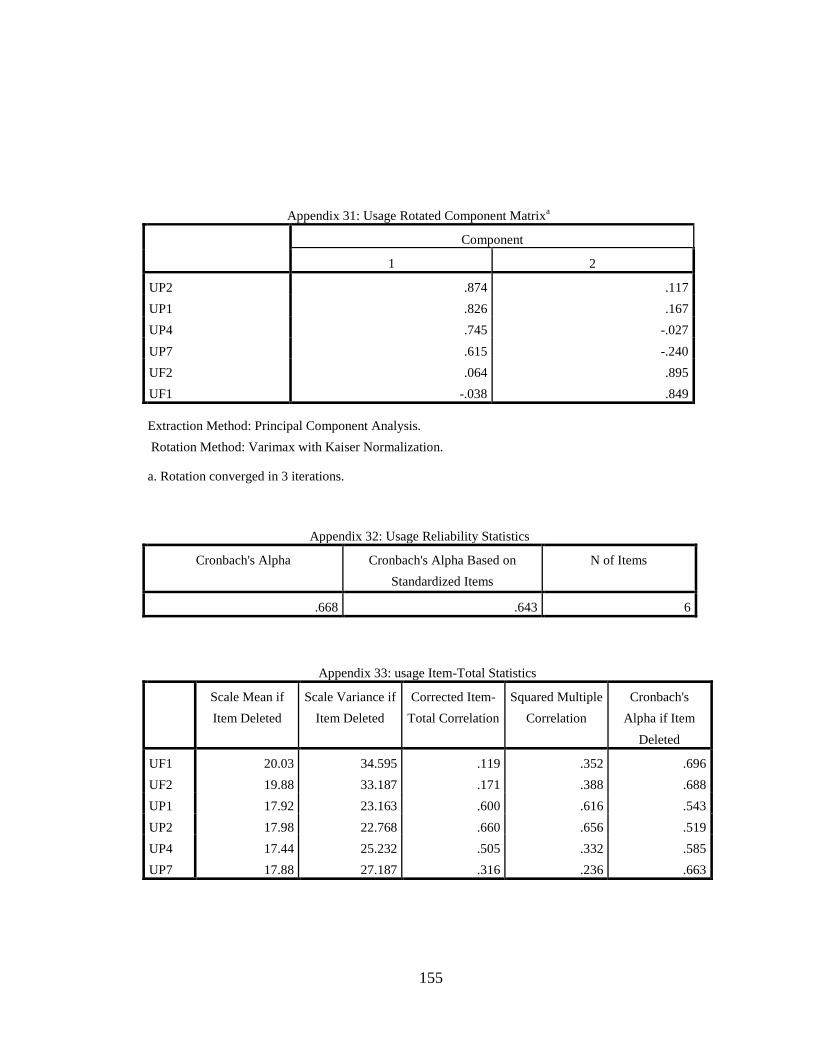
155
Appendix 31: Usage Rotated Component Matrixa
Component
1 2
UP2 .874 .117
UP1 .826 .167
UP4 .745 -.027
UP7 .615 -.240
UF2 .064 .895
UF1 -.038 .849
Extraction Method: Principal Component Analysis.
Rotation Method: Varimax with Kaiser Normalization.
a. Rotation converged in 3 iterations.
Appendix 32: Usage Reliability Statistics
Cronbach's Alpha Cronbach's Alpha Based on
Standardized Items
N of Items
.668 .643 6
Appendix 33: usage Item-Total Statistics
Scale Mean if
Item Deleted
Scale Variance if
Item Deleted
Corrected Item-
Total Correlation
Squared Multiple
Correlation
Cronbach's
Alpha if Item
Deleted
UF1 20.03 34.595 .119 .352 .696
UF2 19.88 33.187 .171 .388 .688
UP1 17.92 23.163 .600 .616 .543
UP2 17.98 22.768 .660 .656 .519
UP4 17.44 25.232 .505 .332 .585
UP7 17.88 27.187 .316 .236 .663
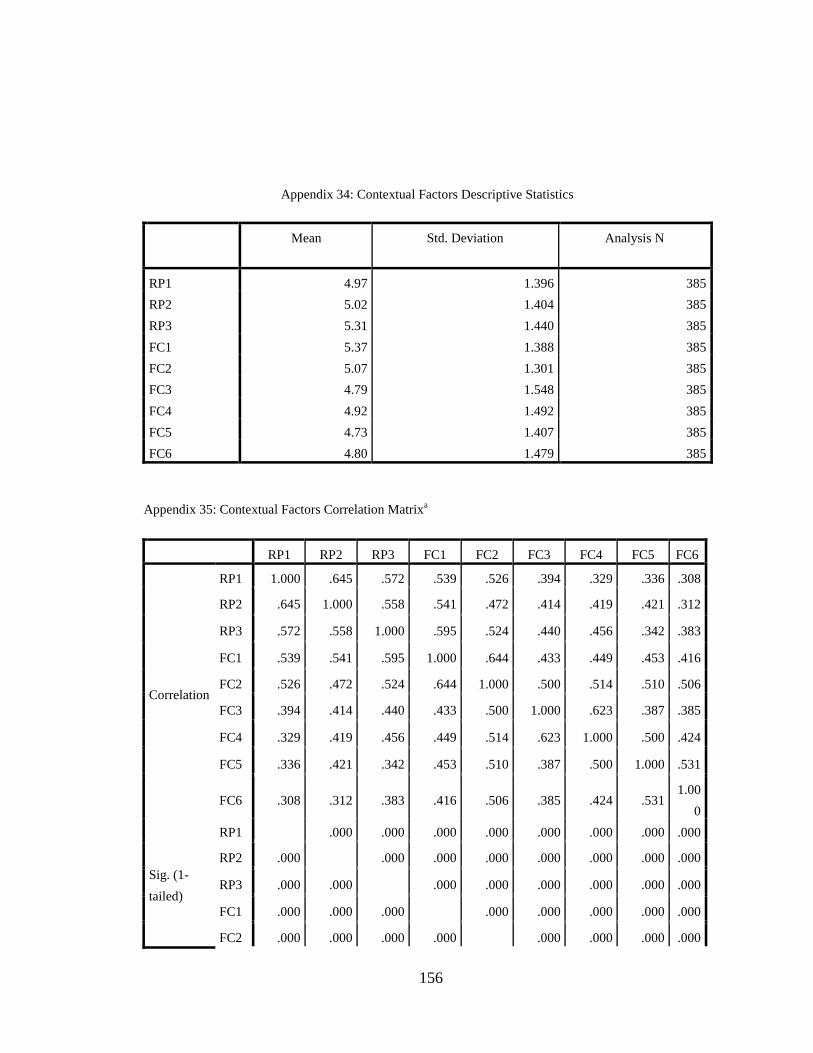
156
Appendix 34: Contextual Factors Descriptive Statistics
Mean Std. Deviation Analysis N
RP1 4.97 1.396 385
RP2 5.02 1.404 385
RP3 5.31 1.440 385
FC1 5.37 1.388 385
FC2 5.07 1.301 385
FC3 4.79 1.548 385
FC4 4.92 1.492 385
FC5 4.73 1.407 385
FC6 4.80 1.479 385
Appendix 35: Contextual Factors Correlation Matrixa
RP1 RP2 RP3 FC1 FC2 FC3 FC4 FC5 FC6
Correlation
RP1 1.000 .645 .572 .539 .526 .394 .329 .336 .308
RP2 .645 1.000 .558 .541 .472 .414 .419 .421 .312
RP3 .572 .558 1.000 .595 .524 .440 .456 .342 .383
FC1 .539 .541 .595 1.000 .644 .433 .449 .453 .416
FC2 .526 .472 .524 .644 1.000 .500 .514 .510 .506
FC3 .394 .414 .440 .433 .500 1.000 .623 .387 .385
FC4 .329 .419 .456 .449 .514 .623 1.000 .500 .424
FC5 .336 .421 .342 .453 .510 .387 .500 1.000 .531
FC6 .308 .312 .383 .416 .506 .385 .424 .531 1.00
0
Sig. (1-
tailed)
RP1
.000 .000 .000 .000 .000 .000 .000 .000
RP2 .000
.000 .000 .000 .000 .000 .000 .000
RP3 .000 .000
.000 .000 .000 .000 .000 .000
FC1 .000 .000 .000
.000 .000 .000 .000 .000
FC2 .000 .000 .000 .000
.000 .000 .000 .000
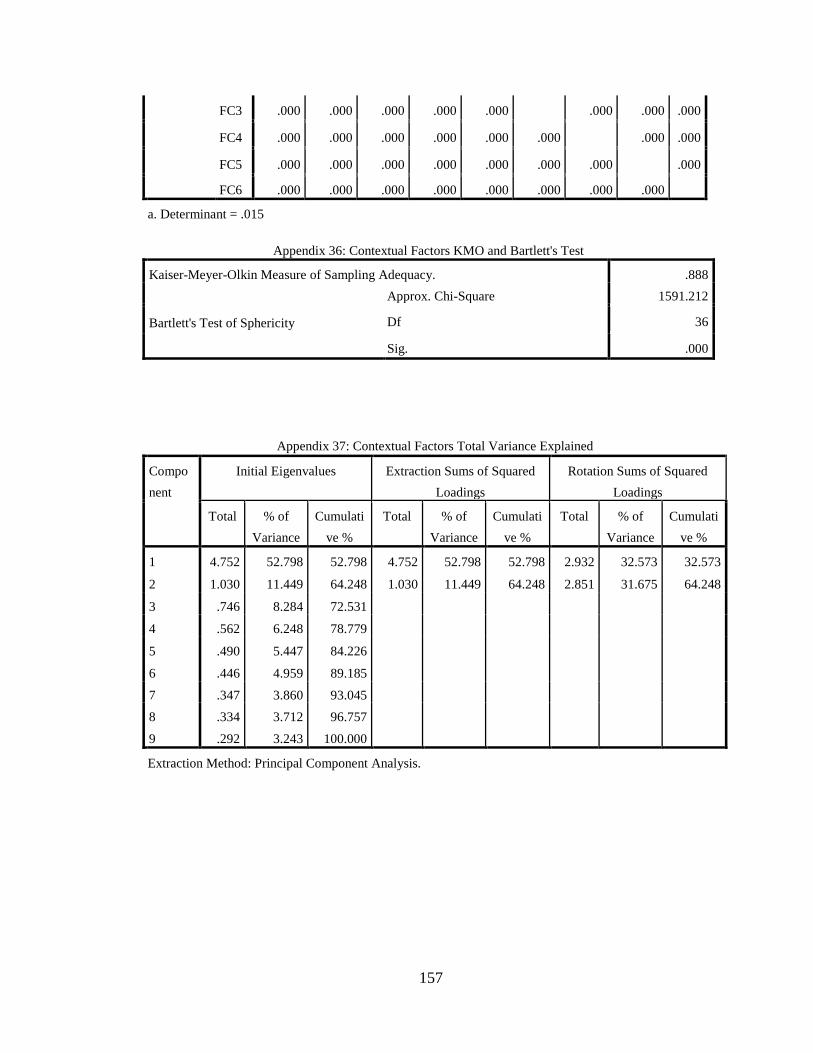
157
FC3 .000 .000 .000 .000 .000
.000 .000 .000
FC4 .000 .000 .000 .000 .000 .000
.000 .000
FC5 .000 .000 .000 .000 .000 .000 .000
.000
FC6 .000 .000 .000 .000 .000 .000 .000 .000
a. Determinant = .015
Appendix 36: Contextual Factors KMO and Bartlett's Test
Kaiser-Meyer-Olkin Measure of Sampling Adequacy. .888
Bartlett's Test of Sphericity
Approx. Chi-Square 1591.212
Df 36
Sig. .000
Appendix 37: Contextual Factors Total Variance Explained
Compo
nent
Initial Eigenvalues Extraction Sums of Squared
Loadings
Rotation Sums of Squared
Loadings
Total % of
Variance
Cumulati
ve %
Total % of
Variance
Cumulati
ve %
Total % of
Variance
Cumulati
ve %
1 4.752 52.798 52.798 4.752 52.798 52.798 2.932 32.573 32.573
2 1.030 11.449 64.248 1.030 11.449 64.248 2.851 31.675 64.248
3 .746 8.284 72.531
4 .562 6.248 78.779
5 .490 5.447 84.226
6 .446 4.959 89.185
7 .347 3.860 93.045
8 .334 3.712 96.757
9 .292 3.243 100.000
Extraction Method: Principal Component Analysis.
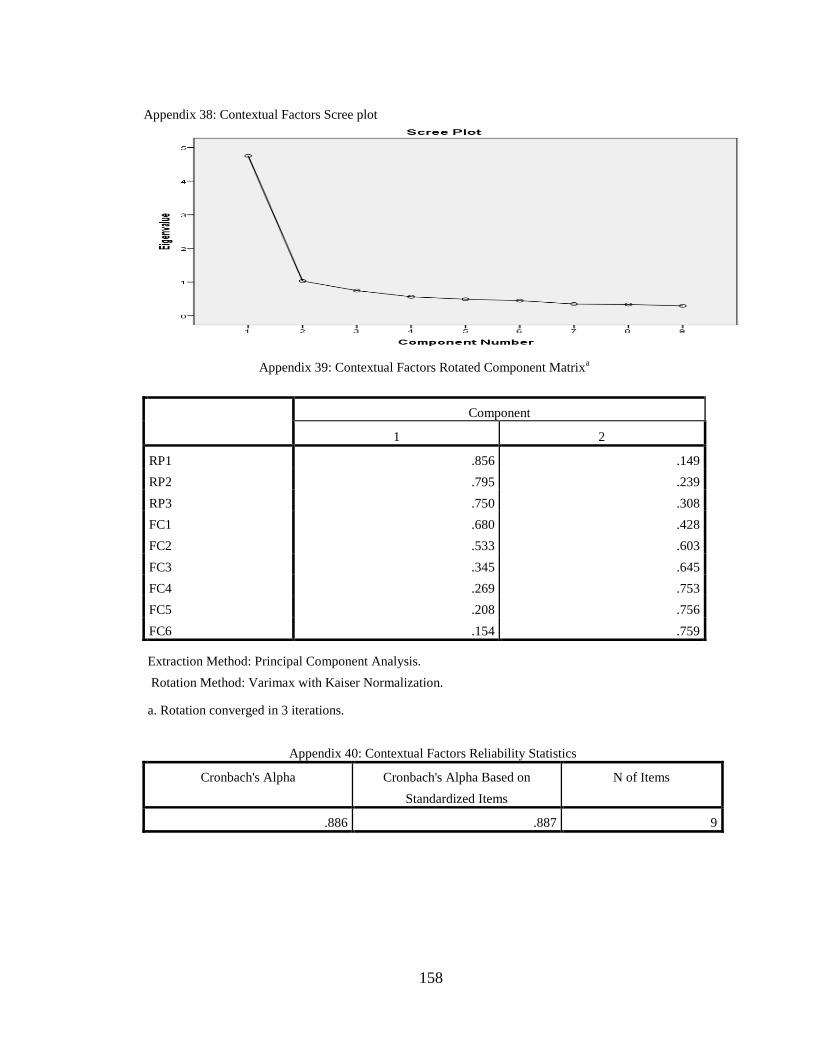
158
Appendix 38: Contextual Factors Scree plot
Appendix 39: Contextual Factors Rotated Component Matrixa
Component
1 2
RP1 .856 .149
RP2 .795 .239
RP3 .750 .308
FC1 .680 .428
FC2 .533 .603
FC3 .345 .645
FC4 .269 .753
FC5 .208 .756
FC6 .154 .759
Extraction Method: Principal Component Analysis.
Rotation Method: Varimax with Kaiser Normalization.
a. Rotation converged in 3 iterations.
Appendix 40: Contextual Factors Reliability Statistics
Cronbach's Alpha Cronbach's Alpha Based on
Standardized Items
N of Items
.886 .887 9
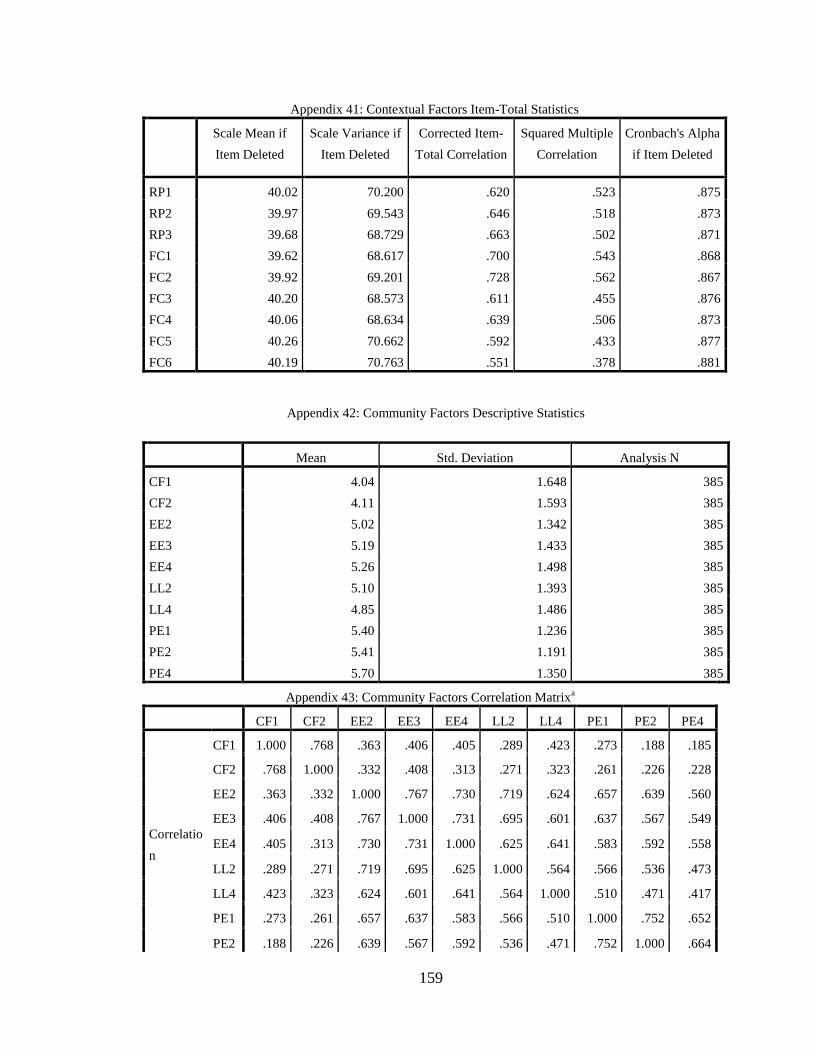
159
Appendix 41: Contextual Factors Item-Total Statistics
Scale Mean if
Item Deleted
Scale Variance if
Item Deleted
Corrected Item-
Total Correlation
Squared Multiple
Correlation
Cronbach's Alpha
if Item Deleted
RP1 40.02 70.200 .620 .523 .875
RP2 39.97 69.543 .646 .518 .873
RP3 39.68 68.729 .663 .502 .871
FC1 39.62 68.617 .700 .543 .868
FC2 39.92 69.201 .728 .562 .867
FC3 40.20 68.573 .611 .455 .876
FC4 40.06 68.634 .639 .506 .873
FC5 40.26 70.662 .592 .433 .877
FC6 40.19 70.763 .551 .378 .881
Appendix 42: Community Factors Descriptive Statistics
Mean Std. Deviation Analysis N
CF1 4.04 1.648 385
CF2 4.11 1.593 385
EE2 5.02 1.342 385
EE3 5.19 1.433 385
EE4 5.26 1.498 385
LL2 5.10 1.393 385
LL4 4.85 1.486 385
PE1 5.40 1.236 385
PE2 5.41 1.191 385
PE4 5.70 1.350 385
Appendix 43: Community Factors Correlation Matrixa
CF1 CF2 EE2 EE3 EE4 LL2 LL4 PE1 PE2 PE4
Correlatio
n
CF1 1.000 .768 .363 .406 .405 .289 .423 .273 .188 .185
CF2 .768 1.000 .332 .408 .313 .271 .323 .261 .226 .228
EE2 .363 .332 1.000 .767 .730 .719 .624 .657 .639 .560
EE3 .406 .408 .767 1.000 .731 .695 .601 .637 .567 .549
EE4 .405 .313 .730 .731 1.000 .625 .641 .583 .592 .558
LL2 .289 .271 .719 .695 .625 1.000 .564 .566 .536 .473
LL4 .423 .323 .624 .601 .641 .564 1.000 .510 .471 .417
PE1 .273 .261 .657 .637 .583 .566 .510 1.000 .752 .652
PE2 .188 .226 .639 .567 .592 .536 .471 .752 1.000 .664
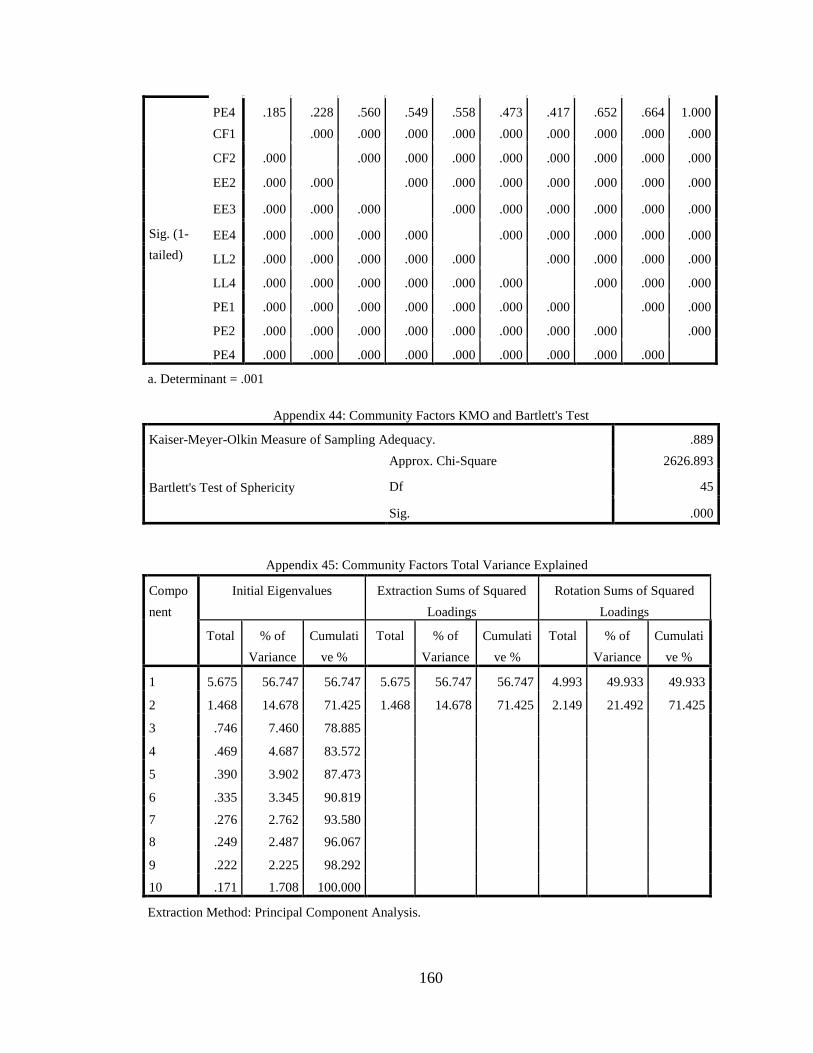
160
PE4 .185 .228 .560 .549 .558 .473 .417 .652 .664 1.000
Sig. (1-
tailed)
CF1
.000 .000 .000 .000 .000 .000 .000 .000 .000
CF2 .000
.000 .000 .000 .000 .000 .000 .000 .000
EE2 .000 .000
.000 .000 .000 .000 .000 .000 .000
EE3 .000 .000 .000
.000 .000 .000 .000 .000 .000
EE4 .000 .000 .000 .000
.000 .000 .000 .000 .000
LL2 .000 .000 .000 .000 .000
.000 .000 .000 .000
LL4 .000 .000 .000 .000 .000 .000
.000 .000 .000
PE1 .000 .000 .000 .000 .000 .000 .000
.000 .000
PE2 .000 .000 .000 .000 .000 .000 .000 .000
.000
PE4 .000 .000 .000 .000 .000 .000 .000 .000 .000
a. Determinant = .001
Appendix 44: Community Factors KMO and Bartlett's Test
Kaiser-Meyer-Olkin Measure of Sampling Adequacy. .889
Bartlett's Test of Sphericity
Approx. Chi-Square 2626.893
Df 45
Sig. .000
Appendix 45: Community Factors Total Variance Explained
Compo
nent
Initial Eigenvalues Extraction Sums of Squared
Loadings
Rotation Sums of Squared
Loadings
Total % of
Variance
Cumulati
ve %
Total % of
Variance
Cumulati
ve %
Total % of
Variance
Cumulati
ve %
1 5.675 56.747 56.747 5.675 56.747 56.747 4.993 49.933 49.933
2 1.468 14.678 71.425 1.468 14.678 71.425 2.149 21.492 71.425
3 .746 7.460 78.885
4 .469 4.687 83.572
5 .390 3.902 87.473
6 .335 3.345 90.819
7 .276 2.762 93.580
8 .249 2.487 96.067
9 .222 2.225 98.292
10 .171 1.708 100.000
Extraction Method: Principal Component Analysis.
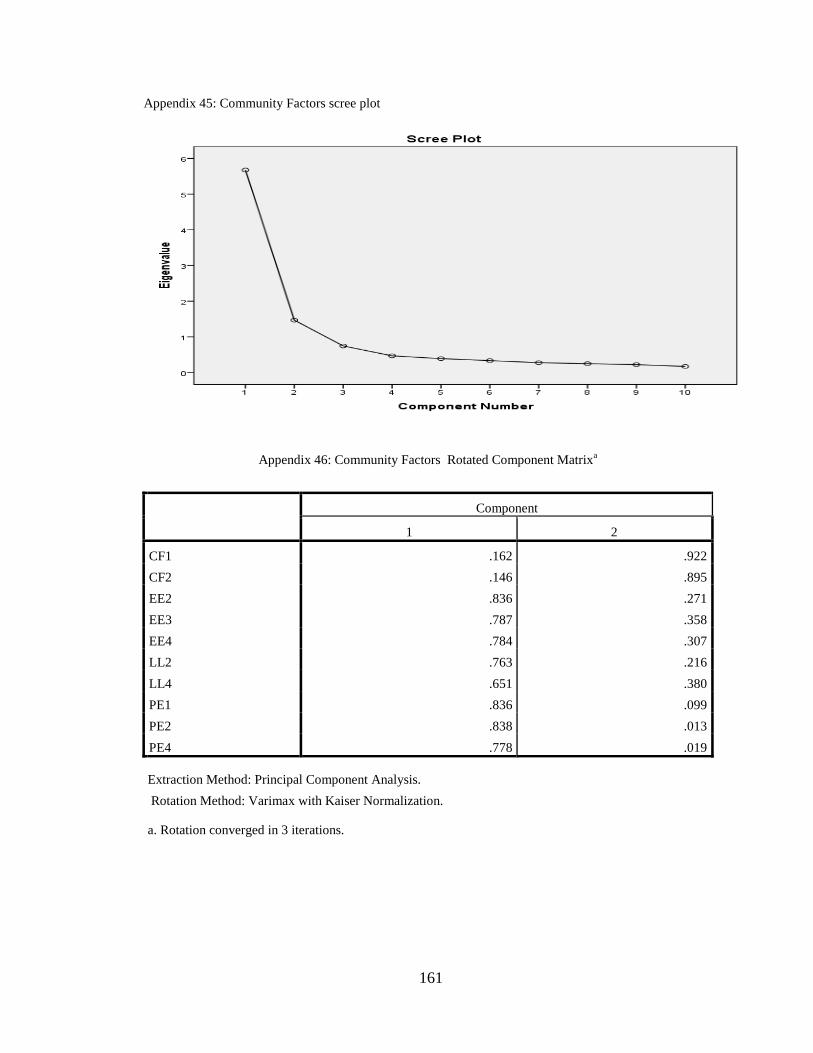
161
Appendix 45: Community Factors scree plot
Appendix 46: Community Factors Rotated Component Matrixa
Component
1 2
CF1 .162 .922
CF2 .146 .895
EE2 .836 .271
EE3 .787 .358
EE4 .784 .307
LL2 .763 .216
LL4 .651 .380
PE1 .836 .099
PE2 .838 .013
PE4 .778 .019
Extraction Method: Principal Component Analysis.
Rotation Method: Varimax with Kaiser Normalization.
a. Rotation converged in 3 iterations.
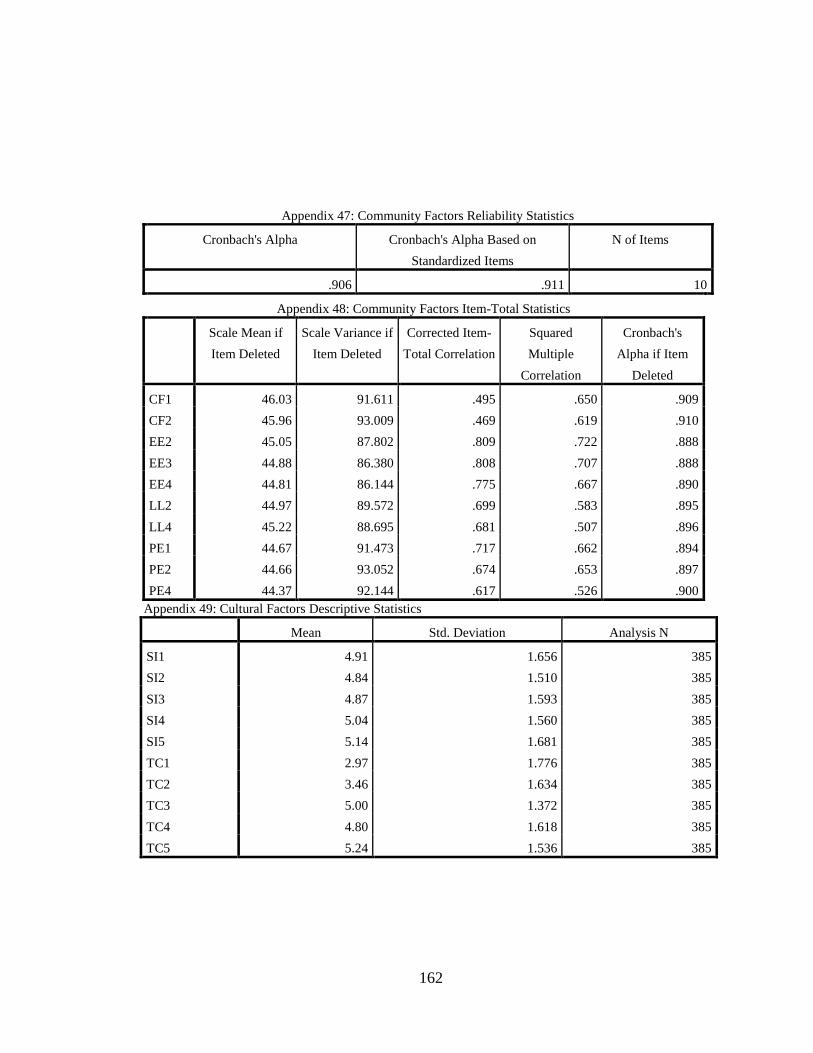
162
Appendix 47: Community Factors Reliability Statistics
Cronbach's Alpha Cronbach's Alpha Based on
Standardized Items
N of Items
.906 .911 10
Appendix 48: Community Factors Item-Total Statistics
Scale Mean if
Item Deleted
Scale Variance if
Item Deleted
Corrected Item-
Total Correlation
Squared
Multiple
Correlation
Cronbach's
Alpha if Item
Deleted
CF1 46.03 91.611 .495 .650 .909
CF2 45.96 93.009 .469 .619 .910
EE2 45.05 87.802 .809 .722 .888
EE3 44.88 86.380 .808 .707 .888
EE4 44.81 86.144 .775 .667 .890
LL2 44.97 89.572 .699 .583 .895
LL4 45.22 88.695 .681 .507 .896
PE1 44.67 91.473 .717 .662 .894
PE2 44.66 93.052 .674 .653 .897
PE4 44.37 92.144 .617 .526 .900
Appendix 49: Cultural Factors Descriptive Statistics
Mean Std. Deviation Analysis N
SI1 4.91 1.656 385
SI2 4.84 1.510 385
SI3 4.87 1.593 385
SI4 5.04 1.560 385
SI5 5.14 1.681 385
TC1 2.97 1.776 385
TC2 3.46 1.634 385
TC3 5.00 1.372 385
TC4 4.80 1.618 385
TC5 5.24 1.536 385
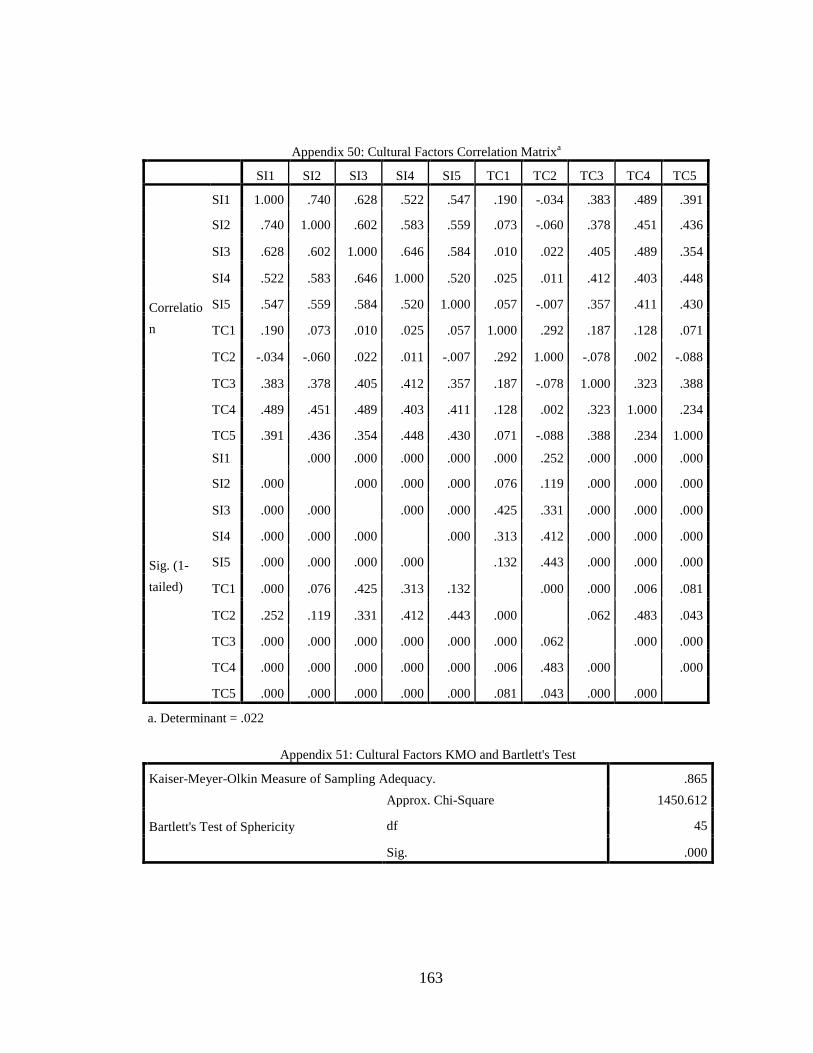
163
Appendix 50: Cultural Factors Correlation Matrixa
SI1 SI2 SI3 SI4 SI5 TC1 TC2 TC3 TC4 TC5
Correlatio
n
SI1 1.000 .740 .628 .522 .547 .190 -.034 .383 .489 .391
SI2 .740 1.000 .602 .583 .559 .073 -.060 .378 .451 .436
SI3 .628 .602 1.000 .646 .584 .010 .022 .405 .489 .354
SI4 .522 .583 .646 1.000 .520 .025 .011 .412 .403 .448
SI5 .547 .559 .584 .520 1.000 .057 -.007 .357 .411 .430
TC1 .190 .073 .010 .025 .057 1.000 .292 .187 .128 .071
TC2 -.034 -.060 .022 .011 -.007 .292 1.000 -.078 .002 -.088
TC3 .383 .378 .405 .412 .357 .187 -.078 1.000 .323 .388
TC4 .489 .451 .489 .403 .411 .128 .002 .323 1.000 .234
TC5 .391 .436 .354 .448 .430 .071 -.088 .388 .234 1.000
Sig. (1-
tailed)
SI1
.000 .000 .000 .000 .000 .252 .000 .000 .000
SI2 .000
.000 .000 .000 .076 .119 .000 .000 .000
SI3 .000 .000
.000 .000 .425 .331 .000 .000 .000
SI4 .000 .000 .000
.000 .313 .412 .000 .000 .000
SI5 .000 .000 .000 .000
.132 .443 .000 .000 .000
TC1 .000 .076 .425 .313 .132
.000 .000 .006 .081
TC2 .252 .119 .331 .412 .443 .000
.062 .483 .043
TC3 .000 .000 .000 .000 .000 .000 .062
.000 .000
TC4 .000 .000 .000 .000 .000 .006 .483 .000
.000
TC5 .000 .000 .000 .000 .000 .081 .043 .000 .000
a. Determinant = .022
Appendix 51: Cultural Factors KMO and Bartlett's Test
Kaiser-Meyer-Olkin Measure of Sampling Adequacy. .865
Bartlett's Test of Sphericity
Approx. Chi-Square 1450.612
df 45
Sig. .000
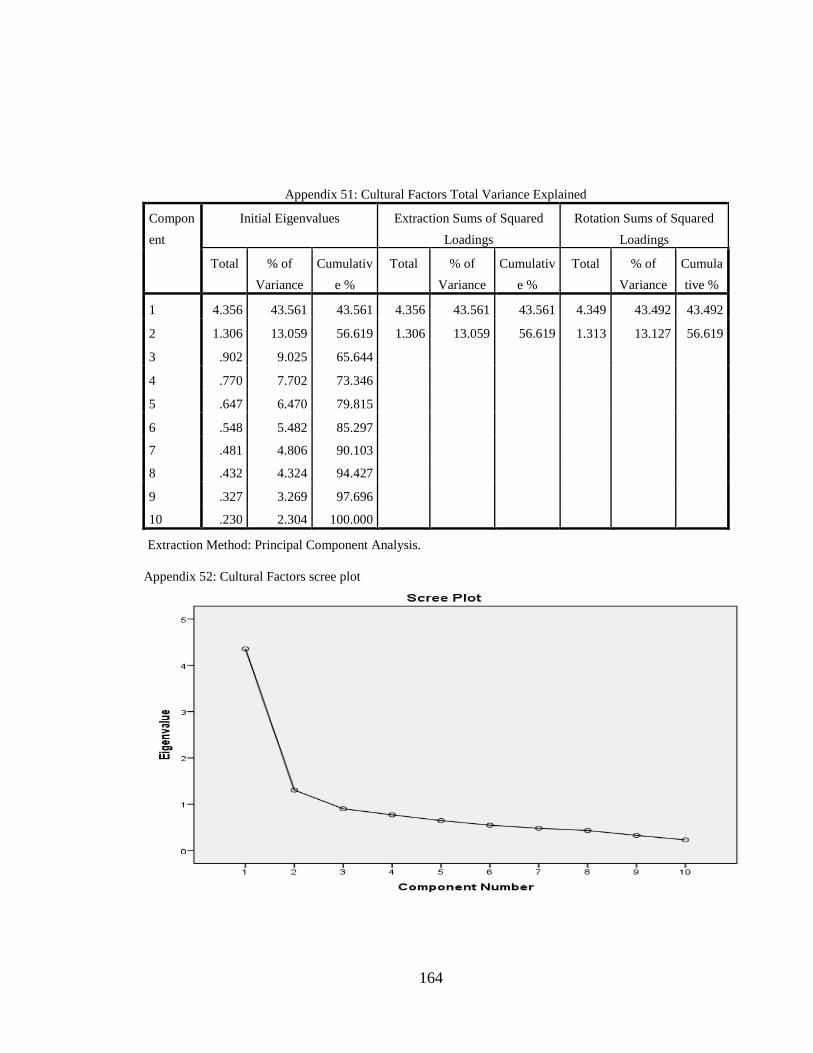
164
Appendix 51: Cultural Factors Total Variance Explained
Compon
ent
Initial Eigenvalues Extraction Sums of Squared
Loadings
Rotation Sums of Squared
Loadings
Total % of
Variance
Cumulativ
e %
Total % of
Variance
Cumulativ
e %
Total % of
Variance
Cumula
tive %
1 4.356 43.561 43.561 4.356 43.561 43.561 4.349 43.492 43.492
2 1.306 13.059 56.619 1.306 13.059 56.619 1.313 13.127 56.619
3 .902 9.025 65.644
4 .770 7.702 73.346
5 .647 6.470 79.815
6 .548 5.482 85.297
7 .481 4.806 90.103
8 .432 4.324 94.427
9 .327 3.269 97.696
10 .230 2.304 100.000
Extraction Method: Principal Component Analysis.
Appendix 52: Cultural Factors scree plot
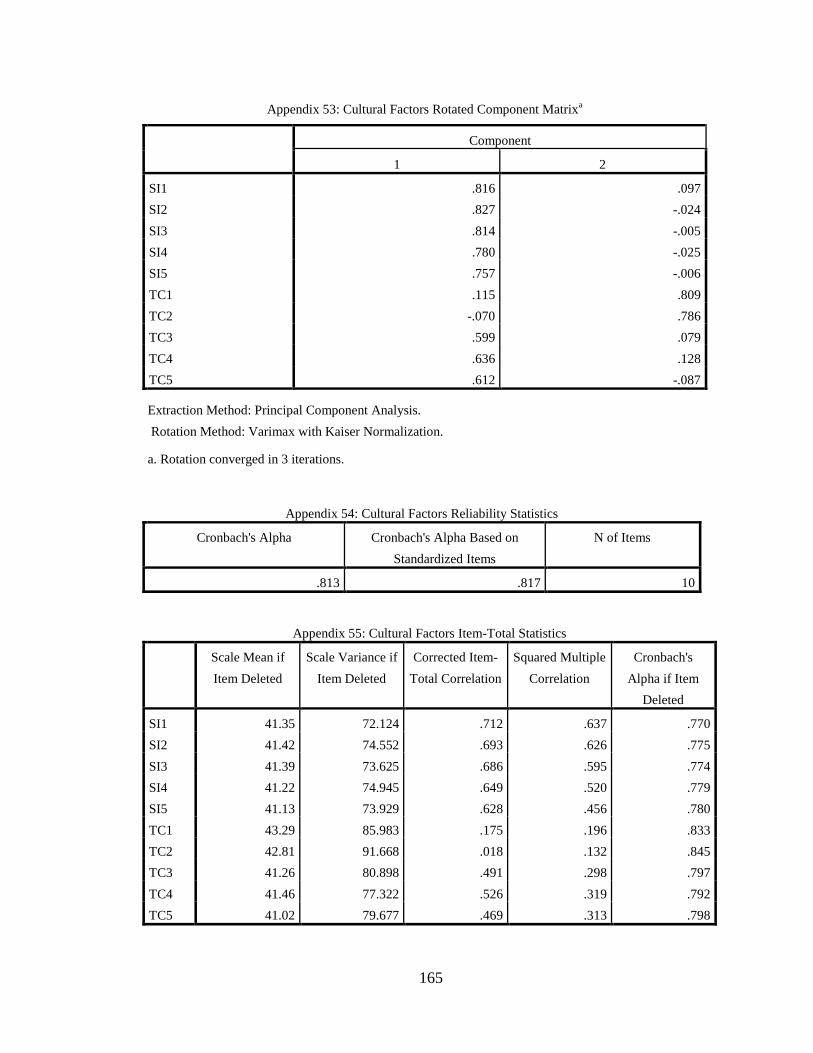
165
Appendix 53: Cultural Factors Rotated Component Matrixa
Component
1 2
SI1 .816 .097
SI2 .827 -.024
SI3 .814 -.005
SI4 .780 -.025
SI5 .757 -.006
TC1 .115 .809
TC2 -.070 .786
TC3 .599 .079
TC4 .636 .128
TC5 .612 -.087
Extraction Method: Principal Component Analysis.
Rotation Method: Varimax with Kaiser Normalization.
a. Rotation converged in 3 iterations.
Appendix 54: Cultural Factors Reliability Statistics
Cronbach's Alpha Cronbach's Alpha Based on
Standardized Items
N of Items
.813 .817 10
Appendix 55: Cultural Factors Item-Total Statistics
Scale Mean if
Item Deleted
Scale Variance if
Item Deleted
Corrected Item-
Total Correlation
Squared Multiple
Correlation
Cronbach's
Alpha if Item
Deleted
SI1 41.35 72.124 .712 .637 .770
SI2 41.42 74.552 .693 .626 .775
SI3 41.39 73.625 .686 .595 .774
SI4 41.22 74.945 .649 .520 .779
SI5 41.13 73.929 .628 .456 .780
TC1 43.29 85.983 .175 .196 .833
TC2 42.81 91.668 .018 .132 .845
TC3 41.26 80.898 .491 .298 .797
TC4 41.46 77.322 .526 .319 .792
TC5 41.02 79.677 .469 .313 .798

166
Boot strapping final
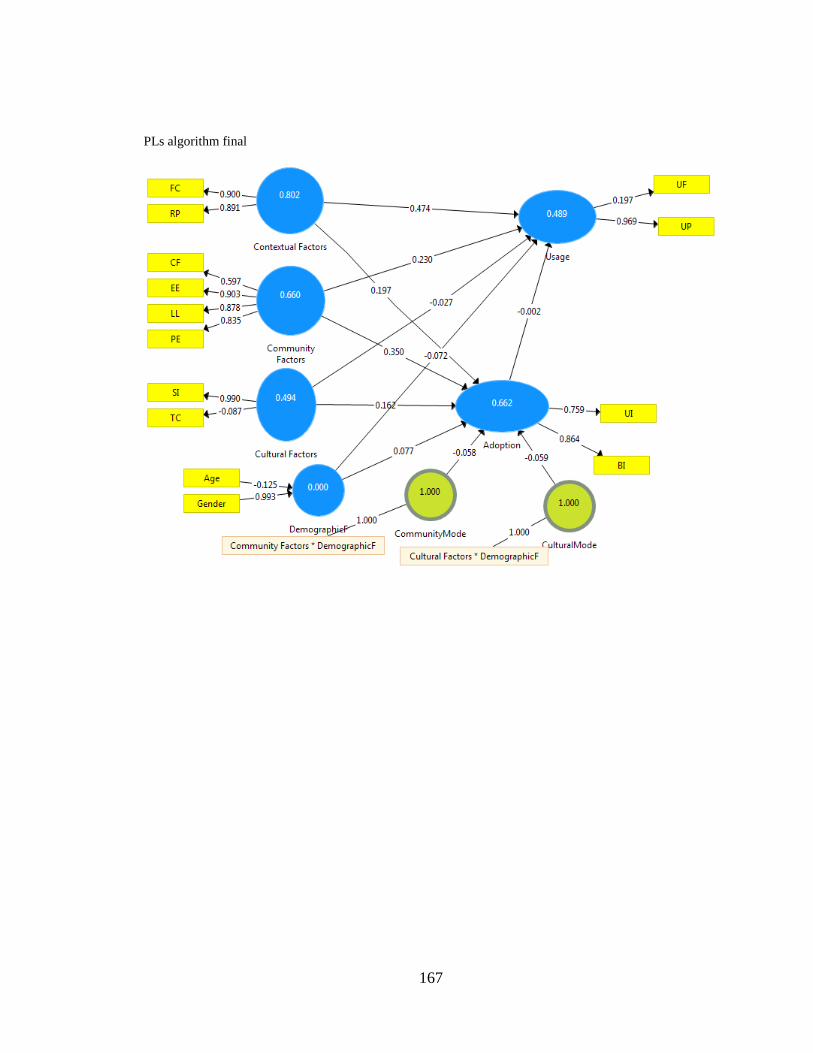
167
PLs algorithm final

168
Composite reliability final
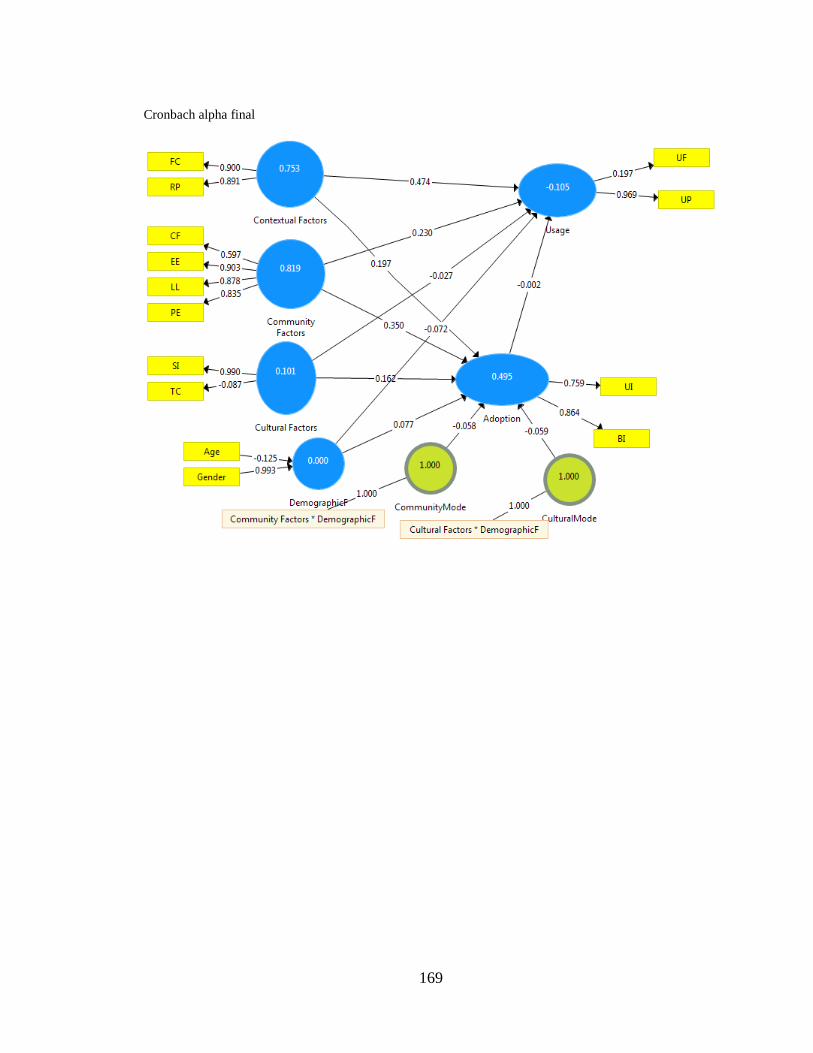
169
Cronbach alpha final

170
Average variance extracted final

171
R squared final
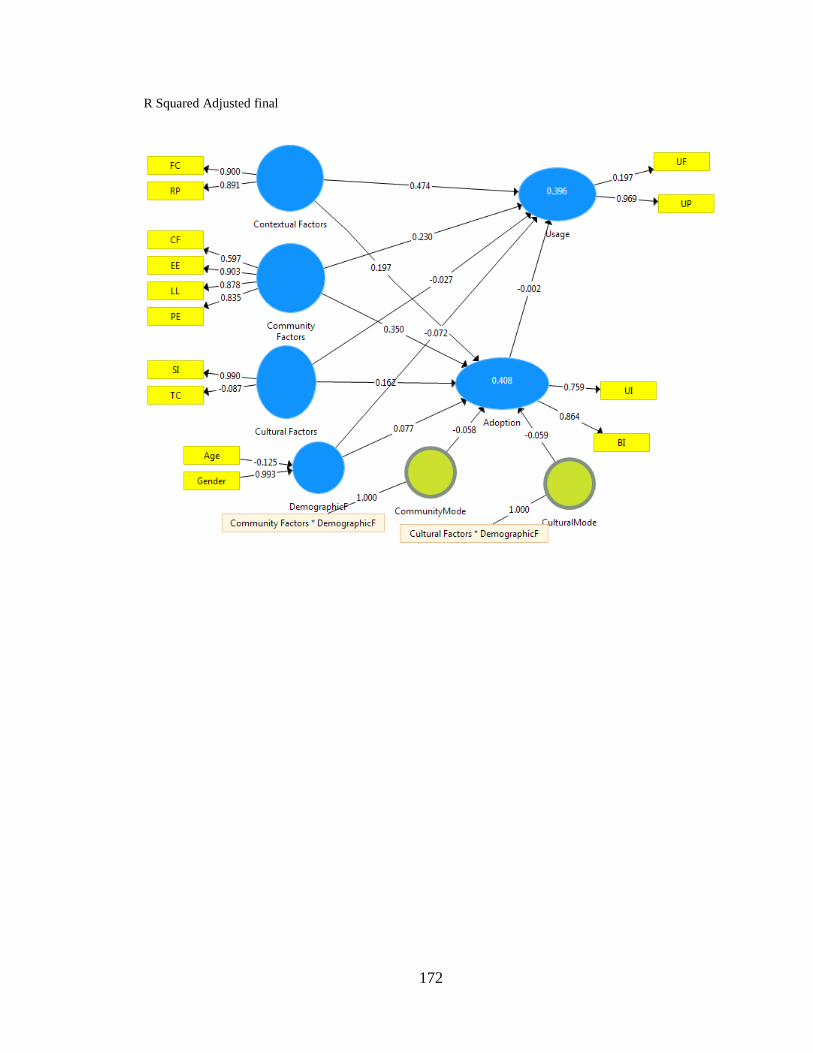
172
R Squared Adjusted final