the precedence of global features in the perception … · it is clear that the global precedence...
TRANSCRIPT

Technical Report 803
The Precedence of Global Featuresin the Perception of Map Symbols
00 Beverly G. KnappN
ARI Field Unit at Fort Huachuca, Arizona
Systems Research Laboratory
DTICtELECTE
'&3 1. t 1,, 1989 M
U.S. Army
Research Institute for the Behavioral and Social Sciences
June 1988
Approved for public release; distribution is unlimited.
,1N1
U.S. ARMY RESEARCH INSTITUTE
FOR THE BEHAVIORAL AND SOCIAL SCIENCES
A Field Operating Agency Under the Jurisdiction
of the Deputy Chief of Staff for Personnel
EDGAR M. JOHNSON JON W. BLADESCOL, INTechnical Director Commanding
Technical review by
Henry de HaanMarshall A. Narva
NOTICES
DISTRIBUTION: Primary distribution of this report has been made by ARI. Please address correspondenceconcernng distribution of reports to the following: U.S. Army Research Institute for the Behavioral and SocialSciences, ATTN: PERI-POT, 5001 Eisenhower Ave., Alexandria, VA 22333-5600
FINAL DISPOSITION: This report may be destroyed when it is no longer needed. Please do not return it to theU.S. Army Research Institute for the Behavioral and Social Sciences.
NOTE: The findings in this report are not to be construed as an official Department of the Army position, un-less so designated by other authorized documents

UNCLASSIFIEDSECURITY CLASSIFICATION OF THIS PAGE IForm Approved
REPORT DOCUMENTATION PAGE OMBNo. 0704-0188
la. REPORT SECURITY CLASSIFICATION lb. RESTRICTIVE MARKINGS
Unclassified --2a. SECURITY CLASSIFICATION AUTHORITY 3. DISTRIBUTION /AVAILABILITY OF REPORT
2b. DECLASSIFICATION IDOWNGRADING SCHEDULE Approved for public release;distribution unlimited.
4. PERFORMING ORGANIZATION REPORT NUMBER(S) S. MONITORING ORGANIZATION REPORT NUMBER(S)
ARI Technical Report 803
6a. NAME OF PERFORMING ORGANIZATION 6b. OFFICE SYMBOL 7a. NAME OF MONITORING ORGANIZATIONU.S. Army Intelligence Center (If applicable)
and School U.S. Army Research Institute6c ADDRESS (City, State, and ZIP Code) 7b. ADDRESS (City, State, and ZIP Code)
ATTN: ATSI-ARI 5001 Eisenhower AvenueFort Huachuca, AZ 85613-7000 Alexandria, VA 22333-5600
8a. NAME OF FUNDING/SPONSORING 8b. OFFICE SYMBOL 9. PROCUREMENT INSTRUMENT IDENTIFICATION NUMBERORGANIZATION (if applicable)
8c. ADDRESS (City, State. and ZIP Code) 10. SOURCE OF FUNDING NUMBERSPROGRAM PROJECT TASK WORK UNITELEMENT NO. NO. NO. ACCESSION NO.
6.27.17 A790 1.4.3 1143.H.211. TITLE (include Security Classification)
The Precedence of Global Features in the Perception of Map Symbols
12. PERSONAL AUTHOR(S)
Knapp, Beverly G.13a. TYPE OF REPORT 13b. TIME COVERED 714. DATE OF REPORT (Year, Month, Day) 15. PAGE COUNT
Final FROM 05/84 TO 05/8 1988, June 94
16. SUPPLEMENTARY NOTATION
17. COSATI CODES 18. SUBJECT TERMS (Continue on reverse if necessary and identify by block number)
FIELD GROUP SUB-GROUP Symbols DiscriminabilityMilitary symbology Visual processingGraphic portrayal Multidimensional scaling
19, ABSTRACT (Continue on reverse if necessary and identify by block number)This research investigated the role of global precedence in visual perceptual process-
ing. Researchers evaluated the effect of global features on the speed and accuracy ofdetecting map-symbols. The global precedence position suggests that perception proceedstemporally, through stages, from the recognition of global features to a more local, fine-grained analysis of individual elements.
The study was conducted to compare performance (speed and accuracy) in a symbol-alonecondition with that in various symbol-plus-distractor conditions. Scaling techniques(Multidimensional Scaling Analysis and Hierarchical Cluster Analysis) were applied to an
existing database of map symbols to categorize global (general) and local (detailed)features of the symbols. Following this, a detection task was performed to determine the
level of interference in detecting target symbols of various global categories when(Continued)
20. OISTRIBUTION/AVAILABILITY OF ABSTRACT 21. ABSTRACT SECURITY CLASSIFICATIONROUNCLASSIFIEDJNLIMITED [: SAME AS RPT. DTIC USERS Unclassified
22a. NAME OF RESPONSIBLE INDIVIDUAL " 22b. TELEPHONE (Include Area Code) 22c. OFFICE SYMBOL
Beverly G. Knapp (602) 533-2932 PERI-SA
D Form 1473, JUN 84 Previous editions are obsolete. SECURITY CLASSIFICATION OF THIS PAGE
UNCLASSIFIED

UNCLASSIFIED
SECURITY CLASSIFICATION OF THIS PAGE(flh., Data Entored)
ARI Technical Report 803
19. ABSTRACT (Continued)
.distractor symbols were present. The response latency and accuracy measures
from the detection study were analyzed using a one-way repeated measuresANOVA, followed by planned comparisons between target-distractor category
means.
The research shows that the response latency measure discriminates wellamong symbol-distractor conditions, but the accuracy measure does not. First
analysis of the data did not reflect the impact of global precedence in all
cases. Further analysis revealed that local feature similarity played amore prominent role in discriminating symbol groups than was originally sus-
pected. It is clear that the global precedence concept is a useful one indescribing symbol populations in existence as long as the a priori scaling
procedures used are precise enough to derive the global features.
Accession For
MTIS CGRI
Unl-nno :,'iedEl 'Dut I: ,:TAB on
By
Ava11.LI7Ity Codes
Dist
UNCLASSIFIED
SECURITY CLASSIFICATION OF THIS PAGE(Wh e
n Daea Enterd)
ii

Technical Report 803
The Precedence of Global Featuresin the Perception of Map Symbols
Beverly G. Knapp
ARI Field Unit at Fort Huachuca, ArizonaJulie A. Hopson, Chief
Systems Research LaboratoryRobin L. Keesee, Director
U.S. Army Research Institute for the Behavioral and Social Sciences5001 Eisenhower Avenue, Alexandria, Virginia 22333-5600
Office, Deputy Chief of Staff for PersonnelDepartment of the Army
June 1988
Army Project Number Human Performance Effec-20 162717A790 tiveness and Simulation
ii
FOREWORD
Military symbology is an integral part of the Army's network of communi-
cation. The U.S. Army Research Institute (ARI) has devoted a program of re-
search to improving symbol detection and display. Researchers are working to
determine hardware and software factors that affect performance and the types
of information that should be displayed, and to develop a database of military
symbols that can be continually updated.
The present study evaluated the feasibility of a serial model of visual
processing. By comparing performance between a symbol-alone condition and
various target-plus-distractor conditions, researchers found that speed of
performance differed across conditions but that accuracy of performance did
not. The serial'model of visual processing was supported. The implications
of these results will be combined with ongoing efforts at ARI to improve sym-bolic visual displays.
EDGAR M. JOHNS
TecL,Jlital Director
v

THE PRECEDENCE OF GLOBAL FEATURES IN THE PERCEPTION OF MAP SYMBOLS
EXECUTIVE SUMMARY
Requirement:
To improve assimilation of visual symbolic information on military mapdisplays, focusing on the role of global (high-level) and local (detailed)
symbolic features as they impact operator detection performance.
Procedure:
Researchers evaluated the effect of global features on the speed and ac-curacy of detecting military map symbols in current use. Scaling techniques(Multidimensional Scaling Analysis and Hierarchical Cluster Analysis) wereapplied to an existing database of symbols to categorize global and localfeatures. Following this, a detection task was performed to determine thelevel of interference in detecting target symbols when distractor symbols werepresent from the various global categories. The response latency and accuracyof identification of symbols was analyzed using a one-way repeated measures
ANOVA design.
Findings:
The research shows that the response latency measure is a good discrimi-
nator of detection performance, but the accuracy measure is not. Addition-ally, the scaling techniques do not provide the needed definition of localfeatures required to adequately predict performance in all cases. Furtheranalysis revealed that local feature similarity played a more prominent rolein discriminating symbol groups than had been originally suspected.
Utilization of Findings:
The results of this work will be applied to methods used to assess the
utility of computer-generated map displays projected for use in Command, Con-trol and Intelligence systems. It is clear that the global precedence conceptis a viable one in describing symbol and graphic concepts to portray commandand intelligence summaries, as long as the a priori scaling procedures usedare made precise enough to derive the correct global and local features.
vii

THE PRECEDENCE OF GLOBAL FEATURES IN THE PERCEPTION OF MAP SYM4BOLS
* CONTENTS
Page
INTRODUCTION ................................ 1
BACKGROUND ................................. 2
CURRENT INVESTIGATION AND HYPOTHESES.....................11
I. SYMBOL SELECTION AND SCALING... .................... 15
Selection................................15Symbol Scaling .............................. 15Method ................................. 20Results................................23Naming of Stimulus Clusters for Global and Local Features ........ 35
II. SYMBOL DETECTION STUDY .......................... 41
Introduction ............................... 41Method ................................. 41Results................................50Discussion ................................ 62
GENERAL DISCUSSION..............................75
SUMMARY ................................... 79
REFERENCES ................................. 83
APPENDIX. INSTRUCTIONS TO SUBJECTS FOR SYMBOL DETECTION STUDY ....... 89
LIST OF TABLES
Table 1. Dimension stimulus coordinates (helicopter symbols). ........ 25
2. Dimension stimulus coordinates (missile symbols) .......... 26
3. Identified global clusters from scaling analyses with
selected helicopter symbols ..................... 44
4. Identified global clusters from scaling analyses withselected missile symbols......................45
5. ANOVA Summary - response latencies, helicopter symbols . . . . 51
ix
CONTENTS (Continued)
Page
Table 6. ANOVA Summary - response latencies, missile symbols. ...... 52
7. ANOVA Summary - response accuracy, helicopter symbols ..... .. 53
8. ANOVA Summary - response accuracy, missile symbols . ...... . 54
9. Planned contrasts between mean response latencies usingDuncan's Multiple Range test, helicopter symbols . ....... . 56
10. Planned contrasts between mean response latencies usingDuncan's Multiple Range test, missile symbols .. ......... ... 58
11. Planned contrasts between mean response accuracies using
Duncan's Multiple Range test, helicopter symbols . ....... . 60
12. Planned contrasts between mean response accuracies usingDuncan's Multiple Range test, missile symbols .. ......... ... 61
13. Identified symbol categorizations delineating global andlocal features, from most to least interference -helicopter symbols ........ ...................... .. 68
14. Identified symbol categorizations delineating global andlocal features, from most to least interference -
missile symbols ......... ........................ .. 69
15. ANOVA Summary - response latencies, helicopter symbols(revised) .......... ........................... ... 70
16. ANOVA Summary - response latencies, missile symbols(revised) .......... ........................... ... 71
17. Planned contrasts between mean response latencies using
Duncan's Multiple Range test, helicopter symbols . ....... . 72
18. Planned contrasts between mean response latencies usingDuncan's Multiple Range test, missile symbols .. ......... ... 73
LIST OF FIGURES
Figure 1. Helicopter and missile symbols used in the study ........ . 16
2. Five-point rating scale used for similarity judgments . . . . 22
3. Stress values of MDS solutions over a range ofdimensionalities ......... ....................... .. 24
x
CONTENTS (Continued)
Page
Figure 4. Derived group stimulus space: dimension one and two(helicopter) .......... ......................... . 27
5. Derived group stimulus space: dimension one and three(helicopter) .......... ......................... . 28
6. Derived group stimulus space: dimension two and three(helicopter) .......... ......................... . 29
7. Derived group stimulus space: dimension one and two(missile) .......... .......................... . 30
8. Derived group stimulus space: dimension one and three(missile) .......... .......................... . 31
9. Derived group stimulus space: dimension two and three(missile) .......... .......................... . 32
10. Hierarchical clustering scheme obtained on helicoptersymbols ........... ........................... . 33
11. Hierarchical clustering scheme obtained on missile symbols 34
12. Hierarchical clustering analysis embedded in threedimensional MDS scaling solution for helicopter symbols . . 36
13. Hierarchical clustering analysis embedded in three-dimensional MDS scaling solution for missile symbols ..... ... 37
14. Photograph of computer generated map display for Phase IIsymbol detection study ....... .................... . 42
15. Schematic drawing of quadrant selection zones for symboltargets on the map display ...... .................. . 47
16. Hierarchical clustering scheme obtained on responselatencies - helicopter symbols ..... ................ . 64
17. Hierarchical clustering scheme obtai-ed on responselatencies - missile symbols ..... ................. . 65
xi

THE PRECEDENCE OF GLOBAL FEATURES IN THE PERCEPTION OF MAP SYMBOLS
INTRODUCTION
A large body of perceptual literature, beginning with the Gestalt
theorists, indicates that pattern structure is perceptually significant
in both natural and man-made symbols (Mach, 1897; Attneave, 1955;
Julesz, 1971). Broadbent's analysis (1977) indicates that perceptual
processing of visual patterns, such as symbols, is based on a "filter-
ing" procedure, consisting of a series of passive-to-active or global-
to-local stages. Navon (1977, 1981a) has proposed a "global precedence"
hypothesis, which suggests further that the perceptual system first
processes symbols globally, followed by a local, more "fine-grained"
analysis. This research is an investigation of how global and local
processing of visual stimuli affect the speed and accuracy of map symbol
perception in a search and locate '.ask. This is part of a trend to un-
derstand perceptual processing in the context of specific performance
tasks. It addresses the role of symbol structure in detection on maps,
which is critical for prescribing how symbols should be designed and
placed on map backgrounds to portray military events. In addition,
Navon's findings, which have been demonstrated with rather abstract
forms and figures, are extended and made more generalizable. The cur-
rent use of an applied symbol population provides a broader test of the
global precedence idea, and allows greater predictability to other
areas.
11

BACKGROUND
The Gestaltist's view of the perceptual system is that the
inspection of a visual scene involves cognitive rules for perceptual c-
ganization. Since the visual envi-')nment is typically data rich, one
attempt to explain perceptual organization is a "global minimum" prin-
ciple, i.e., that we perceive the "simplest" of the alternative organi-
zations available for the entire stimulus pattern being considered
(Peterson & Hochberg, 1983). Certain "features" within the visual scene
are seen as comprising a "figure," against which the rest of the stimu-
lus information is "background." Pattern structures are seen in terms
of "units," or perceptual "wholes." The essence of the position is that
perceptual processing begins with a global whole to which local details
are gradually added.
The perceptual advantage of figure over ground has been
conceptualized in a number of ways (e.g. Wong & Weisstein, 1983). They
have proposed that more attention is given to figure, whereas details
are generally ignored. Because of greater attention, motion, contour,
and displacement are more salient in a figure than in the background
(Wong & Weisstein, 1983).
The Gestalt theorists described the figure as having a "thing-
like" character, and being "more strongly structured and more impres-
sive" (Koffka, 1935). This approach to figure and ground was not ex-
plored further theoretically in the context of perceptual processing
2

until quite recently when Julesz (1978) proposed that not only do dif-
ferent visual processes mediate the processing of figure and ground, but
also that each analysis involves highly specialized functions.
It is also assumed that the extraction of global information
proceeds more quickly than the extraction of details about a pattern,
and some investigators characterize ground analysis as an "early warning
system" for visual processing (Breitmeyer & Ganz, 1976; Calls &
Leeuwenburg, 1981, Julesz, 1978). These investigators have equated fig-
ure and ground analysis to the examination of low and high spatial fre-
quency channels of the visual system. This is in line with current
theories of perception and cognition characterizing the human as an in-
formation processor, with various subsystems serving the master control-
ler. The visual system is just one of these subsystems. According to
these investigators, ground analysis has been thought to involve the low
end of the frequency spectrum (Broadbent, 1977; Breitmeyer & Ganz,
1976).
Clearly the information processing emphasis in the experimental
literature (Atkinson & Shiffrin, 1968; Neisser, 1967) has had an impact
on perceptual theorizing. The position did not arise as a reaction
against the traditional Gestalt viewpoint, but rather as a movement to
incorporate the concepts of cognition, or processing activity, into per-
ception. The basic idea is that perception Is not an immediate outcome
of environmental stimulation, (as suggested by the Gestaltists), but the
result of processing over time, in a series of parallel or concurrent
stages (Haber & Hershenson, 1980).
3

Applying the information processing view to early visual pattern
processing, Broadbent's analysis (1977) suggests that there 1s evidence
for at least two stages of perceptual selection: the early, or global
stage, and the later inquiry, or local verification stage. The global
or passive stage "packages" information from the environment into dif-
ferent segments, each of which can be attended or rejected. The local
stage works with more detailed information from the original packages or
segments. This advances the earlier, static feature aggregation ap-
proaches to comprise a "figure." According to the global precedence
model, global and local features denote separate sets of features (Boer
& Keuss, 1982). Thus, global feature availability is not dependent on
the accumulation of a sufficient number of local features; on the con-
trary, the model implies that global feature sampling precedes local
feature sampling, or that global feature sampling is faster than local
feature sampling. Some predictions from the global precedence model
are: (1) it is easier to judge a form on its global characteristics than
on its local characteristics, and (2) global characteristics are diffi-
cult to ignore, while local ones are easy to ignore. In terms of per-
formance, speed and accuracy are enhanced when the global information is
the target of interest.
A number of investigators have worked extensively with the global
precedence idea to lend empirical support to the model (McLean, 1979;
Navon, 1977, 1981a, 1983; Hoffman, 1980; Martin, 1979; Miller, 1981a,
1981b; Ward, 1983). Most notably, Navon has done exhaustive study with
simple shapes and forms to demonstrate the importance of global prece-
dence in perceptual processing. In Navon's view, the task of visual
4

processing is not just to account for all given outputs, but also to se-
lect which part of the surrounding stimulation is worth receiving
(1977). The constraints imposed by the optical limits of our eyes and
by the nature of our surroundings have implications for visual process-
ing. First, the resolution of most of the stimuli in the immediate vis-
ual area is low by default. That is, the crude information extracted
from the low resolution parts of the visual field should be "used" for
determining which further processing should be done. Second, in a vis-
ual environment with many competing stimuli, there is little gain from
being "set" for particular types of inputs in normal perception. The
visual system should be flexible enough to allow for gross initial cues
to suggest the special way for processing any given set of incoming
data. This suggests that a "multipass system," in which fine-grained,
or local processing, is guided b-y prior cursory, or global processing,
is superior to a system that tries to find a coherent structure for all
pieces of data simultaneously. This is in contradiction to the feature
models characterized by a parallel processing view, described by such
investigators as Gibson (1969), Selfridge (1959), and Treisman and
Gelade (1980), because the data gathering in the feature models involves
piecing together all stimulus elements into larger "wholes," which would
only then be processed further.
Navon has substantiated the simple but powerful global precedence
notion with investigations using abstract forms. In one experiment
that supports this emphasis, subjects were required to repeat a spoken
"H" or "S", and at the same time to press a button when a visual stimu-
lus occurred, without considering what it was. If the visual stimulus
was also an H or S, the acoustic reaction was slowed when The spoken and
5

visual letters were different, speeded up when they were the same. This
effect was independent of letter size. The most interesting condition
was his use of "compound" letters in which a large letter made up of
smaller letters was presented. In a "global-directed" condition, sub-
Jects were told to base their responses solely on the large letter; in a
"local-directed" condition, they were told to make their decision based
on the smaller letters. Navon found that subjects could successfully
ignore the small letters in the global-directed condition, responding as
rapidly to the large letter whether it was consistent with the smaller
letters or not. However, subjects in the local-directed condition could
not ignore the large letter, responding faster to the smaller letters
when they were the same as the large one. Irrelevant small, or local
letters were easily ignored, while global shape was impossible to ig-
nore. Navon argued that this demonstrated the "inevitability of global
processing" -- subjects had to process the larger letter first.
The global precedence model has striking similarity to and is
related to the interactive channels model of Estes (1972, 1974). In
this model, features of stimulus elements are conceived as exciting in-
put channels. Excitation of any input channel exerts inhibitory effects
on other channels going to the same or other feature detectors. The more
features a "noise" stimulus has In common with the target, the greater
the competition for the same input channels as measured by confusability
(Eriksen and Eriksen, 1979). The global precedence model appears com-
plementary because it seems to be describing a process Just slightly la-
ter than the preperceptual stage of concern in the Estes model. Inves-
tigations of the global precedece model to this point (Bjork and
Murray, 1977) have used the "compound letters" as did Navon.
6

A number of challenges were immediately presented to Navon's
argument of the inevitability of global precedence in immediate percep-
tual processing. Kinchla and Wolf (1979) suggested that the temporal
sequence of events in perceptual processing was not inevitably global-
to-local, but that limited ranges of visual angles in Navon's studies
were responsible for the results. They suggested that there is an opti-
mal size for forms and that forms of this size (20) would be processed
first, with higher and lower level forms processed subsequently as nec-
essary ("middle-out" processing). This result, though, only supports
the previous principle of optimal size precedence related to the work of
Larsen and Bundesen (1978), on size scaling. A simple idea that would
account for the preferred size (20) is that the perceptual reference
frame always begins at that size, other things being equal. If the
frame then had to be adjusted to a certain size in order to detect fea-
tures of forms that size, it would take longer the farther from optimal
was the desired size. All of which simply supports Navon's idea, since
very close views of a tree will give no notion that there is a forest to
be considered at all.
Further criticism came from Grice, Canham & Boroughs (1983),
Hoffman (1980), and Martin (1979), who have raised doubts about the
ubiquitious nature of the phenomenon. Their arguments suggest that
varying the size of the image, number of local elements, image bright-
ness, task instructions, and other related factors, will create an
entirely different visual environment, and fail to produce the global to
local sequence. One of the underlying issues emerging from the criti-
cisms is a concern with the artificial nature of Navon's stimuli. Natu-
ral and man-made forms have not been examined systematically because
7

these stimulus populations would require a scaling procedure to specify
the nature of the underlying global and local features resid ..t in each
stimulus item.
Finally, Garner (1983), has argued that many of the experiments
on global precedence suffer from a shortcoming that complicates their
Interpretation: isolated reaction times to the local and global cues ei-
ther have not been specifically evaluated or, when they have, have
frequently not been equated. This difference possibly reflects a
greater discriminability of the global cues, which would obviously bias
the results in favor of global processing. As noted, both the Miller
(1981), and Boer and Keuss (1982), data are interpreted as indicating
that global precedence is not a perceptual effect, but a manifestation
of a postperceptual process. Both an attentional bias (Miller) and re-
sponse competition (Boer and Keuss), have been suggested as possible
mechanisms for the effect.
More recent rebuttal from Navon (1981b, 1981c, 1983) however,
points out that these criticisms concern only to boundary condi-
tions on the phenomenon, which may limit universal applicability, but
does not diminish its importance in explaining most Immediate perceptual
processing under many conditions. Boer and Keuss (1982) contend, in
fact, that Kinchla and Wolf have actually replicated Navon's work using
a different paradigm, which simply varied the size of the image, and
thus adjusted visual angle. This may point up the limitations of the
foveal region of the retina, but hardly discounts the global phenomenon.
Looking at an image straight on, foveally, will likely not produce
global to local stages. However, when foveal fixation is not exercised,
8

F
such as during visual search, limited exposure, masking, image degrada-
tion, and so forth, then global-to-local stages will occur. By these
statements, Navon suggests that global precedence has considerable va-
lidity, since things are normally viewed in such a way as to produce it.
That is, we typically do not stare at new stimuli "head-on" and analyze
them at length, but we search and scan for meaningful information, con-
sistent with other goals.
Further concerns regarding the functional significance of Navon's
global precedence concept have continued. Kinchla, Solis-Macias,and
Hoffman (1983) stress the need for an "umbrella" concept to explain all
perceptual processing using the terms "top-down," "bottom-up," and "mid-
dle-out." The idea embraced here is that perceptual processing involves
all three, with Navon's work only a case of "top-down." In fact, these
investigators insist that all processing begins middle-out, and then may
proceed or be guided by bottom-up or top-down approaches (e.g.
Rumelhart, 1970). It is clear that although the debate may continue as
to precisely where the global precedence concept "fits in" with overall
perceptual theorizing, the critical issue here is to determine just how
robust the concept is in other circumstances. Extensions of the work
wauld benefit from using a variety of more applied tasks (to allow a
wider range of more real world stimuli) to assess its generalizability.
An example of such a task is searching for and locating targets on back-
ground map displays. This is the basis for the current research.
Hughes, Layton, Baird, and Lester,(1984) have begun this trend of
departure from the stimuli typically used to study global precedence
(compound letter stimuli). Given the questions raised by critics of
9

Navon's thesis, the thrust of the newest work is to explore the phenome-
non using a wider range of stimulus materials. Hughes, Layton, Baird,
and Lester take the approach of studying line segments believed to rep-
resent visual features in a very elementary sense: they are expected to
be effective stimuli for orientation-selective cells in the visual cor-
tex. Their findings indicate the effect of global precedence for these
stimuli is quite robust. The current effott examines the role of global
precedence in yet another area - predefined map symbols in everyday
use.
10

CURRENT INVESTIGATION AND HYPOTHESES
The theoretical arguments to this point have been substantiated
by studies of abstract images and forms which may have limited general-
izability to real world tasks. The current study applies the global
precedence perspective to extend Navon's simple construct to more mean-
ingful and complex stimuli. The extent to which global precedence is
operative in immediate processing has not been documented with complex
stimuli.
The nature of many applied search and location tasks is immediate
processing, as opposed to detailed analysis of the same image. Search-
ing for and locating symbols on situation display maps is an example of
such a task. The global precedence effect should be an important deter-
minant of the success of target search if in fact two symbols, one tar-
get and one non-target (distractor), are in the immediate search area.
Many investigators have shown the impact of distractor elements
and background factors in target search (e.g., Eriksen, 1952, 1953,
1955; Eriksen & Schultz, 1979; Eriksen & Eriksen, 1979; McClelland &
Miller, 1979; Pomerantz, Sager & Stoever, 1979; Bloomfield, 1972); how-
ever, the global precedence concept is a far simpler way to explain
the impact of symbol structure on detection, and thus may be more use-
ful in explaining performance in immediate map search tasks. For the
current study, a baseline condition establishing the superiority of
11
;,,,,,.=.,m .i. ddin ii lli l llllimin mi . .......
detecting the target alone as opposed to having to search for a target
in the presence of a distracting symbol, is the first hypothesis:
Hypothesis 1a: The speed of target symbol identificationwill be faster for a single target condition than for atarget plus distractor condition.
Hypothesis ib: The accuracy of target symbol identifica-tion will be greater in the single target condition thanin the target plus distractor conditions.
Since, according to the global precedence hypothesis, global
features are of central importance in certain tasks - especially those
of immediate processing -- attempts to process target and distractor
symbols which are globally similar should lead to greater task interfer-
ence than attempts to process symbols which are similar only in local
details. Specifically, the current map task requiring immediate search
and location of pre-cued targets -- military symbols -- is an example of
this type of task. Therefore it is further hypothesized that:
Hypothesis 2a: The speed of target symbol identificationwill be affected by the structural relation of a dis-tractor symbol to the target symbol. Speed of targetidentification will be fastest when the target is from adifferent global category than the distractor, and slow-est when the distractor is from the same globalcategory.
Hypothesis 2b: The accuracy of tarpet symbol identifica-tion will be affected by the structural relation of adistractor symbol to the target symbol. Accuracy oftarget identification will be greater when the distrac-tor is from a different global category than when thedistractor is from the same global category.
The interest in and discriminatory potential of speed and accuracy meas-
ures for this type of task follow directly from experimental tasks pre-
sented by the investigators mentioned above. In particular, Boer and
Keuss (1983) emphasize the importance of these measures for describing
12
the functions of individuals performing the visual detection and identi-
fication tasks under consideration. The current study consisted of two
phases:
1. Symbol selection and scaling
II. Symbol detection study
Each phase will be described separately below. Since the results of the
phase I scaling portion determined the global symbol structures used as
a basis for categorizing symbols for phase II, the analysis and results
of phase I will be presented prior to phase II, instead of In a separate
analysis and results section. Following the description of both phases,
the overall results and discussion will be presented.
13
I. SYMBOL SELECTION AND SCALING
Selection
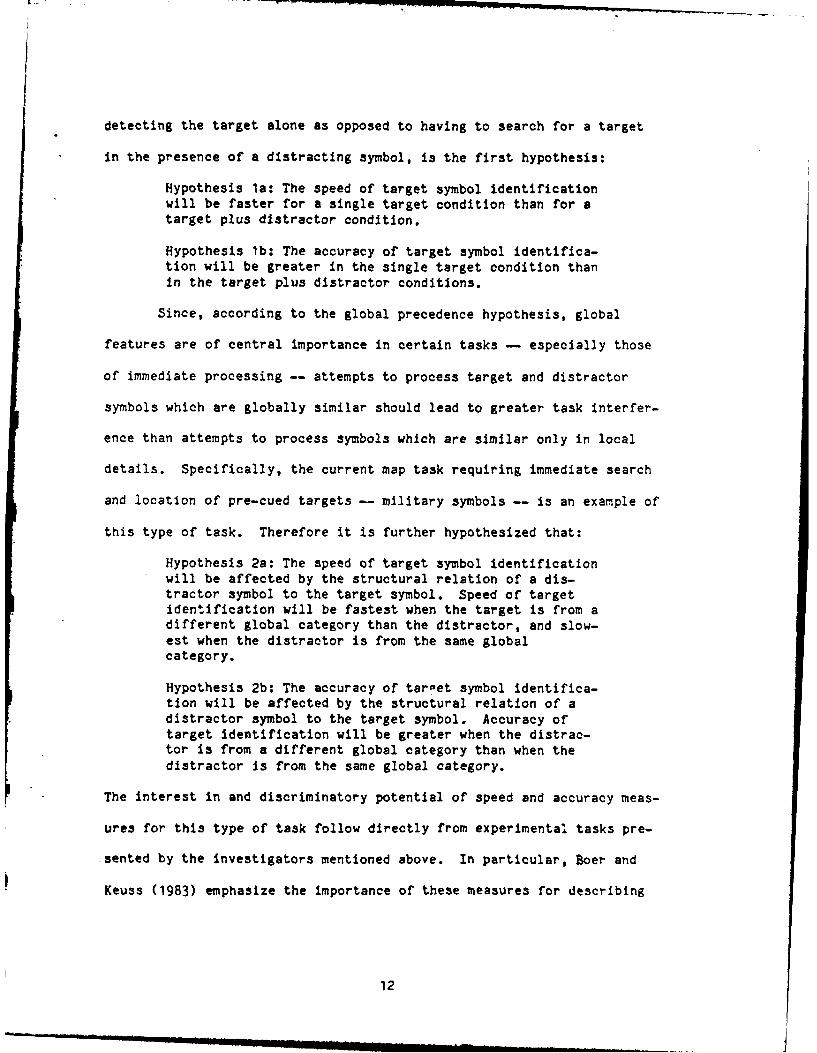
Two symbol populations were selected from a large catalog of
symbols in current military use (Johnston, Peck, and Landee, 1983). The
catalog contains listings of symbols from the three military services as
well as other defense agencies. In all, over 1000 military concepts are
represented by one or more symbols. Two concepts, having the largest
number of symbols, helicopter (19 symbols), and missile (11 symbols),
were selected for study. Figure 1 illustrates the helicopter and mis-
sile symbol populations used in this study.
Symbol Scaling
The purpose of the scaling analysis was to discover how people
categoriz the symbols within each of the sets (helicopter, missile)
according to global and local features. Multidimensional scaling analy-
sis (MDS) and Hierarchical Clustering Scheme analysis (HCS) were used
for this purpose. As was the plan here, other types of tasks - categor-
ization, classification - have ieen studied using the direct scaling of
object similarity relations to predict performance (King, Gruenewald,
and Lockhead, 1978).
MDS ANALYSIS
James (1890) considered similarity judgments to be among the
fundamental processes of reasoning. Similarity judgments (or, to use
the more general term, proximities) between stimuli, are the input data
15

7 14
L=
2 8X 15j
3 9 - 16J
4 10 FC - 17
511r 18
6 12 /A 19 e
13 Li
Helicopter Symbols
2 h 8
616
Missile Symbols
Figure 1. Helicopter and Missile symbols used in the study.
16

of MDS. Subjects judge these proximities for every paired combination
of stimuli. A relationship is presumed to exist between these subjec-
tive evaluations and distance as defined and measured on psychological
scales or dimensions, (e.g., polar opposites) such as high-low, round-
square, small-large, etc. Multidimensional scaling is designed to find
the dimensions, given the similarities (Carroll and Wish, 1974). The
output of MDS is a spatial representation which consists of a geometric
configuration of points (Kruskal and Wish, 1978), where every stimulus
item is represented by one of these points. Within this spatial con-
figuration, or map, lies the underlying or hidden structure of the data.
Stimuli contain coordinates for every configuration parameter, or dimen-
sion. The initial challenge is to determine the appropriate number of
parameters or dimensions within the multidimensional configuration rele-
vant to perceptual understanding of the stimuli. The extent to which
the data do not fit within a certain number of dimensions is referred to
as the stress of that dimensional solution. Stress is a goodness-of-fit
measure between the distances within the computer program-generated spa-
tial configuration and the subject-generated proximities. It is the
square root of a normalized residual sum of squares of the fit between
distances and proximities:
/2
Stress = £Jjk (djk - jk ) 2
Awhere the d's a'-e the distances and the d's are the proximities for all
stimulus pairs jk (Kruskal, 1964). Stress should decrease as dimension-
ality increases. The typical procedure for estimating the appropriate
number of dimensions, according to Wish and Carroll (1973), is to
17

calculate MDS soldtions for several dimensionalities noting where these
stress values begin to "level off." They suggest that if the stress
value for a two-dimensional solution is considerably larger than for a
three-dimensional solution, but the four-dimensional solution produces a
stress value close to that of the three-dimensional, then the preferred
configuration would be a three-dimensional solution. In the language of
Kruskal and Wish (19TB), this is a matter of identifying the "elbow" in
a plot of dimensionality versus str-ess values. One additional rule of
thumb these authors offer is that the number of stimuli sets an outer
boundary for .the possible number of dimensions which can be uncovered.
They maintain that there should be at least twice as many stimulus pairs
as dimensions, and in cases where the data comprise only a half-matrix
of all stimulus pair combinations (minus the diagonal pair of combina-
tions), the number of stimuli minus I should be at least four times the
number of discovered parameters;. or (I-1)>4R, where I is the number of
stimuli and R is the level of dimensionality.
After determining how many dimensions to use comes the problem of
Interpreting the dimensions. This entails specifying the psychological
meaning of each dimension (Carroll and Wish, 1974). Conceptually, the
procedure is to examine what the stimuli at one end of a dimension have
in common with each other and what they possess which differs from the
stimuli at the opposite end.
A scaling procedure has been developed (Takane, Young and
deLeeuw, 1977; Young and Lewyckyj, 1979) which allows nonmetric individ-
ual differences MDS. This procedure de-emphasizes the dichotomy of
metric and nonmetric measurement levels and proceeds from the assumption
that all observations are categorical (Takane, Young, and deLeeuw,
1977). This scaling technique has been named ALSCAL, for Alternating
Least Squares SCALing. The ALSCUL method involves an arbitrary dividing
of the potential parameter into several subsets. Least square estimates
are obtained for one of these subsets while the stipulation is estab-
lished that all the other subsets are known, constant features of the
solution. The estimation is then repeated in an alternating fashion
from one subset to another until all subsets have been initially esti-
mated. Iterations of this process proceed until solution convergence
occurs (Takane, Young, and deLeeuw, 1977).
Young (1970) feels that his nonmetric multidimensional scaling
procedure can allow the user to proceed with data analysis as if the
stimulus measurement level were ratio when the number of points is large
enough. By large enough, Young suggests approximately 15.
The present study employed the ALSCAL IV MDS program of Young and
Lewyckyj (1979), using the 19 helicopter symbols as stimulus points In
one analysis, and the 11 missile symbols as stimulus points in a second
analysis. The point of both analyses was to discover rather than impose
the dimensions used by persons in judging and interpreting the sets of
stimuli (Kruskal and Wish, 1978).
Hierarchical Cluster Scheme Analysis
The perceptual judgments obtained in the MDS analysis were
further analyzed using Johnson's hierarchical clustering method (1967).
The use of this method serves as a further "check" on the dimensions
identified in the ALSCAL MDS procedure. Shepard (1972) has argued that
this method provides a useful hierarchy to define further the perceptual
structure of the MDS analysis. The hierarchy defined in this procedure
19
uses the same judgment matrices of similarity as the MDS algorithm, but
collapsed across individual subjects to form one off-diagonal matrix.
The method essentially employs a minimum connectedness procedure based
on the computation of a distance function proceeding from the weakest
cluster (all symbols form separate clusters) to the strongest cluster
(all symbols are in one cluster), by merging symbols in a stepwise algo-
rithm along the way. Conceptually, successive distance measures are
combined to form chains, the sizes of which are the largest link dis-
tance from individual symbols. The chain distance Intuitively measures
a kind of connectedness of symbols through the Intermediate steps when
items are successively linked by the distance measures. The outcome of
this analysis is a hierarchically ordered grouping of the symbols rang-
ing from the weakest to the strongest clustering. A computerized ver-
sion of the hierarchical clustering scheme was used on the helicopter
and missile judgment data.(Bell Telephone Laboratories HICLUS program).
Method
Subjects
Twenty subjects were selected to judge symbols according to simi-
larity. These were 16 males and 4 females from an Introductory enlisted
course at the US Army Intelligence School, Ft. Huachuca, AZ. The range
of ages was from 18 to 31, and subjects were screened to insure no prior
familiarity with the symbols being used.
Procedure
The twenty participants viewed 226 35uM slides, each of which
contained a pair of symbols. The pairs were formulated by pairing all
possible combinations of symbols from the helicopter set (171 pairs) and
20

the missile set (55 pairs). The symbols were randomly paired so that
the same symbol was about equally shown on the right or left, and slides
were shown in random order, mixing among both sets. For each slide, the
task was to indicate, on a five point scale, how similar the two symbols
were. Figure 2 illustrates the rating scale used. This scale has been
used in numerous studies of this type for similarity judgment (Getty,
Swets, Swets, and Green, 1979). Slides were shown for an exposure dura-
tion of 3 seconds, followed by an interstimulus interval of 4 seconds
for marking the response. The exposure interval was carefully derived
from pilot testing to insure that the judgment was based on initial im-
pression only, with no additional opportunity to process the stimuli.
Instructions were carefully given to emphasize that the concern of the
study was simply to gather information on the similarity of the items at
first glance only, and to spend no time or effort trying to "recognize,"
assign meaningfulness, or utility to the symbols. The sole question at
hand was to judge similarity.
The stimulus slides were prepared by drawing with a black pen on
a flat, white matte background, and then photographing the images of all
possible pairs (random pairs previously derived) using an animation
stand. Slides were projected in a classroom setting with standard
lighting, and a standard Kodak Carousel projector equipped with a Pi
Alphax shutter and ADS timer/counter with shutter driver timing mechan-
Ism, that was programmed for the appropriate exposure and response in-
tervals. All subjects were seated approximately 20-30 feet from the
large screen, so that visual angle of the symbol images, approximately
20, was constant. The entire procedure took about 35 minutes.
21

Notat all Slightly Moderately Very Extremelysimilar similar similar similar similarI I I I I
Figure 2. Five-point rating scale used for similarity judgments.
22

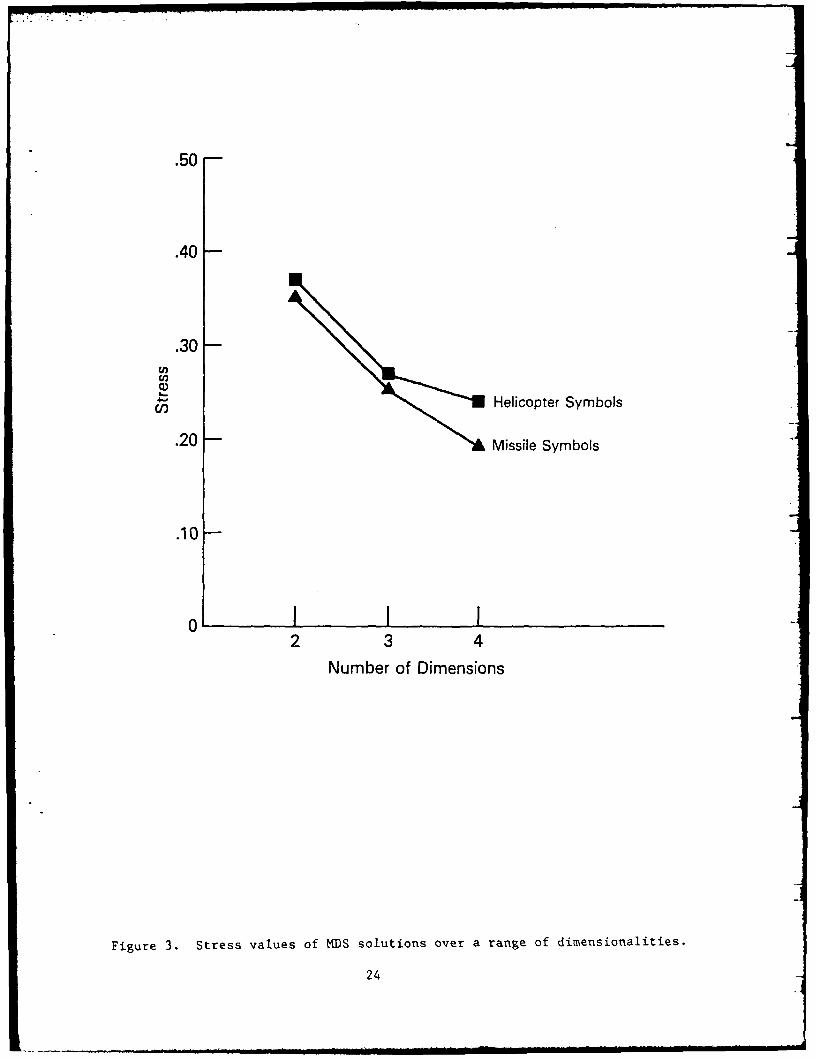
Results
Multidimensional Scaling Analysis
Following data collection, the similarity judgments of the 20
subjects were processsed by the ALSCAL IV program of Young and Lewyckyj
(1979). Solutions were derived at several levels of dimensionality so
that the stress values of these solutions could be compared and a deci-
sion made as to the appropriate dimensionality. Solutions at 2, 3, and
4 dimensions were computed. The stress values of these solutions, are
graphed in Figure 3, and it can be seen that the elbow of the plot comes
at the stress value of dimension 3 for both the helicopter data and the
missile data. Tables 1 and 2 show the values of all stimuli along every
dimension for the helicopter and missile symbols. Figures 4 - 9 present
plots of the derived stimulus configurations (spaces) for each dimension
against every other for both symbol groups.
Hierarchical Cluster. Analysis
The similarity data from above was also processed using a
computerized version of the Hierarchical Cluster Scheme (HCS) of Johnson
(1967). For this analysis the 20 individual data matrices of similarity
judgments were collapsed into a group matrix for the helicopter popula-
tion and one for the missile population. The HCS procedure, as indi-
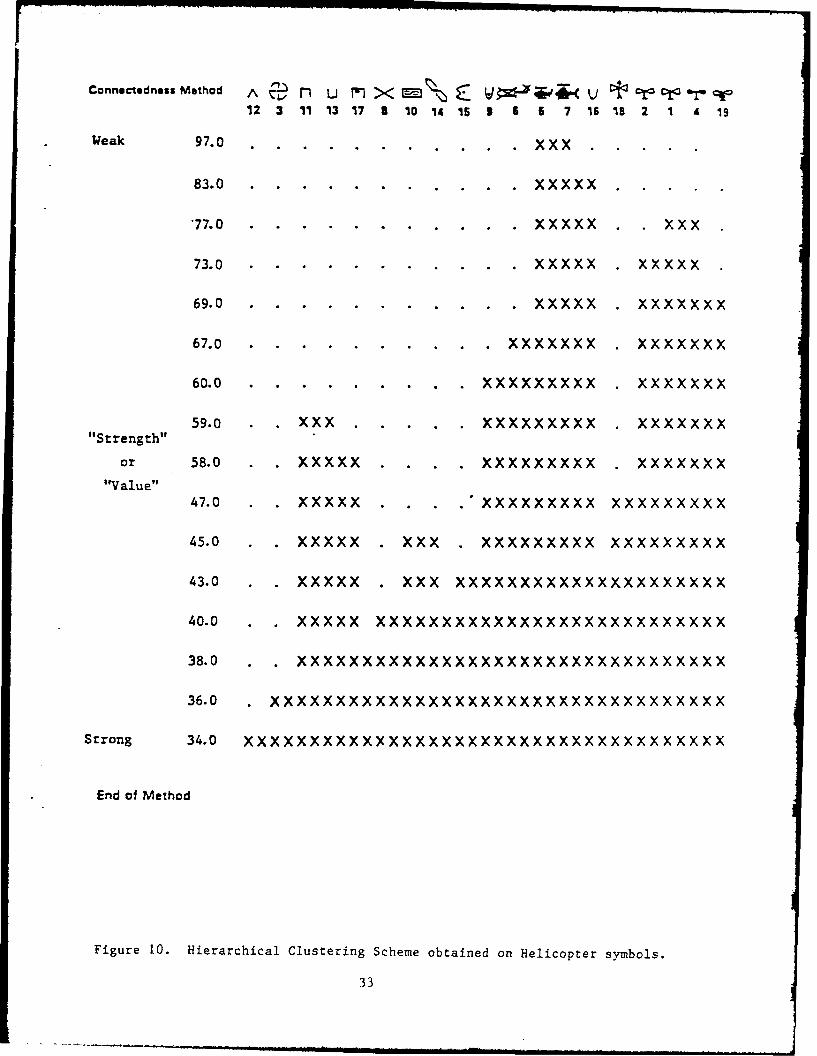
cated, provides a check on the output from the MDS analysis. Figure 10
presents the HCS output for the 19 helicopter stimuli and Figure 11 for
the 11 missile stimuli. The figures are interpreted as follows: the top
row indicates the stimulus Item number (refer to Figure. 1). Each suc-
ceeding row, from top to bottom, indicates clusters of stimuli from the
weakest possible clustering, where each item is it: own cluster,
23
.50
.40 -
.30C,
Helicopter Symbols
.20 Missile Symbols
.10
0 I I I2 3 4
Number of Dimensions
Figure 3. Stress values of MDS solutions over a range of dimensionalities.
24
DIMENSION
Symbol One Two Three
L 1.3795 -0.6772 -0.62632 1.3396 -0.4079 -0.7781
3 -0.5617 -1.4675 -1.09614 1.3456 -0.7795 -0.42445 ,P 0.5873 -0.0928 1.65426 0.6987 0.3629 1.5061
0.2527 -0.3731 1.62258 X 0.7876 1.5346 0.2209
9 U- -1.0934 -1.4568 0.2939
10 0.1273 1.1788 -1.2948
11 f] -1.5576 0.8571 - 0.464812 A -0.5852 1.2277 1.1898
13 Li -1.6319 0.6237 -0.439414% 0.4962 0.5864 -1.532015 -0.9027 -1.5300 0.288116 -1.0025 -0.8072 1.151717 F -1.6203 0.4871 -0.635518 0.7289 1.4106 -0.069819 cV 1.2118 -0.6768 -0.5663
Table 1. Dimension Stimulus Coordinates (Helicopter Syrbols)
25
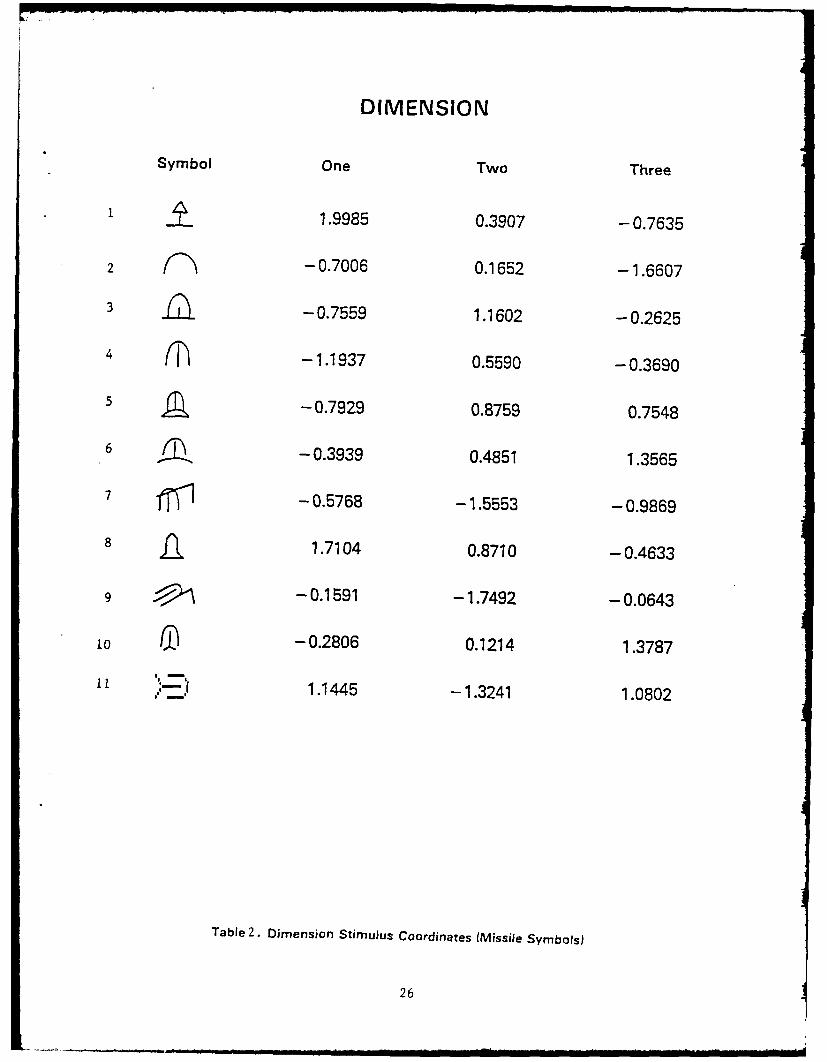
DIMENSION
Symbol One Two Three
1 .. 1.9985 0.3907 - 0.7635
2 -0.7006 0.1652 -1.6607
3 ni -0.7559 1.1602 -0.2625
4 -1.1937 0.5590 -0.3690
5 -0.7929 0.8759 0.7548
6 -0.3939 0.4851 1.3565
7 -0.5768 -1.5553 -0.9869
8 1.7104 0.8710 - 0.4633
-0.1591 -1.7492 -0.0643
10 in -0.2806 0.1214 1.3787
ii 1.1445 -1.3241 1.0802
Table 2. Dimension Stimulus Coordinates (Missile Symbols)
26

un a "p o Lo o po o Ln q L o .nqLpoL".0.01L 0 r" L00l U ~qqC Lq 01. OLD OLD OL(N 04 1. CN N10 (N (N 10 0O CN10 N O(,. - ,.- ,. ,._ 0 6..00. - ' - qI I I I I I 1 0I
Lq
(N,0
- (N
0L0
oC
N
0
--
LC)
• N(N0.
KI
ELN I
iI I I I" I i
Figue 4.Deried goup timuus sace:DimesionOne nd To (HlOe)
27'

Lo )M 0 OL OL OL OL OLD OLO OLO OD OLDNO 5T- M NO 5~ r- NO0 N mD r" 0 N m r 0 ONN N a; C; 0 0 0 0 0 NN; C C
Lo
o0
_:0
NH L
0 0
Lq
N
LL0
L'NI
LC)
LDCN
0 NI4
M M OLD OLDD 0 MOL 0 MD OLD OD OL OLD MNNO r, LO N C)r- LO NOC)N M r- O N MD r- O NI
Figure 5. Derived group stimulus space: Dimension One and Three (Helicopter).
28

In n C I C In n ,m In OL 0 I n OLD.. .
C DJ - 0 N CN 0 C n N 0C LO N C LO
CN Ci , - ,-- , - 0 0 66 0 , _ -i i i I I I I I I
1 I I I I I 1 I I -CD
L.q
0 -
In
N
x I I I I -
I)N.0 - CN
0!
C..C
In
0 C000
C
In
CN.J
InN'
In In Mn C) Mn In Mn ICD Mn In OLMDa' N% In CN ONr I C N M\ In -NO C In N- OCN
Figure 6. Derived group stimulus space: Dimension Two and Three (Helicopter).
29

d _N r- ..in N ~ .. . N O N i |N O N a I n N I | N
L O ,.- ,.-- ,.- 0 6 6 6 6 0 0 ,. -. " NI II I I I 1oI Ii I I I I l II I
L- OCN
"-O0
LO 0io
--
Ln
Lo
00
--
00o
'n
e
-i-
.O C O C OC O 0 'iC)L o o0 L n 0
oI
ein
11
I I I I I I II I I I I I I IN o i NOaF N q N N in F ON inr, ON I
Figure 7. Derived group stimulus space: Dimension One and Two (Missile).
30

NO 0 LO In NO I O C In) C) ON) In U' C O ) 0 C>NNqC r N r- M C 0 0 00 0 0M- I- LO- '-N "
CN
InC)
InCN
0
6n
- N05
0
In 0O
-0 6
C CD
LOi
-CD
.0O
N
MnCD In OLD OL OL OL OL 0 In OLD L0M D N" ED r- m -" -qooo~ '-N N -q N m r
Figure 8. Derived group stimulus space: Dimension One and Three (Missile).
31

NO C)r. - MnN N N N Mn N- ON Cn NO- N
SI I I I I i I 0
_N
-- LO,
CC
04 L 0CIn
00
N i!n
N'
I 0I I I
E 4 C I L OI
0 0O0 C-0
Cin
6
U'i
IC
CN
I~~~~L- INON n NOMin O N in O NO inm NN
N CN - M C4 ) - MON6oN 00 r-. 0 -- N N ,C -
Figure 9. Derived group stimulus space: Dimension Two and Three (Missile).
32
Connectedness Method A Un u m** Cra I r 12 3 11 13 17 8 10 14 15 3 6 5 7 16 18 2 1 A 19
Weak 97.0 . . . . . . . . . . . XXX . . . . .
83.0 . . . . . . . . . . . XXXXX . .
'77. 0.... ... .... . . . X . . XXX
73.0 . . . . . . . . . . . XXXXX . XXXXx
69.0.... .......... . . . XXXXX .XXXXXXX
67.0.................. . . XXXXXXX .XXXXXXX
60.0 . . .. ...... XXXXXXXXX .XXXXXXX
59.0 .. XXX ..... XXXXXXXXX .XXXXXXX
"Strength"
or 58.0 . xx .xxxx XXX....XXXXX.XXXXXXX"Value"
47.0 . XXXXX . . . . XXXXXXXXX XXXXXXXXX
45.0 . xx .XXX XXX . XXXXXXXXX XXXXXXXXX
43.0 XXXXX .x XXXXXXXXXXXXXXXXXXXXXXX
40.0 . xx .XXXXXXXXXXXXXXXXXXXXXXXXXXXXXX
38.0 . XXXXXXXXXXXXXXXXXXXXXXXXXXXX XXXXX
36.0 .XXXXXXXXXXXXXXXXXXXXXXXXXXXXXXXXX XX
Strong 34.0 XXXXXXXXXXXXXXXXXXXXXXXXXXXXXXXXX XXXX
End of Method
Figure 10. Hierarchical Clustering Scheme obtained on Helicopter symbols.
33

Connectedness Method !5ZLff ' g\ .. ~ i1 3 7 9 2 3 5 4 6 10 11
Weak 97.0. . . . xX
65.0. . . x XX X X
64.0. . . . . XX XX XX
63.0. . . . Xx xXXX XX
"Strength"or 56.0. . . x x xX X XXX XX
"Value"
51.0 . XX x XX x xXXX X XX X
50.0 X XX XX XX XX XX X XX
42.0 . XX XX XX XX Xx xX x xX X
39.0 XX XX XX XX X XXXX X XX X XX
Strong 37.0 XXX X XX XX XX XX XX X XXX XX X
End of Method
Figure 11. Hierarchical Clustering Scheme obtained on Missile Symbols.
34

signified by a ".", to the strongest clustering at the bottom, where all
stimuli are joined into one cluster. It is along the way that "X's" in-
dicate bonding between and then among items before final coherence into
one group. For example, for the helicopter stimuli, it Is clear that
items 5, 7, and 6 are a cluster, items 2, 4, 1 and 19 are a cluster, and
that these six in turn are eventually part of a larger cluster. Items
11, 13, and 17 are a separate cluster which merges strongly only as a
part of the total, full stimulus set-as-a-whole cluster. Clearly the
procedure identifies a hierarchy of clusters and sub-clusters based on
the distance metric.
Namiig of Stimulus Clusters
for Global and Local Features
Having determined the multidimensional scaling and hierarchical
clustering solutions, the next task was to match up the revealed clus-
ters with global and local descriptors. Although not in total agree-
ment, the two analyses provide nearly the same recognizable clusters.
The HCS solution provides large clusters which branch to smaller sub-
clusters, and the MDS portrayal by dimensional plots provides a means of
naming global groups and suggests certain local features. Figures 12
and 13 show the HCS analysis embedded in a three-dimensional portrayal
of the MDS solutions for the helicopter and the missile stimuli. The
three dimensions are named according to the salient features of the
identified clusters. For example, in the combined helicopter plot of
Figure 12, dimension one is vertical vs. horizontal orientation, the
salient feature being overall orientation. Dimension two is rounded/
smooth vs open/square. A final dimension is simplicity vs complexity.
35
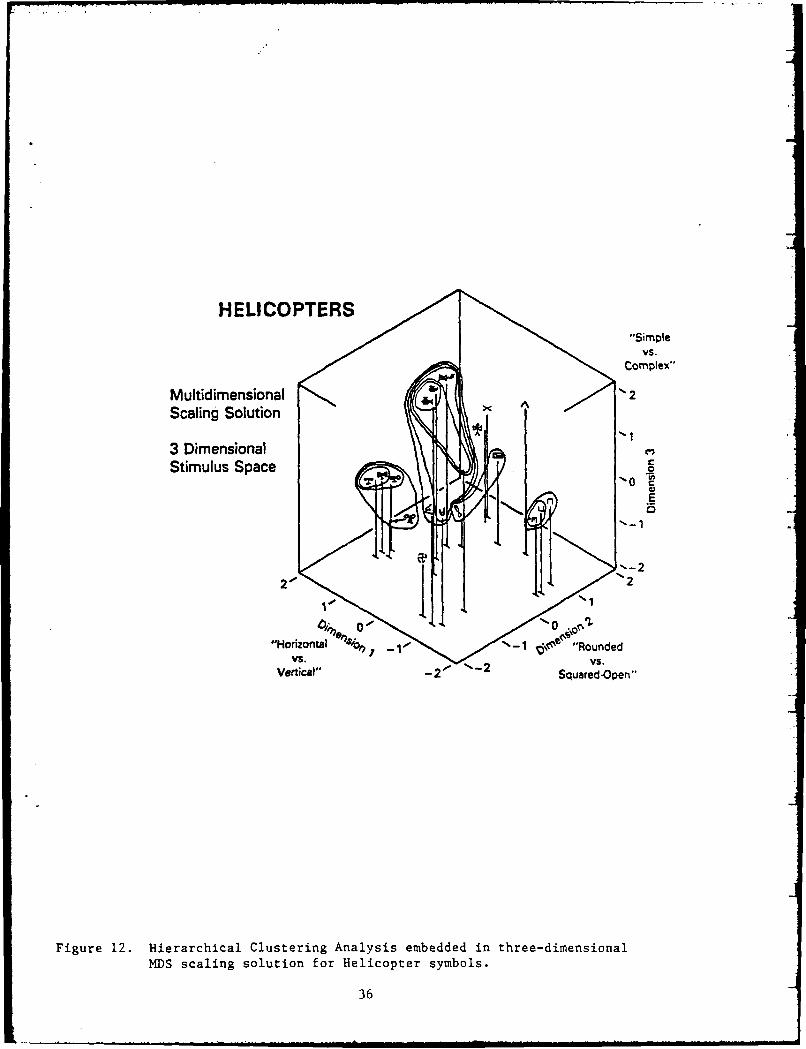
HELICOPTERS"Simple
VS.Complex"
Multidimensional 2Scaling Solution X
3 DimensionalStimulus Space
E
-2
-Horizontal "Roundedvs,.a"-2 vs.
Vertical" 2 Squared-Open"
Figure 12. Hierarchical Clustering Analysis embedded in three-dimensionalMDS scaling solution for Helicopter symbols.
36
L . . h •I i i ? -

MISSLES"Smooth/Roundvs.
Sharp/Open"
Multidimensional2Scaling Solution
3 DimensionalStimulus Space
E
2 2
4s;, a0" *"
"Simple" -"V ertical?VS. vs.
Complex" 2 2 Horizontal"
Figure 13. Hierarchical Clustering Analysis embedded in three-dimensional
MDS scaling solution for Helicopter symbols.
37

These same rough categorizations apply equally well to the missile popu-
lation. There are further distinctions relating to filled vs. unfilled,
two-part figure vs. one part figure, but these provide more specifica-
tion than is required to capture the global structural relations de-
scribed by the orientation and rounded/smooth descriptors.
The method of categorizing the identities of the stimulus
clusters was via visual inspection of the MDS and HCS plots. The sim-
plistic nature of the forms was straightforward enough to justify this
introspective approach, which is the method of choice for most analyses
(Takane, Young, and Lewyckyj, 1977). The clusters shown both by MDS di-
mensional plots and the HCS output diagrams capture 3 global clusters
for both the helicopter and missile stimuli, and within these, one or
two local levels.
For the helicopter stimuli, global cluster 1 (horizontal,
rounded, open) consists of items [2, 1, 4, 19). Global cluster 2 con-
tains items [9, 6, 5, 7, 16), (horizontal, closed), and global cluster
3, items (13, 11, 171 (vertical, square, open). Global clusters 1 and 2
are closer perceptually than clusters 1 and 3 or 2 and 3. Also, within
each global cluster, there are further subclusters which correspond to
local element definition. For example, cluster I contains items [1, 4]
which are most closely matched for both global and local features. Ac-
cording to the hypotheses presented previously, it would be expected
that the most interference in target detection would occur If item 1
were paired with item 4. This is because processing must proceed
through two initial global levels to a local level before a distinction
can be made. This would be less so if the two items were from global 1
and global 2, although there would be interference, and the very least
38

interference between global 1 and global 3, or global 2 and global 3.
Within global 3, however, again a great deal of interference would be
expected between items [11, 13), and to a lesser degree 117) with [11]
or [13). Items not clearly fitting into the three identified clusters,
standing "alone" as it were, are clearly from another type of global
population of which these are the sole representative. Referring back
to the named stimulus dimensions of the MDS plots, other types of sym-
bols in these sets could be devised. The hypothesized impact of the
stand alone symbols on the items in global sets 1, 2, and 3 already
identified would be minimal.
To summarize, for the helicopter items, three distinct clusters
are identifiable from both the MDS and HCS plots. The HCS structure
shows successive aggregation of items into two larger global clusters
[Gi, G23, and [G31. The MDS plots show dimensional comparisons which
allow the assignment of names (horizontal structure/vertical structure,
rounded/smooth structure, filled vs. unfilled, simple vs complex struc-
ture) to visually identify features which account for the global and lo-
cal clustering.
The missile stimuli follow a course similar to the helicopter
items. Global category 1 consists of items [4, 6, 10) (vertical, open);
global 2 [3, 5) (vertical, closed); and global 3 (7, 9) (horizontal,
open). Global 1 and 2 are subsets perceptually closer to each other
than global 3, just as in the helicopter population. The same reasoning
applies to the impact of any given item named as distractor on an item
named as target. Items [6) and [10) will interfere most with each
other, Just as will (3] with [5], and [7] with [9]. Greater interfer-
ence will occur In match-ups of global I items with global 2, than with
39
global 1 and 3 or global 2 and 3. Stimulus items not clearly in any of
the 3 global categories, (8), [13, [11), will also present minimal or no
interference in target identification. These identified structures are
precisely what is required to examine detection performance in a target
search task. This is the basis of Phase II: Symbol detection study.
40

L
II. SYMBOL DETECTION STUDY
Introduction
The identified symbol structures of Phase I form the basis of
treatment combinations to examine in a detection paradigm. A symbol detec-
tion study was conceived to offer a realistic simulation of the use of the
stimulus symbols. A common military task performed with symbols of this
type (helicopter, missile) is simply immediate search for and location
of a target upon request. These symbols are typically overlaid on a map
background sector which is unchanging; that is, an individual quickly
accomodates the map features (roads, terrain lines, rivers, grid squares,
etc.) and becomes concerned with the overlay of images against this
background to portray events or describe a situation. The identification
of a target symbol is the recognition of such an event.
Method
Subjects
Subjects were 5 males and 11 females, ranging in age from 19 to 45,
and selected from the local community. All had 20-20 normal or corrected
vision. All subjects saw all stimulus pair conditions.
Setting and Apparatus
A simplified version of this symbol search and locate task was
devised using a computer generated map display typical of those in use
or projected for use in this application (See Figure 14 for a photograph
of the digitized map display). The computer used to generate the
41

E
0
4.-
ro0
0 u
-)
0)
S..
0)
42-

displays and manage the stimulus presentation was a VAX 11/780 mainframe
driving a Sanders 1024X1024 high resolution color graphics system. Sym-
bols were generated using Fortran subroutines executable to permit draw-
ing with a data tablet. The hardware and software allowed selected
target and distractor symbols overlaid onto a map display to be presen-
ted as "slides" for a specified exposure duration.
Stimuli
The stimulus "slides" used In this task consisted of 127 map dis-
plays containing either one target symbol or one target symbol plus one
distractor symbol. The total of 127 trials was determined by selection
of candidate symbols from both the helicopter and missile sets which
were representative of the global clusters identified in Phase I scaling
analyses.
For the helicopter items, 12 symbols were selected, as shown in
Table 3. Items 13], [10], and [12] were selected as representative of
symbols from different global clusters to contrast with the 3 key clus-
ters identified above. Of these 12 symbols (from global clusters 1-3
and the additional miscellaneous distractors) all possible pairs of sym-
bols yield a total of 66 trials (nn-1)/2). A total of 82 helicopter
stimulus trials were produced by adding 16 trials of the "target alone"
condition (25% of 66).
For the missile items, a similar selection procedure was used,
with a total of 9 items, shown in Table 4. Items [8] and [1] were se-
lected as representative miscellaneous distractors. All possible pairs
using n=9 yields 36 trials, and an additional 9 target alone trials (25%
of 36), provides a total of 45 missile slides.
43

Table 3.
Identified Global Clusters from Scaling Analyses with Selected
Helicopter Symbols.
Global cluster 1: (1, 4, 2)
Global cluster 2: (5, 7, 6)
Global cluster 3: (11, 13, 17)
44

Table 4.
Identified Global Clusters from Scaling Analyses with Selected
Missile Symbols.
Global cluster 1: (6, 4, 10)
Global cluster 2: (S, 5)
Global cluster 3: (7, 9)
45

Combining the 82 helicopter trials with the 45 missile trials
yields the total 127 subject trials. Each slide was constructed by placing
either one or two symbols on the map background. This was done by dividing
the map into four equal quadrant areas, then into two circular zones
extending 1" and 3" (approximately 4.77' to 14.250 visual angle area) in
radius from screen center. Figure 15 presents a schematic drawing of the
quadrants and placement zones. The zones were derived from similar studies
to maintain subject search within a confined area while still providing a
parafoveal search region. Symbols were placed in separate quadrants to
allow a selection mechanism for subject response. A target was never in
the same quadrant as a distractor. The placement of targets and distractors
for each slide was accomplished by randomizing 1) quadrant, 2) placement
zone, 3) which item of a given pair would be target and which would be
distractor. The overall stimulus trial set of 127 items was then randomized.
This for any given trial a subject might see a target alone, a target-
distractor missile pair, or a target-distractor helicopter pair.
Symbol Size and Viewing Conditions. Particular attention was paid
to symbol size selection and subject viewing distance since visual angle
has been indicated as an important factor in the elicitation of the global
precedence effect. General agreement exists that images subtending a
2' visual angle are optimal for this purpose. The 20 selection is
supported by a summation of arguments by Ward (1982), who reconciles the
dispute between Navon (1977) and Kinchla and Wolf (1979) by suggesting
a principle of optimal size precedence. Features of forms nearest this
size will be detected first in a search paradigm; and the farther from
46

Upper Left /Upper Right
/0,
I ' € I
Lower Left Lower Right
, 1/
Figure 15. Schematic drawing of quadrant selection zones for symboltargets on the map display.
47

the optimal size the form is (larger or smaller) the slower will be detection
of the larger form or its features. Actual symbol size for this study was
1.27cm, with a subject viewing distance of 60cm. This provided the desired
visual angle of 20.
Symbol Color. Symbol color was a medium blue - full intensity for
pure blue and green bits on the Sanders Graphic system (Sanders "aqua") -
because this color normally is used for this type of military (Blue "Friendly"
Forces) application. Since all stimulus symbols were of the same color,
with an invariant background, this was not considered an additional
variable.
Procedure
Subjects were instructed to indicate the location of the target
symbol by pressing one of four function keys on a keyboard corresponding
to four "quadrants" on the screen: upper left, upper right, lower left,
and lower right. The instructions (see Appendix for text) illustrated
the four quadrants and provided a session of three practice trials which
could be repeated until the subject expressed familiarity with (confidence
in) the procedure. Following this the experimental procedure began,
presenting each of the 127 trials, using the following sequence for
each trial:
Target alone
Map display with one or two symbols for 0.8 seconds
Subject response (latency recorded from time of initial mapdisplay to key press)
48

The 127 trials were presented in two blocks (one of 65 trials and one of
62 trials) to allow for a short break. Half the subjects saw block one
followed by block two, and the other half of the subjects saw block two
followed by block one, to counterbalance for any practice and learning
effects which might have occurred. Each subject was tested Individually
which took about 15 - 20 minutes. Following a session, subjects were
thanked and dismissed.
Design
Each subject served as their own control for all stimulus
conditions. The design consisted of a repeated measures analysis of
variance for response latency and correctness of quadrant selection for
each trial. Further, the stimulus items for the helicopter and missile
populations were broken out into two separate analyses. Reflecting the
experimental hypotheses, the conditions for analysis were:
(1) Detection of target alone will be significantlyfaster and more accurate than detection of target with
distractor
Target + Distractor Target alone
102 trials 25 trials
(2) Speed and accuracy of target detection will beaffected by the presence of distractor symbols from sim-
ilar global and global-to-local structural categories.
The more globally and locally similar a distractor is toa target, the slower and less accurate will be targetdetection.
For the global categories and subcategories selected for the missile and
helicopter stimuli, four levels of interference were considered:
1. M:Most interference - symbols globally and locally similar
3 ';zlicopter pairs and 3 missile pairs
49
2. 2M:2nd most interference - symbols globally similar,locallydissimilar6 helicopter pairs, 2 missile pairs
3. 3M:3rd most interference - symbols from close global clusters9 helicopter pairs, 6 missile pairs
4. L: Least interference - symbols from distant global clusters48 helicopter pairs, 25 missile pairs
Results
The data from the 16 subjects were analyzed using a 5-way ANOVA
repeated measures design as detailed in Winer (1971). Four separate an-
alyses were performed, two for the helicopter items (response latency
and accuracy), and two for the missile items (response latency and accu-
racy). Mean reaction times (transformed to logarithms to normalize the
distribution) and mean proportion correct target selection were used for
analysis. Since the number of cell entries for the interference levels
described above was unequal, there may be some concern regarding mean
reliabilities. However, for each trial mean (target alone or target-
distractor pair) it will be recalled that 16 responses were obtained.
This repeated measures situation insures very high reliability even in
conditions containing only three target-distractor pairs (e.g., M condi-
tion), since in all cases, all subjects saw all stimuli. Also, hetero-
geneity of variances between conditions was examint ' using a variation
of Hartley's F max test (Winer, 1971). In no cases were the variances
indicative of violation of the homogeneity of variance constraint.
Tables 5-8 present summaries of the ANOVA result.
50
Table 5.
ANOVA Summary -Response Latencies, Helicopter Symbols
Source df MS F
Target-Distractor Interference 4 .01679 4.67
Error 60 .00359
*p < .005
51

Table 6.
ANOVA Summary -Response Latencies, Missile Symbols
Source df MS F
Target-Distractor Interference 4 .02014 5.35*
Error 60 .00377
*p < .001
52

Table 7.
ANOVA Summary - Response Accuracy, Helicopter Symbols
Source df MS F
Target-Distractor Interference 4 .06049 2.15 ns
Error 60 .02807
53

Table 8.
ANOVA Summary -Response Accuracy, Missile Symrbols
Source df ms F
Target-Distractor Interference 4 .11668 4.37*
Error 60 .02673
*p < .005
54

Following the ANOVA, planned comparisons between specific means
were conducted, using Duncan's Multiple Range test as detailed in
Pedhazur (1980), and Convey, (1980). The contrasts of interest corres-
pond to comparisons among the different global pairings to reveal the
impact of distractor items on target items, as well as the contrast be-
tween the target-distractor pairs and target-alone condition (Tables 9
and 10).
Helicopter Symbols - Latency Data
An F ratio (F= 4.67) from the one-way ANOVA performed on the
helicopter symbol response latencies was found to be significant
(p=<.005). The planned comparisons tested with the Duncan's Multiple
Range test yielded t-ratios indicating mixed support for the impact of
the target-distractor conditions. The predicted differences were,
first, the target alone condition would be faster than target-distractor
conditions, and this can be seen in contrast one (Table 9). Among the
symbol pair conditions, the predicted interference was to be greatest
(produce the slowest latencies) where symbols from within global catego-
ries were paired with one another (conditions M and 2M). Following
this, closer global categories were projected to interfere more when
representative symbols were paired (condition 3M), and least when dis-
tractors were from distant global categories, especially "stand alone"f
d1stractors (condition L). Mixed support is provided for the hypothesis
in this situation, as can be seen by the contrasts between the various
categories of symbol pairs. In the condition with most interference,
where globally and locally similar symbols were paired, the response
times clearly are longer (contrasts 2, 6, 7, 8), but not significantly
55

Table 9.
Planned Contrasts between Mean Response Latencies Using
Duncan's Multiple Range Test, Helicopter Symbols (o'Z= .05).
Description Mean Response Latencies (logrithms)
Control Condition (C) .12484Target-Distractor Conditions (TD) .17990
Individual Target-Distractor ConditionsMost distracting (globally + locally similar) (M) .20715Second most distracting (same global category) (2M) .15274Third most distracting (close global categories) (3M) .19192Least distracting (distant global categories) (L) .16781
Contrast Critical Value
1. C-TD = .05506 .04237 significant
2. M-C = .08231 .04708 significant3. 2M-C = .02790 .04237 n.s.4. 3M-C = .06788 .04603 significant5. L-C = .04297 .04458 n.s.
6. M-2M = .05441 .04603 significant7. M-3M = .01523 .04237 n.s.8. M-L = .03934 .04458 n.s.9. 2M-3M = .03917 .04458 n.s.
10. 2-L = .01507 .04237 n.s.11. 3M-L = .02411 .04237 n.s.
56

longer in all cases. Similarly, with the next most interference, (glob-
ally similar/locally dissimilar pairs), the contrast between this and
the most interfering and lesser interfering conditions shows only a sig-
nificant difference between the first and second categories (contrast
6). Remaining categories (contrasts 7-10), do not discriminate signifi-
cantly among themselves. Although the most distracting category emerges
as requiring the most processing time, the other categories are slightly
out of order, proceeding from most to least.
Missile Symbols - Latency Data
An F ratio (F= 5.35) from the one-way ANOVA perfomed on the
missile response latencies was found to be significant (p < .001).
Planned contrasts between specific means, using Duncan's Multiple Range
Test, are shown in Table 10. Findings are very similar to those from
the helicopter population, although individual contrasts in the target-
distractor conditions are a little better differentiated. The control
(target alone) condition is significantly different from target-distrac-
tor conditions (contrast 1). Also, all target-distractor conditions
singularly support this except in the least distracting category (con-
trasts 2-5). As in the helicopter data, the categories of distraction do
not proceed neatly in order from most to least (contrasts 6-11), al-
though their order Is different here than for the helicopter symbols.
In general, for both the helicopter and missile populations, support is
provided for the original hypotheses related to response latency, al-
though hypothesis 2a is supported more by overall trend than by signifi-
cant mean differences.
57

Table 10.
Planned Contrasts between Mean Response Latencies Using
Duncan's Multiple Range Test, Missile Symbols (c<= .05).
Description Mean Response Latencies (Logs)
Control Condition (C) .13649Target-Distractor Conditions (TD) .19332
Individual Target-Distractor Conditions
Most Distracting (globally + locally similar) (M) .19196Second most distracting (same global category) (2M) .23068Third most distracting (close global category) (3M) .18968Least distracting (distant global categories) (L) .16101
Contrast Critical Value
I. C-TD = .05683 .03819 significant
2. M-C = .05547 .04148 significant3. 2M-C = .09416 .04825 significant
4. 3M-C = .05319 .04017 significant
5. L-C = .02452 .03819 n.s.
6. M-2M = .03869 .03819 significant7. M-3M = .00228 .03819 n.s.8. M-L = .03095 .04017 n.s.9. 2M-3M = .04097 .04017 significant
10. 2M-L = .06964 .04148 significant11. 3M-L = .02867 .03819 n.s.
58
Helicopter Symbols - Accuracy Data
An F ratio from the one-way ANOVA (F=2.15) on the proportion of
correct helicopter targets selected, by distractor category, was found
to be not significant. During pilot study for this detection experi-
ment, it was resolved that a .8 second presentation was optimal for subjects
to allow search and location of the targeted symbol. It is clear that,
for these accuracy data, hypotheses lb and 2b are not supported. The
reason for maintaining the long presentation time was to provide the
needed opportunity to search the display. It appears that this also
allowed for a ceiling effect because, in most cases, subjects were able
to select the correct symbol as target. Table 11 shows contrasts among
the proportions correct. Although these are not significant, the trend
toward increased errors in the distractor conditions is apparent, especially
in the most distracting condition matched with the target-alone condition
(contrast 2).
Missile Symbols - Accuracy Data
An F ratio obtained from the one-way ANOVA (F=4.37) on the
proportion of correct missile targets selected, was found to be signifi-
cant (p < .005). In this case, hypothesis lb is supported (difference
in accuracy between target-alone and target-distractor conditions);
hypothesis 2b (discrimination between specific target-distractor condi-
tions) is not supported. Table 12 shows the contrast means for these
findings. Contrast 1 (control vs target-distractor) is significant, as
are all individual target-distractor categories vs control (contrasts
2-5). The within target-distractor conditions do not provide signifi-
cant differences (contrasts 6-11). Although the trend is toward fewer
59
Table 11.
Planned Contrasts between Mean Response Accuracies
(Proportion Correct) Using Duncan's Multiple Range Test,
Helicopter Symbols, (c<= .05).
Description Mean proportion correct
Control condition (C) .96
Target-Distractor Conditions (TD) .86
Individual Target-Distractor Conditions
Most distracting (globally + locally similar) (M) .83Second most distracting (same global category) (2M) .85Third most distracting (close global categories) (3M) .88Least distracting (distant global categories) (L) .90
Contrast Critical Value
1. C-TD = .10 .118 n.s.
2. M-C = .13 .131 n.s.3. 2M-C = .10 .128 n.s.4. 3M-C = .08 .124 n.s.
5. L-C = .05 .118 n.s.
6. M-2M = .02 .118 n.s.
7. M-3M = .05 .124 n.s.8. M-L = .07 .128 n.s.9. 2M-3M = .02 .118 n.s.
10. 2M-L = .05 .124 n.s.11. 3M-L = .02 .118 n.s.
60

Table 12.
Planned Contrasts between Mean Response Accuracies
(Proportion Correct) Using Duncan's Multiple Range Test,
Missile Symbols, (0(=.05).
Description Mean proportion correct
Control Condition (C) .96Target-Distractor Conditions (TD) .79
Individual Target-Distractor Conditions
Most distracting (globally + locally similar) (M) .83Second most distracting (same global category) (2M) .71Third most distracting (close global categories) (3M) .80Lease distracting (distant global categories) (L) .82
Contrast Critical Value
1. C-TD = .17 .115 significant
2. M-C = .13 .115 significant3. 2M-C = .25 .128 significant4. 3M-C = .16 .125 significant5. L-C = .14 .122 significant
6. M-2M = .12 .125 n.s.7. M-3M = .03 .122 n.s.
8. M-L = .01 .115 n.s.9. 2M-3M = .09 .115 n.s.
10. 2M-L = .11 .122 n.s.11. 3M-L = .02 .115 n.s.
61

correct in the more distracting conditions, overall the mean differences
do not represent discretely significant steps.
Discussion
A number of conclusions may be drawn from the response latency
and accuracy data presented above. First, there is a trend toward
faster response time and greater accuracy in detecting a target alone
than in selecting a target in the presence of a distractor. Second, the
accuracy measure provides only a picture of the trend of factors impor-
tant to the performance rather than a precise discrimination between
interference conditions. Third, although response latency is an impor-
tant discriminator of interference conditions among target-distractor
pairs, there is considerable variability in the mean scores, some of
which are very rapid, similar to the target alone condition, and others
which are clearly from different populations. Fourth, the missile popu-
lation of symbols was better in terms of definition of global categories
which determined the performance in the detection study.
In earlier discussions about Navon's studies (1977, 1981a, 1981b,
1981c), using compound letter stimuli, it was stated that these stimuli
were very carefully constructed to precisely capture global as well as
local features, in an almost artificial way. In the present study, an
existing database of symbols was examined in order to derive the global
and local features. The scaling procedures used (MDS and HCS) seem to
provide clarity in defining global features, but fail to provide expli-
cation of local features. In the studies using artificial representa-
tions, the task typically involves very short (less than .1 second)
exposures and no demand for target search. For the current study,
62
exposure time was increased to allow for search, since the image was al-
ways in a slightly different position, and to allow for recognition of
location (quadrant of map display) as a component of the response.
Given this additional processing time made available, it is likely that
subjects were able to proceed, in many cases, beyond the initial global
analysis, and on to local differentiations. This would explain not only
the ceiling effect for response accuracy, but suggests that a more de-
tailed understanding and definition of local features is imperative for
prediction of latency in this type of task.
With this line of reasoning, a reexamination of the latency data
sets was felt to be in order, and in fact revealed a slightly different
categorization of distractor conditions, viewed post hoc. The HCS an-
alysis procedure is well suited for this recategorization since the raw
data from the original stimulus symbol presentations for each subject
comprises a matrix of response times for all target-distractor pairs. By
collapsing all subjects' responses into a single matrix of mean laten-
cies (one matrix for helicopter symbols and one for the missile sym-
bols), these can be analyzed using the HCS procedure to derive clusters
to show which groups are performing at what level of interference. Fig-
ure 16 shows the HCS output of such an analysis for the helicopters, and
Figure 17 the same for the missiles.
The new clusterings provide the needed insight into local feature
definition. The previous categorizations did not anticipate the criti-
cal role of local feature similarity (conditions M, 2M, 3M, and L,
detailed in the design section above) as it relates to all global clust-
ers. It was assumed that global precedence would prevail (provide
greatest interference) before the influence of any local features. Since
IP 63
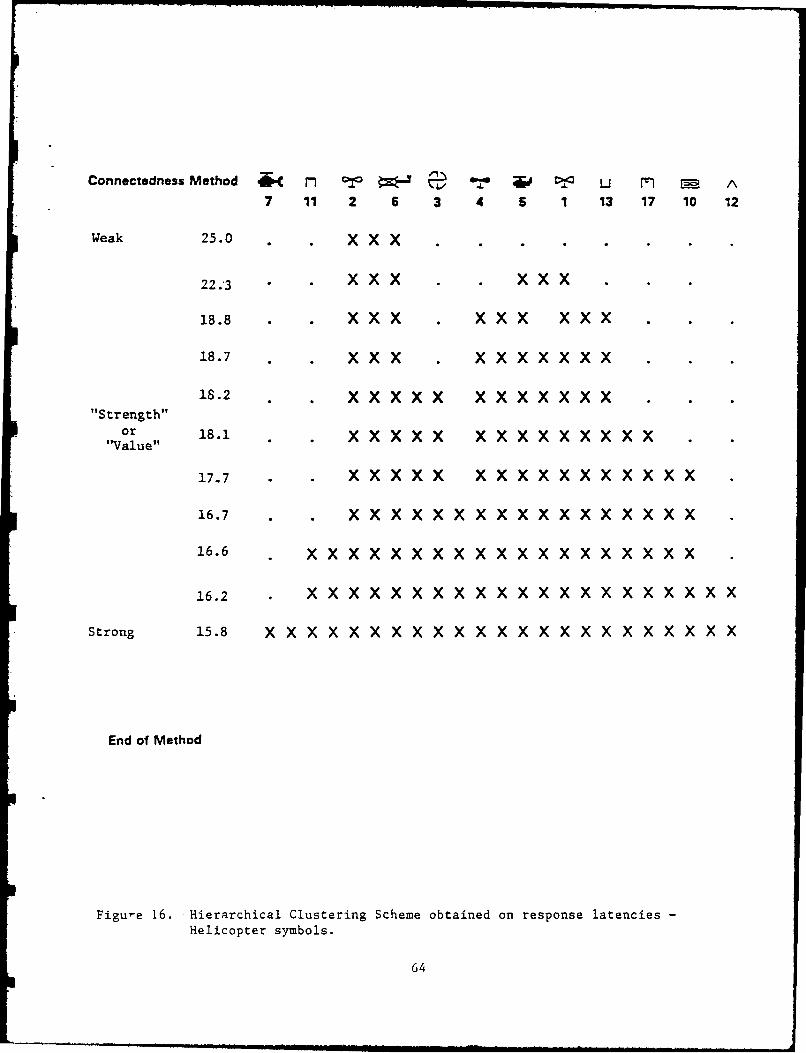
Connectedness Method *( l cr * Um A7 11 2 6 3 4 5 1 13 17 10 12
Weak 25.0 xX . .
22.3 . XX . . X x
18.8 . . XX . xX xXX X
18.7 XX .xX XXX XX X
18.2 . XX X x XX XX XX X"Str ength"
or 18.1 . XX X x XX XX XX XX X
17.7 . . XXXX XX XX XX XX XX X
16.7 . . X XX XX XXX X XX X X XX
16.6 x x x x x xxxxx x x Xx x
16.2 XX X XXX XX XX XX XX XX XX X X
Strong 15.8 X xX xX xXX XX XX X xXX XX XX XX X
End of Method
Figu-e 16. Hierarchical Clustering Scheme obtained on response latencies-Helicopter symbols.
64

. . .. .. 0 j g I I _ ! P II EU . I l I I I I m n e ' ' q - ' '
Connectedness Method .L . T' I ,. i £k '5 3 4 10 6 7 8 9 1
Weak 20.6 X • .
19.6 x XXX
17.6 X XX X XX X X X
17.2 . X XXX X XX • X XX
"Strength" 17.1 XXXXXXXXX .or 1.
"Value"16.4 X X X XX X X XXXX X X X
15.9 X X X X X X X X X X X X X XX
Strong 15.6 X X X X X X X X X X X X X X X X
End of Method
Figure 17. Hierarchical Clustering Scheme obtained on response
latencies - Missile symbols.
65

the exposure time for the current task was more extended than for previ-
ous studies, the role of local features became prominent. The HCS on
response latencies demonstrates that, in many cases, symbols linked by
locally similar features, even though from different global categories,
represent the greatest interference for target detection. For example,
in Figure 16, (helicopters), symbols 2 and 6, followed by 2, 6, and 3
emerge as a cluster. Symbol 1 eventually becomes aligned with the old
global 3 category (symbols 13, 17, and 10 - refer to Table 3). The or-
iginal "M" or most distracting condition remains intact but it is second
in level of distraction to the globally different/locally similar pairs.
Essentially the HCS provides a way to recategorize the stimulus popula-
tions into more meaningful groups, which account for local feature defi-
nition. For the helicopter symbols, five categories are evident based
on pairings of symbols from the HCS clusters. Some of these are intact
from the old categories and some represent shifts. Table 13 lists the
new categories for the helicopter symbols from most to least interfering
conditions based on the HCS analysis. The new missile clusters follow a
course similar to the latencies for the helicopters. Again a new glob-
ally different/locally similar category emerges which presents the most
interference to target detection. In the case of the missile symbols,
the previous "2M" or second most interfering category is now absorbed
into the newly defined group. Table 14 lists the new missile category
conditions. The original listings of global categories (Tables 3 and 4)
were based on examinations of MDS space which provided global cluster-
ings. It was projected that as distance between clustzrs increased, in-
terference would decrease. The new scheme, formulating some
subclusters, permits the importance of local features to emerge.
66

Using the new categories, revised one way ANOVAs were performed
in the manner previously described, but using the category shifts.
Tables 15 and 16 contain the helicopter and missile summaries, and
Tables 17 and 18 show the contrasts between specific means. For both
the helicopter and missile sets, F ratios were again significant, this
time both at the p < .001 level of significance. More importantly, the
log mean scores were aligned to reflect greater to lesser target dis-
traction, with the newly defined globally different/locally similar
category first. It is immediately obvious in examining the contrasts
from both symbol sets that these show a more meaningful trend and are
descriptive of the actual performance. In the case of symbols which are
very distant in the MDS space, with both global and local dissimilarity,
the response times are nearly the same as the target alone condition.
The critical symbol combinations which provide the greatest interference
to search performance (and thus are the best predictors of detection
latency) are, mainly, locally similar pairs, and then globally and lo-
cally similar pairs.
67

Table 13.
Identified Symbol Categorizations Delineating Global and
Local Features, from Most to Least Interference.
Most Interference Globally different/Locally similar
Globally similar/Locally similar (same as M before)
Globally similar/Locally different (previous 2M)
Globally different/Locally different-close in MDSspace
Lease Interference Globally different/Locally different-distant in MDSspace
68

Table 14.
Identified Symbol Categorizations Delineating Global and
Local Features, from Most to Least Interference
(Missile Symbols).
Most Interference Globally different/Locally similar
Globally similar/Locally similar (previous 2M)
Globally different/Locally different-close inMDS space
Least Interference Globally different/Locally different-distant inMDS space
69

Table 15.
ANOVA Summary -Response Latencies, Helicopter Symbols
(Revised).
Source df MS F
Target-Distractor Interference 5 .02507 5.42*
Error 75 .00463
*p < .001
70

Table 16.
ANOVA Summary - Response Latencies, Missile Symbols
(Revised).
Source df MS F
Target-Distractor Interference 4 .01662 5.64 *
Error 60 .00295
• p < .001
71

Table 17.
Planned Contrasts between Mean Response Latencies Using
Duncan's Multiple Range Test, Helicopter Symbols:
Revised (W=.05).
Description Mean Response Latency (log)
Control Condition (C) .12484
Target-Distractor Conditions (,D) .18118
Individual Target-Distractor Conditions
Globally different/Locally similar (GD/LS) .23166
Giobally similar/Locally similar (GS/LS) .20715
Globally different/Locally different-close (GD/LDC) .15872
Globally different/Locally different-distant (GD/LDO) .15563Globally similar/Locally different (GS/LD) .15274
Contrast Critical Value
1. C - TD = .05634 .04811 significant
2. GD/LS-C = .10682 .05439 significant
3. GS/LS-C = .08231 .05345 significant4. GD/LDC-C = .03388 .05226 n.s.
5. GD/LDD-C = .03079 .05061 n.s.
6. GS/LD-C = .02790 .04811 n.s.
7. GD/LS-GS/LS = .02451 .04811 n.s.8. GD/LS-GD/LDC = .07294 .05061 significant
9. GD/LS-GD/LDD = .07603 .05226 significant10. GD/LS-GS/LD = .07892 .05345 significant11. GS/LS-GD/LDC = .04843 .04811 significant12. GS/LS-GD/LDD = .05152 .05061 significant
13. GS/LS-GS/LD = .05441 .05226 significant14. GD/LDC-GD/LDD = .00309 .04811 n.s.
15. GD/LDC-GS/LD = .00598 .05061 n.s.
16. GD/LDD-GS/LD = .00289 .04811 n.s.
72

Table 18.
Planned Contrasts between Mean Response Latencies Using
Duncan's Multiple Range Test, Missile Symbols:
Revise&(OK = .05).
Description Mean Response Latency (Log)
Control Condition (C) .13649
Target-Distractor Conditions (TD) .17931
Individual Target-Distractor Conditions
Globally different/Locally similar (GD/LS) .21221
Globally similar/Locally similar (GS/LS) .19196
Globally different/Locally different-close (GD/LDC) .17082
Globally different/Locally different-distant (GD/LDD) .14226
Contrast Critical Value
1. C-TD = .04282 .03840 significant
2. GD/LS-C = .07572 .04266 significant
3. GS/LS-C = .05547 .04171 significant
4. GD/LDC-C = .03433 .04040 n.s.5. GD/LDD-C = .00577 .03840 n.s.
6. GD/LS-GS/LS = .02025 .03840 n.s.7. GD/LS-GD/LEC = .04139 .04040 significant
8. GD/LS-GD/LDD = .06995 .04171 significant9. GS/LS-GD/LDS = .02614 .03840 n.s.
10. GS/LS-GD/LDD = .04970 .04040 significant
11. GD/LDC-GD/LDD = .02856 .03840 n.s.
73

GENERAL DISCUSSION
Previous studies investigating the efficacy of the global
precedence concept to explain perceptual processing (Navon, 1977, 1981;
Kinchla & Wolf, 1979; Martin, 1979, etc.) have focused on artificially
constructed stimuli to insure the unambiguous definition of global and
local features, and have used threshold detection tasks. Only recently
have extensions of the global precedence work been developed (Hughes,
Layton, Baird, & Lester, 1984) to examine its utility by using other
types of stimuli. The current study has been an attempt to apply scal-
ing techniqoes to an existing database of predefined symbols, and to
elicit the global and local features as they already reside in the im-
ages. Limited success is encountered in using this approach. The
global/local distinctions are valuable in describing images which are
perceptually close, and thus can be predictive of greater interference
in detection performance. However, the scaling method (MDS) used is not
as precise as is required to completely describe local features, which
are an important determinant of perceptual processing time in the search
and locate task used in this study.
The hypotheses, as stated in the introductory section, were
directed toward differentiating target-alone performance from target de-
tection with various types of distractor sysflols. Clear differentiation
was achieved for the response latency measure (hypothesis la and 2a),
but performance accuracy (hypothesis lb and 2b) only suggests a trend.
As opposed to simple detection threshold studies, a search task requires
75
more time, and subjects typically have the capability to select the cor-
rect answer. The response latency seems to be a more effective measure
than performance accuracy for discrimination of target-distractor com-
binations which delay target selection.
Since the scaling techniques do not provide the needed detail to
allow complete one to one correspondence between clusters and response
latencies, it appears that the MDS analysis is only a first step toward
definition of image features which will be predictive of detection per-
formance. If distance between symbols in the MDS space were predictive
by itself, the distances matrix obtained during the scaling analysis
would produce a high negative correlation as a function of performance
time. That is, as distance between symbols increases, time for response
should decrease. In fact, it does not. Pearson - values of r= -.06
(helicopter) and r= .36 (missile) Indicates virtually no relationship
between the MDS distances and response time. This is because the needed
final categorizations of symbols by local features are not captured by
the MDS clusters alone. Further definition of local elements are needed
to reveal the actual critical clusters for impacting the response meas-
ure for this type of task.
This is not to imply that the global precedence concept cannot
play a valuable role in describing image structure in a way that will
allow useful prediction. The data from this investigation clearly dem-
onstrate that images which are globally and locally similar will inter-
fere significantly with each other in a target detection task. However,
further refinement of a priori scaling procedures will be required in
order to elicit local features. One possible approach to this would be
to combine known images with well defined global and local features with
76

the database of images projected for study, during the similarity judg-
ment phase. In this way prior knowledge would be used to create the
additional locally similar category because like symbols from the test
database would cluster with the "planted" images of known local fea-
tures. In the current study, only by looking post hoc at the perform-
ance data matrix can visual inspection reveal the obvious regarding lo-
cal feature similarity. It is now clear that this plays a major role in
perceptual performance for symbol target search tasks.
b
@ 77
SUMMARY
The concept of global precedence in perceptual processing in the
psychological literature was evaluated in terms of its efficacy In pre-
dicting detection of map symbols in current use. The essence of the
global precedence position is that perception proceeds temporally,
through stages, from the recognition of global features to more local,
fine grained analysis of individual elements. This investigation is a
departure from previous studies of the concept, used real world stimuli
in a detection task instead of artificially constructed, abstract stimu-
lus images. The extension of the global precedence idea to a task
analogous to those in applied settings was done to allow a broader in-
terpretation of the global precedence concept; a parsimonious way of ex-
plaining detection performance for the search and locate task used also
was expected.
In the procedure, selected map symbols were categorized according
to global and local features, using MDS techniques as well as hier-
archical cluster analysis. Then a detection task was performed using
the symbols against a homogeneous map background. The hypotheses under
consideration were:
Hypothesis la: The speed of target symbol identificationwill be faster for a single target condition than for atarget plus distractor condition.
Hypothesis Ib: The accuracy of target symbol identifica-tion will be greater in the single target condition thanin the target plus distractor condition.
79

Hypothesis 2a: The speed of target symbol identificationwill be affected by the structural relation of a dis-tractor symbol to the target symbol. Speed of target
identification will be fastest when the target is from adifferent global category than the distractor, and slow-
est when the distractor is from the same global cate-
gory.
Hypothesis 2b: The accuracy of target symbol identifica-tion will be affected by the structural relation of adistractor symbol to the target symbol. Accuracy oftarget identification will be greater when the distrac-
tor is from a different global category than when the
distractor is from the same global category.
The response latency and accuracy measures from the detection
study were analyzed using a one-way repeated measures ANOVA followed by
planned comparisons between target-distractor category means using
Duncan's Multiple Range Test. Findings generally offered strong support
for the hypotheses la and 2a, for response latency, but somewhat weaker
support for the accuracy measures included in hypotheses lb and 2b. The
initial analysis, although discriminating among target-distractor condi-
tions in detection performance, did not reflect the impact of global
precedence in all cases. A follow-up clustering of response latencies
using Hierarchical Cluster Scheme (HCS) analysis revealed that local
feature similarity played a more prominent role in discriminating symbol
groups than was originally suspected. When revisons to the original
groupings were made to adjust for this local similarity factor, revised
ANOVAs and comparisons allowed for statistically significant and mean-
ingful description of the performance.
The global precedence concept is a viable and useful one in
describing symbol populations in existence as long as the a priori scal-
ing procedures used to derive global and local features can provide the
definition required to replicate the work done with the previously used
89

artificially constructed images. In this particular study, which used
two actual symbol sets, helicopter and missile map symbols, the missile
symbols, being fewer in number and more homogeneous in appearance, were
easier to scale and interpret. The helicopter group, being larger and
more diverse, resulted in difficulties in the elicitation of global and
local features, although both symbol groups provided the same general
trends. Clearly the use of pre-existing symbol sets must be scaled pre-
cisely, perhaps in conjunction with other, more abstract but well de-
fined images, that are known in their global and local features. In
this way a fine discrimination of new symbol features can be obtained on
any symbol population to validly predict performance.
81
REFERENCES
Atkinson, R. C., and Shiffrin, R. M. Human Memory: A proposed systemand its control processes. In The Psychology of Learning andMotivation. Vol. 2, G. H. Bowen & J. T. Spence (Eds.) New York:Academic Press, 1968.
Attneave, F. Some informational aspects of visual perception. Psycho-logical Review, 1954, 61, 183-193.
Bjork, E. L. and Murray, J. T. On the nature of input channels in vis-ual processing, Psychological Review, 1977, 84, 472-484.
Bloomfield, J. R. Visual search in complex fields: size differences be-tween target disc and surrounding discs. Human Factors, 1972, 14,139-148.
Boer, L. C., and Keuss, P.J.G. Global precedence as a postperceptualeffect: An analysis of speed-accuracy tradeoff functions. Percep-tion & Psychophysics, 1983, 31, (4) 358-366.
Breitmeyer, B.G., and Ganz, L. Implications of sustained and transientchannels for theories of visual pattern masking, saccadic sup-presion, and information processing. Psychological Review, 1976,83, 1-36.
Broadbent, D. E. The hidden preattentive process. AmericanPsychologist, 1977, 32, (2), 109-118.
Calis, G. and Leeuwenberg, E. Grounding the figure. Journal of Experi-mental Psychology: Human Perception and Performance, 1981, 7,1386-1397.
Carroll, J. D., and Wish, M.E. Multidimensional perceptual models andmeasurement methods. In Handbook of Perception, Vol II. Psycho-physical judgment and measurement. San Francisco: AcademicPress, 1974, 391-447.
Convey, J. A Primer on Simultaneous Inference Procedures for MultipleContrasts in the Analysis of Variance. Washington, DC: CatholicUniversity of America, 1980.
Eriksen, C. W. Location of objects In a visual display as a function ofthe number of dimensions on which the objects differ. Journal ofExperimental Psychology, 1952, 44 (2), 56-60.
Eriksen, C. W. Object location in a complex perceptual field. Journalof Experimental Psychology, 1953, 45, 126-32.
83

Eriksen, C. W. Partitioning and saturation of visual displays and effi-ciency of visual search. Journal of Applied Psychology, 1955, 39(2), 73-77.
Eriksen, C. W., and Eriksen, B. A. Target redundancy in visual search:Do repetitions of the target within the display impair proces-sing? Perception & Psychophysics, 1979, 26 (3) 195-205.
Eriksen, C. W., and Schultz, D. W. Information processing in visualsearch: A continuous flow conception and experimental results.Perception & Psychophysics, 1979, 25, 249-263.
Estes, W. K. Interactions of signal and background variables in visualprocessing. Perception & Psychophysics, 1972, 12, 278-286.
Estes, W. K. Redundancy of noise elements and signals in visual detec-tion of letters. Perception & Psychophysics, 1974, 16, 53-60.
Garner, W. R. Assymetric interactions of stimulus dimensions in percep-tual information processing. In Proceedings of the conference onPerception and Cognition, T. Tighe (Ed.), Hillsdale, N Y:Erlbaum, 1983.
Getty, D. J., Swets, J. A., Swets, J. B., and Green, D. M. On the pre-diction of confusion matrices from similarity judgments. Perep-tion & Psychophysics, 1979, 26 (1) 1-19.
Gibson, E. J. Principles of perceptual learning and development. NewYork: Appleton, 1969.
Grice, G. R., Canham, L., and Boroughs, J. M. Forest before trees? Itdepends on where you look. Perception and Psychophysics, 1983,
33 (2) 121-128.
Haber, R. N., and Hershenson, M. The Psychology of Visual Perception.New York: Holt, Rinehart, and Winston, 1980.
Hoffman, J. E. Interaction between global and local levels of a form.Journal of Experimental Psychology: Human Perception and Perform-ance, 1980, 6, 222-234.
Hughes, H. C., Layton, W. M., Baird, J. C., and Lester, L. S. Globalprecedence in visual pattern recognition. Perception &Psychophysics, 1984, 35 (4) 361-371.
James, W. The principles of psychology. New York: Holt, Rinehart, andWinston, 1890.
Johnson, S. C. Hierarchical clustering schemes. Psychometrika, 1967,32, (3) 241-254.
84
Johnston, S. C., Peck, P., and Landee, B. M. Tactical SymbologyCatalog. Research Product 83-6, prepared for U S Army ResearchInstitute, by Pereeptronics, Inc., under contract DAHC 19-78-C-0018, May, 1983. (AD A132 625)
Julesz, B. Perceptual limits of texture discrimination and their impli-cations to figure-ground separation. In Formal theories of per-ception. E. Leeuwenberg, (Ed.), New York: Wiley, 1978.
Kinchla, R. A., Solis-Macias, V., and Hoffman, J. Attending to differ-ent levels of structure in a visual image. Perception & Psycho-physics, 1983, 33 (1), 1-11.
Kinchla, R. A., and Wolf, J. The order of visual processing: "top-down", "bottom-up", or "middle-out". Perception & Psychophysics,1979, 25-(3) 225-231.
King, M. C., Gruenewald, P. J., and Lockhead, G. R. Classifying relatedstimuli. Journal of Experimental Psychology: Human Learning andMemory, 1978, 4, 417-427.
Koffka, K. Principles of Gestalt Psychology, New York: Harcourt, Brace,1935.
Kruskal, J.B. Multidimensional scaling by optimizing goodness of fit toa nonmetric hypothesis. Psychometrika, 1964, 29, 1-27.
Kruskal, J. B., and Wish, M. E. Multidimensional Scaling. BeverlyHills, California, 1978.
Larsen, A., and Bundesen, C. Size scaling in visual pattern recogni-tion. Journal of Experimental Psychology: Human Perception andPerformance, 1978, 4, 1-20.
Mach, E. The analysis of sensations. (Rev. 5th Edition, C.M. Williams,trans). New York: Dover Publications, 1959 (originally published,1895).
Martin, M. Local and global processing: The role of sparsity. Memoryand Cognition, 1979, 7, 476-484.
McClelland, J. L., and Miller, J. Structural factors in figure percep-tion. Perception & Psychophysics, 1979, 26 (3), 221-229.
McLean, J. P. Perspectives on the forest and trees: The precedence ofparts and wholes in visual information processing. 1978 Doctoraldissertation, University of Oregon: Dissertation Abstracts Inter-national, 1979, 39, 6162B-6163B.
Miller, J. Global precedence in attention and decision. Journal ofExperimental Psychology: Human Perception and Performance. 1981,7, 1161-1174, (a).
005

Miller, J. Global precedence: Information availability or use? Replyto Navon. Journal of Experimental Psychology: Human Perceptionand Performance, 1981, 7, 1183-1185, (b).
Navon, D. Forest before trees: The precedence of global features invisual perception. Cognitive Psychology, 1977, 9, 353-383.
Navon, D. The forest revisited: More on global precedence. Psychologi-cal Research, 1981, 43, 1-32, (a).
Navon, D. Do attention and decision follow perception? Comment onMiller. Journal of Experimental Psychology: Human Perception andPerformance, 1981, 7, 1175-1182, (b).
Navon, D. How many trees does It take to make a forest? Perception,1981, 43, 192-210, (c).
Navon, D., and Norman, J. Does global precedence really depend on vis-ual angle? Journal of Experimental Psychology: Human Perceptionand Performance, 1983, 9, (6) 955-965.
Neisser, U. Cognitive Psychology. New York: Appleton-Century-Crofts,1967.
Pedhazur, E. J. Multiple Regression in Behavioral Research. New York:Holt, Rinehart and Winston, 1980, 296-304.
Peterson, M.A., and Hochberg, J. Opposed set measurement procedure: Aquantitative analysis of the role of local cues and intention inform perception. Journal of Experimental Psychology: HumanPerception and Performance, 1983, 9 (2), 183-193.
Pomerantz, J., Sager. L., and Stoever, R. Perception of wholes andtheir component parts: Some configural superiority effects.Journal of Experimental Psychology: Human Perception and Perform-ance, 1977, 3, 422-435.
Robertson, L. C., and Palmer, S. E. Holistic processes in the percep-tion and transformation of disoriented figures. Journal of Ex-perimental Psychology: Human Perception and Performance, 1983, 9(2) 202-214.
Rumelhart, D. E. A multicomponent theory of the perception of brieflyexposed visual displays. Journal of Mathematical Psychology,1970, 7, 191-218.
Selfridge, 0. Pandemonium: A paradigm for learning. In SyMposium on themechanization of thought processes. London: Her Majesty'sStationery Office, 1959.
Shepard, R.N, Psychological representation of speech sounds. In HumanCommunication: A Unified View, edited by David and P. Denes, NewYork: McGraw-Hill, 1972.
86
m n m i l I I I II I Il i i -

Takane, Y., Young, F., and deLeeuw, J. Nonmetric individual differencescaling: An alternating least squares method with optimal scalingfeatures. Psychometrika, 1977, 42(1), 7-67.
Triesman, A. M., and Gelade, G. A. A feature-integration theory of at-tention. Cognitive Psychology, 1980, 12, 97-136.
Ward, L. M. Determinants of attention to local and global features ofvisual forms. Journal of Experimental Psychology: Human Percep-tion and Performance, 1982, 8, 562-581.
Winer, B. Statistical Principles in Experimental Design, New York:McGraw-Hill, 1971, 149-305.
Wish, M.E., and 'Carroll, J. D. Concepts and applications of multidimen-sional scaling. Sensory Evaluation of Appearance of Materials,ASTM STP 545, American Society for Testing and Materials, 1973,91-108.
Wong, E., and We1sstein, N. Sharp targets are detected better against afigure, and blurred targets are detected better against a back-ground. Journal of Experimental Psychology: Human Perception andPerformance, 1983, 9 (2), 194-202.
Young, F. W. Nonmetric multidimensional scaling: Recovery of metric in-formation. Psychometrika, 1970, 35, 455-473.
Young, F., and Lewyckyj, R. ALSCAL-4 User's Guide. Carboro, NC:Data Analysis and Theory Associates, 1979.
87
i. .. I " i | | I | | ij

APPENDIX
Instructions to Subjects for Phase II Symbol Detection Study
The Army Research Institute has recently been investigating the
design and use of tactical military symbols. With the demands of bat-
tlefield planning and management to accomodate large amounts of data in
a dynamic environment, effective symbols are required so that commanders
and staff are able to "see the battlefield".
The task you are going to perform today is part of a research
program aimed at providing effective designs for new symbols and methods
for deciding among various symbols already in use. Your task today is
to find a "target" on the screen, and push a button showing where you
have found it.
First, you will see the target symbol by itself on the screen.
Next, a "slide" will appear showing a map, and either one or two symbols
placed on the map. Your job is to push one of the four buttons on your
keyboard to show where you saw the target symbol:
TOP LEFT TOP RIGHT
BOTTOM LEFT BOTTOM RIGHT
Push one of the buttons as soon as you see where the target is.
The slide will not be shown very long. Here is an example. (Press F1
to start example).
[ Several practice trials shown, with option to repeat as
needed.]
89