the potential of landscape metrics from remote sensing data as indicators in forest environments...
TRANSCRIPT
The potential of landscape metrics from Remote Sensing data as indicators in
forest environments
Niels Chr. Nielsen, M.Sc.
Intro
Lancaster University thesis under way:Development and test of spatial metrics derived from EO data for indicators of sustainable management of forest and woodlands at the landscape level
JRC Project:Development and evaluation of remote sensing based spatial indicators for the assessment of forest biodiversity and sustainability, using landscape metrics derived from high- to medium resolution sensors
NordLaM Nordic Workshop: Deriving Indicators from Earth Observation Data - Limitations and Potential for Landscape
Monitoring, 22nd - 23rd October, Drøbak, Norway

Structure of presentation:
Definitions of indicators for different purposes
Landscape ecology – spatial metrics
Land Cover and forest maps, data needs and potential outputs
Processing chain, combining with GIS
Limitations to monitoring, examples from study of fragmentation
Conclusions, perspectives for monitoring

Helsinki (93) – Lisbon (98): Ministerial Conference on Protection of Forests in Europe
Convention on Biological Diversity
IUFRO working group on Sustainable Forest Management (SFM)
European Landscape Convention (Firenze 2000)
“Natura 2000” network (linked to the EU habitats directive)
Activities somehow related:Timber Certification
BEAR project on forest biodiversity + indicators of same
GAP analysis
Kyoto protocol (forests as carbon pool)These processes could use indicators as tool for monitoring and reporting of state and progress!
Convention framework for development of indicators:
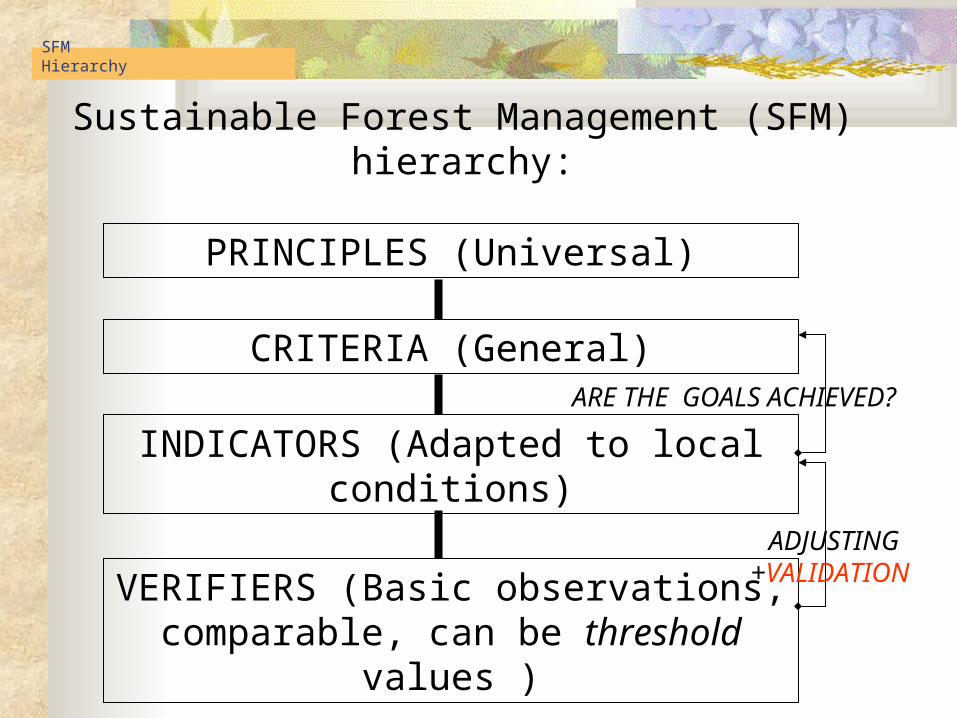
Sustainable Forest Management (SFM) hierarchy:
PRINCIPLES (Universal)
CRITERIA (General)
INDICATORS (Adapted to local conditions)
VERIFIERS (Basic observations, comparable, can be threshold
values )
ADJUSTING+VALIDATION
ARE THE GOALS ACHIEVED?
SFM Hierarchy

1.MAINTENANCE AND APPROPRIATE ENHANCEMENT OF FOREST RESOURCES AND THEIR CONTRIBUTION TO GLOBAL CARBON CYCLES: Area, Age structure
2.MAINTENANCE OF FOREST ECOSYSTEM HEALTH AND VITALITY : Burned area, Storm damage
3.MAINTENANCE AND ENCOURAGEMENT OF PRODUCTIVE FUNCTIONS OF FORESTS (WOOD AND NON-WOOD): Balance Growth - Removals
4.MAINTENANCE, CONSERVATION AND APPROPRIATE ENHANCEMENT OF BIOLOGICAL DIVERSITY IN FOREST ECOSYSTEMS (Natural forest types)
5.MAINTENANCE AND APPROPRIATE ENHANCEMENT OF PROTECTIVE FUNCTIONS IN FOREST MANAGEMENT (NOTABLY SOIL AND WATER)
6.MAINTENANCE OF OTHER SOCIO-ECONOMIC FUNCTIONS AND CONDITIONS
Helsinki process (MCPFE) criteria:

NATIONAL SCALE
Structural factors Indicators
Total area of forests Total area (ha)Area in relation to total land area (%)
Afforestation (yearly rate)
Deforestation (yearly rate)
Natural regeneration (by 10 years)
Area of ‘ancient’ woodland Percentage of total area
Compositional factors
Fire/lightning Number, size and area (% of forest) and age of forest affected
Storms Average annual area of damage
Silvicultural regimes Clearcuts (number and area)Age class frequency in relation to felling area
Agriculture/grazing/browsing Area transformation from agriculture to forestry and vice versa
areas where application of RS data is possible:
BEAR biodiversity indicators
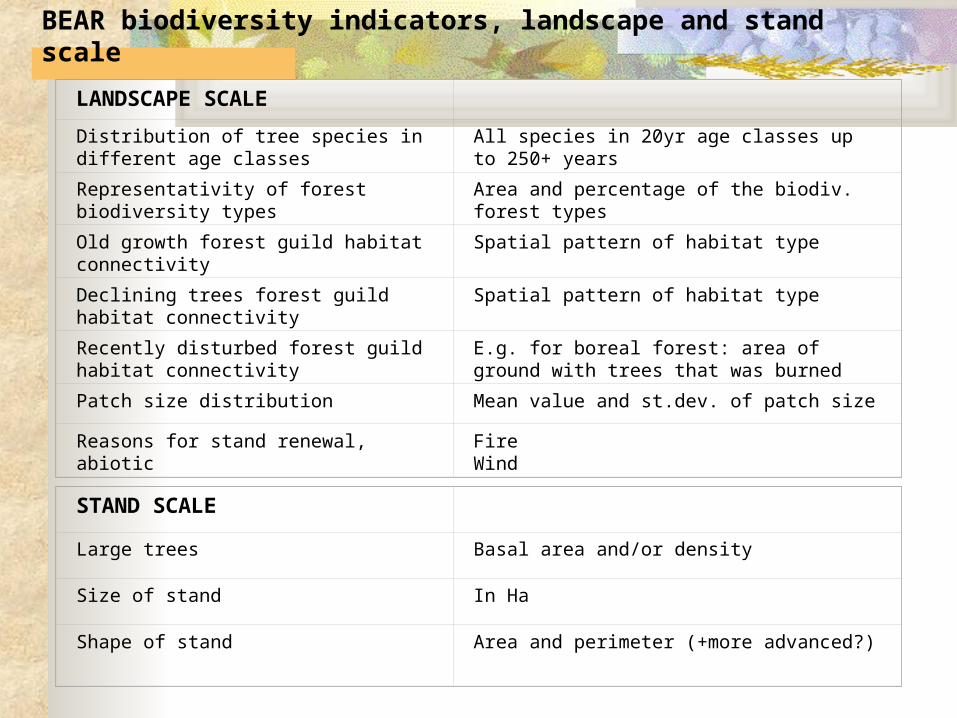
LANDSCAPE SCALE
Distribution of tree species in different age classes
All species in 20yr age classes up to 250+ years
Representativity of forest biodiversity types Area and percentage of the biodiv. forest types
Old growth forest guild habitat connectivity Spatial pattern of habitat type
Declining trees forest guild habitat connectivity
Spatial pattern of habitat type
Recently disturbed forest guild habitat connectivity
E.g. for boreal forest: area of ground with trees that was burned
Patch size distribution Mean value and st.dev. of patch size
Reasons for stand renewal, abiotic FireWind
STAND SCALE
Large trees Basal area and/or density
Size of stand In Ha
Shape of stand Area and perimeter (+more advanced?)
BEAR biodiversity indicators, landscape and stand scale

- Flows of matter, energy, information (across landscapes, soil-vegetation-air)
- Importance of spatial structure and terrain
- Disturbance – regeneration (shifting mosaic in natural systems)
- Holistic approach – analysis at “landscape level” – the landscape as a system, hierarchical, multifunctional approach
- Core areas – ecotones
LE concepts
-Island biogeography: species/area-curves
-- Later: Metapopulation ecology
-‘Ancillary’ assumptions:
-Richness of biotope types = richness of habitats
-Interspersion promotes co-habitation of species and movement of indivduals
Core concepts from Landscape Ecology :
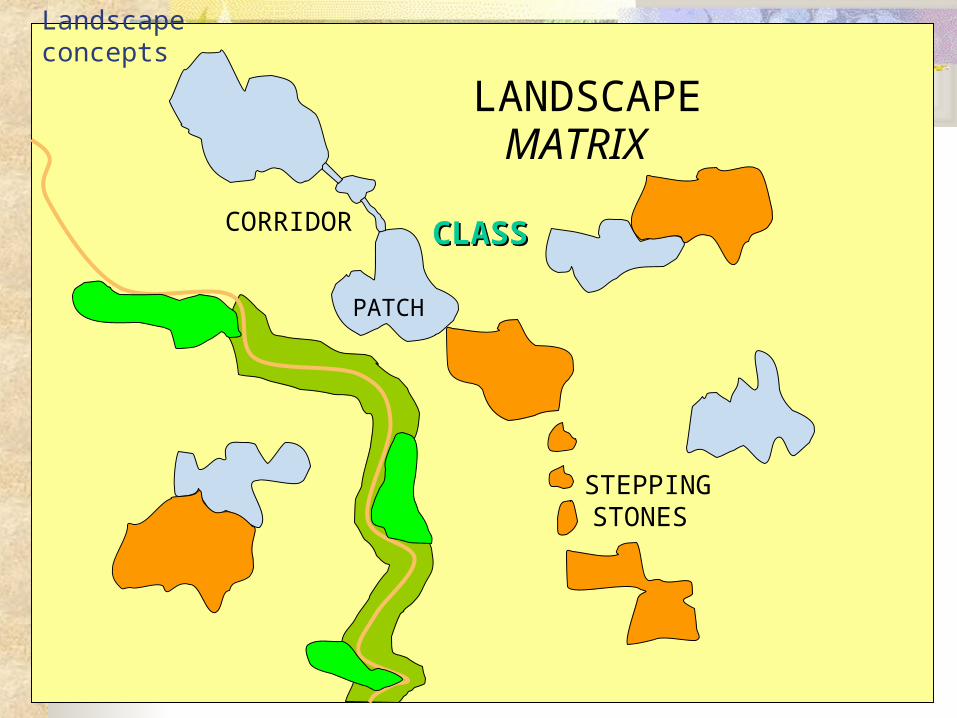
PATCH
CLASSCLASS
LANDSCAPEMATRIX
CORRIDOR
STEPPINGSTONES
Landscape concepts

Example 1 : Patterns of forest in the landscape
Shape e.g. edge/area measures
Number of patches, distance measures
Natural Managed
Connected Fragmented
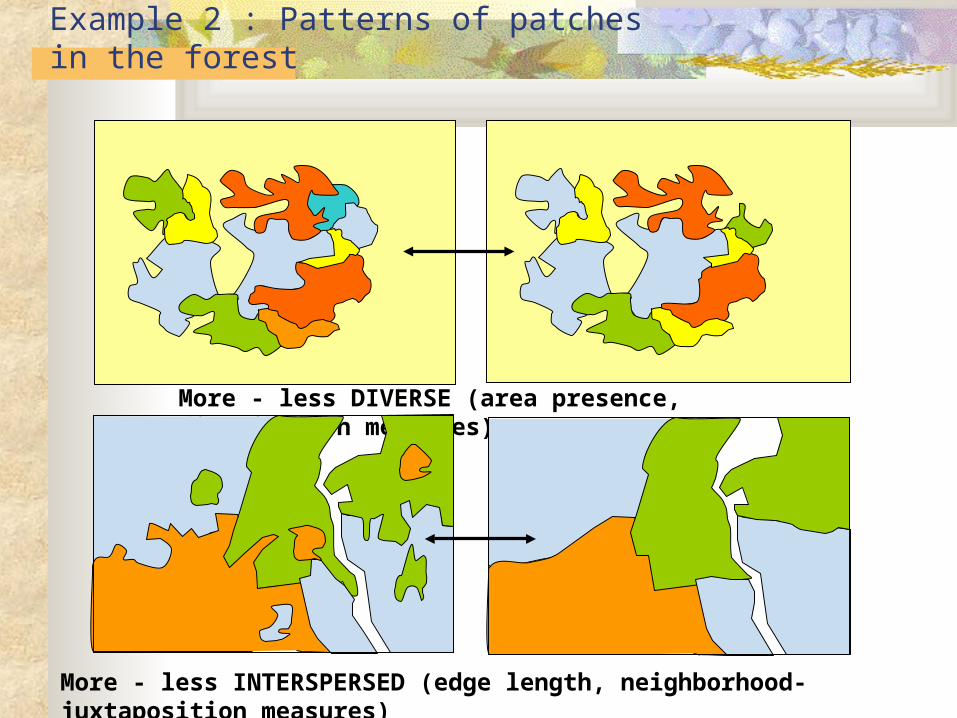
More - less DIVERSE (area presence, distribution measures)
More - less INTERSPERSED (edge length, neighborhood-juxtaposition measures)
Example 2 : Patterns of patches in the forest
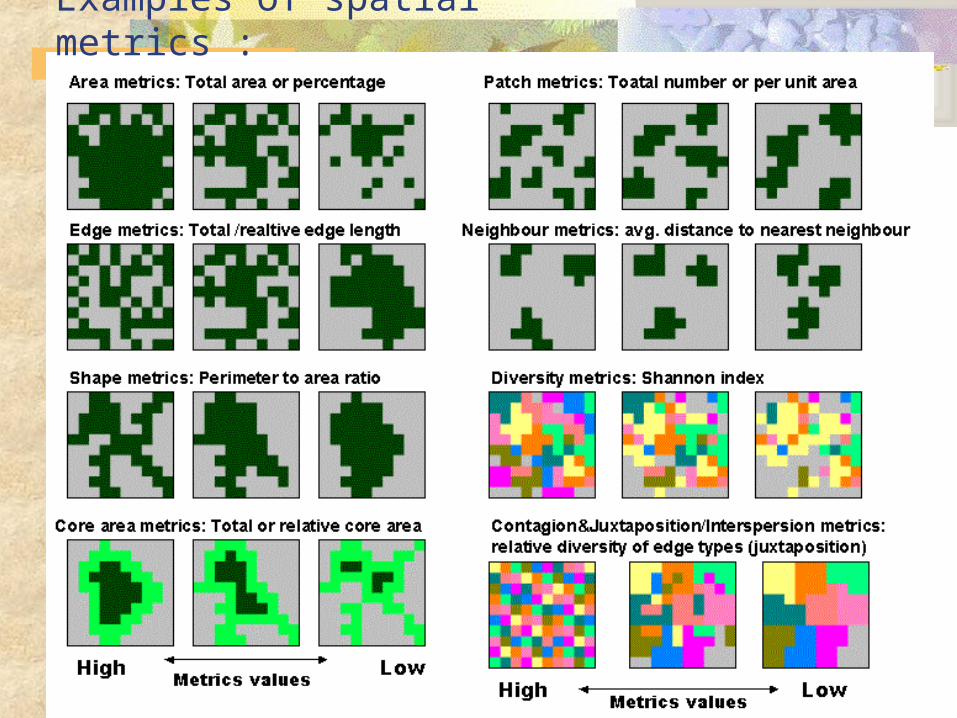
Examples of spatial metrics :

Spatial information type
Describing.. Output units
Area Land cover classes or patches m2 , ha, km2, %
Count Objects, patches (richness of) Number
Shape Structure: from patches to landscapes
Any (m-1, FD normally unit-less)
Position, distance Relative placement of patches m, km
Topology Context – connectivity, relative edge type proportions (weighted edge indices)
Unit-less number
less
more
AD
VA
NC
ED
”Information Hierarchy” of Spatial Metrics
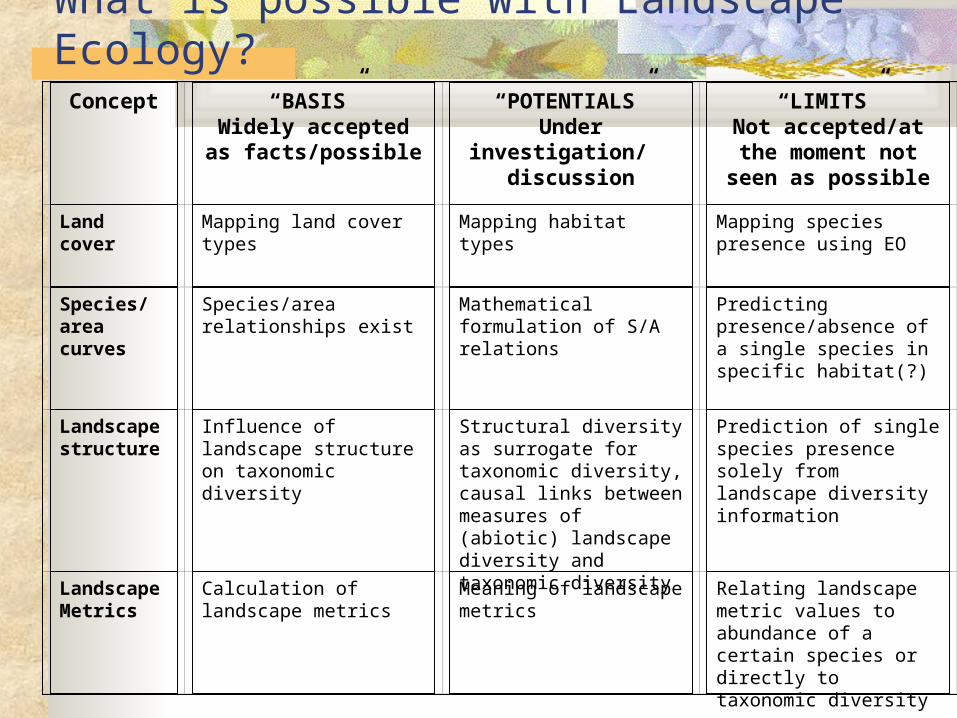
Concept “BASIS”Widely accepted as
facts/possible
“POTENTIALS”Under investigation/
discussion
“LIMITS”Not accepted/at the moment not seen as
possible
Land cover Mapping land cover types Mapping habitat types Mapping species presence using EO
Species/ area curves
Species/area relationships exist
Mathematical formulation of S/A relations
Predicting presence/absence of a single species in specific habitat(?)
Landscape structure
Influence of landscape structure on taxonomic diversity
Structural diversity as surrogate for taxonomic diversity, causal links between measures of (abiotic) landscape diversity and taxonomic diversity
Prediction of single species presence solely from landscape diversity information
Landscape Metrics
Calculation of landscape metrics
Meaning of landscape metrics
Relating landscape metric values to abundance of a certain species or directly to taxonomic diversity
What is possible with Landscape Ecology?

What is possible with Landscape Ecology2?
Concept “BASIS”Widely accepted as
facts/possible
“POTENTIALS”Under investigation/
discussion
“LIMITS”Not accepted/at the moment not seen as
possible
Scale Influence of measurement scale on mapping accuracy, metrics values etc.Also on spatial perception by individual animals
Mathematical (spatial statistics) processes influencing spatial metrics, ecological scaling mechanisms governing results from measurement of (local) extinctions dispersal of animal and plants (sampling issues)
‘Grand unifying theory’ of scaling behaviour, reliable prediction of metrics values between imagery at very different scales (?)
Patch-Corridor-Matrix (PCM) model
PCM model can be applied in agricultural landscapes
Applicability of PCM model inside forests
Delineation of functional ‘habitat patches’ in forests (only/purely) from EO data
Corridors Definitions and mapping of corridors in open/high contrast lands
Roles of corridors in landscapes (for specific species), managing for biodiversity by creating corridors
Measuring influence of corridors on taxonomic diversity in landscapes
Who needs forest information ?
* International organisations, NGO’s and environmental organisations
* National ministries
* Research and academic institutes
* Forest Industry
* Forest owners
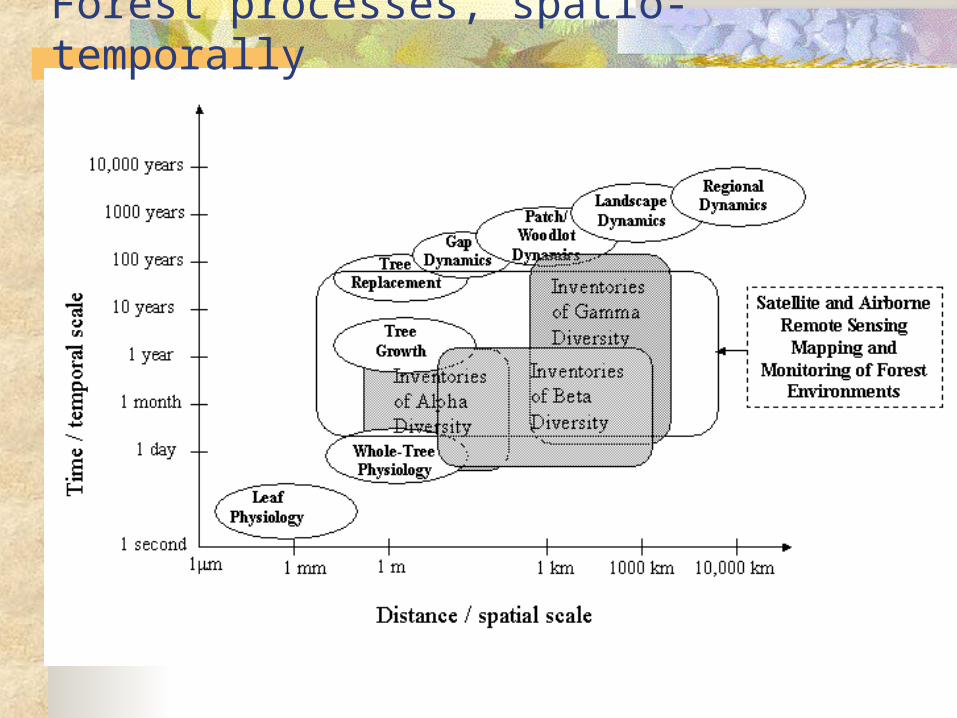
Forest processes, spatio-temporally

Function, type and level of information
Variable / data type
Forest protection
Stand Forest area (actual/potential ratio)Species CompositionStructure (horizontal, vertical)
Site SoilVegetation typesTopography (elevation, aspect, slope)Climate
Stability Forest condition, Quality, health
Management Value of protected infrastructureWater resourcesObjectives
Forest management information needs 1

Forest management information needs 2
Ecosystem / environment
Variable / data type
Carbon Cycle Woody and herb biomassSoil organic matterClimate
Biodiversity – Ecosystem
Vegetation typeVegetation coverPattern of vegetationNaturalness; management history, age, exotic species Management objectivesForest condition (rate of change)
Biodiversity - Species Species composition (including rare species)Species richness (indicator species)Pattern (corridors / networks)Threats to sp. diversity; human disturbance, pollutant deposition, exotic species
Sustainability Management objectives / history / planning and Land use change

Similarities RS – Landscape Ecology approaches:
* Different processes at different levels;
different scales of observation are relevant
* Integrated (holistic) view
* Pattern does matter(!) – studies of vegetation patterns
* Search for Self-similarity, as reflected in truly fractal patterns
* Minimum mapping unit: Grain = Pixel
* Analysis of scaling effects
* Dealing with spatial heterogeneity..
Similarities RS - LE

What can RS do for forest ecology?

Process steps:
Derived information:
Atmospheric correction, geometric correction, illumination correction
Segmentation / vectorisation / on-screen-digitisation, Land Cover classification
Applying criteriacriteria, using knowledge
Extent of rapid / disastrous processes, such as active fires, clear-cutting, oil spills etc.
Change detection, (based on spectral characteristics)
Area statistics, Spatial metrics, (input to) GIS analysis
Habitat suitability, change sensitivity
Adding value, refinement and compression of informationinformation
Data types: “raw
images”
“orthophotos” etc., rectified, geo-referenced imagery
Land cover maps
Image acquisition
Landscape type maps, habitat type maps, “diversity maps”
From RS to landscape monitoring and valuation

Aerial photo with shape file outlineDominant vegetation type assigned to each polygon
Vectorise/digitise
How to get to land cover maps 1

Landsat TM bands 3,4,5
Forest/non-forest mask
classify raster images
How to get to land cover maps 2

The test case:
One land cover type, the rest “background”
Fragmentation the issue - edge, shape, patch number
[3] 4
1 SqPP
A*
[2] )*(
PPUn
m
1 pixels) ofnumber (total*pixels)forest of(number
pixels ecover typother andforest between runs ofnumber 10* M
Selected spatial metrics for measuring fragmentation

”Moving Windows” Approach
Map 1: Window (user choice): Map 2:
Grain = pixel size = 30m Size (extent) = 9 pixels = 270 m Grain = pixel size = 90 m
Extent = 30*30 pix = 900*900 m Step = 3 pixels = 90 m Extent = 8*8 pixels = 720*720 m
As implemented with calculation of Fragstats-derived and other spatial metrics for “sub-landscapes”
INPUT: “cover type” map(1) OUTPUT: metrics/index value map(2)
DeterminesApplied to
equals
1 2 3 4 5
Calculate
(e.g.)
Patch type
Richness
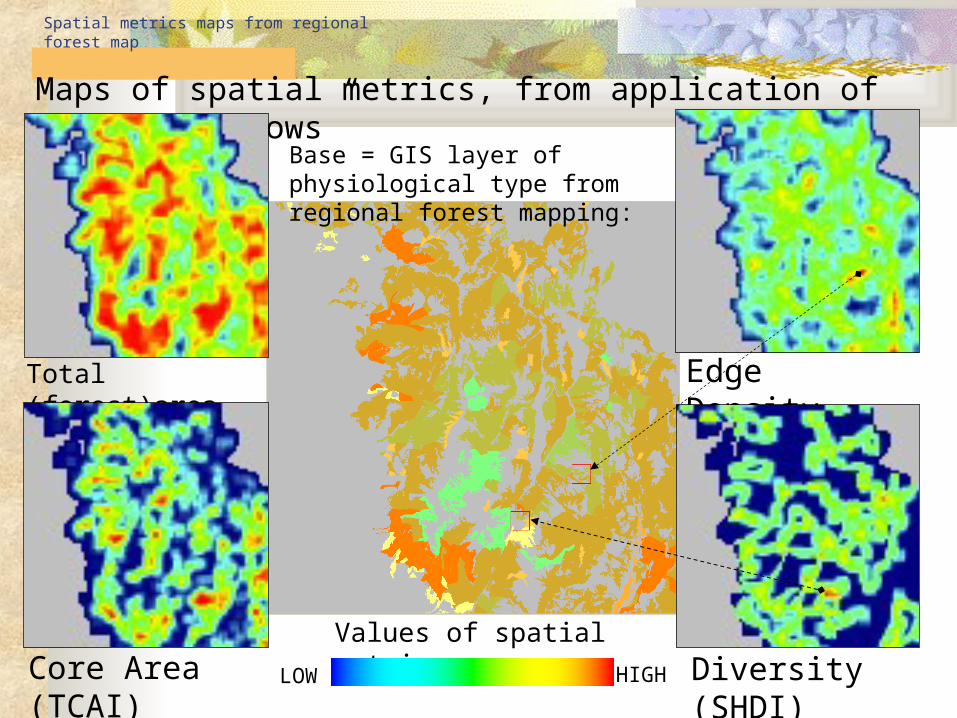
Maps of spatial metrics, from application of “moving windows”
Total (forest)area
Core Area (TCAI) Diversity (SHDI)
Edge Density
Base = GIS layer of physiological type from regional forest mapping:
Values of spatial metrics:
LOW HIGH
Spatial metrics maps from regional forest map
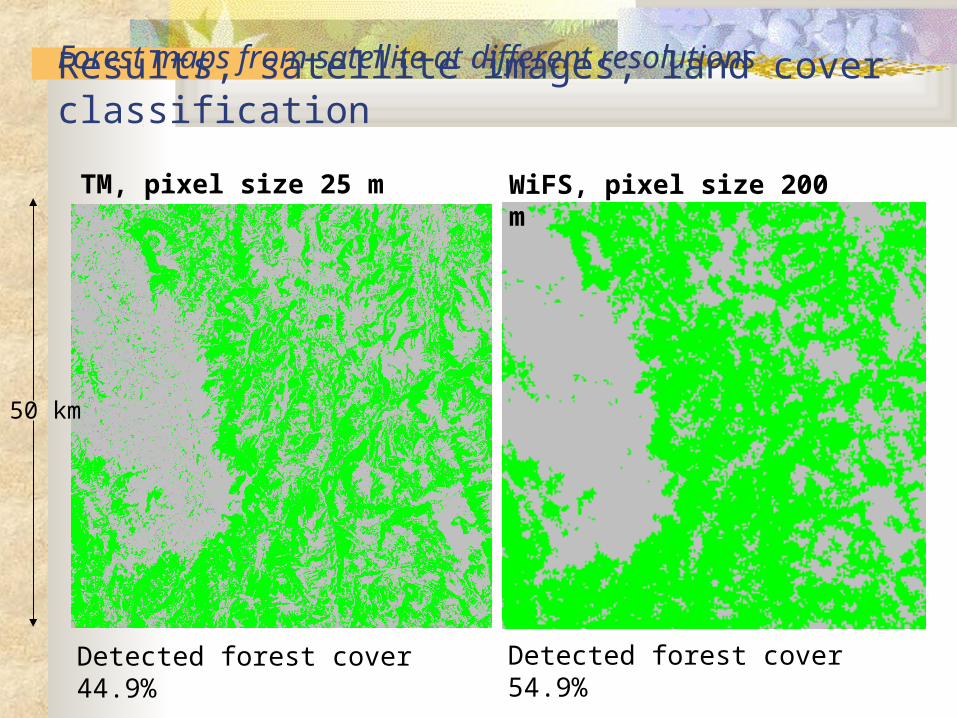
WiFS, pixel size 200 m TM, pixel size 25 m
50 km
Detected forest cover 54.9%Detected forest cover 44.9%
Results, satellite images, land cover classification
Forest maps from satellite at different resolutions

Displaying landscape metrics

CORINE land cover
WiFS based
FMERS project
Large area maps...
CORINE land cover reclassified to FMERS nomenclature (6 forest classes)
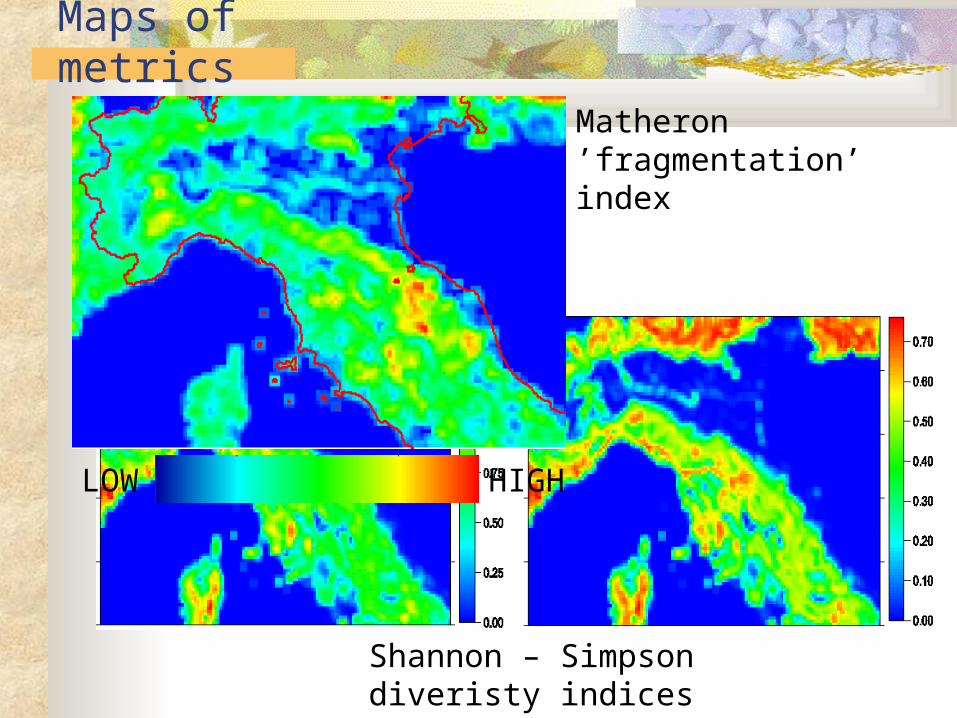
LOW HIGH
Shannon – Simpson diveristy indices
Matheron ’fragmentation’ index
Maps of metrics

Summarization over gridcells
Observation per species
Landscape metrics calculated for
relevant cells, where species are observed
RED=low no. of species BRIGHT GREEN= high no. of species
Umbria, faunal observations

Combination with RS based mapsPresence/non-presence in grid net
CORINE (100m pixels) FMERS - WiFS (200m pixels)

Umbria, mid-Italy, N and E of Assisi, the selected two 2nd order catchments are part of the Tevero (Tiber) catchment (5th order).
Watershed-polygon-statistics example:

Watershed mapping 1
Statistics from 2nd order watersheds
Region 2nd1042.shp 10458 pixels includedBands D:\Geodata\fmers_forestmap\FMERS_Central_other.imgAREA/km2 418,32 %
non-classified 0 16 0,15Coniferous 1 1195 11,43Broadleaved Decid. 2 1040 9,94Broadl. evergreen 3 9 0,09Mixed 4 899 8,60OWL Coniferous 5 695 6,65OWL Broadleaved 6 1646 15,74Other Land 7 4958 47,41Water 8 0 0,00Cloud/Snow 9 0 0,00
Region 2nd1014.shp 16821 pixels includedBands D:\Geodata\fmers_forestmap\FMERS_Central_other.imgAREA/km2 672,84 %
non-classified 0 128 0,76Coniferous 1 766 4,55Broadleaved Decid. 2 2342 13,92Broadl. evergreen 3 34 0,20Mixed 4 1226 7,29OWL Coniferous 5 157 0,93OWL Broadleaved 6 688 4,09Other Land 7 11.480 68,25Water 8 0 0,00Cloud/Snow 9 0 0,00
..calculated indices can be written ’back’ as parameter of WS polygon

Watershed mapping 2
Region 1st5224.shp 1006 pixels includedBands D:\Geodata\fmers_forestmap\FMERS_Central_other.imgAREA/km2 40,24 %
non-classified 0 0 0,00Coniferous 1 19 1,89Broadleaved Decid. 2 3 0,30Broadl. evergreen 3 0 0,00Mixed 4 112 11,13OWL Coniferous 5 0 0,00OWL Broadleaved 6 73 7,26Other Land 7 799 79,42Water 8 0 0,00Cloud/Snow 9 0 0,00
Region 1st5217.shp 3166 pixels includedBands D:\Geodata\fmers_forestmap\FMERS_Central_other.imgAREA/km2 126,64 %
non-classified 0 1 0,03Coniferous 1 523 16,52Broadleaved Decid. 2 338 10,68Broadl. evergreen 3 0 0,00Mixed 4 524 16,55OWL Coniferous 5 224 7,08OWL Broadleaved 6 750 23,69Other Land 7 806 25,46Water 8 0 0,00Cloud/Snow 9 0 0,00
Region 1st5230.shp 869 pixels includedBands D:\Geodata\fmers_forestmap\FMERS_Central_other.imgAREA/km2 34,76 %
non-classified 0 1 0,12Coniferous 1 27 3,11Broadleaved Decid. 2 0 0,00Broadl. evergreen 3 0 0,00Mixed 4 9 1,04OWL Coniferous 5 16 1,84OWL Broadleaved 6 21 2,42Other Land 7 795 91,48Water 8 0 0,00Cloud/Snow 9 0 0,00
http://www.europa.eu.int/comm/agriculture/publi/landscape/ch4.htm

* Apply the spatial metrics land cover maps derived using more sophisticated methods, e.g. edge preserving smoothing, segmentation and/or neural networks.
* Multiple regression of metrics such as the ones studied here or other parameters describing ecological conditions.
* Verify how indices derived from classifications of aerial photos of the area (preferably ~1 m resolution), relate to satellite data.
* Comparison with CORINE land cover data, taking into account that:
- Coverages are not regularly updated (not to be used for monitoring)- The dataset is originally vector based, some information is lost when converted to raster format, not intended to be used as a pixel based land-cover mask.
Further work..

- (-Infinitely) Many spatial metrics can be calculated from EO-data, but connections with ecological conditions must be established and their use verified.
Conclusions
- The role of Remote Sensing and other Earth Observation techniques concerning forest management is to complement other information sources and inventories done by specialised researchers on the ground.- GIS is an adequate tool for combining information
stored in data-bases, map information and EO-data.
- Remote sensing provides synoptic images at different scales, potentially making it a powerful tool for applications in multi-scale landscape analysis.
- Moving Windows approaches can provide information on landscape sturcture and forest diversity over large areas – illustrating distributions and highlighting ’hot-spots’.

Land Use Planning Decision making
Administration
Spatial Metrics
Thematic Maps
Digital Imagery
Indicators
InventoriesLand/Forest Management
Earth Observation
Monitoring
Trad. Forestry / Ecological - Environmental
Sketch of Terra satellite ©NASA, 2000
Do spatial metrics fit in somewhere?
RS – spatial metrics

* Development of methods for detection of areas threatened or in need of special management techniques/consideration.
& research needs
* Satellites with higher spatial resolution + satellites with multi-spectral sensors – extended spatial and spectral domains.
* Still a need for better understanding of how to relate spatial/textural measures/information from high resolution to medium scale spectral and/or spatial information.
* Watersheds as natural regions for calcultaion and reporting of spatial/structural landscape properties...
Future options