the potential for green hydrogen in the gcc region
TRANSCRIPT

1
THE POTENTIAL FOR GREEN HYDROGEN IN THE GCC REGION Dii & Roland Berger May 2021

2
Content
A. GLOBAL H2 ECONOMY TO DEVELOP SIGNIFICANTLY IN THE COMING DECADES .................................... 5
H2, A KEY LEVER TO DRIVE THE WORLD'S DECARBONIZATION .......................................................... 5
H2 GLOBAL DEMAND EXPECTED TO REACH ~580 M MT BY 2050 ....................................................... 10
B. HIGH LOCALIZATION POTENTIAL FOR GCC COUNTRIES ........................................................................... 12
I. POTENTIAL H2 REVENUES FOR GCC COUNTRIES TO REACH USD 70-200 BN BY 2050 .................. 12
II. GCC COUNTRIES' GREY H2 CAPACITY AND RECENT INVESTMENTS IN GREEN H2 ......................... 18
HIGH POTENTIAL FOR LOCALIZING ELECTROLYZERS........................................................................ 20
POTENTIAL OF ~1 M JOBS FROM THE GREEN H2 VALUE CHAIN LOCALIZATION BY 2050 .............. 23
C. H2 STRATEGIES, INFRASTRUCTURE & HUMAN CAPABILITIES AS KEY ENABLERS ............................... 26
I. COMPREHENSIVE H2 STRATEGIES AS A KEY ENABLER ..................................................................... 26
II. ECOSYSTEM DEVELOPMENT VIA H2 VALLEYS, INTERNATIONAL PARTNERSHIPS AND R&D
PROGRAMS ............................................................................................................................................... 28
III. REQUIREMENT FOR ENHANCED EDUCATIONAL PROGRAMS AND TRAININGS .................................. 32
D. CONCLUSION FOR GCC COUNTRIES ............................................................................................................. 33
E. ABOUT ................................................................................................................................................................ 34
F. ACKNOWLEDGMENTS...................................................................................................................................... 35
G. ILLUSTRATIONS ................................................................................................................................................ 37
H. REFERENCES .................................................................................................................................................... 38
3
Disclaimer
This report has been published by Roland Berger Middle East W.L.L. (Roland Berger) and Dii Desert Energy for general guidance
only. Roland Berger and Dii Desert Energy confirm that information contained herein, including projections, has been obtained
from sources believed to be reliable. While we do not doubt their accuracy, we have not verified them and make no guarantee,
warranty or representation about them. It is your responsibility to confirm independently their accuracy and completeness. Roland
Berger and Dii Desert Energy shall not be liable for any damages resulting from any use of the information contained in the
publication.
All rights to the material are reserved and cannot be reproduced without prior written permission from Roland Berger and Dii Desert
Energy.

4
Executive Summary
The pivotal role of emission-free energy carriers is becoming visible in all corners of the globe. Swiftly dropping costs of green
power are leading to increased competitiveness and growing market shares for green power. As green power becomes cheaper,
so does green hydrogen produced from green power. As a result, energy carriers based on green hydrogen become more and
more attractive on the path to the decarbonized economy. In spite of great doubts only until a few years ago, today hydrogen is
believed to have the potential to become the ‘new oil’ or the ‘new natural gas’. The GCC countries have the advantage of having
plenty of space, sunshine and, in some areas, wind energy amidst being prosperous, expanding economies open for innovations.
Thus, it is not surprising that the GCC region has quickly become one of the highest-ranked regions in terms of lowest-cost and
largest-scale renewable energy projects. Not only the steep learning curves and the relatively low costs of capital, but also the
culture of protecting the natural environment as a heritage for next generations is making GCC a natural leader in the energy
transition. Hence GCC, like any other energy marketplace, is subject to an accelerating transition towards becoming carbon
emission free itself and a significant exporter of emission-free energy Estimates indicate that the global market for green hydrogen
may eventually reach 500 m MT by 2050, whereas hydrogen production annual revenues in GCC could grow up to USD 70-200
bn.
The energy transition in GCC will have a major impact on the industries in the region. Particularly, it will impact labor needs, not
only in terms of quantity, but also skill requirements of emerging jobs. The emerging ‘green energy’ economy will offer a spectrum
of localization opportunities across the value chain. This will include renewables (mainly solar and wind), electrolysis systems
producing hydrogen, potentially upgrading to synthetic fuels, transport, storage and innovative demand-side processes. As the
localization opportunities of the hydrogen economy in GCC is still a rather unexplored subject, this joint report of Roland Berger
with the international industry network, Dii Desert Energy, is zooming in on the localization and the resulting job creation potential
of hydrogen economy in the region. In the short term, job creation seems to be most obvious in the area of renewable generation
and electrolysis technologies. In the long term, labor needs will undoubtedly arise along the entire green energy value chain.
Estimates point at up to 1 million direct and indirect jobs by 2050.
Public and private stakeholders in GCC may benefit from the following recommendations for hydrogen-related job creation:
1. Create a vision, give a clear direction and create conditions for success
2. Combine learning and fast growth with economies of scale through ‘Hydrogen Valleys’, ecosystems focused on successful
hydrogen business and trade, attracting investors
3. Connect to the international movements for hydrogen business expansion, particularly becoming part of technology
partnerships
4. Make sure the local communities will have the ‘license to operate’ and be the master of the market by education, training and
knowledge
5
A. GLOBAL H2 ECONOMY TO DEVELOP SIGNIFICANTLY IN THE
COMING DECADES
H2, A KEY LEVER TO DRIVE THE WORLD'S DECARBONIZATION
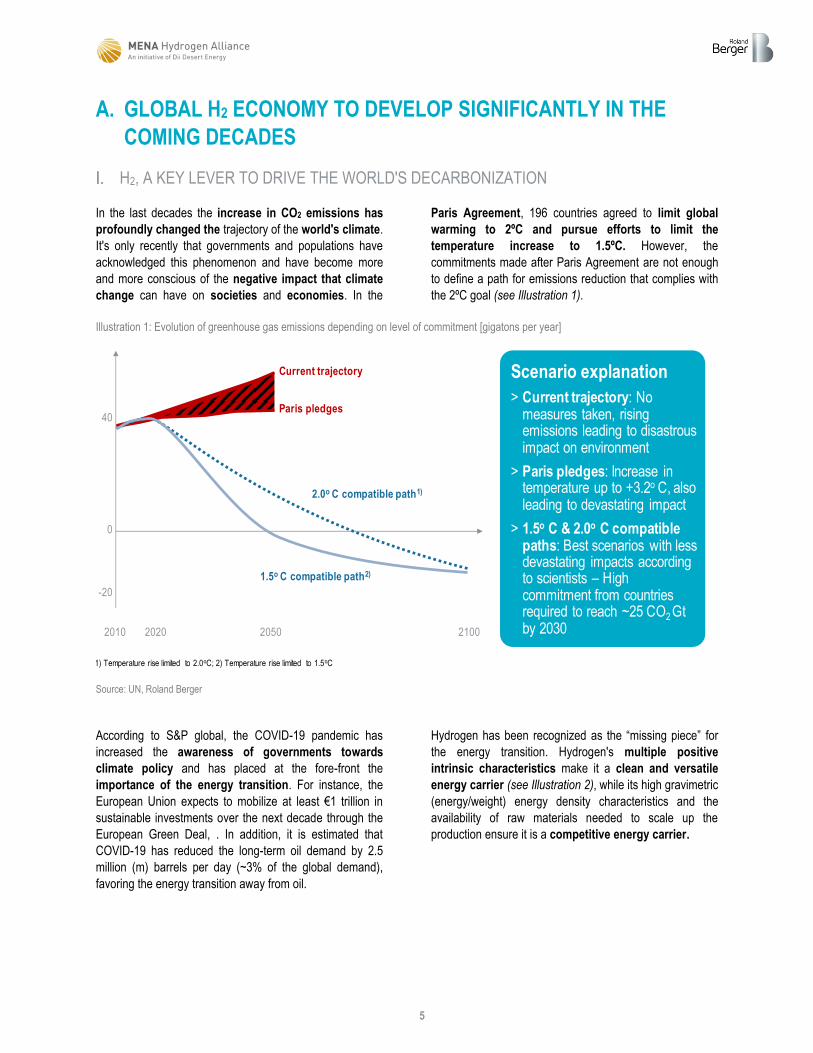
In the last decades the increase in CO2 emissions has
profoundly changed the trajectory of the world's climate.
It's only recently that governments and populations have
acknowledged this phenomenon and have become more
and more conscious of the negative impact that climate
change can have on societies and economies. In the
Paris Agreement, 196 countries agreed to limit global
warming to 2ºC and pursue efforts to limit the
temperature increase to 1.5ºC. However, the
commitments made after Paris Agreement are not enough
to define a path for emissions reduction that complies with
the 2ºC goal (see Illustration 1).
Illustration 1: Evolution of greenhouse gas emissions depending on level of commitment [gigatons per year]
Source: UN, Roland Berger
According to S&P global, the COVID-19 pandemic has
increased the awareness of governments towards
climate policy and has placed at the fore-front the
importance of the energy transition. For instance, the
European Union expects to mobilize at least €1 trillion in
sustainable investments over the next decade through the
European Green Deal, . In addition, it is estimated that
COVID-19 has reduced the long-term oil demand by 2.5
million (m) barrels per day (~3% of the global demand),
favoring the energy transition away from oil.
Hydrogen has been recognized as the “missing piece” for
the energy transition. Hydrogen's multiple positive
intrinsic characteristics make it a clean and versatile
energy carrier (see Illustration 2), while its high gravimetric
(energy/weight) energy density characteristics and the
availability of raw materials needed to scale up the
production ensure it is a competitive energy carrier.
40
0
-20
2010 2020 2050 2100
1.5o C compatible path2)
2.0o C compatible path1)
Current trajectory
Paris pledges
Scenario explanation
> Current trajectory: No measures taken, rising emissions leading to disastrous impact on environment
> Paris pledges: Increase in temperature up to +3.2o C, also leading to devastating impact
> 1.5o C & 2.0o C compatible paths: Best scenarios with less devastating impacts according to scientists – High commitment from countries required to reach ~25 CO2 Gt by 2030
1) Temperature rise limited to 2.0oC; 2) Temperature rise limited to 1.5oC

6
Illustration 2: Benefits of clean hydrogen (blue and green)
Source: Hydrogen Europe
Within economies and societies, hydrogen has several applications that guarantee low CO2 emission and enable the energy
transition (see Illustration 3).
Illustration 3: Mapping of hydrogen end-uses
Source: International Energy Agency (IEA), press review, expert interviews, Roland Berger
Industry MobilityCentralized energy
Buildings & microgrids
Otherchemicals
Heat
Oilrefining
Iron & steel
Ammonia
Methanol
1
2
3
4
5
6
Road
Rail
Maritime
Air
1
2
3
4
H2 to elec-tricity grid
H2 togas grid
1
2
Power
Heat
1
2
7
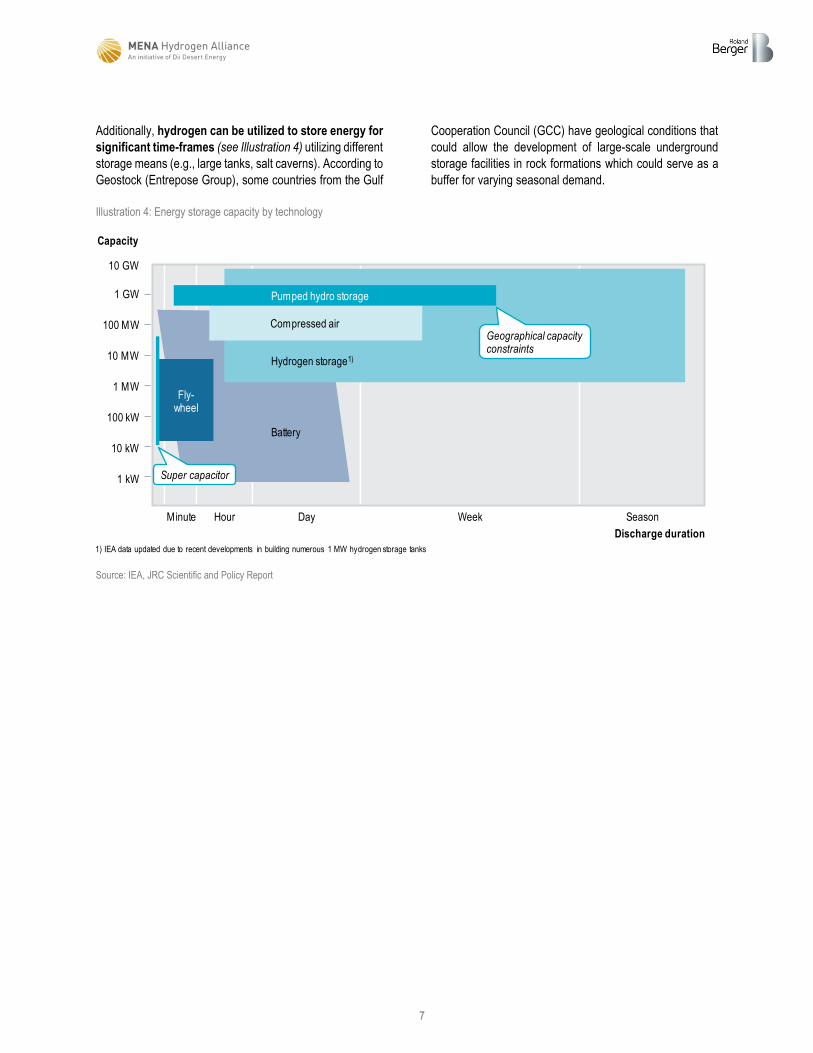
Additionally, hydrogen can be utilized to store energy for
significant time-frames (see Illustration 4) utilizing different
storage means (e.g., large tanks, salt caverns). According to
Geostock (Entrepose Group), some countries from the Gulf
Cooperation Council (GCC) have geological conditions that
could allow the development of large-scale underground
storage facilities in rock formations which could serve as a
buffer for varying seasonal demand.
Illustration 4: Energy storage capacity by technology
Source: IEA, JRC Scientific and Policy Report
1) IEA data updated due to recent developments in building numerous 1 MW hydrogen storage tanks
Minute Hour Day Week Season
Discharge duration
Capacity
10 GW
1 GW
100 MW
10 MW
1 MW
100 kW
10 kW
1 kW
Pumped hydro storage
Compressed air
Hydrogen storage1)
Battery
Fly-wheel
Super capacitor
Geographical capacity constraints

8
Recent national and regional (e.g. Europe) hydrogen
strategies focus primarily on developing green hydrogen,
which highlights the economic and climate-friendly potential
of the molecule.
Although other types of hydrogen (e.g., blue or turquoise,
see Illustration 5) may play an intermediate role, green
hydrogen will grow supported by the expected drop in its
price and its limited CO2 emissions.
Illustration 5: Hydrogen production1) pathways and types [2019]
Source: IEA, Press review, Roland Berger
9
The cost of green hydrogen is expected to become
competitive with blue hydrogen by 2025 and with grey
hydrogen by 2030 in GCC countries according to various
sources (e.g., (Hydrogen Council, 2020), (IHS Markit,
2020)). The cost of renewables is expected to remain the
key driver (~60% of the cost per kg of green hydrogen) and
the significant drop expected in the cost per kW of
eletrolyzers, due to R&D, economies of scale and
standardization, will also represent an important lever to
reach USD 1.5-2.0 per kg by 2030 or before.
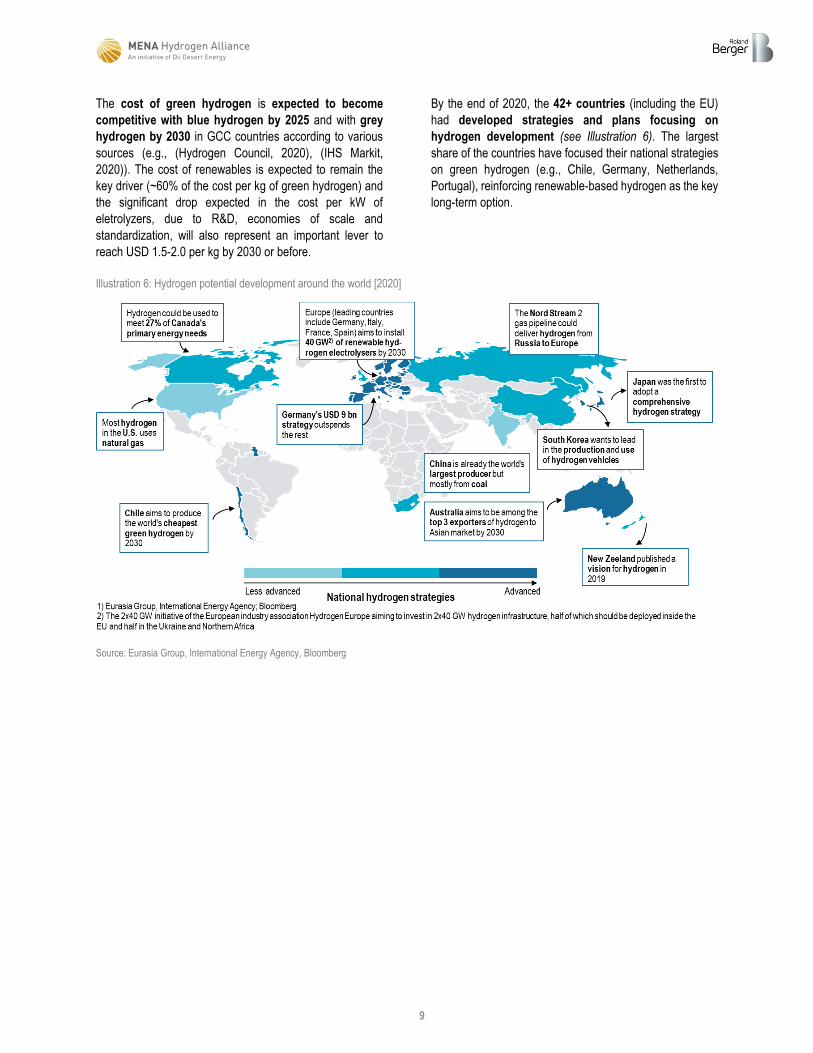
By the end of 2020, the 42+ countries (including the EU)
had developed strategies and plans focusing on
hydrogen development (see Illustration 6). The largest
share of the countries have focused their national strategies
on green hydrogen (e.g., Chile, Germany, Netherlands,
Portugal), reinforcing renewable-based hydrogen as the key
long-term option.
Illustration 6: Hydrogen potential development around the world [2020]
Source: Eurasia Group, International Energy Agency, Bloomberg

10
H2 GLOBAL DEMAND EXPECTED TO REACH ~580 M MT BY 2050
In the recent years, hydrogen has gained traction world-wide
with chemical and refining industries in particular driving
an increase in demand. According to the (IEA, 2019), the
international hydrogen demand grew approximately four fold
since 1975 and reached ~75-85 m MT in 2018 (see
Illustration 7) with grey hydrogen, the most cost competitive
hydrogen over the afore-mentioned period (1.5-2.5 USD/kg),
utilized in key industries:
▪ Chemical industry, using ammonia as a feedstock to produce fertilizers (~65% of 2018 total demand).
▪ Refining industry, using hydrogen to lower the sulfur content of diesel fuels (~25% of the 2018 total demand).
▪ Other sectors, such as mobility or electricity production, have not so far significantly utilized hydrogen, primarily due to low cost competitiveness, lack of infrastructure (e.g., hydrogen refueling stations) and underdeveloped technologies.
Illustration 7: Historical hydrogen demand by application [m MT, 1975 – 2020]
Source: IEA, Roland Berger

11
In the upcoming decades, hydrogen stakeholders (e.g.,
producers, international hydrogen-related initiatives) are
expecting a significant growth in the hydrogen sector
driven by three main factors:
▪ Reduction in the Levelized Cost of Hydrogen (LCOH): The cost of producing hydrogen is expected to drop between 30% (IEA, 2019) to 50% (Hydrogen Council, 2020) by 2030 in GCC countries. This is expected to be driven by the continued decrease in cost of renewable electricity (e.g., through economies of scale and improved manufacturing technologies) and by lower capital expenditure investments required in the hydrogen value chain due to scaling up of manufacturing activities (e.g., lower cost of electrolyzers and other equipment along the value chain). Furthermore, there are several projects (e.g., AquaVentus and NortH2 in Europe) and collaboration platforms worldwide (Catapult or HyDeal in Europe) targeting a drastic cost reduction in hydrogen (100% green hydrogen for €1.5/kg by 2030).
▪ Awareness from companies and market pressure: Increasing global awareness for the impact of CO2 emissions on climate change is expected to add further pressure on companies. Several energy companies have announced a net-zero strategy by
2050 (e.g., Iberdrola, Eni, Enel, BP). In addition, several trends in the investment field, such as sustainable finance, are likely to influence a shift of investments towards companies with lower impact on the environment.
▪ Increase in regulations and incentives favoring clean hydrogen adoption: Given the concerns and awareness around the climate change challenge, policymakers and governments are expected to increasingly introduce policies and regulations fostering reduction of CO2 and utilization of green technologies such as hydrogen. For instance, the European CO2 market is expected to have a significant impact on the economy, fostering green products and activities. In Japan, the 2017 target of 80% emissions reduction by 2050 is currently under revision and could be expanded to zero emissions by 2050 (Reuters, 2020).
Given this context, demand is expected to increase
significantly, reaching up to ~580 m MT by 2050 (see
Illustration 8) – hydrogen demand, throughout this paper,
includes the demand for hydrogen and derivative products –
driven by a rise in new applications such as building and
industrial heat & power, as well as transportation.
Hydrogen used as an industrial feedstock is expected to
increase to ~150 m MT a year.
Illustration 8: Global hydrogen demand forecast [m MT, 2019-2050]
Source: Hydrogen Council
12
B. HIGH LOCALIZATION POTENTIAL FOR GCC COUNTRIES
I. POTENTIAL H2 REVENUES FOR GCC COUNTRIES TO REACH USD 70-200 BN BY 2050
GCC countries have a number of competitive
advantages that can enable them to play a significant role
on a global and regional scale:
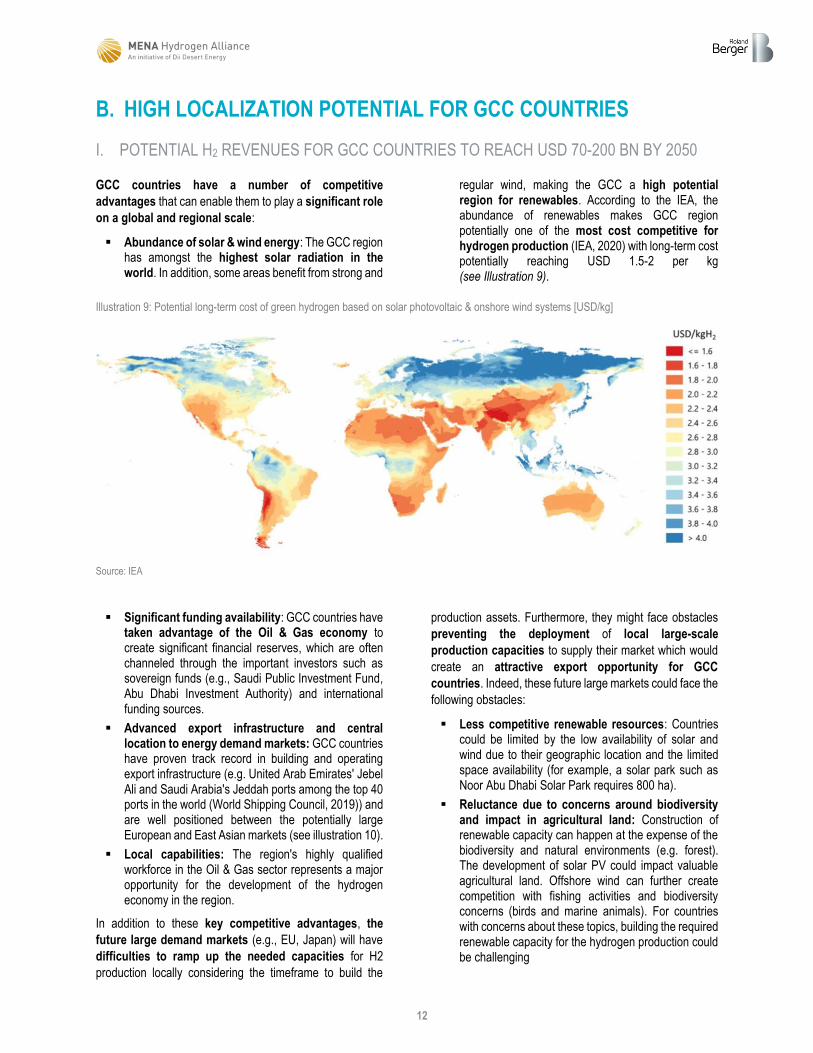
▪ Abundance of solar & wind energy: The GCC region has amongst the highest solar radiation in the world. In addition, some areas benefit from strong and
regular wind, making the GCC a high potential region for renewables. According to the IEA, the abundance of renewables makes GCC region potentially one of the most cost competitive for hydrogen production (IEA, 2020) with long-term cost potentially reaching USD 1.5-2 per kg (see Illustration 9).
Illustration 9: Potential long-term cost of green hydrogen based on solar photovoltaic & onshore wind systems [USD/kg]
Source: IEA
▪ Significant funding availability: GCC countries have taken advantage of the Oil & Gas economy to create significant financial reserves, which are often channeled through the important investors such as sovereign funds (e.g., Saudi Public Investment Fund, Abu Dhabi Investment Authority) and international funding sources.
▪ Advanced export infrastructure and central location to energy demand markets: GCC countries have proven track record in building and operating export infrastructure (e.g. United Arab Emirates' Jebel Ali and Saudi Arabia's Jeddah ports among the top 40 ports in the world (World Shipping Council, 2019)) and are well positioned between the potentially large European and East Asian markets (see illustration 10).
▪ Local capabilities: The region's highly qualified workforce in the Oil & Gas sector represents a major opportunity for the development of the hydrogen economy in the region.
In addition to these key competitive advantages, the
future large demand markets (e.g., EU, Japan) will have
difficulties to ramp up the needed capacities for H2
production locally considering the timeframe to build the
production assets. Furthermore, they might face obstacles
preventing the deployment of local large-scale
production capacities to supply their market which would
create an attractive export opportunity for GCC
countries. Indeed, these future large markets could face the
following obstacles:
▪ Less competitive renewable resources: Countries could be limited by the low availability of solar and wind due to their geographic location and the limited space availability (for example, a solar park such as Noor Abu Dhabi Solar Park requires 800 ha).
▪ Reluctance due to concerns around biodiversity and impact in agricultural land: Construction of renewable capacity can happen at the expense of the biodiversity and natural environments (e.g. forest). The development of solar PV could impact valuable agricultural land. Offshore wind can further create competition with fishing activities and biodiversity concerns (birds and marine animals). For countries with concerns about these topics, building the required renewable capacity for the hydrogen production could be challenging

13
▪ Public acceptance of power generation and transport assets: Communities in the large demand markets (e.g., EU, Japan) can oppose the development of power generation and transport assets (e.g., grid, pipelines) next to their local areas
The resulting opportunity for GCC countries could be
significant. For instance, EU hydrogen imports could reach
100 m MT in 2050 with Germany and Belgium each
importing ~25 m MT, while East Asia, especially Japan,
could import ~85 m MT of ammonia (see
Illustration 10). The cost competitive hydrogen from GCC
countries could be in a prime position to capture this
opportunity and be a key enabler in global decarbonization.
Illustration 10: Potential 2050 hydrogen imports of selected regions and countries [2050]
Source: Vision Port of Rotterdam, Germany's National Hydrogen Strategy, EU Hydrogen Strategy, METI, Hydrogen Korea Team, Roland Berger
In addition to potential export markets, GCC countries can cater for their own regional demand. The GCC demand in 2019
amounted to ~5.5 m MT, mainly driven by industrial applications. The regional demand could reach 25-50 m MT by 2050 driven
by existing industries in the region (e.g., methanol and ammonia production) and local activities (e.g., transportation, energy) (see
Illustration 11). It is assumed that green hydrogen will be the most competitive hydrogen source by 2050 supported by policies and
regulations and thus 100% of local demand is assumed to be supplied through green hydrogen.

14
Illustration 11: GCC current and future hydrogen demand by application [m MT]
Source: IEA, Roland Berger
GCC countries are in a prime position to achieve this
ambition by leveraging distinct competitive advantages
which will enable to develop the local hydrogen industry and
also access a significant share of the global market. Given
their competitive advantages, the future hydrogen market
share of these countries will depend on how much hydrogen
they can phyisically supply.
Conservative and aggressive scenarios are defined based
on the level of renewable deployment that could be achieved
in GCC countries:
▪ Conservative scenario: Supposing that GCC
countries continue the renewable deployment in line
with the 2030 targets (~100-140 GW per decade),
they would be able to dedicate those 300-420 GW for
the hydrogen production accordingly (see Illustration
12). This renewable deployment would power ~150-
210 GW of electrolysis capacity to produce 50-70 m
MT of hydrogen per year by 2050.
▪ Aggressive scenario: GCC countries could deploy a
higher amount of capacity to address a larger share of
the market (see Illustration 12). Chile, for example,
plans to deploy 300 GW for hydrogen production by
2050 (Government of Chile, 2020). As GCC is ~3
times larger than Chile in terms of surface, we
estimate that GCC could deploy a renewable capacity
of 700-1,000 GW. This renewable capacity would
power ~350-500 GW of electrolysis capacity, that
could produce 80-100 m MT of hydrogen per year by
2050.
25 m MT
50 m MT
Demand1) per country [2019] Total current and future GCC demand
1) Demand for other chemicals not included; 2) Announced projects included
Qatar
0.99
UAE
0.46
Oman2)
1.09
2.39
Saudi
Arabia
Bahrain
0.25
2.0
1.70.6
5.5
1.2
20502019
Others Direct reduced iron (DRI) Methanol production Oil refiningAmmonia production
CAGR 2019-2030
CAGR 2030-2050
6% 4%
10% 6%
Potential range:

15
Illustration 12: Potential hydrogen opportunity for GCC countries [2050]
Source: Roland Berger
Installing the afore-mentioned renewable and electrolysis
capacities would allow the GCC countries to capture a large
share of the international markets leading to potential
generation of USD 70-200 bn annual revenue from
hydrogen by 2050:
▪ Conservative scenario: In addition to supplying the
local hydrogen demand, GCC countries would supply
~20 m MT for the Europe and East Asia markets by
2050 (equivalent to 10% market share in Europe and
East Asia markets) resulting in potential generation of
USD 70-140 bn annual revenue from hydrogen by
2050 (see Illustration 13).
▪ Aggressive scenario: In addition to supplying the
local hydrogen demand, GCC countries would supply
~50 m MT for the Europe and East Asia markets by
2050 (equivalent to 30% market share in Europe and
East Asia markets) resulting in potential generation of
USD 120-200 bn annual revenue from hydrogen by
2050 (see Illustration 13).

16
Illustration 13: Potential hydrogen revenues of GCC countries [2050]
Source: Roland Berger
Installing the renewable & electrolysis capacities mentioned would require an annual investment of USD 16-60 bn over a period of 25 years (see Illustration 14), mainly driven by the cost of installing the renewable capacity (30-40% of the total).

17
Illustration 14: Estimation of investments required from GCC countries by 2050 [USD bn]
Source: Roland Berger
The key competitive factors to address the Europe and
East Asia export markets will be the hydrogen price and
the carbon emissions related to hydrogen production,
due to the anticipated regulations in these geographies (e.g.,
European CO2 regulation). To be competitive on both
factors, GCC countries must produce green hydrogen and
make significant investments in the near future to reach cost
competitiveness before potential competitors (e.g.,
Morocco, Spain, Australia), thereby harvesting the early-
mover benefits.
The journey to a large-scale green hydrogen production
facility running at full capacity has not been achieved yet
world-wide, and obstacles and delays may arise; moving
early – with the support of relevant policies and regulations
– will allow GCC countries to be at the forefront of the
hydrogen race.

18
II. GCC COUNTRIES' GREY H2 CAPACITY AND RECENT INVESTMENTS IN GREEN H2
GCC countries currently have a hydrogen production
capacity of 5-6 m MT/year mainly utilizing Steam Methane
Reforming (SMR) (grey hydrogen) which primarily
addresses refineries and ammonia demand requirements.
More recently, GCC countries have made progress on the
green hydrogen front with several promising projects and
initiatives being announced in 2020 and early 2021.
In Saudi Arabia, a large-scale 2 GW green hydrogen
production facility for Ammonia is being planned in
NEOM, located on the west coast of the country (see
Illustration 15). This project is being developed through a
partnership composed of ACWA Power, Air Products and
NEOM, with thyssenkrupp as the hydrogen technology
partner and is one of the largest green hydrogen projects in
the world. Given the availability of competitive and low-cost
renewable energy, NEOM will produce green hydrogen at
scale and convert it to green ammonia for export. Air
Products is going to be the distributor of the green product.
NEOM’s prime location enables world record low
renewable energy prices, and among the highest
combined capacity factors by solar and wind energy beyond
70%, aiming to produce hydrogen between USD 1.5-1.95
per kg depending on the set-up.
Neom has developed a comprehensive localization
approach and strategy which could have the potential to
make it a first hydrogen valley in the MENA region. As a core
element of the above-mentioned green hydrogen project,
the electrolyzers are envisioned to be assembled by
thyssenkrupp locally with a focus on the cells. Considering
the size of the project with approx. 2GW of electrolyzer
capacity, the local manufacturing could serve as an
incubator for Neom and other green hydrogen projects
nationally and potentially internationally for electrolyzers and
the broader value chain.
Furthermore, in December 2020, the Hyport® Duqm Green
Hydrogen Project was announced in Oman. The project
plans for a 250-500 MW electrolyzer powered by solar and
wind (Deme Group, 2020). In addition, Sohar Port aspires to
become the Middle East’s first green hydrogen generation
hub powered by gigawatts of solar.
In the United Arab Emirates (UAE), an industrial-scale green
hydrogen pilot project of DEWA and Siemens is in
commissioning phase (DEWA, 2020). In addition, the
Ministry of Energy and Infrastructure launched the’ UAE
Hydrogen Technical Committee in 2020, which brings
together the key stakeholders who will be able to shape the
future of hydrogen in the UAE. Furthermore, the Abu Dhabi
National Oil Company (ADNOC), ADQ and Mubadala have
launched the Abu Dhabi Hydrogen Alliance aiming at
developing UAE's international leadership in hydrogen and
a substantial green hydrogen local economy (Mubadala,
2021). Mubadala also signed a Memorandum of
Understanding with Siemens Energy and other energy
players to accelerate green hydrogen capabilities in UAE.
This project is unique since the goal is to produce e-fuel
(great potential in the region) with airlines as off-takers, as
well as to promote hydrogen based ecosystems. These
developments signal significant green hydrogen
developments in the future, which will enable GCC
countries to advance rapidly.
Moreover, under the umbrella of Dii Desert Energy, the
MENA Hydrogen Alliance is bringing together private
and public sector actors and academia to kick-start a
(green) hydrogen economy based on low-cost value
chains for green molecules in the region and beyond.

19
Illustration 15: Overview of NEOM project in Saudi Arabia
Source: Air Products, IEA, Roland Berger
Project partnersEach party holds 1/3rd
4 GW renewables
energy generation
1) Air Products invests an additional USD c.2 bn in the distribution to end customers resulting in a total investment of Air Products of USD 3.7 bn
An additional 100% ownership of distribution to end customers1)
Project scope
Energy generation (4 GW)
Green hydrogen production (c.2 GW)
Ammonia conversion(c. 1.4 mton NH3 p.a.)
Reconversion Offtake
Nitrogen
Neom
Long-term LCoH potential for solar & onshore wind hybrid setups [EUR/kg H2] according to IEA
USD 5 bn CAPEX1)
c.240,000 t hydrogen p.a. by 2025
Location
City still in development (USD c.500 bn development)
Large KSA player with 34 GW of power and 5.9 m m3/day water desalination capacity in portfolio
<1.5 ~2.0 >3.5~2.5 ~3.0

20
HIGH POTENTIAL FOR LOCALIZING ELECTROLYZERS
The production of green hydrogen usually follows a four-
step process involving different stakeholders and
technologies. The four steps include (see Illustration 16):
▪ Renewable generation: Production of green electricity from renewable sources (e.g., solar, wind).
▪ Electrolysis: Conversion of the electricity into hydrogen via electrolyzers.
▪ Transportation, storage & distribution: Storage of hydrogen in tanks or combined with another molecule. Transportation and distribution to the consumption location.
▪ Final use: Consumption of hydrogen as a feedstock by off-takers in their industrial process or in other applications (e.g., fuel cell vehicle, centralized electricity system).
Illustration 16: Hydrogen value chain overview
Source: Roland Berger
GCC countries have an attractive localization opportunity
along the hydrogen value chain (see Illustration 17).
Among the value chain elements, electrolysis has the
largest potential in the short-term. The key opportunity
lies in the manufacturing activities, due to:
▪ Technological maturity: The electrolysis technology (Alkaline and PEM) is mature and doesn't have any major technological barrier.
▪ Limited industry development: Capacities for large-scale electrolyzers are just being ramped up and, given the overall market growth, this creates an opportunity for GCC countries.
▪ Attractive share of value: This step of the value chain represents a 20-40% share of the total cost.
Additionally, engineering & design activities could be
localized in the medium and long-term if the demand is
significant and the required capabilities are developed. R&D
activities should be promoted to gain technological
leadership along the hydrogen value chain. These activities
would require significant efforts to build human capabilities
(e.g., dedicated programs, international partnerships) and
the localization of these activities would take a lengthier
timeline than other activities in the sector.
Opportunities further exist in other parts of the value chain:
▪ Renewable electricity: Engineering & design activities can be localized in the long-term if significant renewable capacities are installed regionally. Other activities (e.g., manufacturing, R&D) require targetted strategies due to high competition (e.g., Chinese PV industry).
▪ Transportation & storage: Despite the small share of the value chain total cost (10-20%), opportunities can arise from the specific requirements for hydrogen transportation (e.g., reinforced pipelines and tanks to resist hydrogen corrosiveness) and dedicated manufacturing capabilities could be localized. Opportunities created will depend on the types of transport vectors used (e.g., ammonia, LOHC).
Across the whole value chain, all installation and
operation & maintenance activities will need to be
localized, contingent on the right human capabilities being
in place and could also represent an opportunity for GCC
countries.
Renewable generation
ElectrolysisTransport, distribution & storage
Final use

21
Illustration 17: Localization potential across the hydrogen value chain (final use not considered)
Source: Expert interviews, Roland Berger
Within electrolyzer systems, balance of plant and power
electronics components are the subsystems with the
highest potential for localization (see Illustration 18).
Indeed, both subsytems combine a significant share of the
total electrolyzer cost (25-40% and 25-30% respectively),
some of the capabilities required are already in place in the
GCC countries (e.g., metal fabrication and electronics
manufacturing production capabilities) and the limited
complexity of the subsystems enables a reasonable ease for
fast localization. Despite a higher share of total cost (30-
55%), the electrolysis stack part has a lower overall potential
in the short & medium-term, mainly due to the complexity of
the technology and the international partnerships and
significant investments required to develop the technology.
Illustration 18: Localization potential of electrolyzer sub-systems
Source: RVO, EKZ, Kumar and Himabindu 2019, NREL, expert interviews, Roland Berger

22
In addition to electrolyzers, demand for green hydrogen in
GCC countries will also support the localization of the
renewable energy value chain. For PV and wind projects,
non-complex components can potentially be engineered in
GCC countries using the existing capabilities while more
complex components are expected to be engineered outside
the region at the location of the component manufacturer.
Manufacturing of non-complex PV components (e.g.,
mounting structures, cabling) is expected to be localized in
the short-term leveraging the current GCC capabilities.
Manufacturing of more complex PV components (e.g.,
wafer and polysilicon) face high global competition
leading to reduced competitive advantage to localize for
GCC countries.
Wind turbine components offer a comparably high
potential to localize for GCC countries as the leading
manufacturers globally have already succeeded in localizing
the manufacturing of these components in various parts of
the world (e.g., Asia, Latin America, Europe). Non-complex
wind turbine components (e.g., steel structures, cabling)
can be manufactured locally using current GCC
capabilities in the short-term. Additionally, more complex
wind turbine components (e.g., blades, nacelle) can
potentially also be localized in GCC countries in mid- and
long-term by establishing partnerships with international
players and ensuring technology transfer (e.g. in 2017,
Siemens Gamesa inaugurated Africa’s first wind blade
factory in Tanger, Morocco).
Illustration 19: Localization potential of Renewable Energy value chain
Source: Expert interviews, Roland Berger

23
POTENTIAL OF ~1 M JOBS FROM THE GREEN H2 VALUE CHAIN LOCALIZATION BY 2050
The development of the hydrogen economy and
localization of the value chain activities represent new
employment opportunities across a wide range of
positions and skills. The GCC countries becoming a leading
player in the hydrogen ecosystem could result in the creation
of 400-900 k direct and indirect jobs in the region by 2050.
This estimation is based on the afore-mentioned hydrogen
economy scenarios of USD 70-140 m (Conservative case)
and USD 120-200 m (Aggressive case) revenue from
green hydrogen production. In addition, it is contingent on
the level of local manufacturing activities in the GCC
countries which foster local job creation.
In a conservative case it is assumed that GCC countries
will achieve high levels of localization for manufacturing of
low complexity components from the hydrogen value chain
(e.g., steel structures, electrical components) and partially of
medium complexity components (e.g. solar photovoltaic
modules).
In the aggressive case, GCC countries will achieve high
localization of low and medium complexity components
while partially localizing the manufacturing of high
complexity components (e.g. polysilicon).
Illustration 20: Localization scenarios
Source: Roland Berger

24
Consequently, it is expected (see Illustration 20) that the
largest job creation in the value chain will be within the
renewable industry dedicated to green hydrogen. ~200-
450 k jobs are expected to be created in the region by 2050
for the renewable generation related to hydrogen
production, of which a majority will be for the manufacturing
and construction of the renewable capacity.
Additionally, the electrolysis industry is expected to
contribute substantially to the job creation in the region.
By 2050, electrolysis and related industries have the
potential to employ between ~100-220 k people in GCC
countries.
Lastly, hydrogen storage is expected to create ~65-150 k
direct and indirect jobs by 2050 while hydrogen distribution
sector has the potential to create employment for ~45-90 k
people in the GCC countries.
A large share of the jobs created in hydrogen economy is
expected to be in manufacturing activities across the
hydrogen value chain, with a total of ~180-400 k people
employed in these activities by 2050. In addition, ~120-270
k jobs are expected to be created in design & installation-
related activities. Finally, ~100-230 k jobs are expected
within the operation and maintenance activities across
the hydrogen value chain by 2050.
Illustration 20: Job creation by value chain activity [2030-2050]
Source: Roland Berger
The development of the hydrogen industry in GCC countries
will ensure the creation of a significant number of high-
skilled jobs in the region (see Illustration 21). It is estimated
that ~75-150 k people with a university background can
be employed in the hydrogen and related industries as
managers or professionals by 2050 mainly driven by design,
project development and engineering activities. The majority
of these will be engineers from diverse backgrounds
consisting of primarily electrical, chemical and mechanical
engineers.
Technicians will also be required, driven by manufacturing
and O&M activities, with the potential to employ ~45-90 k
technicians by 2050 across the hydrogen value chain.
Workers will be the job group with highest demand,
especially within the manufacturing and construction
activities throughout the value chain. ~150-320 k skilled
(e.g., electricians, metal and machinery workers) and
~150-360 k unskilled workers (e.g., labourers,
assemblers) are expected to be employed in the GCC
hydrogen economy by 2050. As GCC countries become a
hub for the global hydrogen economy, manufacturing jobs
will be permanent while a part of construction workforce will
eventually shift to other sectors as the hydrogen sector
development & construction is scaled down.
2050
Electrolysis
2030
Storage
Renewable Generation
Distribution
40-80 k
400-900 k

25
Illustration 21: Job creation by skill level [2030-2050]
Source: Roland Berger
The emerging jobs in GCC hydrogen economy will create a
substantial demand for fresh graduates and
experienced professionals in the region. However, during
the transition into the hydrogen economy, there is potential
that part of the newly created positions can be filled
leveraging existing local capabilities.
The region's highly qualified workforce in the Oil & Gas
sector represents a major opportunity for the development
of the hydrogen economy in the region.
In particular, potential exists in the manufacturing
industry currently supporting the Oil & Gas sector in the
region. Part of the workforce in the manufacturing activities
can transition into the manufacturing industry, which will
support the hydrogen value chain.
The compatibility of the positions and skills between the
Oil & Gas and the hydrogen industry will reduce the
efforts needed to develop the workforce for the newly
developing hydrogen sector, reduce the redundancies in the
workforce driven by the decarbonizing of the economy and
also support the Saudization efforts in the newly developing
hydrogen economy.
2050
Managers & Professionals
2030
Skilled workers
Technicians
Unskilled workers40-80 k
400-900 k
26
C. H2 STRATEGIES, INFRASTRUCTURE & HUMAN CAPABILITIES AS
KEY ENABLERS
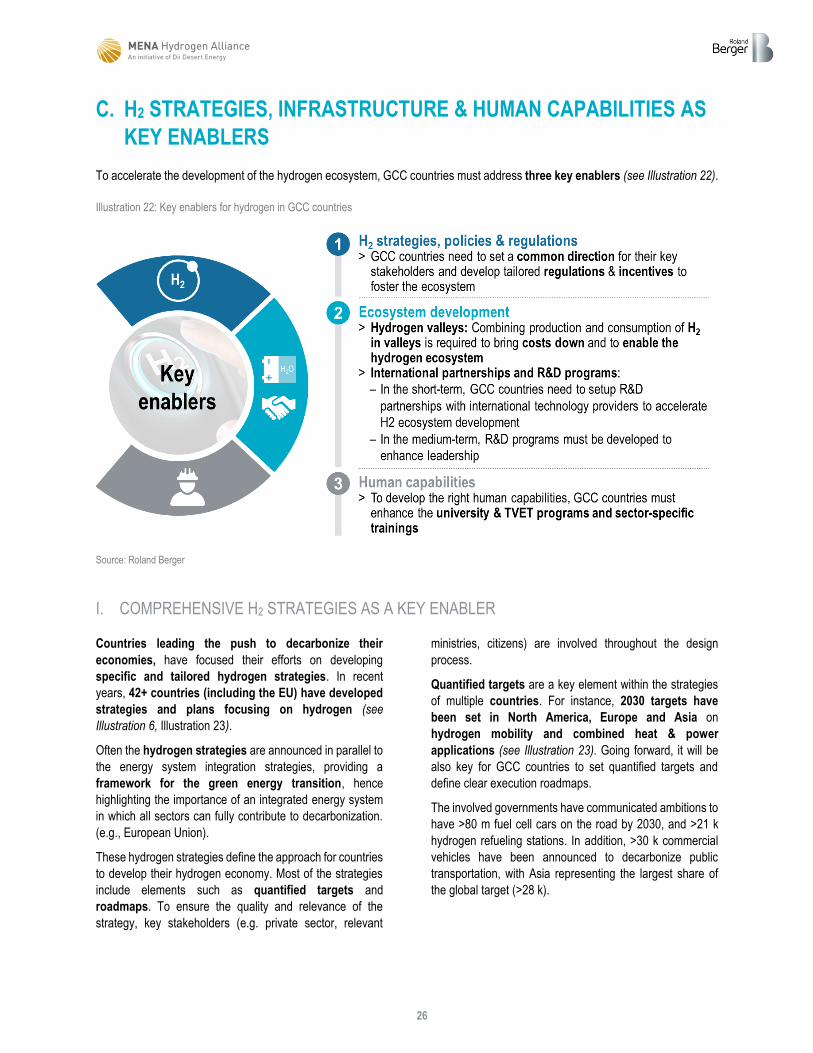
To accelerate the development of the hydrogen ecosystem, GCC countries must address three key enablers (see Illustration 22).
Illustration 22: Key enablers for hydrogen in GCC countries
Source: Roland Berger
I. COMPREHENSIVE H2 STRATEGIES AS A KEY ENABLER
Countries leading the push to decarbonize their
economies, have focused their efforts on developing
specific and tailored hydrogen strategies. In recent
years, 42+ countries (including the EU) have developed
strategies and plans focusing on hydrogen (see
Illustration 6, Illustration 23).
Often the hydrogen strategies are announced in parallel to
the energy system integration strategies, providing a
framework for the green energy transition, hence
highlighting the importance of an integrated energy system
in which all sectors can fully contribute to decarbonization.
(e.g., European Union).
These hydrogen strategies define the approach for countries
to develop their hydrogen economy. Most of the strategies
include elements such as quantified targets and
roadmaps. To ensure the quality and relevance of the
strategy, key stakeholders (e.g. private sector, relevant
ministries, citizens) are involved throughout the design
process.
Quantified targets are a key element within the strategies
of multiple countries. For instance, 2030 targets have
been set in North America, Europe and Asia on
hydrogen mobility and combined heat & power
applications (see Illustration 23). Going forward, it will be
also key for GCC countries to set quantified targets and
define clear execution roadmaps.
The involved governments have communicated ambitions to
have >80 m fuel cell cars on the road by 2030, and >21 k
hydrogen refueling stations. In addition, >30 k commercial
vehicles have been announced to decarbonize public
transportation, with Asia representing the largest share of
the global target (>28 k).
27
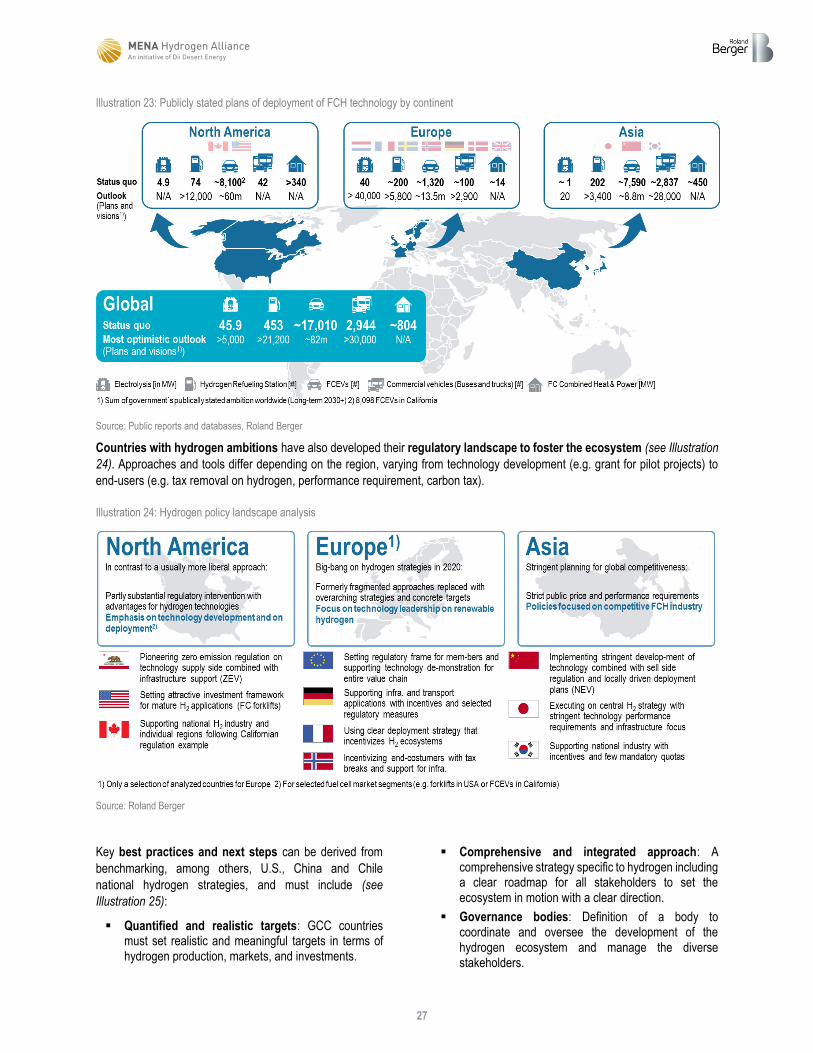
Illustration 23: Publicly stated plans of deployment of FCH technology by continent
Source: Public reports and databases, Roland Berger
Countries with hydrogen ambitions have also developed their regulatory landscape to foster the ecosystem (see Illustration
24). Approaches and tools differ depending on the region, varying from technology development (e.g. grant for pilot projects) to
end-users (e.g. tax removal on hydrogen, performance requirement, carbon tax).
Illustration 24: Hydrogen policy landscape analysis
Source: Roland Berger
Key best practices and next steps can be derived from
benchmarking, among others, U.S., China and Chile
national hydrogen strategies, and must include (see
Illustration 25):
▪ Quantified and realistic targets: GCC countries must set realistic and meaningful targets in terms of hydrogen production, markets, and investments.
▪ Comprehensive and integrated approach: A comprehensive strategy specific to hydrogen including a clear roadmap for all stakeholders to set the ecosystem in motion with a clear direction.
▪ Governance bodies: Definition of a body to coordinate and oversee the development of the hydrogen ecosystem and manage the diverse stakeholders.

28
▪ Engaging in international efforts: GCC countries must support international efforts to work on
guarantees of origin, which will be a major element in international trade
Illustration 25: Potential actions for GCC countries
Source: U.S. Department of Energy, Gobierno de Chile, Cleantech Group, China Hydrogen Alliance, Roland Berger
II. ECOSYSTEM DEVELOPMENT VIA H2 VALLEYS, INTERNATIONAL PARTNERSHIPS AND
R&D PROGRAMS
Hydrogen valleys combine green hydrogen production,
storage, distribution and final-use in one geographical
area, thereby forming an integrated ecosystem (see
Illustration 26). Hydrogen is produced via electrolysis
powered by renewable capacity. The renewable capacity
can be located onsite or in another location depending on
the space available.
Hydrogen valleys typically focus on a wide variety of
applications such as industrial use (e.g., chemicals, refining,
iron & steel), mobility and energy storage, as well as having
capabilities to export green hydrogen.
Illustration 26: Hydrogen valley overview and potential off-takers
Source: Roland Berger

29
To build a competitive green hydrogen valley, several
requirements need to be taken into account:
▪ High electrolyzer load factor obtained through:
- An optimized mix of complementary renewable sources: Combination of several renewable sources (e.g. solar, wind) is required to ensure a combined production cycle maximizing electrolyzer utilization (key cost driver).
- Electricity storage capacity (e.g., battery, hydro storage): Hydrogen valleys need electricity
storage capacity to overcome the intermittent nature of renewables and to ensure a stable input for the electrolyzer during off-peak periods.
▪ Hydrogen storage capacity: Hydrogen storage facilities at the consumption site are required to ensure a constant flow of hydrogen to off-takers.
▪ Pipelines for transport/distribution: The large and stable hydrogen demand requires the use of pipelines to transport the hydrogen and increase the cost competitiveness (see Illustration 27).
Illustration 27: Hydrogen delivery methods
Source: U.S. Department of Energy
30
The hydrogen valley concept is a key enabler of hydrogen
ecosystems due to the following direct benefits:
▪ Lower hydrogen cost: The valleys bring the costs down for off-takers by achieving economies of scale, significantly reducing the cost of transportation and enabling predictable supply and demand.
▪ Heightened investment attraction: Hydrogen valleys enable more competitive production costs, greater distribution of risk amongst different stakeholders (e.g., producers, off-takers) thereby fostering investors' confidence.
▪ Increased adjacent industry localization: The larger scale offered by hydrogen valleys make them more attractive (low hydrogen cost, ecosystem already in place) for localization of adjacent industries
(e.g. cement industries) or equipment manufacturers (e.g. electrolyzer manufacturer).
▪ Promotion of Green H2 benefits: H2 valleys help to promote green hydrogen due to the scale and diversity of the stakeholders involved in the projects.
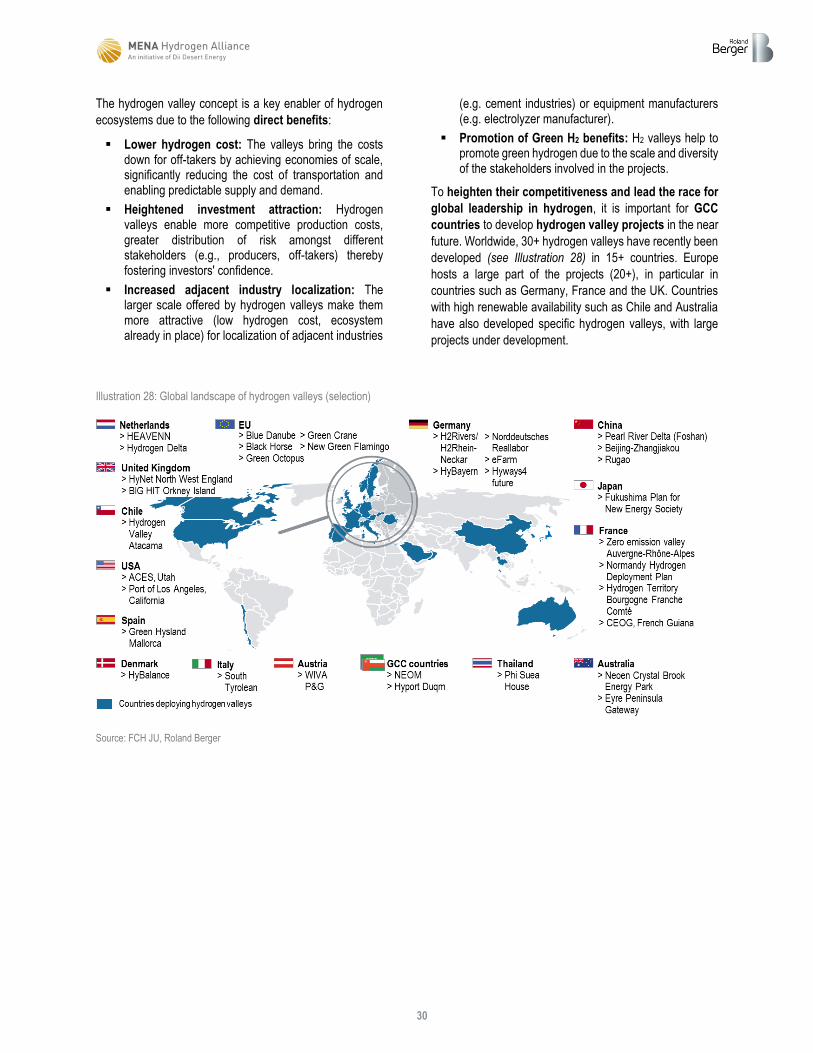
To heighten their competitiveness and lead the race for
global leadership in hydrogen, it is important for GCC
countries to develop hydrogen valley projects in the near
future. Worldwide, 30+ hydrogen valleys have recently been
developed (see Illustration 28) in 15+ countries. Europe
hosts a large part of the projects (20+), in particular in
countries such as Germany, France and the UK. Countries
with high renewable availability such as Chile and Australia
have also developed specific hydrogen valleys, with large
projects under development.
Illustration 28: Global landscape of hydrogen valleys (selection)
Source: FCH JU, Roland Berger
31
In the short-term, GCC countries need to setup R&D
partnerships with international technology providers to
accelerate the development of their hydrogen
ecosystem, in particular for advanced technologies (e.g.
electrolyzer stack). Around the world, multiple partnerships
are beeing formed combining technology providers (e.g.,
electrolyzer manufacturer) with energy stakeholders to
develop green hydrogen projects. For instance, Snam
(Italian energy infrastructure company) and ITM Power
(British manufacturer of electrolyzer) have recently signed a
partnership agreement to integrate the development of
electrolyzer technology to green hydrogen projects. In the
UAE, DEWA and Siemens have signed a partnership to
launch a solar-based hydrogen electrolysis facility that is
already being commissioned, with Siemens providing the
technical knowledge and know-how.
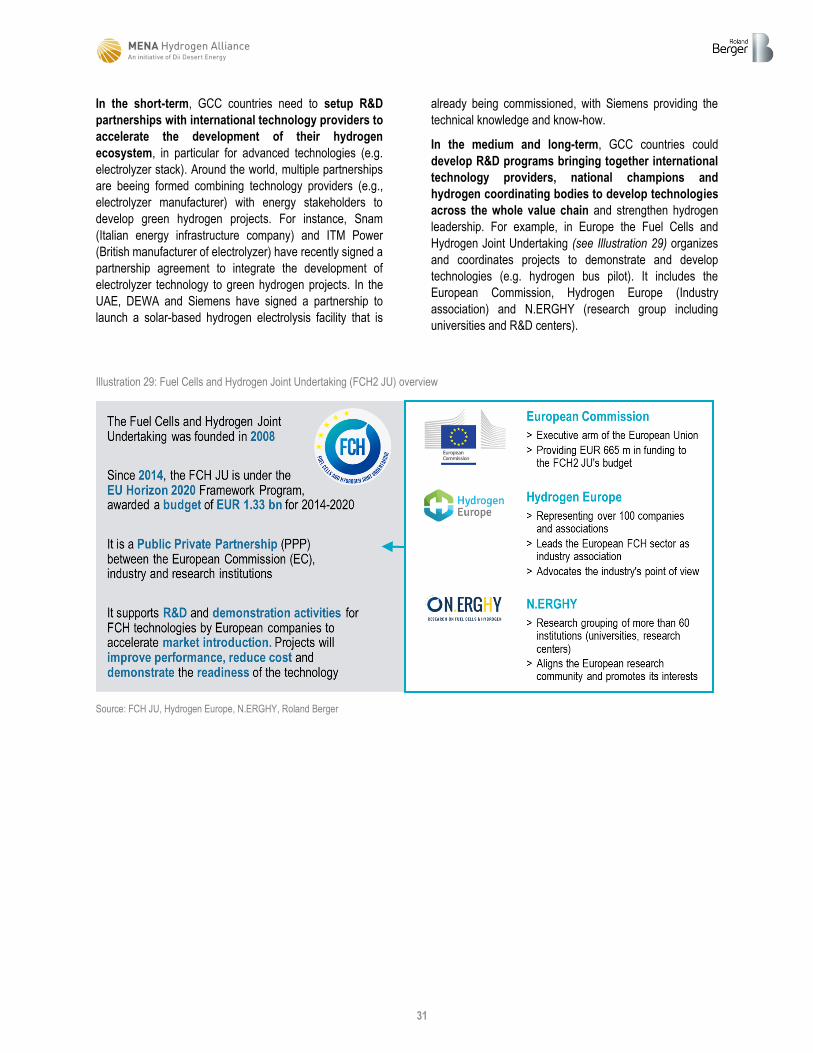
In the medium and long-term, GCC countries could
develop R&D programs bringing together international
technology providers, national champions and
hydrogen coordinating bodies to develop technologies
across the whole value chain and strengthen hydrogen
leadership. For example, in Europe the Fuel Cells and
Hydrogen Joint Undertaking (see Illustration 29) organizes
and coordinates projects to demonstrate and develop
technologies (e.g. hydrogen bus pilot). It includes the
European Commission, Hydrogen Europe (Industry
association) and N.ERGHY (research group including
universities and R&D centers).
Illustration 29: Fuel Cells and Hydrogen Joint Undertaking (FCH2 JU) overview
Source: FCH JU, Hydrogen Europe, N.ERGHY, Roland Berger

32
III. REQUIREMENT FOR ENHANCED EDUCATIONAL PROGRAMS AND TRAININGS
The development of the GCC hydrogen economy will
create a large demand for qualified workforce. Many job
functions in the hydrogen sector will require new skills not
existing in the current workforce, thus, it will be key to
establish a human capability build-up (HCB) ecosystem to
develop the skills needed in the sector.
The HCB ecosystem should support the future sector
workforce to gain the necessary skills throughout their
development journeys through relevant educational
programs (University and Technical & Vocational
Education), sector-specific upskilling trainings and on-the-
job trainings to ensure the hands-on experience.
Educational programs need be established and revised
to address the needs of this emerging sector. In the
universities, bachelor and master programs related to
science and engineering need to include hydrogen focus for
the interested students to have the first insights on the
subject and gain the required skills to serve in the sector. On
the TVET level, existing programs need to be enhanced
considering the workforce demand and skills required in the
hydrogen sector especially in manufacturing, installation and
maintenance subjects.
Part of the experienced workforce joining from other
sectors (e.g. Oil & Gas) will re- skilling to serve in the
hydrogen economy due to the sector specificities. Thus, it
will be key to develop sector-specific upskilling trainings for
experienced workforce joining the sector to adapt to the
requirements of the hydrogen economy. These trainings will
need to be supported by on-the-job trainings for the
workforce to gain first-hand experience.
Coordination between the stakeholders will be key to
develop the relevant programs and certifications and
set the standards regarding the capability development to
ensure that the future workforce gains the knowledge and
skills needed in the sector.
33
D. CONCLUSION FOR GCC COUNTRIES
Driven by countries' policies & regulations and drop in
costs, the hydrogen market is expected to significantly
grow in the coming decades, with demand potentially
reaching ~580 m MT by 2050.
The GCC countries can seize this opportunity by deploying
local large-scale production capacities and develop
their hydrogen ecosystems. By doing so, they could
generate annual revenues of USD ~70-200 bn and ~1 m
jobs by 2050. In the short-term, the most attractive activity
to localize for GCC countries are the electrolyzers, which
represents 20-40% of the total value chain cost.
To unlock the full potential of the hydrogen economy, GCC
countries must address four key enablers. First, GCC
countries need to set a clear direction for all key
stakeholders with integrated hydrogen strategies,
including quantified targets and hydrogen-specific
regulations and incentives. Second, GCC countries should
develop hydrogen valleys to reduce production costs,
attract additional investments and support the ecosystem
development. Third, GCC countries must develop
international partnerships with key technology
providers to gather and develop the required knowledge to
build leadership in hydrogen. Last, GCC countries must
enhance the university & training programs and sector-
specific trainings to prepare the qualified workforce
needed to deploy the hydrogen economy across its wide
value chain.
34
E. ABOUT
Founded in 1967, Roland Berger is a leading global
consultancy firm of European roots. It is German by origin
and has grown to develop a strong global footprint. Its
entrepreneurial spirit has shaped its growth and fueled its
outstanding achievements since the early days of the firm.
With over 50 years of continuous growth behind it and 2,400
employees working in 34 countries, Roland Berger is one of
the leading players in global top-management consulting
and has successful operations in all major markets. Through
its particularly strong expertise and network in the energy
sector globally, Roland Berger is at the forefront of
discussions and developments related to energy transition
and decarbonization, renewable energy, and green
hydrogen. Roland Berger has done extensive work across
all energy subjects globally for policymakers, sector
companies and investors.
Dii Desert Energy is an independent, international public-
private sector network operating from Dubai. Dii was
launched in 2009 as an industry initiative in Germany
(formerly known as ‘Desertec Industrial Initiative’) for
accelerating the energy transition in the MENA region
towards the supply of green electrons and molecules across
the regional and global energy value chains. Our group is
encouraging sustained prosperity and stability in the region
through local value creation and jobs thanks to the energy
transition. This has been established in the market as
Desertec 3.0.
In early 2020, Dii launched the MENA Hydrogen Alliance to
kick start green hydrogen economies and to provide a
platform to discuss pathways forward and formulate joint
studies. The alliance acts as an impartial advisor to promote
projects, elaborating business cases and structures for mid-
scale to giga-scale projects. It proposes the necessary
policy and regulatory frameworks, identifies international off-
takers and educates different stakeholders on technical and
economic aspects of the entire value chain, including virtual
and physical export of green energy.
Dii's platform of more than 50 companies and organizations
from 25 countries is mobilizing top executives, public
stakeholders, R&D institutions and academia supporting
Our Mission: No Emissions!
.
35
F. ACKNOWLEDGMENTS
Authors

36
We appreciate the support provided for this document by the following list of interviewees:
Adamo Screnci, Dr Alessandro Zampieri, Amin Al Yaquob, Anas Almathami, Andrea Lovato, Dr Cetin Nazikkol, Damien Sage,
Driss Berraho, Emanuele Bianco, Fadi Maloouf, Firas al Abduwani, Frank Wouters, Jost Herbert, Dr Malcolm Cook, Manthos
Kallios, Manuel Kuehn, Mohamad El Nahi, Mohammed Lawati, Paul van Son, Ralph de Haan, Reshma Carmel Francy, Roland
Kaeppner, Thamer Alghafees and Yousif Al Ali.

37
G. ILLUSTRATIONS
Illustration 1: Evolution of greenhouse gas emissions depending on level of commitment [gigatons per year] ............................... 5
Illustration 2: Benefits of clean hydrogen (blue and green) ............................................................................................................... 6
Illustration 3: Mapping of hydrogen end-uses ................................................................................................................................... 6
Illustration 4: Energy storage capacity by technology ....................................................................................................................... 7
Illustration 5: Hydrogen production1) pathways and types [2019] ..................................................................................................... 8
Illustration 6: Hydrogen potential development around the world [2020] .......................................................................................... 9
Illustration 7: Historical hydrogen demand by application [m MT, 1975 – 2020] ............................................................................. 10
Illustration 8: Global hydrogen demand forecast [m MT, 2019-2050] ............................................................................................. 11
Illustration 9: Potential long-term cost of green hydrogen based on solar photovoltaic & onshore wind systems [USD/kg] .......... 12
Illustration 10: Potential 2050 hydrogen imports of selected regions and countries [2050] ............................................................ 13
Illustration 11: GCC current and future hydrogen demand by application [m MT] .......................................................................... 14
Illustration 12: Potential hydrogen opportunity for GCC countries [2050] ....................................................................................... 15
Illustration 13: Potential hydrogen revenues of GCC countries [2050] ........................................................................................... 16
Illustration 14: Estimation of investments required from GCC countries by 2050 [USD bn] ........................................................... 17
Illustration 15: Overview of NEOM project in Saudi Arabia ............................................................................................................. 19
Illustration 16: Hydrogen value chain overview ............................................................................................................................... 20
Illustration 17: Localization potential across the hydrogen value chain (final use not considered) ................................................. 21
Illustration 18: Localization potential of electrolyzer sub-systems .................................................................................................. 21
Illustration 19: Localization potential of Renewable Energy value chain ........................................................................................ 22
Illustration 21: Job creation by value chain activity [2030-2050] ..................................................................................................... 24
Illustration 22: Job creation by skill level [2030-2050]..................................................................................................................... 25
Illustration 23: Key enablers for hydrogen in GCC countries .......................................................................................................... 26
Illustration 24: Publicly stated plans of deployment of FCH technology by continent ..................................................................... 27
Illustration 25: Hydrogen policy landscape analysis ....................................................................................................................... 27
Illustration 26: Potential actions for GCC countries ........................................................................................................................ 28
Illustration 27: Hydrogen valley overview and potential off-takers .................................................................................................. 28
Illustration 28: Hydrogen delivery methods ..................................................................................................................................... 29
Illustration 29: Global landscape of hydrogen valleys (selection) ................................................................................................... 30
Illustration 30: Fuel Cells and Hydrogen Joint Undertaking (FCH2 JU) overview ........................................................................... 31

38
H. REFERENCES
Deme Group. (2020). Kick-off of the Hyport® Duqm green hydrogen project. Retrieved from https://www.deme-
group.com/news/kick-hyportr-duqm-green-hydrogen-project
Dii/Friedrich Ebert Foundation. (2020). The risks and opportunities of green hydrogen production in MENA.
Dii Desert Energy & Fraunhofer ISI (2012). Desert Power 2050 – Perspectives on a Sustainable Power System for EUMENA.
Retrieved from https://dii-desertenergy.org/publications/desert-power-2050/
Dii Desert Energy (2013). The Economic Impacts of Desert Power, Socio-economic aspects of an EUMENA renewable energy
transition. Retrieved from https://dii-desertenergy.org/wp-content/uploads/2016/12/2013-07-30_Dii_EIDP_EN_Digital.pdf
Dii Desert Energy (2019). P. van Son, T. Isenburg (2019). Emission-free energy from the deserts
Hydrogen Council. (2020). Path to hydrogen competitiveness: a cost perspective. Retrieved from
https://hydrogencouncil.com/en/path-to-hydrogen-competitiveness-a-cost-perspective/
IEA. (2019). The Future of Hydrogen. Retrieved from https://www.iea.org/reports/the-future-of-hydrogen
IEA. (2020). Renewables 2020, Analysis and forecast to 2025. Retrieved from https://www.iea.org/reports/renewables-2020
IHS Markit. (2020). IHS Markit: annual investments in green hydrogen production to exceed $1 billion by 2023. Retrieved from
https://www.greencarcongress.com/2020/12/20201204-
ihsgh2.html#:~:text=Green%20hydrogen%20production%20costs%20are,cost%20of%20the%20electrolysis%20equipment.
Mubadala. (2021). Mubadala and Siemens Energy sign MoU to accelerate green hydrogen capabilities in Abu Dhabi. Retrieved
from https://www.mubadala.com/en/news/mubadala-and-siemens-energy-sign-mou-accelerate-green-hydrogen-capabilities-abu-
dhabi
Mubadala. (2021). Mubadala, ADNOC and ADQ form alliance to accelerate Abu Dhabi Hydrogen leadership. Retrieved from
https://www.mubadala.com/en/news/mubadala-adnoc-and-adq-form-alliance-accelerate-abu-dhabi-hydrogen-leadership
Reuters. (2020). Japan set to target zero emissions by 2050 in policy shift. Retrieved from
https://www.reuters.com/article/climate-japan-policy-shift-idUSKBN2780RN
Sovereign Wealth Fund Institute (SWFI). (n.d.). Fund profile. Retrieved from https://www.swfinstitute.org/
Transparency Market Research. (2020). Water Electrolysis Machine Market. Retrieved from
https://www.transparencymarketresearch.com/water-electrolysis-machine-market.html
Van Wijk, A., Wouters, F., Rachidi, S., & Ikken, B. (2019, November). A North Africa - Europe Hydrogen Manifesto. Retrieved
from https://dii-desertenergy.org/wp-content/uploads/2019/12/Dii-hydrogen-study-November-2019.pdf
Van Wijk, A., Chatzimarkakis, J., (2020). Green Hydrogen for a European Green Deal. A 2x40 GW Initiative. Retrieved from
https://dii-desertenergy.org/wp-content/uploads/2020/04/2020-04-01_Dii_Hydrogen_Studie2020_v13_SP.pdf
Wood Mackenzie. (2019). How the big Gulf producers are investing in 2019. Retrieved from
https://www.woodmac.com/news/the-edge/how-the-big-gulf-producers-are-investing-in-2019/
World Shipping Council. (2019). Top 50 world container ports. Retrieved from https://www.worldshipping.org/about-the-
industry/global-trade/top-50-world-container-ports