the physics of kicking a football
DESCRIPTION
KickingTRANSCRIPT
The Physics of Kicking a Football
The game of American football is filled with illustrations of the principles of physics. Typically, a substantial fraction of the students in any introductory physics course follow
college or professional football rather closely and are reasonably fimtiliar with the strategies and techniques of play. An enlightened physics teacher can take effective advantage of this interest by using game situations to clarify some of the concepts of physics. For example, the shifty movements of a good running back can serve to demonstrate the concept of ac-celeration, and various blocking and tackling situations can be used as dramatic examples of the theory of two-body collisions. It is also instructive to consider the football as a projec-tile. The trajectory of a football pass or kick illustrates not only the principles of projectile motion, but also some basic concepts of aerodynamics.
The "Kicker's Dilemma"
Let us take a physicist's view of the problems involved in kicking a football. Whether the ball is being kicked from a tee or punted (Le., kicked in midair as it fulls onto the kicker's foot), the kicker's usual purpose is to send the ball as far downfield as possible. At the same time, he is also trying to keep the ball in flight for as long as possible, so that his teammates can get downfield to tackle the kick receiver and prevent a substantial runback. In the lan-guage of physics, the kicker would like to maximize both the horizontal range and the time of flight or 'hang time' of the kick. However, an examination of the equations of projectile motion quickly reveals that this is not possible. If air resistance is neglected, the maximum horizontal range, R, and hang time, T, are given by the equations:
R = v02 sin 200
and T == 2vo sin 00 g g
where Vo and 80 are the launching speed and launching angle, respectively. It is evident from the above equations that R is maximized for a given v 0 by launching a projectile at a 45° angle, whereas T is maximized when the launching angle is 90°.
Obviously, it is very poor strategy to launch a kick vertically upward just to maximize its hang time - but on the other hand, a kick launched at a 45°angle has a hang time 29.3% shorter than the maximum for the given launching speed. Thus the "kicker's dilemma" is that he must choose a launching angle, somewhere between the extremes of 45° and that provides the best strategic combination of distance and hang time. How much distance is the kicker willing to sacrifice to gain hang time (or vice versa) in each given kicking situa-tion? Under these circumstances, what is the optimum launching angle?
Since there is no analytic solution to this problem, and since football kickers them-selves have arrived at a solution through the process of trial and error, we must therefore observe the kickers in action in order to discover how they deal with this dilemma. It is difficult to measure the launching angle directly; such an approach calls for high-speed cinematography under artificial conditions. However, it is possible, at least in principle, to calculate the launching angle from measurements of the trajectory of the kick. In particu-lar, the horizontal range and hang time can be readily obtained from televised football games, especially if one can videotape them.
To obtain data for this study, I examined the videotapes of 26 regular National Foot-ball League games between September and November of 1984. For every kickoff and punt observed, I recorded the horizontal distance in yards (measured from the point where the kicker's foot hit the ball to the point where the ball was caught or hit the ground) and the hang time. The latter was measured with a digital stopwatch; three viewings of a kick were usually sufficient to give a value accurate to 0.1 sec. The distances could be meas-ured to an accuracy of one yard. It should be noted that the distances thus recorded are quite
PETERJ.BRANCAZIO
Peter J. Brancazio is an associate profes-sor of physics at Brooklyn College, CUNY, the author of SportScience (Simon & Schuster, 1984), and a notoriously poor punter. He gave up his Sunday afternoons and Monday nights for several months in order to obtain the data for this article. Department of Physics, Brooklyn College, CUNY, Brooklyn, NY 11210).
THE PHYSICS TEACHER OCTOBER 1985 403
different from those reported by the game announcers since football rules specify that the length of a punt is to be measured from the line of scrimmage to the point where the ball is fielded or comes to a stop. Thus if a punt is not caught and is allowed to roll or bounce after it hits the ground, the distance that it travels in this manner is added to the distance the ball travels in flight. (So that the numerical results will be recognizable to football funs, I will be using U.S. cus-tomary units throughout this article.)
I obtained data for a total of 206 kickoffs (by 21 different kickers) and 238 punts (by 24 different punters). Kickoffs and punts were grouped separately because they are produced under quite differ-ent conditions. In a kickoff, the ball is kicked from a tee, and the kicker has the lUXUry of an unimpeded running start to begin the kick. A punter kicks the ball from a standing start while opponents are rushing at him from all sides. These conditions dictate different kicking strategies, techniques, and skills - so that almost without exception, every football team assigns the jobs of kicking and punting to two separate individuals.
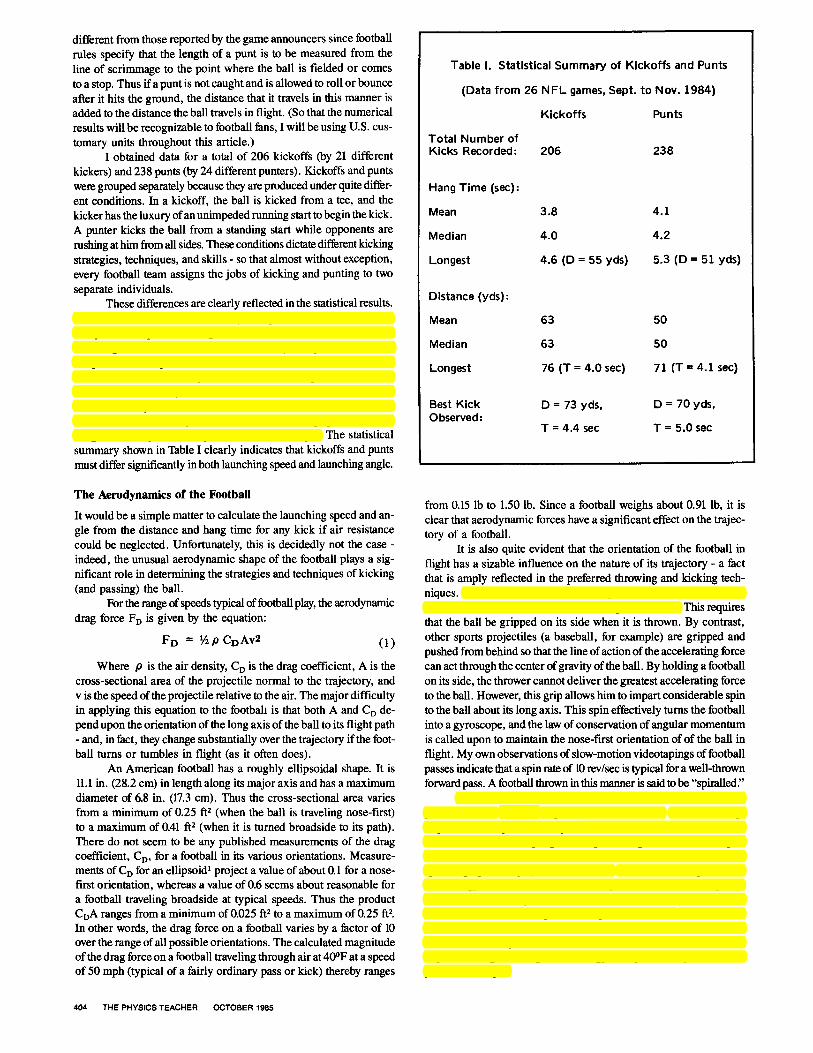
These differences are clearly reflected in the statistical results. Kickoffs show much less variability than punts. They exhibit a rela-tively narrow spread of hang times; 74 % of the kickoffs recorded had hang times between 3.8 and 4.3 sec. By comparison, 77% of the punts had hang times between 3.6 and 4.7 sec. Moreover, 88 % of the kickoffs traveled 55 yards or more, whereas punting distances were distributed widely (one standard deviation about the mean ranged from 43 to 58 yards). In general, the results show that the average kickoff travels about 12 yards farther than the average punt, whereas hang times for punts average about 0.2 sec. longer. The statistical summary shown in Table I clearly indicates that kickoffs and punts must differ significantly in both launching speed and launching angle.
The Aerodynamics of the Football
It would be a simple matter to calculate the launching speed and an-gle from the distance and hang time for any kick if air resistance could be neglected. Unfortunately, this is decidedly not the case -indeed, the unusual aerodynamic shape of the football plays a sig-nificant role in determining the strategies and techniques of kicking (and passing) the ball.
For the range of speeds typical of football play, the aerodynamic drag force Fo is given by the equation:
Fo = ¥ZP COAv2 (1)
Where p is the air density, Co is the drag coefficient, A is the cross-sectional area of the projectile normal to the trajectory, and v is the speed of the projectile relative to the air. The major difficulty in applying this equation to the football is that both A and CD de-pend upon the orientation of the long axis of the ball to its flight path - and, in fact, they change substantially over the trajectory if the foot-ball turns or tumbles in flight (as it often does).
An American football has a roughly ellipsoidal shape. It is 11.1 in. (28.2 cm) in length along its major axis and has a maximum diameter of 6.8 in. (17.3 cm). Thus the cross-sectional area varies from a minimum of 0.25 ft2 (when the ball is traveling nose-first) to a maximum of 0.41 ft2 (when it is turned broadside to its path). There do not seem to be any published measurements of the drag coefficient, CD' for a football in its various orientations. Measure-ments of CD for an ellipsoid 1 project a value of about 0.1 for a nose-first orientation, whereas a value of 0.6 seems about reaspnable for a football traveling broadside at typical speeds. Thus the product CoA ranges from a minimum of 0.025 ft2 to a maximum of 0.25 ft2. In other words, the drag force on a football varies by a factor of 10 over the range of all possible orientations. The calculated magnitude of the drag force on a football traveling through air at 40°F at a speed of 50 mph (typical of a fairly ordinary pass or kick) thereby ranges
4()4 THE PHYSICS TEACHER OCTOBER 1985
Table I. Statistical Summary of Kickoffs and Punts
(Data from 26 NFL games, Sept. to Nov. 1984)
Total Number of Kicks Recorded:
Hang Time (sec):
Mean
Median
Longest
Distance (yds):
Mean
Median
Longest
Best Kick Observed:
Kickoffs Punts
206 238
3.8 4.1
4.0 4.2
4.6 (0 = 55 yds) 5.3 (0 = 51 yds)
63 50
63 50
76 (T = 4.0 sec) 71 (T = 4.1 sec)
0= 73 yds, 0= 70 yds,
T = 4.4 sec T = 5.0 sec
from 0.15 lb to 1.50 lb. Since a football weighs about 0.91 lb, it is clear that aerodynamic forces have a significant effect on the trajec-tory of a football.
It is also quite evident that the orientation of the football in flight has a sizable influence on the nature of its trajectory - a fact that is amply reflected in the preferred throwing and kicking tech-niques. To attain distance and accuracy, it is essential that the ball be launched in a nose-first (minimum-drag) orientation. This requires that the ball be gripped on its side when it is thrown. By contrast, other sports projectiles (a baseball, for example) are gripped and pushed from behind so that the line of action of the accelerating force can act through the center of gravity of the ball. By holding a football on its side, the thrower cannot deliver the greatest accelerating force to the ball. However, this grip allows him to impart considerable spin to the ball about its long axis. This spin effectively turns the football into a gyroscope, and the law of conservation of angular momentum is called upon to maintain the nose-first orientation of of the ball in flight. My own observations of slow-motion videotapings of football passes indicate that a spin rate of 10 rev/sec is typical for a well-thrown forward pass. A football thrown in this manner is said to be "spiralled."
Almost any average athlete can learn to throw a decent spiral pass. However, kicking a spiral is another matter. Punters attempt to give a ball a spin by hitting the underside of the ball with the top of their foot, while angling their leg from right to left (for a right-footed kicker). Under the game conditions, they are successful in spiralling a punt roughly 60% of the time. Place kickers adopt a differ-ent strategy, however. for it is extremely difficult to "kick a spiral" when the football is positioned on a tee. Instead, they deliberately kick the ball so that the point of impact of their foot is below the center of the football. This causes the ball to tumble end-over-end as it travels through the air. While this does not minimize the aer-odynamic drag, it does give the ball gyroscopic stability and a more predictable flight.

Calculation of Launch Parameters The calculation of range and hang time for a projectile ex-
periencing aerodynamic drag can be easily performed on a personal computer. The equations of motion for such a projectile cannot be made to yield an analytic solution, but they can be solved numeri-cally by stepwise integration using standard methods.2•3 The prob-lem with applying this procedure to the trajectory of the football is - as previously noted - that the drag force varies with the orientation of the football. The best one can do under these circumstances is to adopt some average value for the drag force.
In performing trajectory calculations, it is customary to write the drag force in the form Fo = mKv2, where m is the mass of the projectile and K is the drag factor. By comparison with Eq. (1) we see that K = P ACo/2m. Taking into account the preceding esti-mates of the range of values for A and Co, we find that K ranges from 0.001 ft-I (football traveling nose-first) to 0.010 ft-I (football traveling broadside). Theoretically, K ought to take on its minimum value for a perfectly spiralled football. For an end-over-end kick, the drag factor is presumably varying rapidly between the two ex-treme values, suggesting the use of some intermediate value of K. For a badly executed, non-spiralling pass or kick, the value of K is expected to be near the top of its range.
The effects of different amounts of aerodynamic drag on the range and hang time are shown in Fig. 1. The curves show more spe-cifically the nature of the "kicker's dilemma" with respect to the best choice of launching angle. In air, maximum horizontal range is attained at a launch angle lying somewhere between 40° and For higher launching angles up to 60°, there is a clear and acceptable trade-off of distance for hang time. However, for angles greater than 60° the kicker gives up a great deal of distance for only a slight in-crease in hang time. It seems evident that the preferred launching angle should lie somewhere between 40° and 60°.
Given the wide range of values for the drag factor K, it is not possible to calculate the launching speed or angle for any given kick. In other words, the problem is undetermined: there are three un-known parameters-launching speed (va'), launching angle (9
0), and
drag factor (K)-and only two "knowns" - i.e., the horizontal dis-tance (D) and hang time (T). If, however, we select some appropri-ate value for K, then there will be a unique set of launching parameters (v 0' 90 ) corresponding to every distance-hang time combination.
The launching parameters for a given kick (for a specific value of K) can be most easily obtained graphically. Fig. 2 shows the D-T curves for selected values of v 0 and 90 at K = 0.003 ft-I. The cir-cles and crosses represent selected kicks and punts taken from the data in Table I. One can readily interpolate the corresponding launch-ing parameters for any given kick from the graph. This procedure can then be repeated for different values of K to establish a range of possible launching parameters for a given kick.
Results
For each of the chosen kicks or punts, the launching parameters v 0 and 90 have been evaluated for values of K ranging from 0.001 to 0.005 ttl. The results are presented in Table n. Values in the 0.005 to 0.010 range have not been listed, since these correspond to poorly oriented kicks that would require unattainably large launching speeds. The results for K = 0 (no air resistance) have also been tabulated for comparison.
This table reveals a rather interesting result-namely, that the range of possible launching angles for a given kick does not depend very strongly on K. It is seen that an increase in K by a factor of five produces at most a 17% increase (about 9") in 9
0, Thus, for
example, the launching angle for an average kickoff (D = 63 yds, T = 3.8 sec) must lie between 42° and 490.
Vo = 60 MI/"R. 80
10
(,0 'VI' 0
50 UJ V Z 40 1<: o. 001 FT-I oc{ l-f/)
0 30
'20
\0
2 :3 4 s 6
HANG TIME (SEC)
Fig. 1. Distance - hang time curves for a football launched at 60 mph as a function of launching angle and drag IiIctor.
80 '?,50 40· 450 '" ) -+-1-
15 ... ,0 "SO· e
80// / I 0 \ ! I / \ Sr 10 ... ... -I--,t / Y +
/'\ 15// I I ''/.. j'
",5 !. I I / / \/ \ "0· :t -7-- ..... '" 1\ <
'iii' ;; 10 ---( / /0 \ / \ I \ p I I / / \/ \ / \ -?: (,0 f."...-I- -/....... / j\ \ '-50 UJ U ('5 '1 / / ....... 1.... / ' I \ Y Z S5 I / / / \ \ /\ « ..- -- I \/ \ tit .-/"' -, /............. I \ / \ f \ 0 So 60 1', / + '-< \ / \ + \ 70. \ /\ , y
o : KICKOfFS \ / \ I, \ I,so
4S A Y \ I + : PUNTS \ / \ \ 1\5 I
\ / ' ( 40 X \ I 10 '10 I o 2.S 3.0 3.5 4.0 4.5 5.0 5.S
HANG lIME (SEC)
Fig. 2. Distance - hang time curves for K = 0.003 ft-I. The launching speed (vJ and launching angle (80 ) for a given kick can be interpolated from this graph.
THE PHYSICS TEACHER OCTOBER 1985 405

PUNTS
AYerage Longest Longest Best Oyerall Punt: Distance: Hang Time: Punt:
D = 50yds D = 71 yds D = 51 yds D = 70 yds T = 4.1 sec T = 4.1 sec T = 5.3 sec T = 5.0 sec
K (ft-1) Yo 80 Yo 80 Yo 80 Yo 80
0 51 61° 57 52° 61 71° 62 62°
0.001 55 60° 62 50° 66 70° 67 60°
0.002 58 58° 68 48° 71 68° 74 58°
0.003 62 56° 76 46° 77 67° 82 56°
0.004 68 55° 84 44° 84 65° 92 54°
0.005 71 53° 95 42° 92 64° 102 52°
Estimate Yo= 60 Yo = 70 Yo = 70 Vo = 70
of 80 = 57° 80 = 47° 80 = 69° 80 = 59°
Table II. Estimated Launching Parameters K = 0.0025 K= 0.002 K = 0.002 K= 0.0015 Parameters - Kickoffs and Punts
Yo = launching speed in mph; 80 = launching angle; K = drag factor
This range can be further narrowed by considering the cor-responding values of the launching speed vo' The sports research literature contains reports of actual measurements of the launching speed of a kicked football. 4,5 Typically, these are obtained from cinematographic studies, in a laboratory setting, using one or more kickers from the college football team. Generally, the top launching speeds reported do not exceed 60 mph. On this basis, we might ex-pect the best professional punters to attain launching speeds around 70 mph. On kickoffs, the kicker augments his launching speed by running for about 10 yards prior to the kick. It is reasonable to expect that this maneuver will add about 10 mph to the kicker's stationary launching speed.
With these restrictions on the maximum launching speed in mind, I have made what I consider to be reasonable estimates of the launching parameters (vo, 9
0, K) for each of the kicks and punts
listed in Thble II. On this basis, we can now come to some conclu-sions about kicking strategy. Assuming that the average well-executed professional kickoff is launched at a speed of about 70 mph, we find that the average kick is being launched at an angle of about 45°. (It also appears that the end-oyer-end motion of the football in flight creates an effective drag factor of K = 0.003 ttl). Longer-than-average kickoffs are evidently the result of higher-than-average launch-ing speeds. It seems clear then, that kickoff specialists have adopted the strategy of kicking to maximize distance, by launching the kick-offs at about a 45° angle. One exception to this rule is presented in Thble II by the kickoff with the longest observed hang time (4.6 sec.), which was probably launched (inadvertently?) at about a 60° angle.
Punters, however, are more willing to sacrifice distance to gain hang time. If we assume that punting launching speeds fall in the 60 to 70 mph range for well-executed punts, we see that the effective value of K is about 0.002 fel . Accordingly, the typical launching an-gle for a punt is between 55° and 60°. Some punters may on occasion
406 THE PHYSICS TEACHER OCTOBER 1985
drop below 50° to gain more distance, or go as high as 70° to gain more hang time. In general, it turns out that by launching a punt at a 55° angle instead a punter sacrifices about five yards of dis-tance in exchange for an extra 0.55 sec. of hang time.
Finally, it is of interest to compare the estimated launching parameters with those calculated on the assumption that air resis-tance can be neglected. Bartlett has described a "take-home experi-ment" in which students are asked to record distances and hang times for kicks and punts, and then to calculate Vo and -90 using the stan-dard projectile motion equations.6,7 This is, of course, a very admira-ble and creative way to familiarize students with simple measure-ment procedures as well as the fundamentals of kinematics. It should be noted, however, that if air resistance is ignored the calculated launching speeds will be undervalued by about 10 to 20 mph, while the calculated launching angles will be consistently too large by about 5°.
Conclusion
This study demonstrates that it is possible to construct a con-sistent model of the trajectory of a football kick, using the laws of projectile motion and basic aerodynamics. This model is able to de-termine within a fairly narrow range the launching angles used for kickoffs and punts. We have seen that kickers and punters have de-veloped distinctly different strategies: kickoffs are launched at an-gles near 45° to maximize their distance, whereas punts are typi-cally launched at angles closer to thereby trading distance to gain additional hang time.
Are these the best strategies to use? Generally, the most sig-nificant statistical measure of success ought to be the net yardage gained on the kick or punt, i.e., the length of the kick minus the runback. My own statistics show that on kickoffs, net yardage is in-

KICKOFFS
Average Longest Longest Best Overall Kickoff: Distance: Hang Time: Kick:
0= 63 yds 0= 76 yds 0= 55 yds 0= 73 yds T = 3.8 sec T = 4.0 sec T = 4.6 sec T = 4.4 sec
K (ft- l ) vo 80 vo 80 vo 80 vo 80
0 54 51° 59 48° 56 64° 59 55°
0.001 58 49° 64 46° 60 62° 65 53°
0.002 63 47° 72 44° 65 61° 71 51°
0.003 68 45° 79 42° 70 59° 78 48°
0.004 75 44° 89 40° 75 58° 88 46°
0.005 83 42° 101 38° 82 56° 99 44°
Best Table II. Estimated Launching Parameters - Kickoffs and Punts Estimate Vo = 70 Vo = 80 Vo = 70 Vo = 80 (Continued)
80 = 45° 80 = 42° 80 = 60° 80 = 48° of
Parameters K = 0.003 K = 0.003 K = 0_003 K = 0.003
References
deed maximized by kicking for distance (specifically, by trying to put the ball deep into the end zone). With regard to punts, the statis-tics show a strong correlation between hang time and net yardage - indicating that it is effective to launch steeply-angled punts. Any further considerations, however, are best left to more knowledgea-ble football analysts.
1. H. Rouse, Elementary Mechanics of Fluids (John Wiley & Sons, New York, (1946).
2. P. J. Brancazio, Phys. Teach. 23, 20 (1985). 3. C. Frohlich, Am. J. Physics. 52, 325 (1984). 4. J. Kermond & S. Konz, Res. Q. (AAHPER) 49, 71 (1978). 5. D. I. Miller, Res. Q. (AAHPER) 51, 219 (1980). 6. A. Bartlett, Phys. Teach. 22, 386 (1984). 7. T. R. Sandin, Phys. Tech. 23, 6 (1985).
ACKNOWLEDGEMENT Last month the initials "C. E." appeared in the box on page 371. For those of you who
may have wondered who "C. E." was-she is Carole Escobar, a relic from the Stony-brook days. During this transitional period of time, we do have a few articles which have been carried over.
M.A.H.
THE PHYSICS TEACHER OCTOBER 1985 407