kinematics of drop punt kicking in australian …vuir.vu.edu.au/2026/1/millar.pdf · kinematics of...
TRANSCRIPT

1
KINEMATICS OF DROP PUNT KICKING IN AUSTRALIAN
RULES FOOTBALL – COMPARISON OF SKILLED AND
LESS SKILLED KICKING
By
SAM MILLAR
A Master’s Thesis
Submitted in fulfillment of the requirements for the Award of
Master of Applied Science – Human Movement of the Victoria
University, Department of Human Movement, Recreation and
Performance, Melbourne, Australia
August, 2004
STATEMENT OF RESPONSIBILITY

2
I hereby certify that I am responsible for the work submitted in this thesis, that the original work
is my own except as specified in acknowledgements and that neither the thesis or the original
work contained therein has been submitted to this or any other institution for a higher degree.
Sam Millar
Victoria University
Melbourne, Australia
August, 2004
ACKNOWLEDGEMENT
I would like to thank my supervisors Mr Tim Wrigley and Mr Patrick McLaughlin for their
assistance over the period of my candidature. I must also acknowledge the obliging participation

3
of the subjects who participated in the study. In addition I must thank my wife, family and church
family for enduring this project with me. Thankfully life can now go on.
ABSTRACT
The types of kick that are performed in the football codes fall into two broad categories: punt kick
and place kick. One type of punt kick is the major means of ball movement in Australian Rules
football – the drop punt kick.

4
Past studies have investigated the biomechanics of kicking. The pattern of segmental interaction
during the kicking motion – known as the proximal to distal sequence (PDS) – is the most
consistent finding that is reported in the biomechanics of kicking literature. In this sequence the
proximal segment (thigh) initiates the forward swing of the kicking limb towards the ball and the
forward rotation of the distal segment (shank) follows. PDS motions are also typified by a higher
angular velocity of the distal segment (shank).
Studies that have compared the difference between skilled and less skilled kickers in Australian
Rules football have found that the difference in performance is the result of 1) the position of the
shank at the end of the backswing is higher above horizontal (further in the clockwise direction)
for the skilled than it is for the less skilled, 2) the maximum angular velocity of the thigh during
the forward swing is greater for the skilled than it is for the less skilled and 3) the skilled kickers
demonstrate greater mean maximum angular velocity of the shank at foot – ball contact. Apart
from these findings there is inadequate information about the mechanical features of a skillful
drop punt kick.
The objective of this study was to quantify and compare the kinematics of skilled and less skilled
kicking. A general profile of the drop punt kick and the reliability of the kinematic variables were
also reported.
The reliability study was conducted first. Six subjects were tested on two occasions to establish
the reliability of the equipment and methods. Variables were deemed to be reliable if they
demonstrated an ICC equal or greater than r = 0.80. Of the 95 variables that were analysed 42%
had an ICC greater than r = 0.79 and 25% were classified as having questionable to moderate
reliability because r = 0.50 – 0.79. Only reliable variables were used to compare the skilled and
less skilled groups.
Six elite skilled kickers and six elite less skilled kickers were used in the main study. All subjects
used were AFL players at the time of the data collection. Two-dimensional video footage was
taken of each kick using a high speed camera (200Hz). The camera was positioned so that its
line of sight was perpendicular to the sagittal plane of motion. The video footage of each trial
was processed through the Peak Motus motion analysis system.

5
The start of the kicking motion was identified by the maximum cw angle of the thigh. The time of
foot – ball contact was the end of the motion. There were two phases that were identified during
this time; transition and forward swing. The duration of each was 50% of movement time.
The results of the current study showed that the skilled kickers held the ankle in a more
plantarflexed position than did the less skilled kickers (skilled 46.7 degrees, less skilled 39.21
degrees, r = 0.70, ES = – 1.06, p = .071) at the time of foot – ball contact. This result indicates
that a common trait amongst skilled kickers is the presence of a taut instep at foot – ball contact.
This is one trait of skilled kickers that is often referred to by skills coaches within the AFL.
angle at maximum knee extension angular velocity
Skilled mean
SD
Less skilled mean
SD
ES
p
degrees degrees degrees degrees ankle plantarflexion angle at max knee extension angular velocity
18.0 6.2 30.3 12.3 1.09 0.064**
Table A Comparison of ankle plantarflexion angle at max knee extension angular velocity.
The maximum angular velocity of the shank (1402 degrees/second) was higher than that of the
thigh (805 degrees/second). The mean knee extension angle at foot – ball contact was 50
degrees and the maximum knee extension angle occurred after foot – ball contact (150%
movement time).
There was no difference between groups in the magnitude of the angles or angular velocities (p
> 0.2). There was a difference in the time between the maximum angular velocity of the thigh
and the maximum angular velocity of the shank (p< 0.05). From this result we suggested that
skilled kickers are distinguished from less skilled kickers based on the timing of the critical
events not the magnitude of critical events.

6
TABLE OF CONTENTS
TABLE OF CONTENTS 6
TABLES 12
FIGURES 15

7
1.0 INTRODUCTION 17
1.1 KICKING AS A SPORTING SKILL .................................................................................. 17
1.2 TYPES OF KICKS ...................................................................................................... 17
1.3 GENERAL DESCRIPTION OF THE MOTION ..................................................................... 18
1.3.1 Phases .................................................................................................................. 19
1.3.1.1 Approach ............................................................................................................... 19
1.3.1.2 Backswing ............................................................................................................. 19
1.3.1.3 Transition ............................................................................................................... 20
1.3.1.4 Forward swing ....................................................................................................... 21
1.3.1.5 Follow through ....................................................................................................... 21
1.4 KEY POINTS FOR EFFECTIVE KICKING.......................................................................... 22
1.5 KICKING ANALYSIS BY COACHES ................................................................................ 22
2.0 LITERATURE REVIEW 23
2.1 KINEMATIC PROFILE OF THE KICK ............................................................................... 23
2.1.1 Angular position .................................................................................................. 24
2.1.2 Linear velocity ...................................................................................................... 26
2.1.3 Angular velocity ................................................................................................... 27
2.1.4 Angular acceleration ............................................................................................ 28
2.1.5 Proximal to distal sequence (PDS) ...................................................................... 31
2.1.5.1 Summation of forces………………………………………………………………………33
2.1.5.2 Summation of speed………………………………………………………………………38
2.1.5.3 Currently accepted
theory…………………….……………………………………………40
2.1.6 Kinematic profile of a typical kick - Summary of key kinematic findings .......... 42
2.2 PROFILE OF SKILLED AND LESS SKILLED KICKERS........................................................ 40
2.2.1 Projectile motion in kicking ................................................................................. 41
2.2.2 Kinematic determinants of differences in ball velocity and distance kicked .... 41
8
2.2.3 Kinematic differences between skilled and less skilled kickers in soccer and
American football ................................................................................................. 42
2.2.4 Kinematic differences between skilled and less skilled kickers in Australian
Rules football ....................................................................................................... 44
2.3 OTHER FACTORS IN KICKING SUCCESS ....................................................................... 46
2.3.1 Coordination ........................................................................................................ 47
2.3.2 Training ................................................................................................................ 47
2.3.3 Strength ................................................................................................................ 48
2.3.4 Kicking speed....................................................................................................... 49
2.3.5 Intersubject variation of kicking performance .................................................... 51
2.3.6 Stretch shortening at knee joint .......................................................................... 52
2.4 DECREASED ANGULAR VELOCITY OF THE THIGH .......................................................... 52
2.4.1 Influence of shank on thigh ................................................................................. 53
2.4.2 Influence of thigh on shank ................................................................................. 53
3.0 METHODS 58
3.1 AIMS....................................................................................................................... 55
3.2 SUBJECTS ............................................................................................................... 55
3.3 RELIABILITY ............................................................................................................ 57
3.4 ETHICAL CONSIDERATIONS ........................................................................................ 57
3.5 APPARATUS ............................................................................................................ 57
3.5.1 Calibration ............................................................................................................ 58
3.6 SUBJECT PREPARATION ............................................................................................ 58
3.7 ANGLE DEFINITIONS ................................................................................................. 58
3.8 EXPERIMENTAL PROCEDURE ..................................................................................... 61
3.8.1 Testing protocol ................................................................................................... 62
3.9 DATA PROCESSING................................................................................................... 62
3.9.1 Phase determination ............................................................................................ 63
3.10 DATA ANALYSIS....................................................................................................... 64
3.10.1 Angular Variables................................................................................................. 64

9
3.10.2 Angular velocity variables ................................................................................... 65
3.10.3 Temporal variables .............................................................................................. 66
3.11 STATISTICAL ANALYSIS ............................................................................................ 66
3.11.1 Reliability .............................................................................................................. 66
3.11.2 Between group comparisons .............................................................................. 66
3.11.3 Significance level ................................................................................................. 67
3.11.4 Effect size ............................................................................................................. 67
4.0 RESULTS 68
4.1 GENERAL DESCRIPTION OF KICKING ........................................................................... 68
4.1.1 General profile of the the drop punt kick – phase timings ................................. 68
4.1.2 General profile of the the drop punt kick - angles .............................................. 69
4.1.3 General profile of the the drop punt kick – angular velocity .............................. 70
4.2.4 Timing of key events ............................................................................................ 73
4.2 RELIABILITY ............................................................................................................ 74
4.2.1 Reliability – angles ............................................................................................... 74
4.2.2 Reliability – angular velocity ............................................................................... 76
4.2.3 Reliability – phase timings .................................................................................. 78
4.2.4 Reliability – resultant foot velocity at contact .................................................... 78
Reliability – movement time between selected key events ................................................. 80
4.2.5.1 Movement time between the time of maximum knee flexion angle and the maximum
shank cw angle ...................................................................................................... 80
4.2.5.2 Movement time between the time of maximum thigh cw angular velocity and
maximum knee flexion angle .................................................................................. 81
4.2.6 Reliability – summary of reliability of key events ............................................... 81
4.2.7 Reliability - list of reliable variables (r > 0.80) ..................................................... 82
4.2.8 Reliability - list of reliable variables (r > 0.50) ..................................................... 83
4.3 COMPARISON OF SKILLED AND LESS SKILLED .............................................................. 84
4.3.1 Resultant linear foot velocity at foot – ball contact ............................................ 84
4.3.2 Comparison of skilled and less skilled – Angles ................................................ 85

10
4.3.2.1 Maximum angles .................................................................................................... 85
4.3.2.2 Angles at the end of the transition .......................................................................... 86
4.3.2.3 Angles at foot – ball contact ................................................................................... 86
4.3.2.4 Range of motion (ROM) ......................................................................................... 87
4.3.2.5 Knee extension angle at maximum knee extension angular velocity ....................... 87
4.3.3 Comparison of skilled and less skilled - Angular velocity ................................. 88
4.3.3.1 Timing of the maximum angular velocity ................................................................. 90
4.3.3.2 Maximum angular velocity during the phases ......................................................... 91
4.3.3.3 Angular velocity at foot – ball contact for the skilled and less skilled groups ............ 91
4.3.4 Movement time between key events ................................................................... 92
4.3.4.1 Movement time between maximum ccw thigh angular velocity and maximum knee
flexion angle........................................................................................................... 94
4.3.4.2 Movement time between maximum shank cw angle and maximum knee flexion angle
95
4.3.5 Phase timings....................................................................................................... 95
4.3.6 Timing of key selected events ............................................................................. 96
4.3.7 Comparison of skilled and less skilled for the variables with r > 0.50 .............. 97
5.0 DISCUSSION 99
5.1 KICKING IN SOCCER, AMERICAN FOOTBALL AND AUSTRALIAN RULES: SIMILARITIES AND
DIFFERENCES .......................................................................................................... 99
5.1.1 Common kinematic patterns ............................................................................. 100
5.1.1.1 Increase in shank angular velocity and decrease in thigh angular velocity during the
forward swing ....................................................................................................... 100
5.1.1.2 Time of maximum ccw thigh angular velocity in relation to maximum knee flexion
angle.................................................................................................................... 101
5.1.1.3 Maximum knee flexion occurred after maximum cw rotation of the shank.............. 102
5.1.2 Variables that differentiate types of kicks......................................................... 103
5.1.2.1 Resultant foot velocity at foot – ball contact .......................................................... 103
5.1.2.2 Knee angle at foot – ball contact .......................................................................... 104

11
5.1.3 Magnitude of angular velocity ........................................................................... 105
5.2 RELIABILITY .......................................................................................................... 108
5.3 VARIABLES THAT DIFFERENTIATED THE SKILLED AND LESS SKILLED ............................ 108
5.3.1 Movement time from maximum ccw thigh angular velocity to maximum ccw
shank angular velocity ....................................................................................... 108
5.3.2 Resultant foot velocity at foot – ball contact .................................................... 110
5.3.3 Foot rigidity ........................................................................................................ 110
5.3.4 Movement time from maximum ccw thigh angular velocity to maximum knee
flexion angle ....................................................................................................... 111
5.3.5 Angles ................................................................................................................ 112
5.3.6 Angles at contact ............................................................................................... 112
5.3.7 Angular velocity ................................................................................................. 113
5.4 SUMMARY ............................................................................................................. 116
5.4.1 General description of kicking .......................................................................... 116
5.4.2 Comparison of skilled and less skilled ............................................................. 116
5.5 LIMITATIONS .......................................................................................................... 117
5.5.1 Reliability ............................................................................................................ 118
5.6 FUTURE STUDIES.................................................................................................... 118
5.6.1 Phases ................................................................................................................ 118
5.6.2 Reliability ............................................................................................................ 119
5.6.3 Measures of kicking success ............................................................................ 119
5.6.4 Impact dynamics ................................................................................................ 120
5.6.5 Coaching ............................................................................................................ 120
5.7 IMPLICATIONS FOR COACHING ................................................................................. 121
5.8 CONCLUSION ......................................................................................................... 121
6.0 REFERENCES 122
APPENDICES 129
12
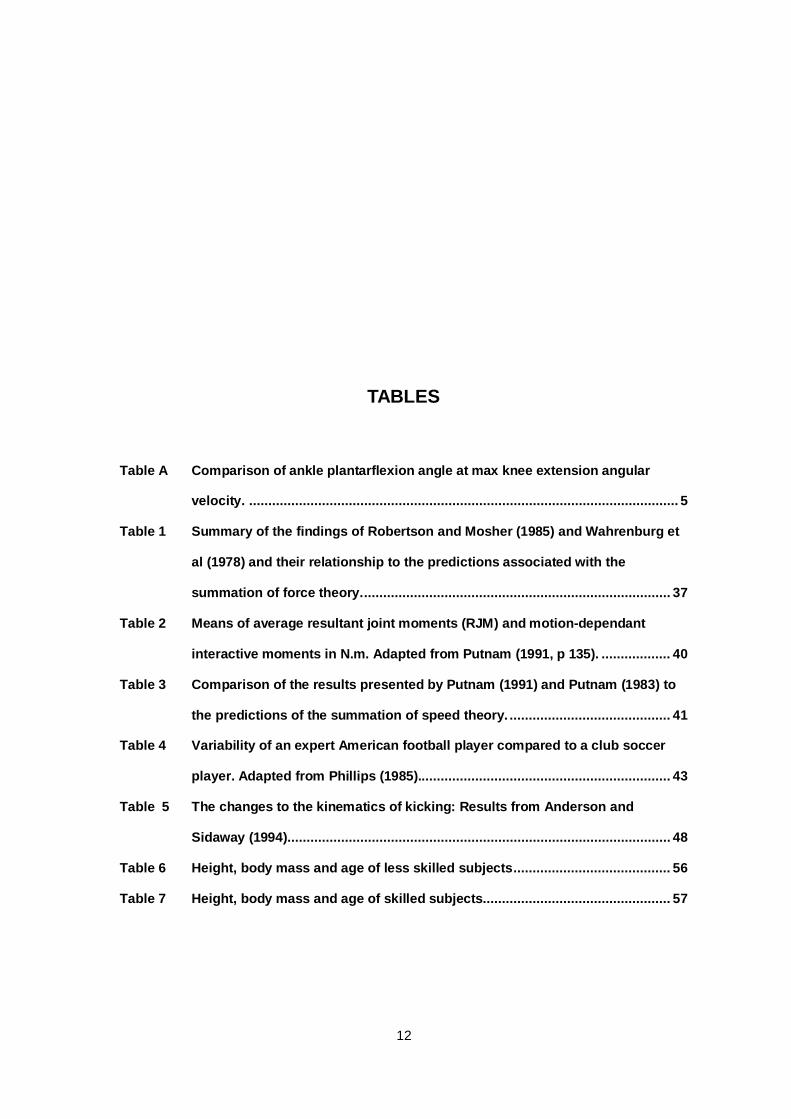
TABLES
Table A Comparison of ankle plantarflexion angle at max knee extension angular
velocity. ................................................................................................................ 5
Table 1 Summary of the findings of Robertson and Mosher (1985) and Wahrenburg et
al (1978) and their relationship to the predictions associated with the
summation of force theory. ................................................................................ 37
Table 2 Means of average resultant joint moments (RJM) and motion-dependant
interactive moments in N.m. Adapted from Putnam (1991, p 135). .................. 40
Table 3 Comparison of the results presented by Putnam (1991) and Putnam (1983) to
the predictions of the summation of speed theory. .......................................... 41
Table 4 Variability of an expert American football player compared to a club soccer
player. Adapted from Phillips (1985).................................................................. 43
Table 5 The changes to the kinematics of kicking: Results from Anderson and
Sidaway (1994). ................................................................................................... 48
Table 6 Height, body mass and age of less skilled subjects ......................................... 56
Table 7 Height, body mass and age of skilled subjects................................................. 57

13
Table 7A Mean, Standard deviation and t values of Height, body mass and age of skilled
and less skilled
subjects………………………………………………………………..58
Table 8 List markers and exact placement ..................................................................... 58
Table 9 Phase definitions ................................................................................................ 64
Table 10 List of angular variables ..................................................................................... 65
Table 11 List of angular velocity variables ....................................................................... 65
Table 12 List of temporal variables................................................................................... 66
Table 13 Reliability of the angular variables (magnitude). .............................................. 75
Table 14 Reliability of the angular variables (temporal). ................................................. 76
Table 15 Reliability of the angular velocity variables (magnitude).................................. 77
Table 16 Reliability of the angular velocity variables (temporal). ................................... 78
Table 17 Reliability of phase timing variables.................................................................. 78
Table 18 Reliability of resultant foot velocity at foot – ball contact. ............................... 78
Table 19 Reliability of the time between selected key events. ........................................ 80
Table 20 Reliability of the movement time between the time of maximum knee flexion
angle and the maximum shank cw angle. ......................................................... 81
Table 21 Reliability of the movement time between the time of maximum thigh ccw
angular velocity and maximum knee flexion angle. .......................................... 81
Table 22 Reliability of the timing of key events. .............................................................. 82
Table 23 Summary of variables that are reliable (r > 0.80)............................................... 83
Table 24 Summary of variables that are reliable (r > 0.50)............................................... 84
Table 25 Resultant linear foot velocity at foot – ball contact comparisons. ................... 85
Table 26 Comparisons of the maximum angular positions. ............................................ 85
Table 27 Timing of maximum angles. ............................................................................... 86
Table 28 Angles at the end of the transition. ................................................................... 86
Table 29 Angles at contact of the skilled and less skilled groups. ................................. 87
Table 30 ROM data of the skilled and less skilled groups. .............................................. 87
Table 31 Ankle plantarflexion angle at maximum knee extension angular velocity data
for the skilled and less skilled groups. .............................................................. 88

14
Table 32 Maximum angular velocity data for the skilled an less skilled groups. ........... 89
Table 33 Timing of maximum ccw thigh angular velocity for the skilled and less skilled
groups
......................................................................................................................... 91
Table 35 Angular velocities at contact for the skilled and less skilled groups. ............. 92
Table 36 Movement time between key events for the skilled and the less skilled groups.
92
Table 38 Movement time between maximum cw shank angle and maximum knee flexion
angle for the skilled and the less skilled groups. ............................................. 95
Table 39 Phase timings of the skilled and less skilled groups........................................ 96
Table 40 Comparison of skilled and less skilled for the variables with r > 0.50 ............. 99

15
FIGURES
Figure 1 The kicking motion................................................................................................ 18
Figure 2 Position of the body at the end of the approach..................................................... 19
Figure 3 Body position at the end of the backswing ............................................................ 19
Figure 4 Body position at the end of the transition............................................................... 20
Figure 5 Knee flexion position at the end of the forward swing (foot - ball contact) .............. 21
Figure 6 Body position at the end of the follow through ....................................................... 21
Figure 7 Angular velocity of the proximal and distal segments during the kicking motion. .... 24
Figure 8 Position of the thigh, knee and shank at foot – ball contact of a punt kick in
American football. From Phillips (1985). ................................................................ 25
Figure 9 Knee flexion angle at foot - ball contact during different kicking sports................... 26
Figure 10 The relationship between thigh angular acceleration shank angular acceleration,
shank angular velocity and thigh angular velocity for the American football punt
kick.. ..................................................................................................................... 29
Figure 11 The relationship between joint moments, knee and hip and angular velocity knee,
hip as depicted by Robertson and Mosher. Adapted from Robertson and Mosher
(1985, p. 536). ...................................................................................................... 35
Figure 12 Projectile motion in kicking .................................................................................... 41
Figure 13 Position of the limb at the end of the backswing for long and short distance kickers.
From the results of Baker and Ball (1993). ............................................................ 45
Figure 14 Angular velocity-time curves for slow, medium and fast kicking speeds. Adapted
from Dunn and Putnam. ........................................................................................ 51
Figure 15 Knee angle definition. ........................................................................................... 59
Figure 16 Ankle angle definition........................................................................................... 59

16
Figure 17 Thigh angle definition........................................................................................... 60
Figure 18 Shank angle definition. ......................................................................................... 61
Figure 19 Foot angle definition ............................................................................................. 61
Figure 20 Diagram of kinematic set - up ............................................................................... 62
Figure 21 Timing of phases .................................................................................................. 69
Figure 22 Mean angular displacement data for all subjects. .................................................. 69
Figure 23 Mean angular velocity data for all subjects. ........................................................... 71
Figure 24 Timing of key selected events in the drop punt kick. .............................................. 73
Figure 25 Distribution of scores - resultant foot velocity at contact for all subjects. ................ 79
Figure 26 Mean foot angular velocity data for skilled and less skilled. ................................... 88
Figure 27 Mean thigh angular velocity curves for the skilled and less skilled groups.. ............ 90
Figure 28 Movement time between the maximum ccw angular velocity of the thigh and the
shank for the skilled and less skilled groups. ......................................................... 93
Figure 29 Mean shank angular velocity and thigh angular velocity curves for the skilled and
less skilled groups. ............................................................................................... 94
Figure 30 Phase duration of the skilled and less skilled groups ............................................. 96
Figure 31 Timing of key selected events for the skilled and less skilled groups ..................... 97
Figure 32 The increased angular velocity of the shank and decreased angular velocity of the
thigh during the forward swing.. .......................................................................... 101
Figure 33 Mean angular displacement curves of the knee angle and thigh angular velocity . 102
Figure 34 Resultant foot velocity at foot – ball contact results of soccer, American football and
Australian Rules ................................................................................................. 104
Figure 35 Knee extension angle at foot – ball contact obtained by various researchers . .... 105
Figure 36 Comparison of shank angular velocity for 3 types of kick. .................................... 109
Figure 37 Comparison of thigh angular velocity for 3 types of kick. ..................................... 109
Figure 38 Relative timing of the maximum angular velocity of the thigh and shank. ............. 109
Figure 39 Foot angular velocity curves of a skilled and less skilled subject.......................... 115

17
1.0 INTRODUCTION
Football is the most popular game in the world. Whilst sports science is impacting on player
conditioning, coaching, media coverage and game development, the use of biomechanics as a
tool for the coach and player is not common. Drop punt kicking, the major skill of Australian
Rules football, is the focus of the current review and investigation. The specific objective of this
thesis is to quantify and compare the kinematics of skilled and less skilled kicking.
Before discussing the details of the methodology and the results of this study it is important to
provide a description of the kinematics of kicking and a summary of the current understanding of
what differentiates skilled from less skilled kickers.
1.1 Kicking as a sporting skill
The kicking movement is used in many sports and the football codes. Kicking is the major
means of ball movement in Australian rules, Gaelic football and soccer. In contrast, Rugby
Union, Rugby League and American football rely more on the ball being moved through the use
of hand skills such as throwing.
1.2 Types of kicks
The kicking action varies from one football code to another (McCrudden and Reilly, 1993). The
type of ball that is used, the rules and tactical objectives differ between codes. The kicks
performed in the football codes fall into two broad categories: punt kicks and place kicks. Punt
kicks are dropped to the foot from the hands and place kicks occur when the ball is kicked off the
ground. Punt kicks are used in Australian Rules football.
The drop punt kick is the Australian version of the punt kick. It is characterised by the
longitudinal axis of the ball spinning back on itself as it moves forward through the air. It is
typically regarded as the most accurate type of kick in Australian Rules football. It is used in
kicking for goal and passing the ball.

18
1.3 General description of the motion
Drop punt kicking is a complex movement that involves all the limbs of the body. The arms play
a part in the drop of the ball and assist in balancing the rest of the body. The muscles of the
trunk provide stability for the pelvis as the limbs rotate. The support leg is the weight bearing leg.
Each kick has an approach, backswing, forward swing and a follow through. Some descriptions
of the kick refer to an additional phase known as the transition or the wind up phase. This is the
phase in between the end of the backswing and the commencement of the forward swing. The
body position at the end of each phase is shown in figure 1 below.
Figure 1 The kicking motion in Australian Rules Football.

19
1.3.1 Phases
1.3.1.1 Approach
Figure 2 Position of the body at the end of the approach
The kick is preceded by a walking or running approach. Hence, there is no definitive starting
point of the kicking motion. For the purpose of this thesis the approach commences when the
foot of the support leg leaves the ground to begin the final step.
1.3.1.2 Backswing
Figure 3 Body position at the end of the backswing
The backswing commences when the knee begins to flex and ends when the thigh begins to
rotate forward (in a counter-clockwise direction for a right foot kick). The backswing prepares the

20
kicking limb for rotation towards the ball. As the heel of the support leg contacts the ground the
knee of the kicking leg is in a slightly flexed position. The support hand (hand opposite to the
kicking side) is removed from the ball and the lumbar spine is slightly hyperextended at this time.
The start of the forward rotation of the thigh marks the end of the backswing.
1.3.1.3 Transition
Figure 4 Body position at the end of the transition
The transition begins when the thigh starts to rotate counter-clockwise towards the ball and ends
when the shank begins to rotate counter clockwise (ccw). During this phase the knee continues
to flex. Orchard et al. (1999) called this phase the wind up.

21
1.3.1.4 Forward swing
Figure 5 Knee flexion position at the end of the forward swing (foot - ball contact)
The present discussion will use the start of the ccw rotation of the shank to define the start of the
forward swing. During the forward swing the ankle is plantarflexed and the foot and the knee is
extending. Foot – ball contact occurs when the knee is positioned at between 30 and 50 degrees
of flexion. The forward swing ends at the time of foot - ball contact.
1.3.1.5 Follow through
Figure 6 Body position at the end of the follow through

22
The follow through begins after foot - ball contact. The thigh and the shank continue to rotate
counter-clockwise after foot – ball contact. The follow through is completed when the knee starts
to flex.
1.4 Key points for effective kicking
The most recent coaching literature such as Parkin et al. (1987) and Wheadon (1997) attribute
kicking success to some basic movement characteristics.
• The path of the foot should come through in a straight line in the direction of the kick.
• A long backswing (position of hip extension and maximum knee flexion).
• An upright body position during the kick.
• A taut instep. The ankle should be fixed in a position of plantarflexion so that the ball will
contact the bony surface of the foot.
• Watching the ball all the way onto the foot.
• Holding the ball straight as it is released from the hands.
• Foot - ball contact should not be too high off the ground.
The coaching points that are listed above are all derived from subjective evidence. Clearly, there
is scope for a more precise definition of what constitutes a successful kick.
1.5 Kicking analysis by coaches
Parallel with the evolution of each football code has come an increased demand for skillful
execution of the kick. However, there are very few coaching devices used for skill assessment
within Australian Rules football. Due to the lack of biomechanical data available, the mechanical
determinants of the kick are neglected in subjective approaches to coaching. Technique analysis
is primarily performed by the naked eye. The only measures of performance that exist are
distance and accuracy. The complexity of the motion and the speed at which it is performed
necessitate more objective measures of success.

23
2.0 LITERATURE REVIEW
An understanding of the fundamental biomechanics associated with the kicking motion is an
important pre-requisite for the comparison of skilled and less skilled kickers. There are some
common patterns that exist in all the variations of the kick. This review is not limited to findings
in the literature that pertain only to the drop punt in Australian Rules football.
2.1 Kinematic profile of the kick
Prior to making comparisons between skilled and less skilled kickers it is important to consider
the general kinematics of the kicking motion. The kinematics of the rotating segments during the
kick can be described in terms of the magnitude and timing of angular positions, displacements,
angular velocities and angular accelerations. The kick has also been described in terms of linear
motion.
Research into the biomechanics of kicking has been dominated by investigating the motion of
the kicking limb. More specifically, research has focused on the kinematics of the forward swing.
The kicking limb is not a single unit, rather a series of linked segments - thigh, shank and foot.
The nature of this system means that the segments do not work in isolation. They combine in a
series of segmental interactions that enable the required velocity of the striking mass to be
attained (Putnam, 1991).
The velocity at the distal end of the limb is attained through a typical pattern of segmental
interaction referred to as the proximal to distal sequence (PDS) (Putnam, 1993). In this
sequence the proximal segment typically initiates the forward swing and the forward rotation of
the distal segment follows. The timing of forward rotation is such that the proximal segment has
already reached its maximum angular velocity and has begun to slow down well before the most
distal segment attains maximal angular velocity (Putnam, 1991). The angular velocity of the
distal segment is greater than that of the proximal segment (figure 7). This pattern has been
consistently shown - although mainly in American football - in several studies using different
subjects kicking at various intensities (Putnam, 1983, 1991, 1993; Dunn and Putnam, 1987a).

24
Figure 7 Angular velocity of the proximal (thigh ▲) and distal (shank ■) segments during the kicking motion. 0%
time represents the start of the forward motion of the thigh, 100% represents foot – ball contact. Adapted
from Putnam (1991, p.134).
2.1.1 Angular position
The angular position of the segments is important throughout the movement because it reflects
the timing of joint and segmental actions (Putnam, 1991). The data presented in the literature
has primarily focused on the angular position of segments at, or just prior to, foot–ball contact
(Phillips, 1985; Baker and Ball, 1993; Brown et al. 1993; Orchard et al. 1999).
Angular position at foot – ball contact
Phillips (1985) found that the knee was not fully extended at foot - ball contact in soccer and
American football kicking. The knee angle was 38 degrees (SD=2.96 degrees) of flexion at foot -
ball contact. The results of the American football player showed that the mean thigh angle was
55 degrees (SD=1.32 degrees) and the shank was 87 degrees (SD=1.87) just prior to foot - ball
contact (Figure 8). A more detailed outline of Phillips’ study is presented in section 2.1.3.
-1500
-1000
-500
0
500
1000
1500
2000
2500
0 25 50 75 100
Percent time
Ang
ular
vel
ocity
(deg
rees
/sec
)

25
Figure 8 Position of the thigh, knee and shank at foot – ball contact of a punt kick in American football. From
Phillips (1985).
Brown et al. (1993) measured the three dimensional kinematics of place kicking in soccer. The
following joint angles at contact were reported: knee 42.5 degrees of knee flexion (SD=9.0
degrees) and 51 degrees of hip flexion (SD=10.2 degrees). The results of these studies (Phillips,
1985; Brown et al. 1993; Baker and Ball, 1993) demonstrated that the knee angle at foot - ball
contact for kicks performed in soccer (42.5 – 48.2 degrees), Australian Rules (30-50 degrees)
and American football (38 degrees).
Traditional Australian Rules coaching literature suggests that the leg must be straight (knee
angle must be close to 0 degrees) at foot–ball contact (Parkin et al. 1987). However, the findings
of Baker and Ball (1993) and Orchard et al. (1999, 2003) confirm that the knee is not fully
extended at the time of foot–ball contact in drop punt kicking: the knee flexion angle was shown
to be 30 degrees (mean) of flexion by Baker and Ball (1993) and approximately 50 degrees of
flexion by Orchard et al. (1999). Both studies concluded that the knee continues to extend after
foot - ball contact.
Thigh
Shank
Knee

26
The results of these studies that have measured knee angle at contact are compared in figure 9
(below).
Figure 9 Knee flexion angle at foot - ball contact during different kicking sports (* American
Football, ** Australian Rules, *** soccer).
2.1.2 Linear velocity
Linear velocity of the joints and segments has been used in studies to predict kicking success,
compare the distance of kicks in Australian Rules football (Baker and Ball, 1993), categorise
kicking speed in soccer (Dunn and Putnam, 1987a) and compare the effectiveness of approach
angles (Isokawa and Lees, 1988) and run - ups in soccer (Opavsky, 1988).
Linear velocity of the foot is the most common measure. The results obtained for foot velocity
range from 15.5 metres/second in Australian Rules football (Baker and Ball, 1993) to 18.32
metres/second in soccer (Opavsky, 1988) to 26.5 metres/second in American football
(Plagenhoef, 1971). These results are inclusive of kicks performed in rugby, soccer, American
football and Australian Rules football.
0 10 20 30 40 50 60
Baker & Ball (1993)**
Orchard et al. (1999)**
Philips (1985)*
Brow n et al.(1993)***
Knee Angle at foot - ball contact (degrees)

27
Plagenhoef (1971) measured the linear velocity of the foot in various forms of soccer kick and
the American football punt kick. The American football side approach kick showed the highest
mean ball velocity (31.5 metres/second). This kick was also accompanied by the highest foot
velocity just prior to impact (26.5 metres/second). Plagenhoef concluded that placement of the
ball on the foot is more important than foot velocity in relation to attaining maximum ball velocity.
Baker and Ball (1993) measured peak velocities of the toe (15.38 – 18.32 metres/second), ankle
(10.77 – 13.07 metres/second), knee (4.11 – 7.36 metres/second) and hip (1.48 – 3.13
metres/second). Putnam and Dunn (1987) found that the mean ankle velocity during a punt kick
was 18.2 metres/second. Opavsky (1988) indicated that the maximum linear velocity for the
thigh and shank were 4 metres/second and 8 metres/second respectively. He also added that
the maximum value for the thigh (20 – 25 ms prior to contact) occurs prior to that of the shank
(10 ms prior to contact). The maximum velocity of the foot occurred closest to contact (5 ms prior
to contact).
2.1.3 Angular velocity
Angular velocity has been used to analyse the PDS and to predict the linear foot velocity and the
success of the kick. Angular velocity of the distal segments (shank and foot) has been shown by
some investigators to be the primary determinant of the flight (distance) of the ball (Macmillan,
1975, 1976).
Segment angular velocity
Putnam (1983) examined the relationship of the thigh and shank in American football punt
kicking. Only the forward swing was measured. Eighteen subjects were filmed in the sagittal
plane with a camera set at 300 frames/second. The results showed that maximum thigh angular
velocity occurred before maximum shank angular velocity. The maximum mean angular velocity
of the thigh was 1089 degrees/second occurred 72 ms prior to contact. Mean maximum shank
angular velocity of 2292 degrees/second occurred at foot – ball contact (standard deviations
were not reported). Baker and Ball (1993) found that the maximum angular velocity of the shank
(1554 degrees/second) was also greater than the thigh (973 degrees/second) in Australian
Rules drop punt kicking. The timing of these maximum values was not reported. Opavsky (1988)

28
reported maximum foot angular velocity 1074 degrees/second. This occurred 9 ms (mean) prior
to contact.
Wickstrom (1975) suggested that the thigh is almost stationary at foot - ball contact. Subsequent
studies have revealed that the thigh is rotating at this time. However, the angular velocity at
which it rotates is far less than that of the shank. Aitcheson and Lees (1983) demonstrated that
the thigh angular velocity at impact in a soccer kick ranged between 150 – 247 degrees/second.
Day (1987) reported thigh angular velocities up to 317 degrees/second and Macmillan (1976)
reported a mean thigh angular velocity of 302 degrees/second at foot - ball contact. The results
obtained by Putnam (1991) indicated that the maximum angular velocity of the thigh occurred at
approximately 60% (68 – 76 ms prior to foot – ball contact) of swing time. These results are
depicted in figure 7. The peak angular velocity of the shank coincided with 100% of swing time,
at foot - ball contact. Total swing time was defined by the start of forward thigh rotation and foot -
ball contact. The duration of the swing times ranged from 170 – 190 ms.
Joint angular velocity
The maximum knee extension angular velocities that are reported in the literature are quite
diverse. Robertson and Mosher (1985) measured the hip angular velocity of seven members of
an Olympic soccer team who performed soccer kicks with a stationary ball. The authors found
that maximum hip flexion angular velocity was 688 degrees/second. This occurred 50 ms prior to
foot – ball contact. Maximum knee extension angular velocity was 1089 degrees/second and
occurred at foot – ball contact. Putnam (1983) reported a mean angular velocity of 2148
degrees/second in American football punt kicking. Macmillan (1975) found maximum knee
extension angular velocity ranged from 1532 to 2008 degrees/second in Australian Rules
football.
2.1.4 Angular acceleration
Segment angular accelerations
Angular acceleration of the shank is much greater than that of the thigh. Maximum angular
acceleration of the shank (e.g. 34380 degrees/second2 in Putnam (1983) for an American

29
football punt kick) occurs during the initial stages of the forward rotation. The maximum thigh
angular acceleration (e.g. 14898 degrees/second2) occurs just prior to the completion of the
backswing with a maximum deceleration for the punt kick (e.g. 17184 degrees/second2)
occurring at 40 ms prior to contact (Putnam, 1983). An example of angular acceleration of the
segments can be seen in figure 10.
Figure 10 The relationship between thigh angular acceleration (- - - -), shank angular acceleration (- -▲- -), shank
angular velocity (---▲---) and thigh angular velocity (--------) for the American football punt kick. Zero time
represents foot – ball contact, -.18 second represents the start of the forward swing. Adapted from
Putnam (1983, p.690).
2.1.5 Proximal to distal sequence (PDS)
The PDS was introduced in section 2.1. The PDS has been demonstrated in the literature by
numerous authors across a variety of sporting motions including the volleyball serve, kicking in
judo and the football codes, the tennis serve and the golf swing (Milburn, 1982; Putnam, 1983;
-1600
-1200
-800
-400
0
400
800
1200
1600
2000
2400
2800
-80000
-60000
-40000
-20000
0
20000
40000
60000
80000
100000
120000
140000
-0.18 -0.144 -0.072 0
Ang
ular
vel
ocity
(deg
rees
/sec
)
Ang
ular
acc
eler
atio
n (d
egre
es/s
ec 2
)
Time (sec)
30
Robertson and Mosher, 1985; Luhtanen, 1987; Putnam and Dunn, 1987; Dunn and Putnam,
1987a; Elliott et al. 1989; Putnam, 1991). There has been no research conducted on the PDS in
Australian Rules kicking. The outcome of research that has investigated the mechanism of the
PDS is presented in the forthcoming paragraphs.
There has been some debate in regard to the mechanism by which this sequence occurs. Two
theories have been proposed that are mutually exclusive. Both acknowledge the PDS but differ
in their explanation of how velocity is attained at the distal end of the distal segment. The two
theories suggest that the greater angular velocity of the distal segment (shank in the case of
kicking) is 1) a product of the force that is generated from proximal to distal (summation of force
theory) or 2) a product of the speed that is generated from proximal to distal (summation of
speed theory).
The summation of force theory was first proposed by Dyson (1977). The theory suggests that
distal segment end velocity is attained by a precisely timed series of muscle contractions.
Hence, the rotation of each segment within the system is a result of muscle force acting directly
on that segment (Wahrenburg et al. 1978; Putnam, 1991).
The summation of speed theory was first proposed by Bunn (1972). The theory is based on the
notion that the speed at the distal end of the linked system is generated by summing the
individual speeds of all segments participating in the sequence (Bunn, 1972; Putnam, 1991).
The rotations of the segment are timed to maximise the increase of speed from proximal to
distal. The summation of speed is attained when each segment’s motion is started at the point of
greatest angular velocity of the preceding segment.
Key features of summation of force theory (in relation to kicking)
Maximum angular velocities are reached in sequence (PDS).
The rotation of each segment is a result of the muscle force acting directly on that segment.
Angular velocity of the shank is the result of the force generated by the knee extensor
muscles (agonist muscles).

31
Transition from knee flexion to extension is accompanied by peak knee extensor activity.
Knee extensors are dominant at the knee joint just prior to contact.
Key features of summation of speed theory (in relation to kicking)
Maximum angular velocities are reached in sequence (PDS).
The rotation of the shank is influenced by the angular velocity of the thigh.
The distal segment (shank) starts its motion at the moment of greatest angular velocity of the
proximal segment (thigh).
Angular velocity of the shank is dependent on the orientations of each segment (in relation to
the other segments and gravity), timing of segmental rotations and knee fixation.
The decreased thigh angular velocity during the forward swing is the result of the angular
acceleration of the shank, not the activation of the hip extensors.
2.1.5.1 Summation of force
Robertson and Mosher (1985) and Wahrenburg et al. (1978) both investigated the theory using
the place kick in soccer. The methodologies and results differed.
Robertson and Mosher (1985) used national soccer team representatives as subjects. A soccer
place kick was filmed in the sagittal plane by one stationary camera at 100 frames/second. The
authors calculated net forces and moments of force, which were used in conjunction with joint
angular velocity to calculate power. Positive and negative work was then calculated using the
integration of power over time. Positive work was classified as concentric muscle action and
negative work was indicative of eccentric muscle action.

32
Figure 11 The relationship between joint moments, [knee (- -■- -) and hip (- -- -)] and angular velocity knee [(—
■—), hip (——)]. Zero on the x axis represents foot – ball contact and -0.12 seconds represents the
start of the forward swing. Adapted from Robertson and Mosher (1985, p. 536).
The results indicated that during the majority of the forward swing there was a hip flexor moment
and positive power (maximum power 1750 watts, maximum moment 225 N.m). From this power
data Robertson and Mosher concluded that the hip flexor muscles were acting concentrically to
swing the foot towards the ball and then just prior to foot - ball contact the hip extensors were
acting eccentrically. The velocity of the hip joint at the time just prior to foot – ball contact was
reduced as a result.
There was a net knee extensor moment during the majority of the forward swing. Just prior to
foot – ball contact (0.05 seconds prior) the net moment changed from knee extension to knee
flexion.
-80
-40
0
40
80
120
160
200
240
-400
-200
0
200
400
600
800
1000
1200
-0.12 -0.09 -0.06 -0.03 0
Net
join
t mom
ent (
N.m
)
Ang
ular
vel
ocity
(deg
rees
/sec
)
Time (seconds)

33
In summary, Robertson and Mosher (1985) found that the Knee extensor moments were
dominant during the backswing, hip flexion moment was dominant during the forward swing, the
hip extensor moment became dominant (compared to hip flexors) just prior to foot - ball contact
and the knee flexor moment acted eccentrically to decelerate the shank just prior to foot - ball
contact.
The results of Robertson and Mosher supported some of the predictions of the summation of
force theory. Some of the criteria for the summation of force theory were not supported. Table 3
provides a summary of how the results presented by Robertson and Mosher supported the
theory.
Wahrenburg et al. (1978) used six less skilled subjects. Soccer kicks were performed using a
normal soccer ball (A), a heavy ball (3Kg) (B) and a ball that was fixed to a wall (C). Knee
muscular moments were measured and the kicks were filmed using one camera in the sagittal
plane at 64 frames/second. EMG activity of the rectus femoris, biceps femoris and
gastrocnemius was recorded.
The combined results of all three kick types (A, B and C) indicated that the rectus femoris were
activated very early in the movement. Peak rectus femoris activity and maximum knee extensor
moment (mean = 151 Nm, range = 50 – 260 Nm) coincided with the transition from knee flexion
to extension (.06 seconds prior to foot – ball contact). However, when the ball was struck, the
biceps femoris (antagonists) were highly active.
Wahrenburg et al. (1978) found that the peak rectus femoris activity coincided with maximum
knee extensor moment, the maximum knee extensor moment occured early in the sequence
(.06 seconds prior to foot – ball contact), peak rectus femoris activity coincided with transition
from knee flexion to extension and there was a knee flexor muscular mo
ment at the time of foot – ball contact.

34
The prediction of the summation of force theory
Results that support the prediction Results that do not support the prediction
The rotation of a segment is the result of the muscular force that is acting directly on that segment.
(R & M) Met this criteria for the motion at the hip only. The hip flexor muscles dominated whilst the hip was flexing and the hip extensor muscles were dominant during hip extension and thigh deceleration.
The dominance of agonist muscle activity
(W) The activity of the rectus femoris (agonist) was more closely associated with maximum muscular moment than any other muscle group during the forward swing. In this instance the rectus femoris is the agonist during the forward swing. Hence, the knee extensor muscles act concentrically to rotate the shank forward towards the ball.
The knee extensor muscles are active during the forward swing, just prior to contact.
(R & M) The knee flexor moment was dominant at this time.
(W) The biceps femoris activity was dominant prior to foot – ball contact.
Table 1 Summary of the findings of Robertson and Mosher (1985) (R&M) and Wahrenburg et al (1978) (W) and
their relationship to the predictions associated with the summation of force theory.
The findings of Wahrenburg et al. (1978) may be more of a reflection of the methodology than a
representation of the typical movement patterns associated with kicking. Both kicks B and C are
different to normal kicking technique. The extra force needed to move the heavy ball from the
ground (kick B) could have resulted in atypical muscle moments being measured. The
occurrence of peak rectus femoris EMG activity (mean for kicks A, B and C combined) at the
beginning of knee extension may have been a result of the subjects kicking harder than normal
to try to move the heavier ball. The third task - kicking a ball that was fixed to a wall (kick C) - is
also vastly different to a normal kicking motion that is accompanied by a follow through.
The use of EMG data enabled Wahrenburg et al. to demonstrate which muscle groups were
associated with the net joint moments and provide clear explanation of muscle activity patterns
in relation to concentric and eccentric muscle actions.
However, De Proft et al. (1988) showed that less skilled subjects demonstrate a greater amount
of agonist activity than skilled subjects in kicking a soccer ball. All the subjects used by

35
Wahrenburg et al. (1978) were less skilled. This possibly created a bias towards the dominance
of agonist activity. Their support of the summation of force theory is based on the dominance of
agonist activity during the forward swing. If there was a bias towards agonist activity with the
subjects then they were more likely to have shown summation of force. Therefore the findings of
Wahrenburg et al. (1978) should probably not be used to make general conclusions about a
common pattern of muscle activation in skilled kicking.
The subjects used by Robertson and Mosher performed soccer place kicks with a natural kicking
action. This is preferred because it is more specific to the actual kick that is performed in a game
situation.
Neither of these studies have presented data that clearly supports the summation of force
theory. The results of the two studies were similar. Both studies indicated that the start of the
knee extensor moment is accompanied by concentric activity of the knee extensor muscles. This
finding supports the summation of force theory. But both also found that the antagonist knee
flexor muscles are dominant in the lead up to foot – ball contact. This finding is contrary to one of
the predictions of summation of force theory that the angular velocity of the shank should be the
result of the force generated by the knee extensor muscles. Evidence in support of summation of
force theory would have shown that the agonist muscles dominate prior to foot - ball contact.
Robertson and Mosher made many conclusions about the nature of muscle action. They said
that the knee extensors are the dominant muscles during the backswing and the forward swing.
These conclusions were based on net joint moment data. It is not accurate enough to make
conclusions about individual muscle actions based on the measurement of net joint moment
alone. They did not measure the activity of the various knee extensor muscles so they cannot
conclude that the quadriceps femoris was the dominant muscle at this stage of the movement.
2.1.5.2 Summation of speed
Putnam (1983, 1991, 1993) and Dunn and Putnam (1987) are the only researchers to
investigate the summation of speed in relation to kicking. Putnam (1991) conducted an analysis
of segment interaction of the PDS in kicking. A model was derived to describe the interaction

36
between the shank and the thigh in terms of gravity (gravity - dependent moments), motion of
the other segment (motion - dependent moments), resultant joint moments and forces.
Within the model, each interactive moment was a function of one motion variable only. This
enabled Putnam and colleagues to measure the influence that gravity, the motion of the other
segment, and the joint moments and forces had on the motion of both the thigh and shank.
Labels were assigned to each segment and interactive moment. For example, the effect that the
angular velocity (V) of the thigh (T) has on the motion of the shank (S) was expressed as S –
VT. This can be seen in table 4. For motion-dependent moments, a negative number means that
the variable decelerated the segment. A positive number means that it contributed to
accelerating the segment. The higher the number, be it positive or negative, the greater the
influence of the particular variable on the acceleration of the segment. Knee torque and the
weight of the shank were measured as the non motion-dependent variables.
The data was collected using two distinctly different groups. The first group contained four
subjects who were skilled in American football punt kicking and the other group consisted of
three experienced distance runners and a recreational runner. Each subject in the kicking group
performed a punt kick with the ball of their choice (soccer, football or rugby). The kick was filmed
in the sagittal plane at 300 frames/second. The beginning of the kick (0% time) was defined as
the beginning of thigh forward rotation and the end (100 % movement time) was foot – ball
contact. Each kick was divided into three stages; Stage 1 – transition: positive thigh rotation,
negative shank rotation; Stage 2 – forward swing 1: start of positive rotation of shank to time that
angular velocity of thigh decreases; Stage 3 – forward swing 2: start of decrease in thigh angular
velocity to foot - ball contact. Shank and thigh kinematics were taken from one trial for each
subject.
Putnam (1991) demonstrated that Angular velocity of the shank (2292 degrees/second) was
greater than that of the thigh (1088 degrees/second) during the forward swing, maximum
angular velocity of the shank occurred approximately .072 seconds (40% of total movement
time) after that of the thigh, the angular velocity of the thigh assisted in the positive angular
acceleration of the shank, resultant joint moments were higher for the hip (184, 223, 229 N.m)
than the knee (-6, 85, 63 N.m) for all three stages of the kick and the decrease in thigh angular

37
velocity, which began at 0.072 second prior to contact, was caused primarily by the influence of
the shank’s angular motion on the thigh (refer to table 4; T – VL = - 430).
Variable Stage 1 Stage 2 Stage 3
(S-AT) Influence of the linear acceleration of the thigh on the motion of the shank
-79 (26) -7 (15) -6 (11)
(S-VT) Influence of the angular velocity of the thigh on the motion of the shank
3 (3) 82 (22) 78 (6)
(T-AS) Influence that the linear acceleration of the shank had on the motion of the thigh
135 (56) -167 (47) -153 (44)
(T-VS) Influence that the angular velocity of the shank had on the motion of the thigh
-45 (17) -44 (11) - 430 (24)
(T-AH) Influence that the linear acceleration of the hip had on the motion of the thigh
3 (48) 105 (14) -3 (49)
Table 2 Means of average resultant joint moments (RJM) and motion-dependant interactive moments in N.m
(standard deviations in parentheses). Linear acceleration (A), angular velocity (V), thigh (T), shank (S), hip (H), knee (K).
Adapted from Putnam (1991, p 135).
Putnam (1983) also collected data that addressed the predictors of the summation of speed
theory. The details of her study are outlined more comprehensively in section 2.5. The prediction
that the motion of the thigh acts to angularly accelerate the shank can only be partially supported
by her findings. From the beginning of the kick to the time that the thigh began to decrease in
angular velocity the thigh did influence the motion of the shank. The influence of the angular
velocity of the thigh on the motion of the shank was high (approximately 150 N.m, 0.072
seconds prior to contact). However, towards the end of the kick when the thigh reduced in
angular velocity and the shank was rotating rapidly, the magnitude of MS-AVT decreased
(approximately 50N.m, 0.036 seconds prior to contact). The effect of the angular motion of the
thigh in positively accelerating the shank was never as great for the remainder of the kick.
The results of Putnam (1991) supported some of the key features of the summation of speed
theory. The results that support the theory are presented in table 5.

38
Table 3 Comparison of the results presented by Putnam (1991) (P) and Putnam (1983) (Pu) to the predictions of the
summation of speed theory.
2.1.5.3 Currently accepted theory
The summation of force theory could not be fully supported by Wahrenburg et al. (1978) or
Robertson and Mosher (1985). These two studies demonstrated that there is no dominance of
knee extensor muscles whilst the shank rotates towards the ball in the final stages of the forward
swing. Wahrenburg et al. demonstrated that there was a net knee flexor muscular moment with
respect to the knee joint just prior to foot - ball contact. The results presented by Putnam and
Dunn (1987) and Robertson and Mosher (1985) also showed that there is a knee flexion
moment at this time. Hence, the prediction of the summation of force theory that the angular
velocity of the shank and foot is the result of force generated by the knee extensor muscles is
not supported.
Barfield et al. (2002) said that one of the criteria of the summation of speed is that the negative
angular acceleration of the proximal segment leads to the acceleration of the adjacent segment,
and that the results presented by Putnam do not show this. They show that the decrease in thigh
angular velocity resulted from a large hip flexor moment that counteracts the effect of the leg on

39
the thigh. This contradiction was the catalyst to Barfield et al. (2002) suggesting that the results
presented by Putnam (1991) did not support the summation of speed theory.
In relation to the definitions of the summation of speed that were presented earlier in this review
(section 2.4), Putnam (1991) has presented the most convincing evidence in support of some of
the summation of speed theory. Putnam’s results did show that the decreased angular velocity
of the thigh during the forward swing was influenced by the angular acceleration of the shank.
The decrease in thigh angular velocity is evident even when there is a large hip flexion moment.
Hence, the hip extensors are not used to decelerate the thigh.
The influence of the shank’s velocity on the thigh indicates that it is the way that the segments
interact that is crucial, not the muscle force. Putnam (1991) was able to prove (table 5) that it
was not the force that caused the segments to rotate, rather, the motion of the adjacent
segments.
The interaction between segments in the kicking motion needs to be examined further before
general principles that govern the kicking motion can be established. Better knowledge of the
mechanism of the PDS will provide a platform on which to compare whether skilled kickers
utilise the features of the PDS more effectively than less skilled kickers.
2.1.6 Kinematic profile of a typical kick - Summary of key kinematic findings
• Maximum linear velocity and angular velocity of the thigh occurs before that of the shank
(Opavsky, 1988; Putnam, 1991).
• Maximum angular velocity of the shank (1554-2292 degrees/second) is typically greater than
that of the thigh (973-1089 degrees/second) (Putnam, 1983; Baker and Ball, 1993) for
American football, Australian Rules football and soccer.
• Angular velocity of the shank increases as the angular velocity of the thigh decreases during
the forward swing (Dunn and Putnam, 1987b).

40
• Typical angles at contact; knee 30 – 50 degrees of flexion (Baker and Ball, 1993; Orchard et
al. 1999), thigh 52-55 degrees, shank 78-87 degrees (Phillips, 1985).
2.2 Profile of skilled and less skilled kickers
Kicks are performed over a range of distances in Australian Rules. The way that the game is
played makes it necessary for players to kick the ball 15 – 60 metres. Players also have different
capacities in relation to the distance that they can kick the ball. Some studies have attempted to
measure the kinematic differences between the skilled and the less skilled kickers.
Ball velocity
Ball velocity has been used in several studies as an indicator of kicking distance or kicking
success (Plagenhoef, 1971; Togari, 1972; Macmillan, 1975 and 1976; Isokawa, 1981; Opavsky,
1988; Baker and Ball, 1993). Togari (1972) and Isokawa (1981) both reported that ball velocity
was related to the velocity of the swing of the kicking limb (r=.80). Opavsky (1988) also found
that ball velocity was significantly correlated with swing velocity for the soccer instep kick
(r=.522, p<.05). The ball velocities obtained by Opavsky ranged from 14.9 – 22.3
metres/second. Robertson and Mosher (1985) obtained a mean ball velocity of 26.38
metres/second in soccer kicking. Macmillan (1975) reported a mean ball velocity of 24.1
metres/second in Australian Rules football kicking.
Plagenhoef (1971) suggested that ball velocity is the major indicator of the success of the kick.
Phillips (1985) divided the ball velocity into components: resultant, horizontal and vertical.
Phillips measured the kinematics of an expert and a club player. The expert kicker performed an
American football punt kick and the club player performed a soccer place kick. The results of this
study indicated that the vertical ball velocity was greater for the expert compared to that of the
club player. The ball projection angle was also higher for the expert kicker (expert 36.2 degrees;
club 25.3 degrees). However, Phillips (1985) found that the expert kicker demonstrated a lower
mean ball velocity (29.5 metres/second) than did the club player (30.7 metres/second). The
higher vertical velocity that was demonstrated by the expert player is probably the result of the
type of kick. It is not an indicator that expert kickers are able to impart greater vertical velocity to
the ball.

41
2.2.1 Projectile motion in kicking
The football is classified as a projectile. The distance that the ball travels is determined by the
horizontal and vertical velocities of the ball and the height of release (Enoka, 2002; Hay and
Reid, 1988). The outcome of the kick is dependent on the trajectory and distance of ball travel.
The trajectory is the vertical angle and the range is the horizontal distance. When the ball leaves
the foot it has a trajectory and a range. As the football moves through the air there is also air
resistance, however for the purposes of this discussion the effects of air resistance are assumed
to be negligible. The simplified diagram below shows the components that contribute to the flight
of the ball.
Ball velocity 14 metres/second
Distance from centre of ball to ground 0.4 metres
Angle of ball release 45 degrees
Figure 12 Projectile motion in kicking
2.2.2 Kinematic determinants of differences in ball velocity and distance kicked
It is presumed that the variations in kicking distance and ball velocity are accompanied by
altered kinematics, compared to the profile of a typical kick (section 2.1.2). Macmillan (1975,
1976) investigated the relationship between these variables of the kick and the altered
kinematics.

42
Macmillan (1975) showed that the angular velocity at the knee is one variable that is associated
with different outcomes of the Australian Rules football kick. The results indicated that the
velocity of the foot (an indicator of ball velocity (Plagenhoef, 1971)) was highly correlated (r =.74
- .95) with knee angular velocity. He suggested that the practical significance of this finding was
that kickers could control the velocity of the foot, and consequently the velocity of the ball by
controlling the angular velocity of knee extension.
Macmillan (1976) measured the kinematics of the drop punt kick in Australian Rules football. The
objective of the study was to ascertain which variables could be used to predict the path of the
foot and the result of the kick. Correlation coefficients were calculated for the thigh and knee
angular velocity and the success of the kick. The velocity of the foot at foot – ball contact was
used as the measure of the success of the kick. The results indicated that the contribution of the
thigh and knee angular velocity to the success of the kick varied from subject to subject. For
some subjects the knee angular velocity was more important in predicting the path of the foot (r
= 0.86 for the thigh and r = 0.93 for the knee angular velocity) and for others the thigh angular
velocity was more important (r = 0.84 for the thigh and r = 0.66 for the knee).
Macmillan (1976) concluded that the higher the body velocity the further the ball will travel, yet
Macmillan (1975) found that body velocity was not related to foot velocity (r = .04 - .27).
Macmillan used the results of the two studies to conclude that the velocity of the body
contributes to the direction of the movement of the kicking foot, rather than its velocity. More
kinematic determinants of ball velocity are discussed in section 2.5. 2.2.3 Kinematic differences
between skilled and less skilled kickers in soccer and American football
Phillips (1985) compared the kinematics of an expert American football kicker to a highly skilled
club soccer player. The professional American football player was filmed kicking an American
football version of the place kick. The club soccer player was filmed performing a toe kick with a
soccer ball. Both subjects were filmed in the sagittal plane. The frame rate was not reported.
Angular positions of the lower extremity just prior to foot–ball contact were measured, as was
ball velocity.

43
The results showed that the position of the thigh at impact was similar for the expert (55
degrees, SD 1.3) and the club player (52 degrees, SD 5.7). There were slight differences in the
position of the shank at foot – ball contact (expert 87 degrees, SD 1.87; club 78 degrees, SD
2.8). The statistical significance of the difference was not reported. Knee angle at foot – ball
contact was 37.6 degrees (SD 3.0) for the expert and 48.2 (SD 3.1) for the club player.
The author did not indicate which kinematic event was used to define the start of the swing
however, there was a difference in the total swing time between the expert (.226 seconds) and
the club player (.170 seconds). The expert also demonstrated a greater mean angular velocity of
the knee at foot – ball contact (expert 1831 degrees/second; club 1734 degrees/second). The
linear displacement of the shank from the commencement of the swing to the foot – ball contact
was 234 cm for the club player and 217 cm for the expert player. Knee extension was initiated at
0.067 seconds and 0.049 seconds prior to impact for the expert and club players respectively.
The results are shown in table 1.
Table 4 Expert American football player compared to a club soccer player. Adapted from Phillips (1985).
Phillips suggested that the intra trial differences for the expert kicker were the result of the
variation in position of the body at or just before foot – ball contact.
Phillips (1985) did not measure the speed of the approach, however he suggested that the
differences between subjects in the study were related to the linear speed of the approach.
Based on the findings of Dunn and Putnam (1987b), the speed of the kick only alters the angular
velocity of the shank, not the thigh (section 2.3.1). Hence, it is doubtful that the differences
between subjects for the position of the shank and thigh at contact are the result of the linear
speed of the approach.

44
The validity of the results presented by Phillips (1985) must be questioned because the expert
player performed a different type of kick from the club player. The kinematics of kicking are
different for the various kick types. Therefore it is difficult to distinguish how much of the
difference was presented by Phillips is the result of the different skill level of the subjects and
how much is the variability that exists between the American football punt kick and the soccer
place kick.
2.2.4 Kinematic differences between skilled and less skilled kickers in Australian Rules
football
One aspect of a skilled kick is the distance that the ball is kicked. Baker & Ball (1993) compared
the kinematics of Australian Rules players at different kicking distances. Subjects from the junior
national team were divided into two groups: long kickers and short kickers, based on whether
their maximum kick was typically long or short (long 46 - 51 metres, short 41 - 45 metres). The
data was collected on kicks performed for maximal distance, with a stipulated degree of
accuracy (the ball had to pass through a target area to be measured). Each trial was filmed in
the sagittal plane by a 200Hz camera. The kick was analysed in its phases: grip and approach,
ball release and backswing, forward swing to foot – ball contact and the follow through.
In their initial hypothesis Baker and Ball (1993) suggested that a player who exhibits a large
angle of hip extension and knee flexion on completion of the backswing will have a greater range
over which to perform the forward swing. The results in relation to the backswing showed that
the thigh position at the end of the backswing was 64 degrees for the short kicking group and 60
degrees for the long kicking group (figure 12). The difference was not significant (p>0.02). Shank
position at the end of the backswing was 18 degrees above horizontal for the long kicking group
and 7 degrees above the horizontal for the short kicking group (162 degrees and 173 degrees by
the definitions used in the current project (page 59 – 61) This difference was significant (p<0.02).
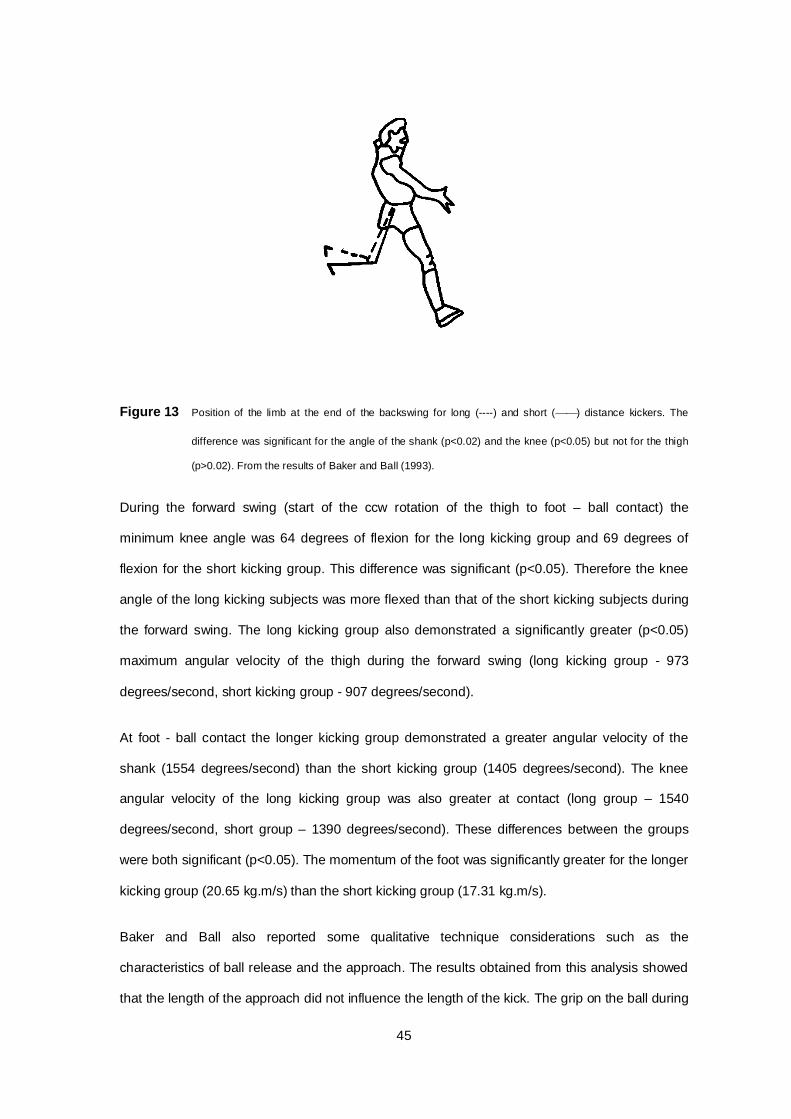
45
Figure 13 Position of the limb at the end of the backswing for long (----) and short () distance kickers. The
difference was significant for the angle of the shank (p<0.02) and the knee (p<0.05) but not for the thigh
(p>0.02). From the results of Baker and Ball (1993).
During the forward swing (start of the ccw rotation of the thigh to foot – ball contact) the
minimum knee angle was 64 degrees of flexion for the long kicking group and 69 degrees of
flexion for the short kicking group. This difference was significant (p<0.05). Therefore the knee
angle of the long kicking subjects was more flexed than that of the short kicking subjects during
the forward swing. The long kicking group also demonstrated a significantly greater (p<0.05)
maximum angular velocity of the thigh during the forward swing (long kicking group - 973
degrees/second, short kicking group - 907 degrees/second).
At foot - ball contact the longer kicking group demonstrated a greater angular velocity of the
shank (1554 degrees/second) than the short kicking group (1405 degrees/second). The knee
angular velocity of the long kicking group was also greater at contact (long group – 1540
degrees/second, short group – 1390 degrees/second). These differences between the groups
were both significant (p<0.05). The momentum of the foot was significantly greater for the longer
kicking group (20.65 kg.m/s) than the short kicking group (17.31 kg.m/s).
Baker and Ball also reported some qualitative technique considerations such as the
characteristics of ball release and the approach. The results obtained from this analysis showed
that the length of the approach did not influence the length of the kick. The grip on the ball during

46
the approach was also compared for the two groups. The results indicated that the long distance
kickers gripped the ball in the most consistent fashion, with the fingers near the top of the laces.
The results also indicated that more effective kickers (long group) released the ball closer to the
navel and over the plane of the kicking limb. The ball was released from the hands just prior to
the time when the thigh of the swinging limb reached its maximal posterior position. This finding
supports traditional coaching literature that suggests the ball be released at the completion of
the backswing (Parkin et al. 1987). Any influence that the timing of ball release has on
segmental interaction has not been investigated.
In summary, the differences between long and short distance kickers were:
there was no difference between the long distance kickers and the short distance kickers in
the position of the thigh at the end of the backswing.
long kicking subjects orientated the shank further in the cw direction (further above
horizontal) than did the short kickers.
long distance kickers demonstrated greater mean maximum angular velocity of the thigh
during the forward swing.
long distance kickers demonstrated a greater mean maximum angular velocity of the shank
at foot – ball contact.
2.3 Other factors in kicking success
A kick is not performed as a closed skill in a football match. Hence, researchers have measured
the influence that several variables have on the kinematics of the kick. The variables that have
been measured in the literature include kicking speed (Dunn and Putnam, 1987b), approach
speed, ball pressure and weight (Orchard et al. 2003), kicking distance (Baker and Ball, 1993),
kicking over a defensive wall (Brown et al. 1993), and inter subject variability (Phillips, 1985). Of
most relevance to the present study are the studies that have compared the kinematics of
kicking of subjects with different kicking ability (Phillips, 1985; Anderson and Sidaway, 1994;
Baker and Ball, 1993). The aspects of movement control and the effect of practice on kicking
performance has also been reported (Barfield, 1998; Davids et al. 2000).

47
What makes the skillful kickers skillful? Do they have stronger, more powerful leg muscles or are
they able to coordinate the motion of the segments and joints in a way that optimises the motion
of the ball? Can the skill of kicking be enhanced by training, and if so, to what extent? The
forthcoming paragraphs discuss some of these points and what other researchers have found in
relation to these questions.
2.3.1 Coordination
Research has indicated that the success of the kick is not dependent simply on the attainment of
a high velocity of the striking mass. Anderson and Sidaway (1994) showed that the increased
soccer kicking performance that resulted from practice was the result of greater coordination of
the movement of the segments in relation to one another. This suggestion was based on the
finding that the time between the maximum angular velocity of the shank and thigh for the novice
kickers became close to the pattern showed by the expert kickers after 10 weeks of kicking
practice.
2.3.2 Training
One study has shown that practice of the skill can enhance kicking performance. Anderson and
Sidaway (1994) investigated the coordination changes associated with practice of the instep kick
in soccer. They compared novice and expert soccer players. Three college soccer players were
filmed to ascertain if there was an optimum pattern of coordination. Five males and one female
participated in an introductory soccer class. Each one who enrolled in the kicking course was
tested before and after the 10 weeks of classes. The instep kick of each was filmed before and
after the practice period.
The initial hypothesis was that the subjects would be able to increase the maximum linear
velocity of the foot as a result of the practice. The results supported this hypothesis. The results
indicated that several changes were made in this time. The maximum linear foot velocity
increased from 14.9 metres/second to 21.9 metres/second. The maximum angular velocity of the
knee and the hip also increased with practice.

48
The timing of the key events also changed. For example, the maximum hip angular velocity
occurred 13% movement time after the knee began to extend. In the post practice trials the knee
began to extend 2% after the maximum hip angular velocity. The post practice temporal
relationship was close to that of the expert kickers.
The results presented by Anderson and Sidaway (1994) are summarised in Table 2. They
indicate that the skill of kicking can be refined with practice. The variables that changed with
practice seem to be important in the success of the kick.
Variable/Temporal relationship Change with practice
Time between the maximum knee angular velocity
and the maximum foot linear velocity
Prior to practice the maximum foot linear velocity occurred
before maximum knee angular velocity
After practice it occurred at the same time
Maximum knee flexion in relation to the maximum
hip angular velocity
After practice maximum knee flexion occurred earlier in
relation to the time of the maximum hip angular velocity
Magnitude of knee flexion prior to hip flexion After practice there was an increase in knee f lexion prior to
hip flexion
Maximum knee angular velocity and maximum
foot linear velocity
Increased in magnitude following practice
Table 5 The changes to the kinematics of kicking: Results from Anderson and Sidaway (1994).
2.3.3 Strength
It is obvious when observing a game of Australian Rules football that the players who are skilled
kickers have various body shapes. Not all players with the reputation of being a skilled kicker are
tall with a large muscle mass.

49
The relationship between muscle strength and skilled kicking has been investigated by some
researchers (Cabri et al. 1988; De Proft et al. 1988; Narici et el. 1988; McLean and Tumilty,
1993; Saliba and Hyrsomallis, 2001).
McLean and Tumilty (1993) found there to be no relationship between strength and the distance
of the kicks performed by elite junior soccer players. Saliba and Hrysomallis (2001) measured
the correlation between isokinetic strength (knee flexion and knee extension) and kick
performance in sub-elite Australian Rules players. Analysis of the data revealed that knee flexion
strength (240 degrees/second) was the highest correlated variable with the distance (r=.42).
In contrast Cabri et al. (1988) measured the correlation between isokinetic strength and the
distance of a soccer kick. They found a high correlation between kick distance and knee flexor (r
= 0.77) and knee extensor (r = .74) strength. A positive relationship was also found between kick
distance and hip flexor (r = .56) and hip extensor (r = .56) strength.
2.3.4 Kicking speed
Kicks performed in game situations are performed at a variety of speeds. A player’s ability to
perform a kick is often affected by the speed at which he is moving when he kicks the ball.
Orchard et al. (2003) compared the angular kinematics of a stationary kick and a running kick as
part of his investigation into the relationship between the biomechanics of kicking and the
occurrence of quadriceps strain in Australian Rules football. A 200 Hz camera was used to
capture video footage of the subjects performing a sprint, standing kick and running kick. The
subjects that were used were all AFL players. The results indicated that hip angle at contact was
approximately 25 degrees for the stationary kick and 40 degrees for the running kick. The knee
angle at contact was approximately 90 degrees for the running kick and 30 degrees for the
stationary kick. There was less of a difference in the maximum knee flexion angle -
approximately 125 degrees for the running kick and 105 degrees for the set kick. These
differences were demonstrated in the results however, no data was presented about the
maximum distance that could be obtained from a stationary kick compared to a running kick.

50
Dunn and Putnam (1987b) investigated the kinematic and temporal parameters of American
football punt kicks performed at different speeds. Joint and segment angular velocities were
measured on the basis of the hypothesis that changes in the movement speed are reflected by
increases or decreases in angular velocity of the segments. The subjects performed instep kicks
at three different speeds. Ankle speed (metres/second) was used to measure and categorise the
speed of the kick. Prior to testing, the subjects were trained to kick at a defined slow (7
metres/second), medium (10.4 metres/second) or fast speed (13.8 metres/second). The slow
kicks were filmed at 200 Hz and the other kicks were filmed at 300 Hz.
The results shown in Figure 13 indicate that the angular velocity of the shank at contact was
significantly greater as the speed of the kick increased. At the slow, medium and fast kicking
speeds the shank angular velocity was 1100 degrees/second, 1430 degrees/second and 1650
degrees/second respectively at contact. There was less difference in the maximal angular
velocity of the thigh as the kicking speed increased. Thus the angular velocity of the thigh at the
slow, medium and fast kicking speeds was 155, 160 and 200 degrees/second respectively. The
angular velocity of the thigh was similar for the three speeds and the angular velocity of the
shank was progressively larger with the three kicking speeds. Hence, it can be said that the
increased kicking speed is the result of an increase in the angular velocity of the shank and not
the thigh.
Robertson and Mosher (1985) found that muscular force is responsible for the rotation of the
thigh at the start of the forward swing. Collectively, the findings of Robertson and Mosher (1985),
Dunn and Putnam (1987b) and Putnam (1991) indicate that the hip flexor muscles start the
motion of the thigh and the speed of the kick is subsequently determined by the angular velocity
of the shank.

51
Figure 14 Angular velocity-time curves for slow, medium and fast kicking speeds. Shank angular velocity is the
broken lines and thigh angular velocity is the solid lines (fast , medium Δ, and slow ). Zero percent
time represents the start of the forward motion of the thigh and 100% time represents foot - ball contact.
Adapted from Dunn and Putnam (1987b, p. 788).
The conclusion of the Dunn and Putnam (1987b) study was that consistent temporal patterns
exist in the motion, independent of segment configuration and velocities. Further research is
needed to ascertain if a skilled kicker simply increases the magnitude of the velocity of the shank
or varies the pattern of segmental interaction in a way that maximises ball propulsion.
2.3.5 Intersubject variation of kicking performance
Barfield et al. (2002) made the general statement that elite athletes exhibit less mechanical
variation and greater temporal proximity of the kicking movement components compared with
novice or less skilled athletes. The intra subject variability in kicking has been measured
(Phillips, 1985).
0
200
400
600
800
1000
1200
1400
1600
1800
0 20 40 60 80 100
Time (second)
Angu
lar v
eloc
ity (d
egre
es/s
econ
d)

52
Phillips (1985) investigated intra subject variation by comparing the consistency of an expert and
club player. The data used in the analysis was obtained from players being filmed whilst
performing an American football place kick. The frame rate was not reported. The results
indicated that there was greater variability of ball velocity for the club player. The expert player
demonstrated minimal variability in angular position of the thigh just prior to foot – ball contact.
The position of the thigh just prior to foot – ball contact was most consistent across trials for the
expert (range = 3.2 degrees, SD = 1.32 degrees) when compared to the club player (range =
10.2 degrees, SD = 5.65 degrees).
2.3.6 Stretch shortening at knee joint
Lees and Nolan (1998) discussed the effect of the transition period. During the transition period
the thigh is brought forward and the knee is still flexing. This action serves to stretch the knee
extensor muscles before they are required to shorten. In exception the rectus femoris is
shortened at the hip whilst it is lengthening at the knee. Bober et al. (1987) used simulated
kicking to show that the speed of the kicking movement can be increased by up to 21% when
this stretch-shortening action is used to extend the knee joint instead of concentric muscular
contraction.
2.4 Decreased angular velocity of the thigh
The distance that a ball is kicked is influenced by the action of the thigh, which slows down or
reverses its motion before the knee reaches full extension. Investigating the cause of the
increased angular velocity of the shank and the accompanying reduction in angular velocity of
the thigh is not the focus of the current study. However, it is appropriate to discuss it briefly here.
Putnam (1983) collected data on the proximal joint torques and “motion-dependent” moments of
force (motion dependent moments are defined in section 2.4.2). A camera operating at 300 Hz
recorded the subjects performing American football punt kicks. The results of this study showed
that the thigh has an influence on the motion of the shank and the shank influences the motion
of the thigh.

53
2.4.1 Influence of shank on thigh
The results of the Putnam (1983) study indicated that the motion-dependent moments were high
at the time of maximum increase in shank angular velocity. The moments that represented the
effect of the shank on the thigh showed that the rapid increase in the angular velocity of the
shank past 90 degrees of knee flexion caused the thigh to slow. The results of this investigation
add weight to the suggestion that the rotation of the shank causes the decrease in the angular
velocity of the thigh.
2.4.2 Influence of thigh on shank
Putnam (1983) also showed that the motion of the thigh influences that of the shank. The
angular velocity of the thigh was influential in angularly accelerating the shank in the counter-
clockwise direction throughout most of the kick.
Summary of findings of Putnam (1983)
The angular velocity of the thigh had a great influence on the motion of the shank.
As the angular velocity of the thigh started to decrease so to did the influence of the angular
acceleration of the thigh on the motion of the shank.
The influence of thigh angular acceleration on the shank changed from assisting in the
counter-clockwise angular acceleration of the shank to decelerating the shank.
Even though the angular velocity of the thigh did decrease, Putnam suggested that using the hip
extensor muscles to decelerate the thigh will not be of benefit to the positive acceleration of the
shank. The findings of Baker and Ball (1993) also support this theory. They found that long
kickers (973 degrees/second) demonstrate a significantly greater (p<0.05) mean thigh angular
velocity than do short kickers (907 degrees/second) during the forward swing.
During the latter part of the kick, Putnam (1983) found that the influence of the angular velocity
of the shank on the motion of the thigh was influential in decreasing the thigh angular velocity
when the shank was rotating rapidly. From this finding Putnam concluded that the decreased
angular velocity of the thigh during the latter portion of the kick does not serve to increase the

54
angular velocity of the shank but rather, this decrease occurs as a result of the influence of the
shank’s angular motion on the thigh.

55
3.0 METHODS
3.1 Basis of the current study and Aims
The aim of the current study is to quantify and compare the kinematics of skilled and less skilled
kicking. A general profile of the drop punt kick and the reliability of the kinematic variables will
also be reported. The study is being conducted to test the following hypothesis’:
• The knee is not fully extended at the time of foot – ball contact.
• Less skilled kickers demonstrate greater between subject variation than do skilled
kickers.
• Less skilled kickers appear to reduce the angular velocity of the shank which results in a
lower knee extension angular velocity at foot – ball contact.
• Skilled kickers display greater angular velocities of the shank at foot – ball contact.
3.2 Subjects
All subjects in the study were elite Australian Rules footballers who play in the Australian
Football League (AFL). The subjects were drawn from four AFL clubs. They were recruited and
grouped based on responses received from AFL coaches who were asked who they thought
were the most skillful kickers at their club.
Two samples of six players were drawn from the AFL population. One sample, drawn from all
four clubs, represented the skilled kickers. The other was taken from one club only. These were
categorised as less skilled kicking subjects. Six of these subjects (less skilled only) participated
in the reliability study.
The small sample size is the result of the following factors:

56
• A small sample size ensured that the players in each group were true to the category
definition – skilled or less skilled.
• The study was conducted late in the season and throughout the finals. Hence, several
players could not participate due to injury, finals commitments or holidays.
• Not all players accepted the offer to participate in the study.
Subjects who participated in the study had to be:
• Currently playing senior football within the AFL.
• Nominated by the coach as being a skilled or less skilled kicker.
• Carrying no current injury that inhibited maximum kicking effort.
The height, mass and age of the subjects are listed in Tables 6 and 7.
Table 6 Height, body mass and age of less skilled subjects
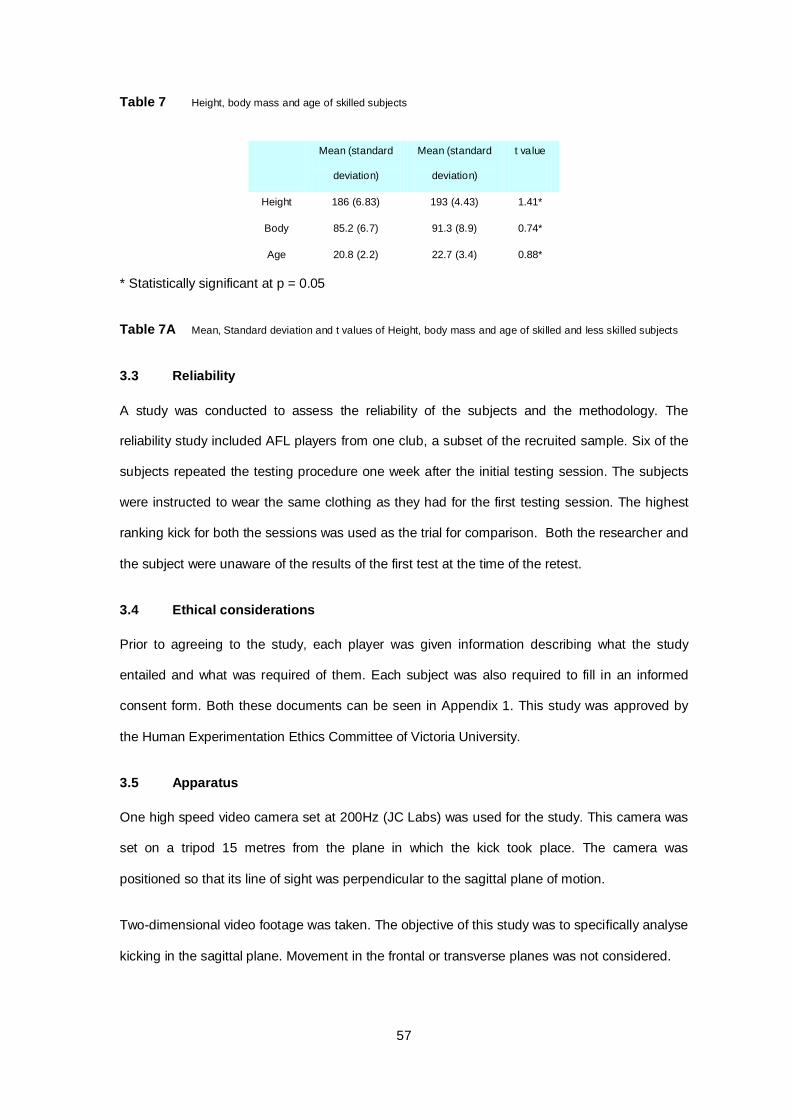
57
Table 7 Height, body mass and age of skilled subjects
Mean (standard
deviation)
Mean (standard
deviation)
t value
Height 186 (6.83) 193 (4.43) 1.41*
Body
85.2 (6.7) 91.3 (8.9) 0.74*
Age 20.8 (2.2) 22.7 (3.4)
0.88*
* Statistically significant at p = 0.05
Table 7A Mean, Standard deviation and t values of Height, body mass and age of skilled and less skilled subjects
3.3 Reliability
A study was conducted to assess the reliability of the subjects and the methodology. The
reliability study included AFL players from one club, a subset of the recruited sample. Six of the
subjects repeated the testing procedure one week after the initial testing session. The subjects
were instructed to wear the same clothing as they had for the first testing session. The highest
ranking kick for both the sessions was used as the trial for comparison. Both the researcher and
the subject were unaware of the results of the first test at the time of the retest.
3.4 Ethical considerations
Prior to agreeing to the study, each player was given information describing what the study
entailed and what was required of them. Each subject was also required to fill in an informed
consent form. Both these documents can be seen in Appendix 1. This study was approved by
the Human Experimentation Ethics Committee of Victoria University.
3.5 Apparatus
One high speed video camera set at 200Hz (JC Labs) was used for the study. This camera was
set on a tripod 15 metres from the plane in which the kick took place. The camera was
positioned so that its line of sight was perpendicular to the sagittal plane of motion.
Two-dimensional video footage was taken. The objective of this study was to specifically analyse
kicking in the sagittal plane. Movement in the frontal or transverse planes was not considered.

58
3.4.1 Calibration
The field of view was calibrated using a scaling rod of a known length (1.6 metres). The field of
view was set to film only the kick itself, not the four step approach.
3.6 Subject preparation
Subjects were instructed to wear a training t-shirt, running shorts and dry weather football boots.
The subjects did not wear socks, enabling a reflective marker to be placed on the ankle. The
markers that were used were 2 cm in diameter. The placement of the markers is outlined in table
8.
Table 8 List markers and exact placement
3.7 Angle definitions
Knee angle
marker reference for joint centre
hip Proximal aspect of the greater trochanter knee Lateral epicondyle of the tibia ankle Lateral malleolus
toe The base of the fifth metatarsal (on the shoe)
hee
l
The heel marker was placed at the base of the calcaneus (on the shoe)

59
Knee angle
Anatomical 180 degrees
-ve
+ve
Figure 15 Knee angle definition.
The knee angle is based on an anatomical angle of 180 degrees (figure 15).
Ankle angle
Figure 16 Ankle angle definition
The ankle angle is based on an anatomical angle of 90 degrees (figure 16)

60
Segmental angles
All of the angles that were used for analysis were calculated ccw with respect to the positive x
axis (Winter, 1990). Segmental angles are shown in figures 17 – 19.
Thigh angle
Figure 17 Thigh angle definition
Shank angle

61
Figure 18 Shank angle definition.
Foot angle
Figure 19 Foot angle definition
3.8 Experimental procedure
Figure 20 illustrates the set - up that was used to collect the data.

62
Figure 20 Diagram of kinematic set - up
3.8.1 Testing protocol
Warm up
Each subject performed a standard warm up. This consisted of five minutes bike riding, static
and ballistic stretching and 10 kicks of varying intensity. An additional five kicks were allowed to
familiarise the subjects with the procedure.
Data collection
Ten drop punt kicks were recorded for each subject. Subjects were instructed to kick as though
they were trying to attain maximum distance with each kick. A four step approach was standard
for all subjects. The subject rated each kick out of 10, so that any poor kicks could be discarded.
Kicks were also discarded if they did not spin as a drop punt (a drop punt is characterised by the
ball rotating backwards around its central axis).
3.9 Data processing
The trial that was given the highest ranking by the player was used for analysis. The video
footage of each trial was processed through the Peak Motus motion analysis system (Peak
camera
net
monitor VCR
kicking
zone

63
Performance Technologies, Englewood, Colorado). The position of each reflective marker was
captured by automatic digitisation using this system. These coordinates were used to define the
following segments: foot, shank and thigh. The data was filtered using the low - pass Butterworth
filter in Peak Motus. Peak Motus also calculated the optimal filter for each point using the
‘Jackson knee method’ (Source: Peak Motus manual).
Numerical differentiation was then performed to derive angular velocities of the thigh and shank
segments and hip, knee and ankle joints.
This data was then transferred to Microsoft Excel for analysis. Once the kinematic data had
been exported into Microsoft Excel it was transferred onto a template spreadsheet. A copy of
this template spreadsheet has been included as an Appendix 2. Individual subject files were
created and linked to a summary spreadsheet.
3.9.1 Phase determination
More than .75 seconds of data was recorded for each subject. The method used to define the
kick meant that the kick duration was different for each subject. For the purposes of this study,
total movement time began at the time of the maximum thigh cw angle (beginning of thigh
forward rotation) and concluded at foot - ball contact. The total kick duration was divided into two
phases, the transition and the forward swing. The definitions of each are outlined in table 9 and
descriptions of these phases are included in section 4.1.1.

64
Table 9 Phase definitions
3.10 Data Analysis
3.10.1 Angular Variables

65
Table 10 List of angular variables
3.10.2 Angular velocity variables
Table 11 List of angular velocity variables

66
3.10.3 Temporal variables
Table 12 List of temporal variables
3.11 Statistical Analysis
3.11.1 Reliability
Trial one and trial two were compared for each subject. A custom Microsoft Excel macro was
used to calculate intraclass correlation coefficient (ICC) and the standard error of measurement
(SEM) for each variable (Wrigley, 1998). Atkinson and Nevill (1998) suggested that variables are
reliable if they have an r value equal to or greater than 0.80.
3.11.2 Between group comparisons
All the reliable variables for the skilled and less skilled groups were compared using t test in
SPSS. Levene’s test for equality of variance was also calculated in SPSS.
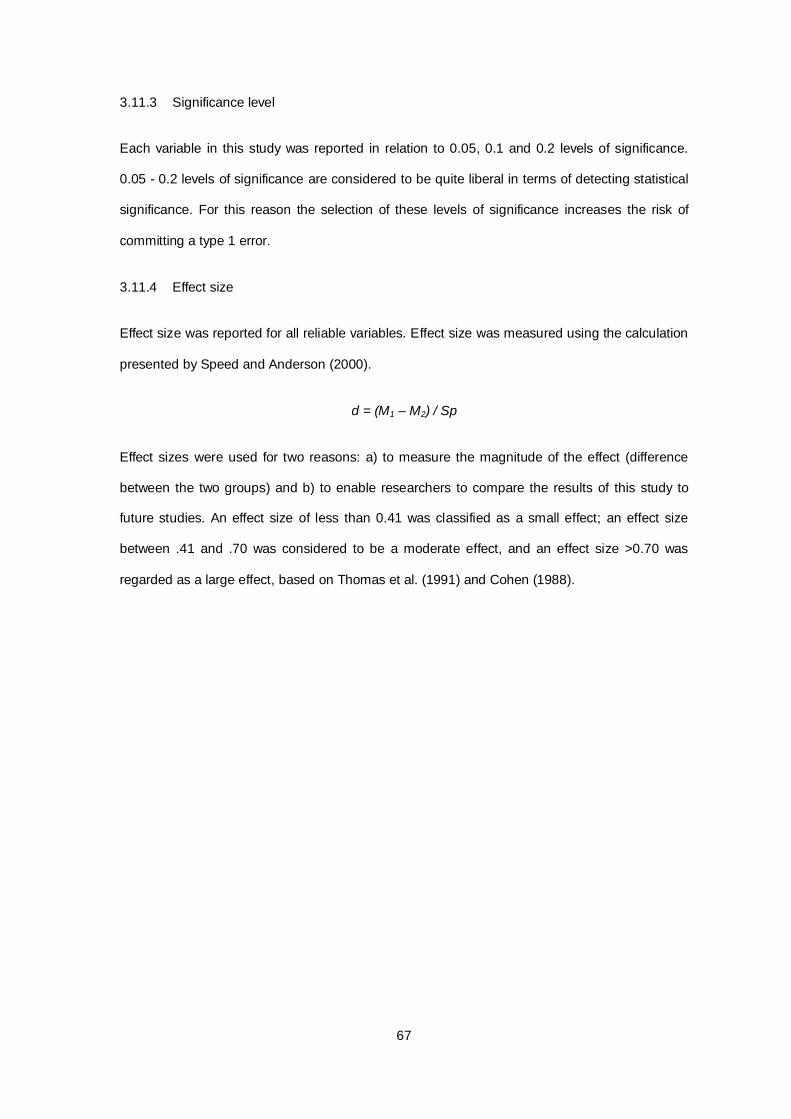
67
3.11.3 Significance level
Each variable in this study was reported in relation to 0.05, 0.1 and 0.2 levels of significance.
0.05 - 0.2 levels of significance are considered to be quite liberal in terms of detecting statistical
significance. For this reason the selection of these levels of significance increases the risk of
committing a type 1 error.
3.11.4 Effect size
Effect size was reported for all reliable variables. Effect size was measured using the calculation
presented by Speed and Anderson (2000).
d = (M1 – M2) / Sp
Effect sizes were used for two reasons: a) to measure the magnitude of the effect (difference
between the two groups) and b) to enable researchers to compare the results of this study to
future studies. An effect size of less than 0.41 was classified as a small effect; an effect size
between .41 and .70 was considered to be a moderate effect, and an effect size >0.70 was
regarded as a large effect, based on Thomas et al. (1991) and Cohen (1988).

68
4.0 RESULTS
The purpose of this section is to present a profile of the kinematics of the drop punt and to
present the results of the comparisons made between the skilled and less skilled groups.
The presentation of results is divided into three sections:
1 A general description of the kinematics of kicking: This section is of a descriptive nature
and contains no statistical comparisons.
2 Reliability results: The results of the reliability study are presented to ascertain the
reliability of the methods that were used.
3 Comparison of the kinematics of skilled and less skilled kickers: Presentation of the
results of the between group comparisons for all the reliable variables.
4.1 General description of kicking
4.1.1 General profile of the the drop punt kick – phase timings
The following diagram and paragraph summarises the data that defines the phases for all
subjects. Mean data for all subjects, for each variable, was used to create the figures in section
4.1.
0 10 20 30 40 50 60 70 80 90 10
0
Phases
Movement time (%)
forward
swing
transition

69
Figure 21 Timing of phases
The transition duration (time from maximum thigh cw angle to maximum shank cw angle) is the
equivalent of 50% of movement time. The forward swing (time from the maximum shank cw
angle to foot – ball contact) accounts for the other 50% of the movement time. The kinematic
events that occur in each phase are summarised in sections 4.1.2 and 4.1.3.
4.1.2 General profile of the the drop punt kick - angles
The following diagram and paragraph summarises the angular displacement data obtained for all
subjects. Mean data for all subjects, for each variable, was used to create the chart below.
Figure 22 Mean angular displacement data for all subjects (■ knee, ▲ shank, о foot, + ankle, - thigh).
0.2 seconds to 0.1 seconds prior to foot - ball contact.
0
30
60
90
120
150
180
-0.2 -0.15 -0.1 -0.05 0
Ang
le (d
egre
es)
Time (sec)

70
Knee flexion, thigh ccw rotation and shank cw rotation occur simultaneously.
The angles of the foot follow a similar pattern to the angles of the shank.
- 0.1 to foot – ball contact.
The rotation of the shank changes from cw to ccw.
The thigh continues to rotate in the ccw direction.
Knee flexion continues for a short time after the change in the direction of the rotation of the
shank.
Knee extension commences.
The shank and thigh continue to rotate ccw until foot – ball contact.
The knee extension angle at contact is around 50 degrees.
The angle of the ankle gradually becomes more plantarflexed until just prior to foot – ball
contact.
Maximum knee extension angle occurs after foot – ball contact.
4.1.3 General profile of the the drop punt kick – angular velocity
The following diagram and paragraph summarises the angular velocity data obtained for all
subjects. Mean data for all subjects, for each variable, was used to create the chart below (figure
23).

71
Figure 23 Mean angular velocity data for all subjects (■ knee, ▲ shank, о foot, + ankle, - thigh).
Summary of angular velocity profile of the drop punt:
0.2 seconds to 0.1 seconds prior to foot - ball contact.
Knee flexion angular velocity increases and peaks during this time.
Knee flexion angular velocity decreases.
Knee extension angular velocity begins to increase.
Shank and foot angular velocity begin to increase.
- 0.1 to foot – ball contact.
-1600
-1200
-800
-400
0
400
800
1200
1600
2000
-0.2 -0.15 -0.1 -0.05 0
Ang
ular
vel
ocity
(deg
rees
/sec
)
Time (sec)

72
As the angular velocity of the knee changes from flexion to extension the angular velocity of
the thigh peaks.
Shank ccw and foot cw angular velocity increases.
Knee extension angular velocity increases.
Thigh ccw angular velocity decreases.
Maximum shank ccw, foot cw and knee extension angular velocity peak at around the time
of foot - ball contact.
Foot cw angular velocity demonstrates the highest maximum angular velocity and shank
maximum ccw angular velocity the second highest. Maximum knee extension angular
velocity is less than that of the shank and the maximum ccw angular velocity of the thigh is
even less than the knee.

73
Timing of key events
Figure 24 Timing of key selected events in the drop punt kick. 0 time represents the time of foot – ball contact. This
chart is representative of the mean (SD) values of all subjects.
Summary of the timing of key events:
Maximum shank cw angle occurs just after maximum knee flexion angular velocity.
Maximum knee flexion angle occurs after the maximum shank cw angle.
Maximum ccw thigh angular velocity occurs prior to maximum ccw shank angular velocity.
Maximum cw foot and ccw shank angular velocity occur at approximately the same time.
Maximum knee extension angular velocity occurs just after maximum ccw shank angular
velocity.
-0.25 -0.20 -0.15 -0.10 -0.05 0.00 0.05 0.10
maximum knee extension angle
maximum knee extension angular velocity
maximum cw foot angular velocity
maximum ccw shank angular velocity
maximum knee flexion angle
maximum ccw thigh angular velocity
maximum foot cw angle
maximum shank cw angle
maximum knee flexion angular velocity
maximum thigh cw angle
Time (sec)

74
4.2 Reliability
4.2.1 Reliability – angles
The results of the reliability trials are listed in the tables below. The reliability of the temporal
variables is reported for both absolute and relative time. Reliable variables (ICC>0.8) are
highlighted. The rationale for deeming the variables reliable if they have an ICC > 0.80 is
discussed in 3.9.1.
maximum angles ICC SEM SEM SD mean r degrees % mean degrees degrees
max knee flexion angle 0.41 4.47 4.72 5.7 94.7 max knee extension angle 0.42 4.70 167.80 2.8 2.8 max thigh ccw angle 0.99 2.02 3.68 16.8 54.9 max shank cw angle 0.77 4.53 65.40 9.2 6.9

75
max foot cw angle 0.95 3.05 5.52 13.2 55.3 max ankle plantarflexion angle 0.89 2.70 5.43 7.8 49.7 angles at foot - ball contact ICC SEM SEM SD mean
r degrees % mean degrees degrees knee extension angle at contact 0.55 3.70 6.84 5.4 54.2 thigh angle at contact 0.99 2.67 1.96 23.5 136.3 shank angle at contact 0.93 5.22 6.11 18.4 85.5 foot angle at contact 0.08 6.87 4.98 6.6 138.0 ankle plantarflexion angle at contact 0.70 3.07 6.96 5.4 44.1 angles at the end of the transition ICC SEM SEM SD mean
r degrees % mean degrees degrees knee flexion angle at the end of the transition 0.74 3.43 4.25 6.4 80.8 thigh angle at the end of the transition 0.99 2.38 3.01 27.6 78.8 shank angle at the end of the transition 0.78 4.50 64.23 9.2 7.0 foot angle at the end of the transition 0.95 2.97 5.33 13.2 55.7 ankle plantarflexion angle at the end of the transition 0.78 2.95 6.55 6.0 45.1 angles at maximum knee extension angular velocity
ICC SEM SEM SD mean
r degrees % mean degrees degrees knee extension angle at max knee extension angular velocity
0.75 1.88 3.34 3.6 56.3
thigh angle at max knee extension angular velocity 0.13 27.40 32.97 29.1 83.1 shank angle at max knee extension angular velocity 0.48 13.94 25.04 18.8 55.7 foot angle at max knee extension angular velocity 0.55 12.36 24.57 18.0 50.3 ankle plantarflexion angle at max knee extension angular velocity
0.87 4.22 18.36 11.3 23.0
ROM during transition ICC SEM SEM SD mean r degrees % mean degrees degrees
knee flexion ROM during transition 0.95 6.49 12.40 26.6 52.3 thigh ccw ROM during transition 0.96 2.32 9.73 11.5 23.8 shank cw ROM during transition 0.90 4.85 -16.67 14.6 -29.1 foot ROM during transition 0.95 5.72 -13.24 24.7 -43.2 ankle ROM during transition 0.97 2.42 16.65 14.3 14.6 ROM ICC SEM SEM SD mean
r degrees % mean degrees degrees knee flexion ROM 0.16 5.98 4.75 96.7 126.0 knee extension ROM (max knee flexion to contact) 0.53 5.10 4.57 173.1 111.5 thigh ccw rotation ROM (start of transition to contact) 0.53 5.10 2.89 368.9 176.3 shank cw ROM during transition 0.90 4.9 -16.7 14.6 29.1 shank ccw ROM during forward swing 0.86 4.80 3.93 128.9 122.0
Table 13 Reliability of the angular variables (magnitude).
timing of maximum angles (relative time) ICC SEM SEM SD mean r % MT % mean % MT % MT
time of max knee flexion angle 0.94 3.11 4.97 12.0 62.6
time of max knee extension angle 0.98 2.92 1.95 18.7 149.6
time of max thigh cw angle 0.99 2.02 3.68 16.8 54.9
time of max shank cw angle 0.94 5.22 12.75 20.7 41.0
time of max foot ccw angle 0.98 2.73 6.24 16.9 43.8

76
time of max ankle plantarflexion -0.49 20.23 26.49 16.9 76.4
Table 14 Reliability of the angular variables (temporal).
4.2.2 Reliability – angular velocity
maximum angular velocities ICC SEM SEM SD mean r degrees/sec % mean degrees/sec degrees/sec
max knee extension angular velocity 0.19 110.86 -9.64 122.3 -1149.5 max ccw thigh angular velocity 0.94 47.97 5.96 188.1 804.7 max ccw shank angular velocity 0.68 91.31 6.51 157.1 1401.7 max cw foot angular velocity 0.82 124.50 7.49 278.6 1661.5 max ankle plantarflexion angular velocity 0.94 30.46 6.74 115.3 451.8 angular velocities during transition ICC SEM SEM SD mean
r degrees/sec % mean degrees/sec degrees/sec max knee flexion angular velocity during transition 0.65 80.76 9.92 132.1 813.8 max ccw thigh angular velocity during transition 0.98 41.54 8.48 257.5 490.0 max cw shank angular velocity during transition -0.12 43.30 -109.88 41.2 -39.4
timing of maximum angles (absolute time) ICC SEM SEM SD mean r time (sec) % mean time (sec) time
(sec) time of max knee flexion angle -0.25 0.01 -10.33 0.01 -0.06 time of max knee extension angle 0.42 0.01 6.95 0.01 0.08 time of max thigh cw angle 0.98 0.01 -3.13 0.04 -0.18 time of max shank cw angle -0.62 0.01 -7.37 0.01 -0.10 time of max foot ccw angle 0.44 0.00 -4.85 0.01 -0.09 time of max angle plantarf lexion -0.61 0.04 -97.08 0.03 -0.04

77
max cw foot angular velocity during transition 0.64 41.83 -36.00 67.7 -116.2 max ankle plantarflexion during transition 0.98 31.60 9.93 196.3 318.1 maximum angular velocities during forward swing
ICC SEM SEM SD mean
r degrees/sec % mean degrees/sec degrees/sec max knee extension angular velocity during forward swing
0.12 52.92 8.42 56.2 628.3
max ccw thigh angular velocity during forward swing
0.90 63.52 8.00 194.0 794.2
max ccw shank angular velocity during forward swing
0.61 152.87 11.51 237.3 1328.6
max cw foot angular velocity during forward swing 0.92 97.65 6.08 324.9 1606.8 max ankle plantarflexion during forward swing 0.08 50.76 41.01 52.8 123.8 angular velocities at foot - ball contact ICC SEM SEM SD mean
r degrees/sec % mean degrees/sec degrees/sec max knee extension angular velocity at contact 0.62 89.66 -8.60 142.2 -1043.0 max ccw thigh angular velocity at contact 0.27 84.28 29.52 97.0 285.5 max ccw shank angular velocity at contact 0.25 271.51 21.57 310.2 1258.5 max cw foot angular velocity at contact 0.97 49.33 3.14 277.2 1573.5 max ankle plantarflexion at contact 0.88 70.35 -27.15 198.2 -259.1
Table 15 Reliability of the angular velocity variables (magnitude).
timing of maximum angular velocity (relative time) ICC SEM SEM SD mean r % MT % mean % MT % MT time of max knee flexion angular velocity 0.58 2.70 9.68 4.0 27.9
time of max knee extension angular velocity 0.37 7.81 7.49 9.7 104.3 time of max ccw thigh angular velocity 0.91 3.57 5.12 11.4 69.8 time of max ccw shank angular velocity 0.45 15.19 14.76 20.1 102.9 time of max cw foot angular velocity 0.43 6.59 6.50 8.6 101.4
time of max ankle plantarflexion angular velocity 0.07 31.54 27.86 30.5 113.2
timing of maximum angular velocity (absolute time)
ICC SEM SEM SD mean
r time (sec) % mean time (sec) time (sec) time of max knee flexion angular velocity 0.58 0.00 -3.75 -0.13 -0.13 time of max knee extension angular velocity 0.19 110.86 230.77 0.01 0.01 time of max ccw thigh angular velocity 0.94 47.97 -78.12 0.04 -0.05

78
time of max ccw shank angular velocity 0.54 0.02 -3616.63 0.02 0.00 time of max cw foot angular velocity 0.82 124.50 324.32 0.02 0.00 time of max ankle plantarflexion angular velocity 0.09 0.03 196.88 0.03 0.02
Table 16 Reliability of the angular velocity variables (temporal).
4.2.3 Reliability – phase timings
phase duration (absolute time) ICC SEM SEM SD mean
r time (sec) % mean time (sec) time (sec)
transi tion duration 0.98 0.01 6.97 0.04 0.08
forward swing duration 0.51 0.01 5.14 0.00 0.10
Table 17 Reliability of phase timing variables.
4.2.4 Reliability – resultant foot velocity at contact
resultant foot velocity at foot - ball contact ICC SEM SEM SD mean r degrees/sec % mean degrees/sec degrees/sec
resultant foot velocity at contact 0.92 0.61 4.19 2.1 14.6
phase duration (relative time) ICC SEM SEM SD mean r % MT % mean % MT % MT
transi tion duration 0.98 3.38 8.66 20.9 39.0
forward swing duration 0.23 2.41 4.62 2.7 52.1

79
Table 18 Reliability of resultant foot velocity at foot – ball contact.
Figure 25 Resultant foot velocity at contact for all subjects.
The reliability of the resultant foot velocity at foot – ball contact was affected by the presence of
one outlying score (figure 25) of 9.8 metres/second in trial 2. The subject who provided this
result yielded a resultant foot velocity at foot – ball contact of 14.5 metres/second for the other
trial. The reliability of the resultant foot velocity at foot – ball contact was measured with and
without this subject. When the subject was included the r value was 0.61. The reliability was
much higher (r = 0.92) when the ICC was calculated without this subject.
9
10
11
12
13
14
15
16
17
18
19
9 10 11 12 13 14 15 16 17 18 19
trial
2
trial 1

80
Reliability – movement time between selected key events
movement time between selected key events (relative time)
ICC SEM SEM SD mean
r % MT % mean % MT % MT movement time from max ccw thigh angular velocity to max ccw shank angular velocity
0.95 0.03 -10.38 0.1 -0.3
movement time from max ccw shank angular velocity to max cw foot angular velocity
0.42 0.02 -520.77 0.0 0.0
movement time from max knee extension angular velocity to max cw foot angular velocity
0.43 0.02 -668.33 0.0 0.0
movement time from max knee extension angular velocity to max ccw thigh angular velocity
0.84 0.01 14.89 0.0 0.1
movement time from max knee extension angular velocity to max ccw shank angular velocity
-0.22
0.02 486.48 0.0 0.0
time between selected key events (absolute time) ICC SEM SEM SD mean r time (sec) % mean time (sec) time (sec) movement time from max ccw thigh angular velocity to max ccw shank angular velocity
-0.12 0.02 -30.86 0.02 -0.06
movement time from max ccw shank angular velocity to max cw foot angular velocity
0.42 0.02 -520.77 0.03 0.00
movement time from max knee extension angular velocity to max cw foot angular velocity
0.30 0.02 1142.37 0.02 0.00
movement time from max knee extension angular velocity to max ccw thigh angular velocity
0.46 0.03 66.47 0.04 0.05
movement time from max knee extension angular
velocity to max ccw shank angular velocity
-0.19 0.02 405.07 0.02 0.01
Table 19 Reliability of the time between selected key events.
4.2.5.1 Movement time between the time of maximum knee flexion angle and the maximum
shank cw angle
movement time from max knee flexion angle to max shank cw angle (relative time)
ICC SEM SEM SD mean
r % MT % mean % MT % MT movement time from max knee flexion angle to max shank cw angle
0.57 1.69 8.93 1.4 19.0

81
movement time from max knee flexion angle to max cw shank angle (absolute time)
ICC SEM SEM SD mean
r time (sec) % mean time (sec) time (sec) movement time from max knee flexion angle to max shank cw angle
0.00 0.00 0.00 0.00 0.04
Table 20 Reliability of the movement time between the time of maximum knee flexion angle and the maximum
shank cw angle.
4.2.5.2 Movement time between the time of maximum thigh cw angular velocity and maximum
knee flexion angle
movement time from max ccw thigh angular velocity to max knee flexion angle (relative time)
ICC SEM SEM SD mean
r % MT % mean % MT % MT
movement time from max ccw thigh angular velocity to max knee flexion angle
-0.90
3.55 101.09 2.7 3.5
movement time from max ccw thigh angular velocity to max knee flexion angle (absolute time)
ICC SEM SEM SD mean
r time (sec) %mean time (sec) time (sec) movement time form max ccw thigh angular velocity to max knee flexion angle
0.00 0.00 0.00 0.04 -0.01
Table 21 Reliability of the movement time between the time of maximum thigh ccw angular velocity and maximum
knee flexion angle.
4.2.6 Reliability – summary of reliability of key events
reliability of selected key events relative time absolute time
event ICC ICC r r maximum knee extension 0.98 0.25
maximum foot angular velocity 0.43 0.82
maximum shank angular velocity 0.45 0.54
maximum knee extension angular velocity 0.37 0.19

82
maximum knee flexion 0.94 0.62
maximum thigh angular velocity 0.91 0.94
maximum foot angle 0.98 0.44
start ccw rotation of shank (end of transition) 0.94 0.62
maximum knee flexion angular velocity 0.58 0.58
maximum cw position of thigh 0.98
Table 22 Reliability of the timing of selected key events.
4.2.7 Reliability - list of reliable variables (r > 0.80)
angles ICC r
max thigh cw angle 0.99 max foot cw angle 0.95 max ankle plantarflexion angle 0.89 thigh angle at contact 0.99 shank angle at contact 0.93 ankle plantarflexion angle at contact 0.70 thigh angle at the end of the transition 0.99 foot angle at the end of the transition 0.95 ankle plantarflexion angle at max knee extension angular velocity 0.87 knee flexion ROM during transition 0.95 thigh ccw ROM during transition 0.96 shank cw ROM during transition 0.90

83
foot ROM during transition 0.95 ankle ROM during transition 0.97 shank ccw ROM during forward swing 0.86 angular velocities ICC
r max ccw thigh angular velocity 0.94 max cw foot angular velocity 0.82 max ankle plantarflexion angular velocity 0.94 max ccw thigh angular velocity during transition 0.98 max ankle plantarflexion angular velocity during transition 0.98 max ccw thigh angular velocity during forward swing 0.90 max cw foot angular velocity during forward swing 0.92 cw foot angular velocity at contact 0.97 ankle plantarflexion angular velocity at contact 0.88 resultant foot velocity at contact 0.92 temporal variables: relative time ICC
r time of max knee flexion angle 0.94 time of max knee extension angle 0.98 time of max thigh cw angle 0.99 time of max shank cw angle 0.94 time of max foot ccw angle 0.98 time of max ccw thigh angular velocity 0.91 movement time from max ccw thigh angular velocity to max ccw shank angular velocity 0.95 movement time from max knee extension angular velocity to max ccw thigh angular velocity 0.84 movement time from max ccw thigh angular velocity to max knee flexion angle -0.90 transi tion duration 0.98 angles: absolute time ICC
r time of max thigh cw angle 0.98 time of max ccw thigh angular velocity 0.94 time of max cw foot angular velocity 0.82 transi tion duration 0.98
Table 23 Summary of variables that are reliable (r > 0.80).
4.2.8 Reliability - list of reliable variables (r > 0.50)
The variables that have moderate reliability (r = 0.50 – 0.79) are presented in the table below
(Table 24). This subset of reliable variables have been included so that the variables that have a
moderate reliability can be identified.
variable with ICC greater than 0.50 ICC r max shank cw angle 0.77 knee extension angle at contact 0.55 ankle plantarflexion angle at contact 0.70 knee flexion angle at the end of the transition 0.74 shank angle at the end of the transition 0.78 ankle plantarflexion angle at the end of the transition 0.78 knee extension angle at max knee extension angular velocity 0.75

84
foot angle at max knee extension angular velocity 0.55 knee extension ROM (max knee flexion to contact) 0.53 thigh ccw rotation ROM (start of transition to contact) 0.53 max ccw shank angular velocity 0.68 max knee flexion angular velocity during transition 0.65 max cw foot angular velocity during transition 0.64 max ccw shank angular velocity during forward swing 0.61 knee extension angular velocity at contact 0.62
relative time variables with ICC greater than 0.50 ICC r time of max knee flexion angular velocity 0.58 movement time from max knee flexion angle to max cw shank angle -0.57 forward swing duration -0.51 absolute time variables with ICC greater than 0.50 ICC r time of max shank cw angle -0.62 time of max ankle plantarflexion -0.61 time of max knee flexion angular velocity 0.58 time of max ccw shank angular velocity 0.54 forward swing duration -0.51
Table 24 Summary of variables that are reliable (r > 0.50).
4.3 Comparison of skilled and less skilled
Only reliable variables were used for the comparisons between the skilled and less skilled
groups. Hence, variables with r < 0.80 are not used for comparison between groups in this
section. The differences that were significant (p < 0.2) are indicated by *, (p < 0.1) are indicated
by ** and (p < 0.05) are indicated by ***. In all the tables the skilled data columns are shown by
(s) and the less skilled columns are indicated by a (us).
4.3.1 Resultant linear foot velocity at foot – ball contact
There was no difference between the skilled and less skilled group in the resultant foot velocity
at foot – ball contact (p = 0.78).
resultant foot velocity at foot - ball contact
Skilled mean
SD
Less skilled mean
SD
ES
p
metres/second metres/second metres/second metres/second resultant foot velocity at contact 13.6 2.2 13.9 1.9 0.784

85
Table 25 Resultant linear foot velocity at foot – ball contact comparisons.
4.3.2 Comparison of skilled and less skilled – Angles
4.3.2.1 Maximum angles
There was a difference between groups for the maximum ankle plantarflexion angle. There was
a large effect size (ES = –0.85) and p = 0.15. However, this difference was only significant at the
most liberal level of significance (p < 0.20). There was no statistically significant difference in
the maximum thigh cw angle or the maximum foot cw angle (table 26).
maximum angles
Skilled mean
SD
Less skilled mean
SD
ES
p
degrees degrees degrees degrees max thigh cw angle 62.2 5.3 64.5 4.3 0.429 max foot cw angle 51.5 11.7 57.8 16.9 0.476 max ankle plantarflexion angle 52.7 5.8 45.8 9.0 -0.85 0.155*
Table 26 Comparisons of the maximum angular positions.
There was a moderate effect size (ES = -.63) for the difference in the timing of the maximum
knee extension angle, which occurred after foot – ball contact (138 – 142% of movement time).
These results are presented in table 27.
time of maximum angles (relative time)
Skilled mean
SD
Less skilled mean
SD
ES
p
% MT % MT % MT % MT max knee flexion angle 68.2 4.0 65.8 6.2 0.452 max knee extension angle 142.1 2.3 137.6 9.6 0.704 max shank cw angle 49.7 3.0 49.9 4.6 0.941 max foot cw angle 52.2 2.2 50.8 6.4 0.963

86
Table 27 Timing of maximum angles.
4.3.2.2 Angles at the end of the transition
There was a large effect size (ES = .77) for the foot angle at the end of the transition and a
moderate effect size (ES = .50) for the position of the thigh at the end of the transition (table 28).
The p value was not significant for either the foot (p = 0.46) or the thigh (p = 0.32).
Angles at the end of the transition
Skilled mean
SD
Less skilled mean
SD
ES
p
degrees degrees degrees degrees thigh angle at the end of the transition 90.2 4.8 93.8 7.0 0.316 foot angle at the end of the transition 51.8 11.7 58.3 16.8 0.461
Table 28 Angles at the end of the transition.
4.3.2.3 Angles at foot – ball contact
There was a difference between groups for the thigh angle at foot – ball contact. There was a
large effect size (ES = –0.87) and p = 0.14. However, this difference was only significant at the
most liberal level of significance (p < 0.20). This indicates that the thigh of the less skilled group
was orientated approximately 4 degrees further in the ccw direction than the thigh of the skilled
group.
The difference in the shank angle at foot – ball contact was not statistically significant (p = 0.43).
There was a greater standard deviation for the less skilled (22.5) group compared to the skilled
(5.8) for the position of the shank at foot – ball contact.
angles at contact
Skilled mean
SD
Less skilled mean
SD
ES
p
degrees degrees degrees degrees thigh angle at contact 145.6 3.9 149.0 3.4 0.87 0.139* shank angle at contact 93.4 5.8 101.5 22.5 0.428

87
Table 29 Angles at contact of the skilled and less skilled groups.
4.3.2.4 Range of motion (ROM)
There was no difference between groups in the shank cw ROM during the forward swing.
ROM during transition and forward swing
Skilled mean
SD
Less skilled mean
SD
ES
p
degrees degrees degrees degrees knee flexion ROM during transition 62.2 6.6 66.0 4.0 0.262 thigh ccw ROM during transition 28.0 4.7 29.3 3.0 0.589 shank cw ROM during transition -34.2 5.1 -36.8 4.9 0.399 foot ROM during transition -47.0 4.0 -60.3 17.1 -0.96 0.119* ankle ROM during transition 13.5 3.8 23.5 17.8 0.232 shank ccw ROM during forward swing 84.0 13.0 83.1 14.4 0.577
Table 30 ROM data of the skilled and less skilled groups.
ROM during the transition
There was a difference between groups for the foot ROM during the transition. There was a
large effect size (ES = –0.96) and p = 0.119. However, this difference was only significant at the
most liberal level of significance (p < 0.20). There was also a greater standard deviation in the
less skilled group for both the foot (skilled 4.01, less skilled 17.13) and the ankle (skilled 3.77,
less skilled 17.8).
There was also a large effect size (ES = 0.68) for the comparison between groups of the knee
flexion ROM during transition. This difference was not significant even at the most liberal level of
significance (p = 0.26).
4.3.2.5 Knee extension angle at maximum knee extension angular velocity
There was a difference between groups for the knee extension angle at maximum knee
extension angular velocity. There was a large effect size (ES = 1.09) and p = 0.06. This
difference was statistically significant (p < 0.10). The standard deviation amongst the less skilled
group (SD 12.33) is nearly double that of the skilled group (SD 6.18).
angle at maximum knee extension angular velocity
Skilled mean
SD
Less skilled mean
SD
ES
p
degrees degrees degrees degrees

88
ankle plantarflexion angle at max knee extension angular velocity
18.0 6.2 30.3 12.3 1.09 0.064**
Table 31 Ankle plantarflexion angle at maximum knee extension angular velocity data for the skilled and less
skilled groups.
4.3.3 Comparison of skilled and less skilled - Angular velocity
There was no difference between groups for the maximum cw foot angular velocity. There was a
small effect size (ES = -0.26) and p = 0.67. The standard deviation amongst the less skilled
group (SD 368.3) was greater than it was for the skilled group (SD 159.7). The graph directly
below (figure 26) shows the standard deviation band for all subjects.
Figure 26 Mean foot angular velocity data for skilled and less skilled. Shaded areas represent the standard
deviation for all subjects. The thick black line in the middle of the shaded area is the mean for all the
-
1200
-800
-
400
0
40
0
80
0
120
0
160
0
200
0
240
0
Movement time (%)
Ang
ular
vel
ocity
(deg
rees
/sec
)
10 20 30 50
60 70 80 90 10
0
0 40

89
subjects and the thin line above is the mean for the skilled subjects and the thin line below is the mean for
the less skilled subjects.
maximum angular velocities
Skilled mean
SD
Less skilled mean
SD
ES
p
degrees/second degrees/second degrees/second degrees/second max ccw thigh angular velocity 733.5 88.3 666.0 122.8 0.302 max cw foot angular velocity 1703.1 159.7 1630.8 368.3 0.673 max ankle plantarflexion angular velocity
445.4 136.0 479.9 77.5 0.603
Table 32 Maximum angular velocity data for the skilled an less skilled groups.
The mean maximum ccw thigh angular velocity during the forward swing was greater for the
skilled group (733 degrees/second) than it was for the less skilled group (666 degrees/second).
There was a large effect size (ES = -0.63) and p = 0.300 but this difference was not statistically
significant (p > 0.20), even at the most liberal level of significance. The standard deviation
amongst the less skilled group (SD 123) is nearly double that of the skilled group (SD 88). The
mean difference between groups for the maximum ccw thigh angular velocity is depicted in
figure 27.

90
Figure 27 Mean thigh angular velocity curves for the skilled and less skilled groups. The black line is the skilled
group and the white line is the less skilled group.
4.3.3.1 Timing of the maximum angular velocity
There was no difference (p>0.2) in the relative timing of the maximum ccw thigh angular velocity.
This is shown in table 33.
timing of maximum angular velocities
Skilled mean
SD
Less skilled mean
SD
ES
p
% MT % MT % MT % MT max ccw thigh angular velocity 64.3 4.2 64.9 6.6 0.861
0
100
200
300
400
500
600
700
800
Ang
ular
vel
ocity
(deg
rees
/sec
ond)
Movement time (%)100 100908060 7050403020

91
Table 33 Timing of maximum ccw thigh angular velocity for the skilled and less skilled groups.
4.3.3.2 Maximum angular velocity during the phases
]maximum angular velocities during phases
Skilled mean
SD
Less skilled mean
SD
ES
p
degrees/second degrees/second degrees/second degrees/second max ccw thigh angular velocity during transition
584.6 50.6 556.0 59.6 0.391
max ankle plantarflexion angular velocity during transition
382.4 118.3 386.3 172.7 0.964
max ccw thigh angular velocity during forward swing
733.5 88.3 666.0 122.8 0.302
max cw foot angular velocity during forward swing
1626.0 264.7 1607.9 388.7 0.927
Table 34 Maximum angular velocities during the transition for the skilled and less skilled groups.
4.3.3.3 Angular velocity at foot – ball contact for the skilled and less skilled groups
There was no difference between groups the thigh, foot and ankle angular velocity at foot – ball
contact (p > 0.05). There was a small effect size for all the angular velocities at contact.
There were no differences between groups for the ccw thigh, cw foot and ankle plantarflexion
angular velocity at foot – ball contact. There was a small effect size for all the angular velocities
at foot – ball contact (thigh ES = –0.02, p = 0.98; foot ES = –0.39, p = 0.52; ankle ES = 0.03 p =
0.96.
angular velocity at foot - ball contact
Skilled mean
SD
Less skilled mean
SD
ES
p
degrees/second degrees/second degrees/second degrees/second ccw thigh angular velocity at contact
249.6 42.9 248.8 62.9 0.978
cw foot angular velocity at contact
1612.7 261.0 1495.3 346.5 0.524
ankle plantarflexion angular velocity at contact
260.4 261.4 262.4 263.4 0.957

92
Table 35 Angular velocities at contact for the skilled and less skilled groups.
4.3.4 Movement time between key events
The movement time from maximum ccw thigh angular velocity to maximum ccw shank angular
velocity was different for the two groups. There was a large effect size (ES = 1.13) and p =
0.044. The maximum ccw thigh angular velocity occurred 33.2% of movement time before that of
the shank for the skilled group and 26.5% prior for the less skilled group. This difference is
significant at p < 0.05.
movement time between selected key events
Skilled mean
SD
Less skilled mean
SD
ES
p
% MT % MT % MT % MT movement time from max ccw thigh angular velocity to max ccw shank angular velocity
-33.2 4.7 -26.5 5.3 1.13 0.044***
movement time from max knee extension angular velocity to max ccw thigh angular velocity
36.6 8.7 34.1 2.9 0.519
Table 36 Movement time between key events for the skilled and the less skilled groups.
The relationship between the angular velocity of the thigh and shank is shown in figure 28.

93
Figure 28 Movement time between the maximum ccw angular velocity of the thigh and the shank for the skilled and
less skilled groups. The black area represents the percent movement time between the maximum angular
velocity of the shank and the thigh.
64.3
64.9
33.2
26.5
2.6
8.6
0% 10% 20% 30% 40% 50% 60% 70% 80% 90% 100%
skilled
unskilled
Movement time (%)

94
Figure 29 Mean shank angular velocity and thigh angular velocity curves for the skilled and less skilled groups.
The thigh angular velocity of the less skilled group is identified by (о) and the shank angular velocity
of the less skilled group is represented by (■).
4.3.4.1 Movement time between maximum ccw thigh angular velocity and maximum knee
flexion angle
There was a consistent relationship between the timing of the maximum knee flexion angle and
maximum ccw thigh angular velocity. The mean for all subjects indicates that these two events
occur 2.4% movement time apart. There was more time between the two events for the skilled
group (3.89% movement time) than there was for the less skilled group (0.94% movement time),
with the comparison between the two groups resulting in a large effect size (-0.83), but the
difference was only significant at the most liberal level of significance (p = 0.13). The result for
the between group comparisons are shown in table 37.
-800
-400
0
400
800
1200
1600
0 20 40 60 80 100
Ang
ular
vel
ocity
(deg
rees
/sec
ond)
Movement time (%)

95
movement time from max ccw thigh angular velocity to max knee flexion angle
Skilled mean
SD
Less skilled mean
SD
ES
p
% MT % MT % MT % MT movement time from max ccw thigh angular velocity to max knee flexion angle
3.9 2.7 0.9 3.9 -0.83 0.13*
Table 37 The movement time from maximum ccw thigh angular velocity to maximum knee flexion angle for the
skilled and less skilled groups.
4.3.4.2 Movement time between maximum shank cw angle and maximum knee flexion angle
There was no difference between groups for the movement time from the maximum knee flexion
angle to maximum shank cw angle. There was a moderate effect size (ES = –0.57) and p =
0.157.
movement time from max knee flexion angle to max shank cw angle
Skilled mean
SD
Less skilled mean
SD
ES
p
% MT % MT % MT % MT movement time from max knee flexion angle to max shank cw angle
19.7 2.6 17.5 2.0 -0.89 0.157*
Table 38 Movement time between maximum cw shank angle and maximum knee flexion angle for the skilled and
the less skilled groups.
4.3.5 Phase timings
There was no difference between groups for the duration of the transition or the forward swing.
There was a small effect size and a non-significant p value for both the transition duration (ES =
0.07, p = 0.95) and the forward swing duration (ES = -0.07, p = 0.81). These results are
presented in the table 39 and figure 30.
phase duration
Skilled mean
SD
Less skilled mean
SD
ES
p
% MT % MT % MT % MT transi tion duration 48.0 2.9 48.3 5.1 0.947 forward swing duration 50.4 1.9 50.6 3.0 0.805

96
Table 39 Phase timings of the skilled and less skilled groups.
Figure 30 Phase duration of the skilled and less skilled groups.
4.3.6 Timing of key selected events
The sequence of the timing of the key selected events that are reliable (r > 0.80) was the same
for both the skilled and the less skilled groups. However, there are differences between groups
in the timing of the individual events. For example, the means for the skilled and less skilled
groups differ in the timing of maximum knee extension angle.
0 10 20 30 40 50 60 70 80 90 100
unskilled
skilled
Movement time (%)
transition forward swing
forward swingtransition

97
Figure 31 Timing of key selected events for the skilled and less skilled groups. 100% movement time is the time of
foot – ball contact. The data in this table is based on the mean results for the groups.
4.3.7 Comparison of skilled and less skilled for the variables with r > 0.50
95 variables were used to compare the two groups. Of the 95 variables that were used 40 were
reliable (r > 0.80) and 24 variables demonstrated r > 0.50.
maximum angles
Skilled mean(s)
SD
Less skilled mean(us)
SD
ES
p
0 25 50 75 100 125 150 175
maximum knee extension angle
maximum knee flexion angle
maximum ccw thigh angular velocity
maximum shank cw angle
Movement time (%)

98
degrees degrees degrees degrees Max thigh cw angle 9.3 8.3 10.2 11.7 0.878 angles at foot - ball contact mean SD mean SD ES p degrees degrees degrees degrees knee extension angle at contact
52.2 4.2 47.5 20.4 0.604
ankle plantarflexion angle at contact
46.7 3.9 39.2 7.8 -1.06 .071**
angles at the end of the transition
mean SD mean SD ES p
degrees degrees degrees degrees knee flexion angle at the end of the transition
80.8 5.3 83.5 5.2 0.395
shank angle at the end of the transition
9.4 8.3 10.3 11.7 0.873
ankle plantarflexion angle at the end of the transition
47.9 4.8 42.1 6.7 -0.84 0.122*
angles at maximum knee extension angular velocity
mean SD mean SD ES p
degrees degrees degrees degrees knee extension angle at max knee extension angular velocity
57.0 4.5 55.7 2.4 0.527
foot angle at max knee extension angular velocity
50.6 16.3 52.9 15.4 0.805
ROM mean SD mean SD ES p degrees degrees degrees degrees knee extension ROM (max knee flexion to contact)
43.4 6.4 48.1 21.4 0.432
thigh ccw ROM (start of transition to contact)
83.4 4.6 81.0 7.6 0.721
maximum angular velocity mean SD mean SD ES p degrees/second degrees/second degrees/second degrees/second max ccw shank angular velocity
1366.6 107.1 1376.6 220.4 0.923
maximum angular velocities during the transition
mean SD mean SD ES p
degrees/second degrees/second degrees/second degrees/second max knee flexion angular velocity during transition
826.4 115.7 816.8 84.5 0.873
max cw foot angular velocity during transition
-90.8 32.8 -139.9 81.1 0.214
forward swing duration 0.1 0.0 0.2 0.0 0.351 max ccw shank angular velocity during forward swing
1366.6 107.1 1376.6 220.4 0.923
angular velocities at foot - ball contact
mean SD mean SD ES p
degrees/second degrees/second degrees/second degrees/second knee extension angular velocity at contact
-1110.4 104.2 -992.5 124.1 0.106*
resultant foot velocity at foot - ball contact
mean SD mean SD ES p
metres/second metres/second metres/second metres/second resultant foot velocity at contact
13.6 2.2 13.9 1.9 0.784
movement time from max knee flexion angle to max cw shank angle (absolute time)
mean SD mean SD ES p
seconds seconds seconds seconds movement time from max knee flexion angle to max shank cw angle
0.04 0.01 0.04 0.00
time of maximum angles (absolute time)
mean SD mean SD ES p
seconds seconds seconds seconds time of max shank cw angle -0.1 0.0 -0.1 0.0 0.393 time of max ankle 0.0 0.0 -0.1 0.1 -0.96 0.118*

99
plantarflexion angle time of maximum angular velocities (absolute time)
mean SD mean SD ES p
seconds seconds seconds seconds time of max ccw shank angular velocity
0.0 0.0 -0.1 1.8 0.207
duration of forward swing (absolute time)
mean SD mean SD ES p
seconds seconds seconds seconds forward swing duration 0.1 0.0 0.2 0.0 0.351
Table 40 Comparison of skilled and less skilled for the variables with r > 0.50
5.0 DISCUSSION
5.1 Kicking in soccer, American football and Australian Rules: similarities and
differences
The profile of the drop punt presented in this study shows that there are some similarities and
some differences between the kinematics of the kicks in soccer, American football and

100
Australian Rules football. Some of the kinematic patterns that have been shown consistently in
soccer and American football apply to the drop punt as well. Conversely, the data obtained in
this study also showed that some kinematic aspects of the drop punt may differ from the other
kicks.
5.1.1 Common kinematic patterns
5.1.1.1 Increase in shank angular velocity and decrease in thigh angular velocity during the
forward swing
The relationship between the angular velocity of the thigh and shank throughout the kick
followed a similar pattern in this study as it has in previous studies that have measured the
kinematics of kicking in soccer and American football (Putnam, 1983, 1991, 1993; Robertson
and Mosher, 1985; Dunn and Putnam, 1987b; Putnam and Dunn, 1987; Lees and Nolan, 1998).
During the forward swing the shank angular velocity increased as the thigh angular velocity
decreased. This pattern is common to all types of kicking and this study has shown that the drop
punt is no exception. The results obtained in this study for the thigh and shank angular velocity
are shown in figure 32.

101
Figure 32 The increased angular velocity of the shank (►) and decreased angular velocity of the thigh (▬) during
the forward swing. From results of the current study.
5.1.1.2 Time of maximum ccw thigh angular velocity in relation to maximum knee flexion angle
The results of this study showed that there is a common temporal relationship between the
timing of the maximum ccw thigh angular velocity and maximum knee flexion angle. They occur
in close time proximity, sometimes simultaneously. This pattern is presented in Figure 33.
Putnam (1991) showed that this pattern existed in American football punt kicking. She
suggested that the angular velocity of the thigh had the greatest effect on the rotation of the
shank when the thigh was rotating rapidly and the knee angle was at 90 degrees of flexion. The
actual timing of maximum ccw thigh angular velocity in relation to maximum knee flexion angle
was not reported by Putnam however, she did suggest that the timing of maximum knee flexion
angle corresponded with the time of maximum ccw thigh angular velocity.
-200
0
200
400
600
800
1000
1200
50 60 70 80 90 100
Ang
ular
vel
ocity
(deg
rees
/sec
ond)
Movement time (%)

102
Figure 33 The mean angular displacement curves of the knee angle (▬ ▬) and thigh (▬) angular velocity
5.1.1.3 Maximum knee flexion occurred after maximum cw rotation of the shank
The results of the present study indicated that the maximum knee flexion angle occurred 19%
movement time (mean for all subjects) after the maximum shank cw angle. This means that the
knee was continuing to flex whilst both the thigh and the shank were rotating in the ccw
direction. At this time in the movement the angular velocity of the thigh was greater than that of
the shank. The angular velocity of the thigh would have decreased the angle between the thigh
and the shank which meant that the knee was continuing to flex. A similar relationship has been
acknowledged in American football punt kicking (Putnam, 1991).
-150
0
150
300
450
600
750
-20
0
20
40
60
80
100
Thig
h an
gula
r ve
loci
ty (d
egre
es/s
econ
d)
Kne
e an
gle
(deg
rees
)
Movement time (%)
10 20 30 50 60 70 80 90 1000 40

103
5.1.2 Variables that differentiate types of kicks
5.1.2.1 Resultant foot velocity at foot – ball contact
The results of the present study indicate that the mean resultant foot velocity of the subjects was
13.8 metres/second. Some studies have reported a mean resultant foot velocity at foot – ball
contact of between 18.3 metres/second (Opavsky, 1988) for kicking in soccer and 26.5
metres/second (Plagenhoef, 1971) for punt kicking in American football. The mean resultant foot
velocity at foot – ball contact for Baker and Ball (1993) was 15.5 metres/second. These
comparisons indicate that the resultant foot velocity at foot – ball contact is higher for the
American punt kick than it is for the drop punt kick. The resultant foot velocity at foot – ball
contact for the place kick in soccer may also be slightly greater than that obtained for the drop
punt kick, but not as high as Australian Rules football. It is unclear whether the differences in
resultant foot velocity at foot – ball contact are genuine or due to differences in the types of kick
or experimental differences. The resultant foot velocity at foot – ball contact for the various types
of kick is presented in figure 34.

104
Figure 34 Resultant foot velocity at foot – ball contact results of soccer, American football and Australian Rules. The
subjects used in these studies varied from elite junior players to open age professionals.
5.1.2.2 Knee angle at foot – ball contact
The mean knee extension angle at foot – ball contact in the current study was 50 degrees. This
is similar to the knee extension angle at contact for soccer (42 degrees) and less similar to
American football (38 degrees). It is difficult to make general statements about the knee
extension angle at foot – ball contact because Baker and Ball (1993) found that the mean knee
extension angle at foot – ball contact was 30 degrees. Orchard et al. (1999), who also measured
the kinematics of the drop punt, found that the mean knee extension angle at foot – ball contact
was 50 degrees. The results of these studies are compared in figure 35 (below).
0
5
10
15
20
25
30
Australian Rules Football
– elite AFL players
(Current Study)
Soccer – club soccer
player (Opavsky, 1988)
American Football –
College Soccer Coach
(Plagenhoef, 1971)
Australian Rules Football
– elite junior players
(Baker and Ball, 1993)
Res
ulta
nt fo
ot v
eloc
ity a
t foo
t - b
all c
onta
ct (m
etre
s/se
cond
)

105
Figure 35 Knee extension angle at foot – ball contact obtained by various researchers (* American football, **
Australian Rules football, *** Soccer).
5.1.3 Magnitude of angular velocity
In figure 37 the maximum ccw shank angular velocity from the results of this study is compared
to that obtained in previous studies. The variation in the magnitude of the angular velocity
between studies is indicative of the large variation that exists in all types of kick. This makes it
difficult to distinguish one type of kick from another in terms of the maximum angular velocity of
the joints and segments.
Figure 37 shows the thigh and shank angular velocity of three types of kick. The relationship
between the thigh and shank is the same for all three, yet the magnitude of the angular velocity
differs between kicks.
0 10 20 30 40 50 60
Baker & Ball (1993)**
Orchard (1998)**
Philips (1985)*
Brown et al.(1993)***
current study**
Knee extension angle at foot - ball contact (degrees)

106
Figure 36 Thigh angular velocities for three types of kick. Kicking in Australian Rules is depicted by broken line,
American football the solid dark line and soccer the solid grey line. The Australian Football curves are
taken from the current study, the American football curves are adapted from Putnam (1983) and the
soccer curves are adapted from Dunn and Putnam (1987b).
0
500
1000
1500
2000
2500
0 20 40 60 80 100
Angu
lar v
eloc
ity (
degr
ees/
sec)
Movement time %

107
Figure 37 Shank angular velocities for three types of kick. Kicking in Australian Rules is depicted by broken line,
American football the solid dark line and soccer the solid grey line. The Australian Football curves are
taken from the current study, the American football curves are adapted from Putnam (1983) and the
soccer curves are adapted from Dunn and Putnam (1987b).
5.1.4 Phase duration
The phase defined by Orchard et al. (1999) as the wind-up had a duration of 0.1 second. The
equivalent phase in this study was called the transition and it lasted approximately 0.1 second.
The duration of the forward swing was also 0.1 second. The results of the present study found
similar durations for the equivalent transition and forward swing. The three stages (phase 1: start
of the forward (ccw) motion of the thigh to the start of the forward motion of the shank, phase 2:
the time that both the thigh and the shank were rotating in the forward direction, phase 3:
negative (cw) thigh rotation and positive (ccw) rotation of the shank) defined by Putnam (1991)
in the American football punt kick had durations of .036, 0.072, and 0.072 seconds respectively.
-1500
-1000
-500
0
500
1000
1500
2000
2500
0 20 40 60 80 100
Ang
ular
vel
ocity
(de
gree
s/se
c)
Movement time %

108
5.2 Reliability
No other studies have reported the reliability of the kinematics of kicking. Only reliable variables
(r > 0.8) were used to compare the kinematics of the skilled and less skilled groups. A subset of
reliable variables (r = 0.5 – 0.79) was also reported, but these comparisons were made with
caution because the reliability of between r = 0.5 and 0.79 is typically classified as moderate or
questionable (Vincent, 1994).
The reliability results that were reported in this study are not transferable to other studies. The
reliability is specific to the particular population sample and protocols. The subjects used in this
study were all AFL players, some skilled and some less skilled at drop punt kicking.
5.3 Variables that differentiated the skilled and less skilled
5.3.1 Movement time from maximum ccw thigh angular velocity to maximum ccw shank
angular velocity
The most significant difference between groups was found for the movement time from
maximum ccw thigh angular velocity to maximum ccw shank angular velocity. This finding
indicates that there is a greater length of time between these two events for the skilled than
there was for the less skilled. Figure 37 shows the difference between the skilled and less
skilled.

109
Figure 38 Relative timing of the maximum angular velocity of the thigh and shank.
The darker bars in the upper half of the chart represent the less skilled kickers and the lighter bars in the
lower half represent the skilled subjects. There are three bars for each group. The first represents the
time from the start of the kick to the maximum angular velocity of the thigh (less skilled 64.9%, skilled
64.3% movement time). The middle bar – which is the one of interest in this chart – represents the time
from the occurrence of the maximum angular velocity of the thigh to the maximum angular velocity of the
shank (less skilled 26.5%, skilled 33.2% movement time). The third bar represents the time from the
occurrence of maximal shank angular velocity to foot – ball contact (skilled 2.6%, less skilled 8.6%
movement time).
The maximum ccw thigh angular velocity occurred 33.2% movement time before that of the
shank for the skilled group, compared to 26.5% movement time before the shank for the less
skilled group. This reflected a difference in the timing of the maximum ccw shank angular
velocity, not the maximum ccw thigh angular velocity: the difference between groups came from
the maximum ccw shank angular velocity occurring closer to contact for the skilled subjects than
it did for the less skilled. This finding supports one of the original hypotheses that the maximum
64.3
64.9
33.2
26.5
2.6
8.6
0 10 20 30 40 50 60 70 80 90 100
Movement time (%)
Unskilled
Skilled

110
angular velocity of the skilled kickers occurs closer to foot – ball contact. Figure 37 shows that
the maximum angular velocity of the skilled subjects occurred closer to foot – ball contact.
5.3.2 Resultant foot velocity at foot – ball contact
Resultant foot velocity at foot – ball contact was selected based on the results of other studies
that showed that linear velocity of the foot and toe at foot – ball contact are predictors of ball
velocity and ultimately kicking success (Plagenhoef, 1971; Macmillan, 1975, 1976). The results
of this study indicated that the resultant foot velocity at foot – ball contact was not greater for the
skilled subjects than it was for the less skilled (skilled 13.55 (2.2), less skilled 13.90 (1.9)
metres/second, ES = - 0.17, p = 0.784).
Baker and Ball (1993) and Alexander and Holt (1973) made similar observations. Both examined
the relationship between foot speed and kicking distance and found that foot speed is not a
defining factor in the distance of a kick. Baker and Ball did find that the group of subjects who
kicked the ball a longer distance had a greater momentum of the foot at foot – ball contact. From
this finding they suggested that it was not the speed of the foot at foot – ball contact but the
momentum of the foot and the associated impact dynamics that differentiated the long distance
kickers from the short distance kickers.
5.3.3 Foot rigidity
Hay (1988) stated that the distance the ball travels is determined by the mass and initial velocity
of both the foot and the ball and their coefficient of restitution. The effective striking mass of the
foot was not measured in the current study so a conclusion pertaining to the relationship
between the impact dynamics and skillful kicking can’t be made with certainty. However, it is
appropriate here to comment on one aspect of impact dynamics that was measured in the
current study, that is, of the ankle plantarflexion angle at foot – ball contact.
One component of the impact dynamics is foot rigidity. The ankle plantarflexion angle has been
used to measure foot rigidity (Plagenhoef, 1971; Macmillan, 1975). Plagenhoef (1971) and

111
Orchard et al. (2003) suggested that the ankle plantarflexion angle is an important factor in the
transfer of momentum from the foot to the ball. The results of the current study showed that the
skilled kickers held the ankle in a more plantarflexed position than did the less skilled kickers
(skilled 46.7 degrees, less skilled 39.21 degrees, r = 0.70, ES = – 1.06, p = .071) at the time of
foot – ball contact. This result indicates that a common trait amongst skilled kickers is the
presence of a taut instep at foot – ball contact. This is one trait of skilled kickers that is often
referred to by skills coaches within the AFL.
This finding supports the suggestion made by Orchard et al. (2003) that maintaining maximal
ankle plantarflexion through foot – ball contact effectively increases the length of the shank and
the tangential velocity of the foot. Our initial hypothesis was that the skilled kickers would display
greater angular velocities of the shank at foot – ball contact. This was not the case in the current
study. The reliability of the ccw angular velocity of the shank at foot – ball contact was low (r =
0.25). This prevented - based on the criteria of this study - a comparison of the skilled and less
skilled groups. However, it is clear from the results of this study and others (Orchard, 2003) and
coaching literature (Parkin et al. 1987; Wheadon, 1997) that foot rigidity is a determinant of
skillful kicking. Hence, further investigation is required to ascertain the relative importance of foot
rigidity and shank angular velocity at foot – ball contact.
5.3.4 Movement time from maximum ccw thigh angular velocity to maximum knee flexion
angle
There was a difference between groups in the movement time between maximum ccw thigh
angular velocity and maximum knee flexion angle. There was a greater gap between the
maximum ccw thigh angular velocity and maximum knee flexion angle for the skilled group than
there was for the less skilled group. The results for the skilled group showed that the mean
maximum ccw thigh angular velocity occurred 3.98% (2.72) movement time after the maximum
knee flexion angle. The difference was 0.94%(3.86) movement time for the less skilled group.
This difference yielded a high effect size of -0.83. Anderson and Sidaway (1994) said that one
feature that is apparent in the experts' pattern is the simultaneous occurrence of maximum knee
flexion angle and the start of hip flexion. They demonstrated that the movement time between
the maximum knee flexion angle and the maximum hip flexion angular velocity changed after the

112
10 weeks of practice. Before practice maximum knee flexion angle was attained 2% movement
time after maximum hip flexion angular velocity. After practice the maximum hip flexion angular
velocity occurred 11% after maximum knee flexion angle. The significant difference in the timing
of these two events in the present study and the findings presented in the Anderson and
Sidaway (1994) study indicate that this pattern has relevance to the profile of skillful kicking.
5.3.5 Angles
Skills coaches currently suggest that a skilled kicker demonstrates greater hip extension and
knee flexion at the end of the backswing than does an less skilled kicker. In the current study the
start of the forward swing is the same as the end of the backswing. The hip extension at the end
of the backswing is the same as the maximum thigh cw angle at the end of the transition in this
study.
The finding of this study that there was no difference between groups in the orientation of the
segments at the start of the transition and the ROM of the knee extension, shank ccw rotation
and thigh ccw rotation, is contrary to the current notion of what constitutes a skillful kick. These
findings also opposed the findings of Phillips (1985) that the expert kicker displayed a greater
ROM of the shank than did a club player.
5.3.6 Angles at contact
Knee
Phillips (1985), Orchard et al. (1999, 2003) and Baker and Ball (1993) showed that the joints are
not fully extended at the time of foot – ball contact. Parkin et al. (1987) suggested that the leg
must be straight (knee angle close to 0) at foot – ball contact.
One of the initial hypotheses of this study was that the knee was not fully extended at the time of
foot – ball contact. The results of this study support this hypothesis. Full knee extension
occurred after foot – ball contact at about 150% movement time. The mean knee flexion angle at
foot – ball contact for all subjects was 50 degrees. This is the same as the angle that was shown
by Orchard et al. (1999).

113
The knee extension angle at foot – ball contact was not included in the reliable comparisons of
the skilled and less skilled subjects because r < 0.8. Its inclusion as a moderately reliable
variable (r = 0.55) showed that there was no difference in the knee extension angle at foot – ball
contact of the skilled and the less skilled group. However, the standard deviation was much
greater for the less skilled group than it was for the skilled group. The mean standard deviation
for the skilled group was 4 degrees and the mean standard deviation of the less skilled group
was 20 degrees. These results support the hypothesis that less skilled kickers demonstrate
greater between subject variation than do skilled kickers.
Thigh
The mean thigh angle at foot - ball contact was greater for the less skilled group (145.6) than it
was for the skilled subjects (149.0). Even though the difference had a large effect size (0.87, p =
0.139), a difference of 4.4 degrees does not seem to be a practically significant difference.
Shank
There was a greater difference between the two groups for the mean angle of the shank than
there was for the angle of the thigh at foot – ball contact, but this was not deemed to be
significant (p = 0.428). The mean shank angle at foot – ball contact was 93.4 degrees (5.8) for
the skilled subjects and 101.5 degrees (22.5) for the less skilled subjects.
5.3.7 Angular velocity
Thigh
Putnam (1991) suggested that a high angular velocity of the proximal thigh segment is important
for the transfer of momentum to the distal shank segment. Putnam indicated that the angular
velocity of the thigh contributes to about 50% of the angular velocity of the shank. Even though
the angular velocity of the thigh decreases late in the movement it is still important that a high

114
maximum thigh angular velocity be attained to facilitate greater angular velocity of the distal
segments.
The results of the present study indicate that the mean maximum ccw thigh angular velocity for
the skilled subjects was 733.5 degrees/second (88) and the mean maximum angular velocity of
the less skilled subjects was 666 degrees/second (123). The difference between the means of
the skilled and less skilled groups was not significant (p = 0.302) and there was a moderate
effect size of -0.63.
One of the major findings of Baker and Ball (1993) was that the subjects who were long distance
kickers had higher maximum thigh angular velocities than the short distance kickers. The
absolute angular velocity difference between the two groups used in this study and those used in
the Baker and Ball study is exactly the same. However, their difference was significant (p<0.05)
and this study was not (p = 0.302 ). They did not report the standard deviations of the groups.
The standard deviation of our groups, particularly the less skilled group, was high. This affected
the statistical significance of the difference. The difference in the level of significance of the
results can also be attributed to the low subject numbers that were used in the present study.
Baker and Ball used 22 subjects whereas 12 subjects were used in this study.
Foot
Observation of the mean foot angular velocity curves for both groups indicated that there was a
difference between groups in the lead-up to foot – ball contact (Figure 38). The angular velocity
of the skilled group increases and the angular velocity of the less skilled group begins to
decrease just prior to foot - ball contact. Despite the skilled subjects increasing the angular
velocity of the foot at the time of foot - ball contact and the less skilled subjects decreasing it,
there was no significant difference between the mean cw foot angular velocity at foot – ball
contact. The actual mean values of the two groups were 1612(261) degrees/second and
1495(346) degrees/second, respectively.

115
Figure 39 Foot angular velocity curves of a skilled and less skilled subject (+ skilled, - less skilled).
Once again, the standard deviation for the less skilled group was substantially higher than the
skilled group, and the range of scores was 1132 – 1931 degrees/second for the less skilled and
1192 – 1839 degrees/second for the skilled group. The higher variation amongst the less skilled
group is again indicative of the variability that existed within the group. This result is similar to
that of Phillips (1985), who showed that a less skilled club player demonstrated greater
variability between trials than did an expert kicker.
Knee
The results of this study indicated that the knee extension angular velocity at foot – ball contact
was greater for the skilled than it was for the less skilled (p = 0.106, p < 0.2, ES = – 0.94, r =
0.62). This finding, in conjunction with the observation that the skilled kickers continue to
increase the angular velocity of the foot at the time of foot – ball contact, indicates that the skilled
-500
0
500
1000
1500
2000
2500
50 60 70 80 90 100
angu
lar v
eloc
ity (d
egre
es/s
econ
d)
Movement time (%)

116
kickers do continue to extend the knee through contact. The less skilled kickers appear to
reduce the angular velocity of the shank which results in a lower knee extension angular velocity
at foot – ball contact. This finding is in accordance with the initial hypothesis of this study and
the results presented by Baker and Ball (1993).
5.4 Summary
5.4.1 General description of kicking
Magnitude
• The maximum angular velocity of the shank (1402 degrees/second) was higher than that of
the thigh (805 degrees/second).
• The mean knee extension angle at foot – ball contact was 50 degrees.
Timing
• The two phases – transition (time from maximum thigh cw angle to maximum shank cw
angle) and the forward swing (time from the maximum shank cw angle to foot – ball contact)
- were of equal duration.
• During the transition the knee flexion angular velocity peaks. During the early part of the
forward swing the angular velocity of the knee changes from flexion to extension. The
maximum angular velocity of the thigh also occurs at this time.
• Thigh ccw angular velocity decreases during the transition.
• Maximum shank ccw, foot cw and knee extension angular velocity occur at around the same
time (at foot – ball contact).
• Maximum knee extension angle occurs well after foot – ball contact (142% movement time).
5.4.2 Comparison of skilled and less skilled
The most reliable and significant difference between the groups was in the analysis of the
temporal data. The difference in the relative time between the maximum ccw thigh angular

117
velocity and the maximum ccw shank angular velocity was the most statistically significant
difference between the skilled and less skilled kicking groups.
Differences between groups for reliable variables (ICC > 0.80).
1) time between the maximum ccw shank angular velocity and the maximum ccw thigh angular
velocity. The analysis revealed that the mean % movement time from maximum ccw thigh
angular velocity to maximum ccw shank angular velocity for the skilled subjects (33.2%
movement time) was 6.7% greater than the mean for the less skilled subjects (26.5%
movement time).
2) the mean % movement time from maximum ccw thigh angular velocity to maximum knee
flexion angle which was 3% greater for the skilled subjects (3.9% movement time) than it
was for the less skilled subjects (0.9% movement time).
3) The thigh of the skilled kickers was orientated 4 degrees further in the ccw direction than that of the less skilled kickers.
Differences between groups for moderately reliable variables (ICC 0.50 – 0.79).
1) The mean knee extension angular velocity at foot - ball contact was 117.9
degree/second greater for the skilled (1110.4 degrees/second) than it was for the less skilled
(992.5 degrees/second) kickers.
2) The mean plantarflexion angle at foot – ball contact was 7.5 degrees greater for the
skilled (46.7 degrees) than it was for the less skilled (39.2 degrees).
5.5 Limitations
The sample size that was used in the present study limited the outcomes. The small sample size
meant that the means of the groups were more likely to be affected by outliers. There were
several cases where a high or low extreme score pulled the mean of the group in that direction.
These extreme scores affected the reliability and comparison of the skilled and less skilled. One
such example is the resultant foot velocity at foot – ball contact. In this instance one extreme
score lowered the reliability of this variable.

118
5.5.1 Reliability
The decision to only analyse variables that were reliable meant that the number of variables that
could be compared between groups was limited. 61% of the variables measured were reliable.
No other study has reported the reliability of the methodology. Hence, the variables that have
been used by other researchers have not been limited in this way. The reliability of the results of
other kicking research is unknown. Since they may be unreliable, comparisons may have been
made with less confidence than those of the present study.
Although the decision to use r > 0.8 as the cut-off for reliability was a limitation, it also provided
greater certainty that all the variables used to compare the skilled and less skilled were reliable.
5.6 Future studies
5.6.1 Phases
The kick was divided into two phases in the current study, the transition and the forward swing.
The transition commenced at maximum thigh cw angle and finished at the time of maximum
shank cw angle. The forward swing began at this time and ended at foot – ball contact.
The two phases of the transition and the forward swing could have been divided into 3 phases:
Phase one: maximum thigh cw angle to maximum shank cw angle;
Phase two: maximum shank cw angle to maximum knee flexion angle; and,
Phase three: maximum knee flexion angle to foot - ball contact.
Putnam (1991) used similar definitions to define the phases of the kick. By her definition phase
one began when the positive (ccw) angular acceleration of the thigh began. Phase two started
when the positive angular acceleration of the shank began. Section 3 began when the thigh
started to decelerate; this time corresponded with maximum ccw thigh angular velocity.

119
The phase that was referred to as the forward swing in the present study is exactly that - a
phase where both the shank and the thigh are rotating in the forward direction (ccw). However, it
is suggested that future kicking research separate the transition and forward swing into three
phases. In this instance, a definition similar to that used by Putnam (1991) would be appropriate.
This would ensure that the maximum knee flexion angle and its relationship to the start of the
ccw motion of the shank is acknowledged.
The relative timing of the start of the ccw rotation of the shank and the time of maximum knee
flexion angle may be an important pattern that needs to be acknowledged when the kicking
motion is being separated into phases.
5.6.2 Reliability
The reliability of some variables was different for absolute and normalised time. In general the
variables were more reliable when they were reported in normalised time. One example of this is
the reliability of the timing of the maximum angular positions. Of the five variables only one was
reliable (r > 0.8) when the results were reported in absolute time. When the results were
reported in relative time there were four reliable variables (r > 0.8). The reverse of this occurred
with the timing of maximum angular velocity. Three variables were reliable in absolute time and
only one was reliable in relative time (r > 0.8). When comparing the intersegmental timings the
relative variables were more reliable than the absolute variables. In this study relative time
variables were more reliable. Hence, reporting temporal variables in relative time may be the
most reliable technique to use in future research.
5.6.3 Measures of kicking success
No direct measures of kicking success such as accuracy or distance were used in this study.
Resultant foot velocity at foot – ball contact was the only indirect measure of kicking success
that was used. No direct measures of kicking success were included because the data was
collected in a laboratory.
Future studies that compare skilled and less skilled kickers should perform a more
comprehensive analysis of the nature of the foot - ball contact. Using a more direct method

120
would have provided an objective comparison of the success of each kick and would have
facilitated more accurate selection of the best trials for each subject.
5.6.4 Impact dynamics
The skilled subjects used in this study could all kick the ball further than 50 metres which,
compared to most kickers, is a long kick. There are two aspects of a skillful kick – accuracy and
distance. Whilst filming the trials it was noted that some skilled subjects had a fast swing and
others had a slower swing. The results indicated that the subjects who had the slower swings
also had the lowest foot angular velocities at foot – ball contact. Interestingly, the two subjects
who appeared to have the fast swings are known for the distance that they attain with their kicks
and the two subjects who had the slower swings are more renowned for their accuracy. It would
be interesting to measure the impact dynamics to ascertain if there was a difference in the
nature of the impact between the two groups, fast and slow swings. There was no difference in
the angular velocity of the distal segments at foot – ball contact so it may have been the nature
of the foot – ball contact that differentiated the two groups. No further comment can be made on
this because neither kicking distance, accuracy nor impact dynamics were measured.
Even though the skilled subjects used in this study are renowned for their kicking prowess, it
would be beneficial to identify different types of skillful drop punt kicking. Various styles may be
classified on the basis of common patterns in the kinematic profile.
Future researchers should consider comparing the profiles of skillful kickers to ascertain the
styles and the commonalities that exist amongst them. Future researchers are also advised to
use a more specific criteria for inclusion into the skilled kicking group to avoid mixing players
who are skilled and those who are less skilled, but for different reasons.
5.6.5 Coaching
Kicking is a complex motion that requires a high level of coordination. For this reason it may be
difficult to train. However, Anderson and Sidaway (1994) demonstrated that 10 weeks of regular
practice made the profiles of novice kickers become more similar to that of the expert kickers.
The extent to which practice would change the profile of elite kickers who need to improve their

121
kicking remains to be seen. More research is required to 1) clarify the aspects of successful
kicking, and 2) incorporate these features into a practicable intervention strategy for players and
coaches, and 3) measure the impact that practice can have on the kicking success of elite and
sub elite footballers.
5.7 Implications for coaching
Three major coaching points can be extracted from the results of the present study. Players who
endeavour to enhance their kicking performance should 1) optimise the timing of the rotation of
the thigh in relation to the shank 2) increase the angular velocity of the thigh, and 3) establish
and maintain a maximum position of ankle plantarflexion throughout foot – ball contact.
If the findings of this study were to be implicated in the coaching of kicking technique then the
outcomes of this study would need to be presented in a format that was simple for the players to
understand and apply. Explanation of complex sequential patterns would not be practicable.
However, simple pointers such as the two that were mentioned in the previous paragraph could
serve as simple and effective advice to kickers. The PDS and other biomechanical theories do
not need to be introduced to a player however, simple observation and instruction could result in
greater utilisation of the benefits of the PDS.
5.8 Conclusion
It is a reliable and significant conclusion that skilled and less skilled kickers were differentiated
by the relative timing of the maximum angular velocity of the proximal and distal segments.
There was no difference in the magnitude of either the angles or angular velocities. Hence, the
two groups were differentiated by the timing of key events, not the magnitude of the velocity of
the foot at contact or the maximum angular velocities of the segments and joints.

122
6.0 REFERENCES
Aitcheson, I. and Lees, A. (1983) A biomechanical analysis of place kicking in rugby union
football. Journal of Sports Sciences, 1, 136 – 137.
Alexander, A. and Holt, L. E. (1973) Punting – A cinema – computer analysis. Scholastic Coach,
43, 14 – 16. Cited in: Elliott, B. C., Bloomfield, J. and Davies, C. M. (1980) Development of the
punt kick: A cinematographic analysis. Journal of Human Movement Studies, 6, 142 – 150.
Anderson, D, I. and Sidaway, B. (1994) Coordination changes associated with practise of a
soccer kick. Research Quarterly for Exercise and Sport, 65 (2), 65 – 72.
Atkinson, G. and Nevill, A, M. (1998) Statistical methods for assessing measurement error
(reliability) in variables relevant to sports medicine. Sports Medicine, 26 (4), 217 – 238.
Baker, J. and Ball, K. (1993) Technique considerations of the drop punt. Unpublished. Australian
Institute of Sport, Belconnen.
Barfield, W. R. (1998) The biomechanics of kicking in soccer. Clinics in Sports Medicine, 17 (4),
711 – 728.

123
Barfield, W. R., Kirkendall, D. T. and Yu, B. (2002) Kinematic instep kicking differences between
elite female and male soccer players. Journal of Sports Science and Medicine, 1, 72 – 79.
Bober, T., Putnam, C. A. and Woodworth, G. (1987) Factors influencing the angular velocity of a
human limb segment. Journal of Biomechanics, 20, 511 – 521.
Brown, E. W., Wilson, D. J., Mason, B. R., and Baker, J. (1993) Three dimensional kinematics of
the direct free kick in soccer when opposed by a defensive wall. In: J. Hamill, T. R., Derrick, & E.
H. Elliott (Eds.), Biomechanics In Sports XI, International Society of Biomechanics in Sports,
Amherst, 334-338.
Bunn, J. W. (1972) Scientific Principles of Coaching. Prentice - Hall, New Jersey.
Cabri, J., De Proft, E., Dufour, W. and Clarys, J.P. (1988) The relation between muscular
strength and kick performance. In: T. Reilly, A. Lees, K Davids and W.J. Murphy (Eds), Science
and Football, E & FN Spon, London, 186 – 193.
Cohen, J. (1990) Things I have learned (so far), American Psychologist, 45, 1304-1312.
Cohen, J. (1988) Statistical Power Analysis for the Behavioral Sciences (2nd ed.), Erlbaum, New
Jersey.
Davids, K., Lees, A. and Burwitz, L. (2000) Understanding and measuring coordination and
control in kicking skills in soccer: Implications for talent identification and skill acquisition. Journal
of Sports Sciences, 18, 703 – 714.
Day, P. (1987) A biomechanical analysis of the development of the mature kicking pattern in
soccer. Unpublished BSc thesis, Liverpool Polytechnic. Cited in: Lees, A. and Nolan, L. (1998)
The biomechanics of soccer: A review. J. Sports Sciences, 16, 211 – 234.
De Proft, E., Cabri, J., Dufour, W. and Clarys, J.P. (1988) Strength training and kick performance
in soccer. In: Reilly, T., Lees, A, Davids, K. and Murphy (Eds), Science and Football. Free
University Press, Amsterdam, 787 – 790.

124
Dunn, E.G. and Putnam, C. A. (1987a) Kicking speed and lower extremity kinematics. In:
Terauds, J., Gowitzke, B. A. and Holte, L. (Eds), Biomechanics in Sports III & IV. Academic
publishers, Delmar, 154 – 160.
Dunn, E. G. and Putnam, C. A. (1987b) The influence of lower leg motion on thigh deceleration
in kicking. In: de Groot, G., Hollander. P., Huijing, P. A. and van Ingen Schenqu, G. J. (Eds),
Biomechanics XI-B, Free Press, Amsterdam, 787-790.
Dyson, G. H. G. (1977) The Mechanics of Athletics (7th Ed). Hodder and Stoughton, Toronto.
Elliott, B., Marsh, T. and Overheu, P. (1989) A biomechanical comparison of the multisegmental
and single unit topspin forehand drives in tennis. International Journal of Sport Biomechanics. 5,
350 – 364.
Enoka, R. M. (2002) Neuromechanical Basis of Kinesiology (3rd Ed). Human Kinetics,
Champaign, IL.
Franks, B. D., and Huck, S. W. (1986) Why does everyone use the .05 significance level?
Research Quarterly for Exercise and Sport, 57, 345 – 249.
Hay, J. G., and Reid, J. G. (1988) Anatomy, Mechanics, and Human Motion (2nd Ed). Prentice
Hall, New Jersey.
Huang, T. C., Roberts, E. M. and Youm, Y. (1982) Biomechanics of kicking. In: Ghista, D. N.
(Ed), Human Body Dynamics. Clarendon Press, Oxford, 409 – 443.
Isokawa, J.K. (1981) Kinematic analysis of kicking in soccer. Proceedings of Japanese Physical
Education, 444. Cited in: Isokawa, M. and Lees, A. (1988) A biomechanical analysis of the
instep kick motion in soccer. In: Reilly, T., Lees, A., Davids, K. and Murphy, W. J. (Eds), Science
& Football. E & FN Spon, London, 449-455.

125
Isokawa, M. and Lees, A. (1988) A biomechanical analysis of the instep kick motion in soccer.
In: Reily, T., Lees, A., Davids, K. and Murphy, W. J. (Eds), Science & Football. E & FN Spon,
London, 449-455.
Lees, A. and Nolan, L. (1998) The biomechanics of soccer: A review. Journal of Sports
Sciences, 16, 211 – 234.
Luhtanen, P. (1988). Kinematics and kinetics of maximal instep kicking in junior soccer players.
In: Reilly, T., Lees, A., Davids, K. and Murphy, W. J. (Eds), Science & Football. E & FN Spon,
London, 441-448.
Macmillan, M. B. (1975) Determinants of the flight of the kicked football. The Research
Quarterly, 46 (1), 48 - 57.
Macmillan, M. B. (1976) Kinesiological determinants of the path of the foot during the football
kick. The Research Quarterly, 47 (1), 33 - 40.
McCrudden, M. and Reilly, T. (1993) A comparison of the punt and the drop - kick. In Reilly, T.,
Clarys, J. and Stibbe, A. (Eds), Science & Football II. E & FN Spon, London, 362-366.
McLean, B. D. and Tumilty, D. (1993). Left – right asymmetry in two types of soccer kick. British
Journal of Sports Medicine, 27, 260 – 262.
Milburn, P. D. (1982) Summation of segmental velocities in the golf swing. Medicine and Science
in Sports and Exercise, 14, 60 – 64.
Narici, M., Sirtori, M. and Mognoni, P. (1988) Maximal ball velocity and peak torques of hip flexor
and knee extensor muscles. In: Reilly, T., Lees, A., Davids, K. and Murphy, W. J. (Eds), Science
& Football. E & FN Spon, London, 429-433.
Opavsky, P. (1988) An investigation of linear and angular kinematics of the leg during two types
of soccer kick. In: Reilly, T., Lees, A., Davids, K. and Murphy, W. J. (Eds), Science & Football. E
& FN Spon, London, 460-467.

126
Orchard. J., Walt, S., McIntosh, A. and Garlick, D. (1999) Muscle activity during the drop punt
kick. Journal of Sports Science, 17 (10), 837 – 838.
Orchard. J., McIntosh, A., Landeo, R., Savage, T. and Beatty, K. (2003) Biomechanics of kicking
in the AFL with respect to the development of quadriceps strains. Unpublished. Report for the
AFL research and development board.
Parkin, D., Smith, R. and Schokman, P. (1987) Premiership football; how to coach, train and
play Australian football. Hargreen, Melbourne.
Phillips, S. J. (1985) Invariance of elite kicking performance. In: Winter, D. A., Norman, R. W.,
Wells, R. P., Hayes, K. C. and Patla, A. E. (Eds), Biomechanics IX-B. Human Kinetics
Publishers, Inc., Champaign, IL, 533- 538.
Plagenhoef, S. (1971) Patterns of Human Motion: A Cinematographic Analysis. Prentice - Hall,
New Jersey.
Putnam, C. A. (1983) Interaction between segments during a kicking motion. In: Matsui, H. and
Kobayashi, K. (Eds), Biomechanics VIII-B. Human Kinetics Publishers, Inc., Champaign, IL,
688-694.
Putnam, C. A. and Dunn, E. G. (1987) Performance variations in rapid swinging motions: Effects
on segment interaction and resultant joint moments. In: Jonsson, B. (Eds), Biomechanics X-B.
Human Kinetics Publishers, Inc., Champaign, IL, 661 - 665.
Putnam, C. A. (1991) A segment interaction analysis of proximal -to- distal sequential segment
motion patterns. Medicine and Science in Sports and Exercise, 23, 130 - 144.
Putnam, C. A. (1993) Sequential motions of body segments in striking and throwing skills –
descriptions and explanations. Journal of Biomechanics, 26, 25 – 135.
Robertson, D. G. E. and Mosher, R. E. (1985) Work and power of the leg muscles in soccer
kicking. In: Winter, D. A., Norman, R. W., Wells, R. P., Hayes, K. C. and Patla, A. E. (Eds),
Biomechanics IX-B. Human Kinetics Publishers, Inc., Champaign, IL, 533- 538.

127
Rodano, R. and Tavana. (1993) Three dimensional analysis of the instep kick in professional
soccer players. In: Reilly, T., Lees, A., Davids, K. and Murphy, W. J. (Eds), Science & Football.
E & FN Spon, London, 357 - 361.
Saliba, L. and Hrysomallis, C. (2001) Isokinetic strength related to jumping but not kicking
performance of Australian footballers. Journal of Science and Medicine in Sport, 4(3), 336 – 347.
Speed, H. D., and Anderson, M. B. (2000) What Exercise and Sports Scientists don’t
understand. Journal of Science and Medicine in Sport, 3 (1), 84 – 92.
Thomas, J. R., Salazer, W. and Landers, M. (1991) What is Missing in p < .05? Effect Size.
Research Quarterly for Exercise and Sport, 62 (3), 344 – 348.
Togari, H. (1972) Kinesiological study of soccer (1). Japanese Journal of Physical Education
16(5), 259 – 264. Cited in: Isokawa, M. and Lees, A. (1988) A biomechanical analysis of the
instep kick motion in soccer. In: Reily, T., Lees, A., Davids, K. and Murphy, W. J. (Eds), Science
& Football. E & FN Spon, London, 449-455.
Van Gheluwe, B., De Ruysscher, I. and Craenhals, J. (1985) The kinematics of the service
movement in tennis: A three - dimensional cinematographical approach. In: Winter, K. A.,
Norman, R. W., Wells, R. P., Hayes, K. C. and Patla, A. E. (Eds), Biomechanics IX – B. Human
Kinetics Publishers, Inc., Champaign, IL, 521 – 526.
Vincent, W.J. (1994) Statistics in kinesiology. Human kinetics, Champaign, IL.
Wahrenberg, H., Lindbeck, L. and Ekholm, J. (1978) Knee muscular moment, tendon tension
force and EMG during a vigorous movement in man. Scandanavian Journal of Rehabilitation
Medicine, 10, 99 - 100.
Wheadon, D. (1997) Football Skills: How to Play The Game. Champion, Melbourne.
Wickstrom, R.L. (1975) Developmental kinesiology. Exercise and Sports Science Reviews, 3,
163 – 192.

128
Winter, D. A. (1990) Biomechanics and Motor Control of Human Movement (2nd Ed). John Wiley
and Sons, Inc, Canada.
Wrigley, T. (1998) ICC and SEM macro for Microsoft Excel. School of Human Development,
Victoria University of Technology, Melbourne.

129
Appendices
• be fitted with reflective markers (these foam balls are stuck to your skin on the center of your hip, knee, ankle, heel and toe joints. They are easily removed and will not irritate your skin).
APPENDIX 1
Victoria University of Technology
Standard Consent Form for Subjects Involved in
Research
INFORMATION TO PARTICIPANTS:
We would like to invite you to be a part of a study into biomechanics of the drop punt.
The aim of this research is to compare the kinematics of skilled and less skilled kickers. All the data that is used for this project will be collected in the laboratory. Twelve subjects will be filmed performing drop punt kicks of the football into a net that is about 10 metres in front of them.
More specifically your participation as a subject will require you to;
• participate in a 5 minute warm up
• perform 10 maximal effort drop punt kicks
You need to wear,
• football/running shorts
• grasscat football boots with no socks.
The potential risk
This is a low risk project. However there is a slight risk of musculotendonous injury.
CERTIFICATION BY SUBJECT

130
I,
____________________________________________________________________________
of ___________________________________________________________________________
certify that I am at least 18 years old* and that I am voluntarily giving my consent to participate in
the experiment entitled: KINEMATICS OF SKILLED AND LESS SKILLED KICKING IN ELITE
AUSTRALIAN RULES FOOTBALL being conducted at Victoria University of Technology by:
Sam Millar.
I certify that the objectives of the experiment, together with any risks to me associated with the
procedures listed hereunder to be carried out in the experiment, have been fully explained to me
by Sam Millar and that I freely consent to participation involving the use on me of these
procedures: Preparation and fitting of markers, warm up and 10 kicks into a net.
I certify that I have had the opportunity to have any questions answered and that I understand
that I can withdraw from this experiment at any time and that this withdrawal will not jeopardise
me in any way.
I have been informed that the information I provide will be kept confidential.
Signed: ................................................. }
Witness other than the experimenter: } Date: ....................
................................................................}

131
Any queries about your participation in this project may be directed to the researchers (Sam
Millar, ph.0418 898 878; Tim Wrigley, ph. 9248 1119). If you have any queries or complaints
about the way you have been treated, you may contact the Secretary, University Human
Research Ethics Committee, Victoria University of Technology, PO Box 14428 MC, Melbourne,
8001 (telephone no: 03-9688 4710).
[*please note: where the subject/s is aged under 18, separate parental consent is required;
where the subject is unable to answer for themselves due to mental illness or disability, parental
or guardian consent may be required.