the philippines a review of external debt - world bank · pdf filethe philippines a review of...
TRANSCRIPT

Report No. 4912-PH FILE COPY
The PhilippinesA Review of External Debt
November 2, 1984
East Asia and Pacific Regional Office
FOR OFFICIAL USE ONLY
Document of the World Bank
This document has a restricted distribution and may be used by recipientsonly in the performance of their official duties. Its contents may not otherwisebe disclosed without World Bank authorization.
Pub
lic D
iscl
osur
e A
utho
rized
Pub
lic D
iscl
osur
e A
utho
rized
Pub
lic D
iscl
osur
e A
utho
rized
Pub
lic D
iscl
osur
e A
utho
rized
CURRENCY EQUIVALENTS
US$1.0 = P 20.0P 1.00 = US$0.05
ABBREVIATIONS
BOP - Balance of Payments
CFBP - Consolidated Foreign Borrowing ProgramD/As - Documents Against AcceptanceDBP - Development Bank of the PhilippinesDOD - Debt Outstanding and DisbursedDRS - Debtor Reporting System (World Bank)DSC - Debt Servicing CapacityDSR - Debt Service Ratio
FCDU - Foreign Currency Deposit UnitICc - Investment Cordination CommitteeICOR - Incremental Capital-Output RatioIMF - International Monetary FundMEDIAD - Management of External Debt and Investment Accounts Department,
Central BankMlT - Medium- and Long-termM V - Manufacturing Unit ValueNEDA - National Economic and Development AuthorityNIDC - National Industrial Development CorporationO/As - Open AccountsOBU - Offshore Banking UnitOIDC - Oil Importing Developing CountryPDCP - Private Development Corporation of the PhilippinesPNB - Philippine National BankSAL - Structural Adjustment LoanSMNP - Subcommittee on Major National Projects
FOR OFFICIAL USE ONLY
PREFACE
This report presents the findings of a mission which visited Manilain April 1983 to study the size, structure, and policy implications of thecountry's rapidly growing external debt. The mission consisted of SarsharKhan (Chief), Jayati Datta Mitra, Beatriz Florendo (Bank staff), andChristopher Browne (IMF).
The study was originally designed for the internal use of theGovernment and the Bank to provide policy guidance. The analysis for thestudy was, therefore, completed in mid-1983 and its results were discussedwith Government officials in September. Subsequently, because of the balanceof payments crisis in late 1983 and wider interest in the study, it was agreedwith the Government that the study may be finalized and circulated morewidely. The full report was discussed with Government officials in March 1984and the final draft shown to them in July-August 1984.
The economic situation has changed considerably since the completionof the major part of the analysis in 1983. First, the balance of paymentscrisis occurred in October 1983 and attempts to resolve it are still con-tinuing. Second, the data on the balance of payments, reserves, and debt cameunder closer scrutiny and are being revised; some revised data have recentlybecome available. The economic situation is still fluid and economic pros-pects not yet clear. These developments are being covered in detail in theBank's Country Economic Memorandum currently under preparation. As such, acomplete revision of this report has not been attempted; its focus remains onhe analysis of developments from mid-1970s through 1982. However, reviseddata (as of August 1984) have been used wherever possible, and the 1983 crisis,together with its policy implications, has been discussed briefly.
The report consists of summary and conclusions and the mainreport. Chapter 1 of the main report reviews the economic background and theemergence of current account deficits in the mid-1970s. Chapter 2 analysesthe growth and structure of external debt and the resulting debt serviceburden. Chapter 3 relates the external borrowing of the public and privatesectors to their pattern of investment and savings. Chapter 4 reviews theinstitutional framework and performance of the country's debt management sys-tem. Chapter 5 draws implications of the debt analysis and recent economicevents and suggests policy and institutional improvements.
This document has a restricted distribution and may be used by recipients only in the performance oftheir official duties. Its contents may not otherwise be disclosed without World Bank authorization.

I

TABLE OF CONTENTS
Page No.
PREFACE ........................ .... .................................
SUMMARY AND CONCLUSIONS .......... ... ... ... .. ........................ ........ i-vi
1. SETTING THE STAGE .......................................... o ................... 1
Economic Background ...................... ....... , ..... ........... 1Sources of Change in Current Account Deficits .................... 2Macroeconomic Adjustments .*.................... ..... . ..... 5Financing the Current Account Deficit ......... ................... 5
2. TRENDS IN EXTERNAL DEBT ....................... . ................. 6
An Overview ................................... ,,.................. 6The Evolution of External Debt ......................... 6Assessing Debt Levels .................................................. 10Interpreting the Trends in Philippine Exposure .................. 12Financing Patterns .. ......... .......................... .... ............. . 14The Structure of Borrowers ....... ............. * ........ .., 19The Structure of End-Users ............... ..... ................... 21Debt Service Obligations ...... ........... ......... . ........................ 24
3 * INVESTMENT AND SAVINGS ..................... ,. . ..... 28
Investment and Savings Behavior .... .............. . .... 28Resource Use by the Public Sector ................................ 30
4. DEBT MANAGEMENT ................... . ...... *.... ............. 37
The Institutional Framework * ... ...... ................ ..... .*.. 37MEDIAD's Functions .......................... . .38................ .. 38ICC and Macroeconomic Management .............. . .................. 42Debt Management: Scrutinizing the Record ......................... 43
5. IMPLICATIONS FOR THE FUTURE ............................... ..... 46
Macroeconomic Policy and Foreign Borrowing ....................... 46Institutional Framework ... .. . ... ......................... o....*.*... 48
STATISTICAL APPENDIX .................. .............. * . 51

Page No.
LIST OF TEXT TABLES
Table 1.1: Sources of Change in Current Account Deficits, 1977-82 4Table 1.2: Growth Rates of Consumption, Investment, and GNP ........ 5Table 2.1: Structure of Debt,1970-82 ........................... 7Table 2.2: External Debt and Banking System Liabilities, 1976-82 9Table 2.3: Debt Indicators ......................................... 11Table 2.4: Share of Banks and Other Financial Institutions in
Official Short-Term DOD .......... . ..............0. 13Table 2.5: Structure of MLT Debt by Creditor ............. . ........ 15Table 2.6: Distribution of Public Sector Debt
By Concessional/Non-Concessional Categories ........ 16Table 2.7: Currency Distribution of Public Sector Commitments ...... 18Table 2.8: Structure of MLT Debt by Borrower . ................. 20Table 2.9: Total Outstanding Borrowings Under the CFBP ... o...o.... 22Table 2.10: Share of the Private Sector as an End-User in MLT Debt ... 23Table 2.11: Official Non-Oil Short-Term Debt . ................ 24Table 2.12: External Debt Service Ratios, 1977-82 ... ................. 26Table 2.13: Public Sector Debt Service Paymients .... ...... .......... 27Table 3.1: Investment and Savings ..o ................... 29Table 3.2: Investment and Savings by Sectors ......... .......... 31
Table 3.3: Financing of National Government Capital ExpendituresEquity Contributions and Net Lending .............. ..... 33
Table 3.4: Major Non-Financial Public CorporatioDns: Summaryof Operations ......................................... 34
Table 3.5: GDP Growth Rates and Economy-Wide ICORs ......... o..... 36Table 4.1: Refinancing, Restructuring and Repayment of Principal,
1976-82 ..... . 40

SUMMARY AND CONCLUSIONS
In recent years, the Philippine economy has had to weather a numberof adverse exogenous developments: the second round of oil price increases of1979-80, a sharp deterioration in the terms of trade, international recession,and an associated drop in the demand for Philippine exports. These develop-ments, combined with expansionary demand policies, led to an increase in thecountry's current account deficit and a rapid accumulation of external debt.Recognizing the emerging problems, the Philippine Government invited a WorldBank mission to examine the growth and structure of the Philippine debt,analyze the policy implications of the country's debt burden, and assess theinstitutional framework for debt management.
Growth and Structure of External Debt
The Philippine external debt has grown tremendously since the early1970s. Medium- and long-term (MLT) debt increased six times during 1970-82.Its ratio to GNP increased from 26% to 33%. During the period 1976-82 (forwhich the relevant data are available) the ratio of total debt (including allIMF obligations and net external liabilities of the banking system) to GNPincreased from 24% to 49%, and the ratio of this debt to exports increasedfrom 123% to 239%. Both of the end-period ratios were too high and affectedoutside perceptions of the country's creditworthiness.
At the same time, the country's debt structure became increasinglyskewed toward short-term debt, and the share of financial institutions in thecredit mix rose markedly. By 1982, the share of short-term debt and grossbanking system liabilities had risen to nearly 47% of the total, and about 68%of total obligations were owed to banks and financial institutions. Thisgreatly increased the vulnerability of the country to short-run internationalmarket developments. In addition, the Philippines' dependence on creditrollovers increased at a time when international banks became increasinglyconcerned about their exposure in developing country borrowers, including thePhilippines. Two implications of the above are noteworthy. The predominanceof financial institutions in the creditor mix led to a rise in the share ofnon-concessional debt in total commitments with the consequent rise in thecountry's interest service obligations. Moreover, the continuing use of someof the short-term credit for financing working capital needs, normally not acause for undue alarm, rendered non-bank Philippine borrowers vulnerable todislocations in productive activity in the face of possible disruptions incredit rollovers.
The rapid growth of total external debt in recent years, thepreponderance of financial institutions in the credit mix, and the decelera-tion in export growth led to a sharp deterioration in the debt service ratio(DSR). Between 1977 and 1982, the DSR for MLT debt increased from 12% to 27%and for the total debt from 15% to 38% (the latter DSR includes MLT debtservice, IMF repurchases and charges, and interest payments on revolvingshort-term debt and on gross banking system liabilities).
t- ii -
Macroeconomic Aspects of Debt
The underlying reasons for the massive growth of the Philippineexternal debt can be traced partly to external factors and partly to domesticpolicies.
After the payments crisis of 19693-70, and the corrective measurestaken in the form of devaluation and an imlproved debt management system, thecountry's current account deficit was roughly in. balance during 1970-74.Helped by the improved terms of trade, the country even ran a current accountsurplus in 1973. However, the account became negative in 1974, and thedeficit quickly expanded, reaching 6% of GNP in 1980-81 and over 8% in 1982.On the external side, the most immediate cause for these large deficits was aloss in the terms of trade of 60% during 1974-77 and (after a gain of 15% inthe next two years) 39% in 1979-82. In the latter period alone, this lossaccounted for about $1.4 billion increase out of a total of $2.4 billionincrease in the current account deficit.l/ Another $1.7 billion was accountedfor by increased interest payments. Thus, it appears that the externalfactors were mainly responsible for the increase in the current accountdeficit (and consequent debt accumulation) in recent years. However, a closerexamination shows that domestic policy variables, besides the longstandingstructural problems of the economy, also contributed to these deficits.First, the import volume increased substantially during 1978-82, contributingabout $1.8 billion to the increase in the current account deficit andoffsetting an otherwise good performance oF exports (whose volume increase hada positive contribution of nearly $1.3 billion). This increase in imports wasdue to a number of factors, including the easy availability of private foreigncredit, appreciation (by about 20%) of real effective exchange rate, andmaintenance of relatively high investment and consumption levels.
The domestic investment level 2/ has remained high relative to bothGNP and national savings (and relative to the rates in other countries). Theinvestment/GNP 3/ ratio, which had remained around 21% during 1970-73, jumped
1/ The various components of the increase in the current account deficitdiscussed here do not add up to $2.4 billion because of the small surplusexperienced on account of services (excluding interest payments) andtransfers.
2/ Refers to total investment. The fixeBd investment ratio shows a similartrend.
3/ It is believed that the investment and savings data are overstated in thePhilippines. We understand that these are being scrutinized and might berevised downwards. The gap is, however, riot likely to be significantlyaffected.
- iii -
to 27% in 1974 and to over 30% in subsequent years. But the national savingsrate lagged behind and the investment-savings gap expanded from less than 1%to 5% or more, translating into the current account deficits discussed above.
A major part of this investment-savings gap was attributable to thepublic sector (in fact, to public corporations) which ran increasingly largedeficits during the period. The external debt data show that the nationalgovernment and public corporations were also expanding their share in the useof foreign funds during 1978-82.
Although investment rates had been reasonably high in the early1970s and jumped up significantly in the mid-1970s, they do not appear to havecontributed sufficienty to higher growth rates towards the end of the 1970s.This was at least partly due to the long gestation periods of a large numberof infrastructure projects undertaken during the 1970s. The ICOR has remainedhigh, growth rates have dropped (in part on account of the internationalrecession and low export demand), and debt servicing capacity expandedinsufficiently, contributing to the current payments crisis. These issuesinvolve macroeconomic policies beyond the scope of this study, but they under-score the need for the Government to reexamine the pattern and efficiency ofinvestment, and the relationship between debt management and economicmanagement.
Even if investment efficiency had been higher, the country couldstill run into difficulty for lack of appropriate response to the worsenedinternational financial climate. The sizeable domestic resource gap discussedabove continued to be filled in by foreign resources at an increasing cost andrisk. With the decline in international inflation rates during the 1980s,real interest rates became positive and high, and the country could no longerbenefit from the eroding real burden of foreign debt. Simultaneously, becauseof the changed external environment, the country had to depend increasingly oncommercial loans, variable interest loans, and short-term financing. Theircombined effect was that the total debt service increased dramatically and thecountry became increasingly dependent on credit rollovers and vulnerable toshort-term changes in international financial markets.
Under the prevailing external economic conditions, more active andstronger domestic adjustment policies were needed. Some adjustment took placeduring 1980-82 when the growth rates of GNP, investment, and consumptionfell. But the adjustment was not sufficient to prevent an expanding currentaccount deficit. The public sector remained largely unresponsive to thechanged situation, failing to curtail investment sufficiently or generateadequate resources.
Debt Management
Following the 1969-70 crisis, the Philippines had established acompetent institutional framework for external borrowing and debt manage-ment. In fact, this framework is considered to be among the better ones inLDCs. The Management of External Debt and Investment Accounts Department(MEDIAD) in the Central Bank collected and categorized data for both MLT andshort-term debt. It was also responsible for screening applications for

- iv -
foreign borrowing, determining borrowing terms, monitoring debt service liabi-lity (as defined by law), and formulating future borrowing strategies. Manyof these functions, especially regarding data management, were performed com-petently. But the system proved to be inadequate in the changed circumstancesof the early 1980s. It was especially inadequate in exercising control onforeign borrowing (particularly, the short-term and public sector borrowing),in signalling emerging debt service problems (partly because of the inadequacyof the official debt service ratio), and in failing to take into account theburden of banking system liabilities. The latter are supervised by adifferent department of the central Bank. Discrepancies between the MEDIADand BOP data on both MLT and short-term capital flows and uncertainty aboutthe banking system's external liabilities created doubts about the reliabilityof the debt data and affected the country's creditworthiness. Moreimportantly, the system was not closely linked to the broader tasks ofmacroeconomic management. It performed only a limited role in assessing thefull implications of the magnitude and structure of private borrowing,monitoring the public sector's access to foreign resources, highlightingpotential problems (such as those stemming from relatively high foreign bankexposure and a large share of the short-term debt), and in charting foreignborrowing options and strategies.
Implications for the Future
Recent Developments and the 1983 Crisis. Drawing policy implica-tions for the future needs to take into account not only the longstandingproblems but also the more recent developments. As mentioned above, thecurrent account deficit had expanded substantially in 1982. Because of theconstraints on the availability of MLT funds, the country relied on short-termcredit lines, and the net international reserve position became negative. In1983, despite some additional restrictives policies adopted towards the middleof the year, the balance of payments position worsened. The public sectordemand (primarily investment outlays of public sector corporations) remainedstrong, generating pressures for imports. Export performance, however,remained weak. The current account deficit expanded from 8.1% of GNP in 1982to 8.2% in 1983. Furthermore, due to both political and economicuncertainties, capital flight increased, foreign credit availabilitydecreased, and international reserves feLl sharply. Consequently, theGovernment sought a moratorium on debt repayments to commercial banks, furtherdevalued the peso, reimposed foreign exchange controls, reduced public invest-ment program, increased import duties, and opened discussions with thecommercial banks for debt rescheduling. At the end of 1983, gross externalobligations had increased to $25 billion, up from $24.3 billion in 1982, andthe total debt service ratio (on the basis of scheduled payments) remainedhigh at 36%.
Implications for Macroeconomic Policy. In the context of thisstudy, one of the main objectives of the Government's adjustment efforts willhave to be to improve the country's creditworthiness: for example, the netofficial reserves need to be built up to cover about three months of imports,the short-term debt and commercial banks" liabilities need to be reduced, andthe ratios of debt and debt service to exports need to drop significantly.This, in turn, would imply adoption of policies (with somewhat different

policy mix for the short- and medium-term) to curtail current account deficitsand arrange requisite capital inflows at reasonable terms.
In the short-term, the country will need to restrain domestic demandsufficiently to limit the annual current account deficit to about $1-1.5 bil-lion. This would imply increased domestic savings, lower public sector defi-cits, a tight monetary policy, continued price corrections, and little or nogrowth during 1984-85.
The demands of medium-term adjustment would be somewhat different.In view of the high level of country's indebtedness and debt service payments,the scope for additional borrowing will remain limited through the early1990s. The proposed rescheduling of debt will ease the immediate paymentsproblem but will necessarily cause a hump in the late 1980s and stretch outthe debt service payments into the 1990s. The country will, therefore, haveto follow a very careful course of macroeconomic (including debt) manage-ment. First, domestic absorption will have to remain constrained and savingsincreased. Second, a delicate balance will have to be maintained in externalborrowing. Sufficient capital infLows (foreign savings) will be needed toresume growth, but too much borrowing (given the existing large debt), ifavailable, could damage creditworthiness. On the other hand, lack of accessto foreign capital could reduce investment levels, constrain growth of outputand exports, and prevent a long-term resolution of the debt problem. Third,as a corollary of the above, investment efficiency will need to be improved,import growth restrained, and determined efforts made to expand exports.Export growth will play an especially crucial role in the economic recovery byfacilitating necessary growth in iMports and investment. Continuation ofstructural reforms and of the recent movement towards flexible exchange rateshould facilitate achievement of these objectives. Simultaneously, theGovernment will need to tighten its debt management and utilize foreignsavings efficiently as discussed below.
Implications for Debt Management. Several steps appear to be neededfor improving the country's debt management to face the challenges of the late1980s. First, the Central Bank will need expanded capacity and facilities fordata management and forecasting and more adequate control over all debtdata: MLT debt, short-term debt, and the banking system's liabilities andassets. Some improvements in this area were initiated in 1983. The CentralBank should also adopt more appropriate tools of analysis (e.g., a comprehen-sive debt service ratio and other debt indicators) to help chart futureborrowing policies. Second, to perform the enhanced debt management func-tions, MEDIAD's status may have to be upgraded and its coordination activitiesvis-a-vis other agencies more firmly defined. Third, the country's debt anddebt service burden relative to its GNP and exports is too high. Debtmanagers, therefore, need to plan to zeduce the level of this exposure overtime. Fourth, debt management needs to be fulLy integrated with macroeconomicmanagement within a framework of multiyear programming. The system of publicsector project approval, and consideration of their foreign exchange require-ments, needs to be streamlined and strengthened. The present system, focusedon the Investment Coordination Committee (ICC), Twas intended to take hold ofthe overall process of resource budgeting but has not been able to do so. Itneeds to be made more effective and linked to the budgetary process. The task

- vi -
of debt management, being closely linked to macroeconomic management, needspolitical commitment and support of the highest levels of the Government.

1. SETTING THE STAGE
Economic Background
1.01 The size and pattern of external borrowing essentially reflectsdevelopments elsewhere in the economy. Therefore, to put external debt issuesin perspective, it islbest to begin by reviewing the relevant economic trendsand policy responses.-
1.02 The acute balance of payments difficulties of 1968-69 (characterizedby a rapid growth of external debt, particularly short-term debt) werefollowed by an initial period of modest recovery and subsequently by a sharpincrease in the level of economic activity in the Philippines in 1973-74. Thestrong recovery in 1973 was led by an international commodity boom. Theconsequent improvement (28%) in the Philippines' external terms of tradeboosted its export earnings and led to expansion in domestic output and inpublic and private investment. The growth in real GNP, which had been about5% a year in 1970-72, nearly doubled in 1973.
1.03 This situation was soon reversed, however. There was an abruptdeterioration in the country's terms of trade as recession hit thePhilippines' key trading partners. The Government responded by using thestrong balance of payments position of 1973 to maintain the flow of importsand the momentum of growth. Though the growth rate dropped from the peakregistered in 1973, a 6% growth rate was maintained during 1974-79, partlythrough increasing recourse to foreign savings.
1.04 The external accounts of the economy had been kept roughly inbalance during 1970-72; in contrast, the sizable current account surplus of1973 was followed by a continuous series of current account deficits, rangingaround 5% of GNP and reaching 8.1% in 1982. Moreover, despite the fairly highoverall growth rate sustained by the economy in the second half of the 1970s,the pattern of growth was marked by certain structural rigidities andinefficiencies: the relatively slow growth of the manufacturing sector (atabout the same rate as GNP), its pronounced orientation toward the domesticmarket, the relatively low efficiency of investment, reduced but still heavyreliance on primary exports and on energy imports, and inadequate domesticresource mobilization.
1.05 These structural inadequacies left the Philippine economy somewhatill-prepared for the adverse external developments that marked the post-1979period: the oil price increases of 1979-80, the accompanying recession in theOECD countries, a sharp deterioration in the terms of trade, and disruptions
1/ For a more detailed account of earlier years, see The Philippines:Priorities and Prospects for Development, Report No. 1095a-PH, Vol. I,World Bank, Washington, D.C., 1975, and'The Philippines: Selected Issuesfor the 1983-87 Plan Period, Report No. 3861-PH, World Bank, Washington,D.C., 1982.
- 2 -
in the demand for the Philippine exports. Moreover, the domestic policyadjustments undertaken in response to these changes proved inadequate. Theconsequent widening of the current account deficit led to a rapid growth inthe country's external debt. The rapidity of this growth, the renewed re-course to short-term loans, the growing reliance on commercial bank credits,and the persistence of high interest rates in the international financialmarkets caused Philippine debt indicators to deteriorate markedly during1980-82.
1.06 Before proceeding to analyze the growth and structure of debt (seeChapter 2), it would be useful to examine more (closely the factors that wereresponsible for the persistent current account deficits in the post-1970period and the macroeconomic policies that influenced the evolution of thePhilippine external debt.
Sources of Change in Current Account Deficits
1.07 The current account was roughly in baLance during the period 1970-74when rising export volumes, export prices, or transfers tended to offset otheradverse developments (see Tables A.1 and A.2, Statistical Appendix). The realeffective exchange rate was also fairly stable except in 1974 when itappreciated, and the country experienced a significant deficit in trade andcurrent accounts (both import volume and import price indices increasedsharply). The current account deficit increased to nearly 6% of GNP during1975-76, largely due to the terms of trade loss, before declining to 3.6% ofGNP in 1977.
1.08 The current accotnt deficit shifted up in 1978 and continued toincrease in successive years, reaching over 8% of GNP in 1982. Whereas theaverage current account deficit to GNP ratic was 1.5% in 1970-77, it nearlyquadrupled to 6.1% during 1978-82. There appear to be three main reasons forthis sharp deterioration in the current account deficit during the latterperiod. First, the real effective exchange rate appreciated by about 20%which tended to encourage imports and reduce the profitability of exports.Second, the terms of trade deteriorated by about 32%. Third, the nominal (andreal) interest rates on foreign loans increased sharply.
1.09 Table 1.1 provides a decompositioDn of the sources of increase in thecurrent accunt deficit for the period 1978-82. Out of the total increase inthe deficit, $1.4 billion was accounted for by the decl;ne in the terms oftrade and $1.7 billion by increased :Lnterest payments.2 The changes in trade
2/ These figures add up to more than the total change of $2.4 billion in thedeficit due to the surplus on accournt of the remainder of services andnet transfers.

-3-
volume accounted for only $0.5 billion. This, however, masks the fact thatimport volume incrt4ses were substantial, but were largely offset by increasesin export volume. -
1.10 Overall, it appears that the external factors (the terms of tradeloss and higher interest payments) were mainly responsible for expanding thecurrent account deficits and the consequent accumulation of debt. The sharplyincreasing debt burden (analyzed in the next Chapter) was having a snow-balling effect: interest payments due on the previous debt were contributingto the further expansion of the debt. However, domestic factors also contri-buted to these deficits. The domestic demand continued to grow at a relative-ly high rate despite worsened external environment which resulted in substan-tial import volume increases. This was partly due to the fact that suffici-ently strong corrective measures were not adopted in terms of controllingpublic sector deficits (discussed in Chapter 3), adjusting exchange rates, andresponding to the harder terms of foreign loans. The following section shedsfurther light on the macroeconomic changes during 1978-82.
3/ The largest single increase (of over $1.0 billion) in the current accountdeficit occurred in 1982. The major changes in this year were increasesin import volume and interest payments, and a drop in service receipts.The import volume increase occurred mainly in intermediate goods andfood: fertilizer, iron and steel, iron ore, wheat, and corn (seeTable A.27, Statistical Appendix). The drop in service receipts wasmainly on account of a drop in interest receipts. Thus, the change inthe current account deficit during 1982 was spread over a number ofitems, partly reflecting the cumulative debt service burden and partlyincreased imports to maintain consumption and (agricultural) growth.

- 4 -
Table 1.1: SOURCES OF CHANGE IN CURRENT ACCOUNT DEFICITS, 1977-82
US$ millions % share1977-82 1977-82
Increase in the CurrentAccount Deficit 2,448 100.0
A. Price Effects 1,388 56.7
Import Price Effect 1,974 80.7
Export Price Effect -586 -23.9
B. Volume Effects 494 20.2
Import Volume 1,778 72.6
Export Volume -1,284 -52.4
C. Interest Payments 1,719 70.2
D. Service Payments Excluding Interest 971 39.7
E. Service Receipts -1,898 -77.5
F. Net Transfers -226.0 -9.2
Note: Changes in the current account, services and transfers were calculatedin nominal terms relative to 1977. Price and volume effects forexports and imports were calculated by distributing the value increasein proportion to the increases in price and volume indexes.
Source: Central Bank; mission estimates.
-5-
Macroeconomic Adjustments
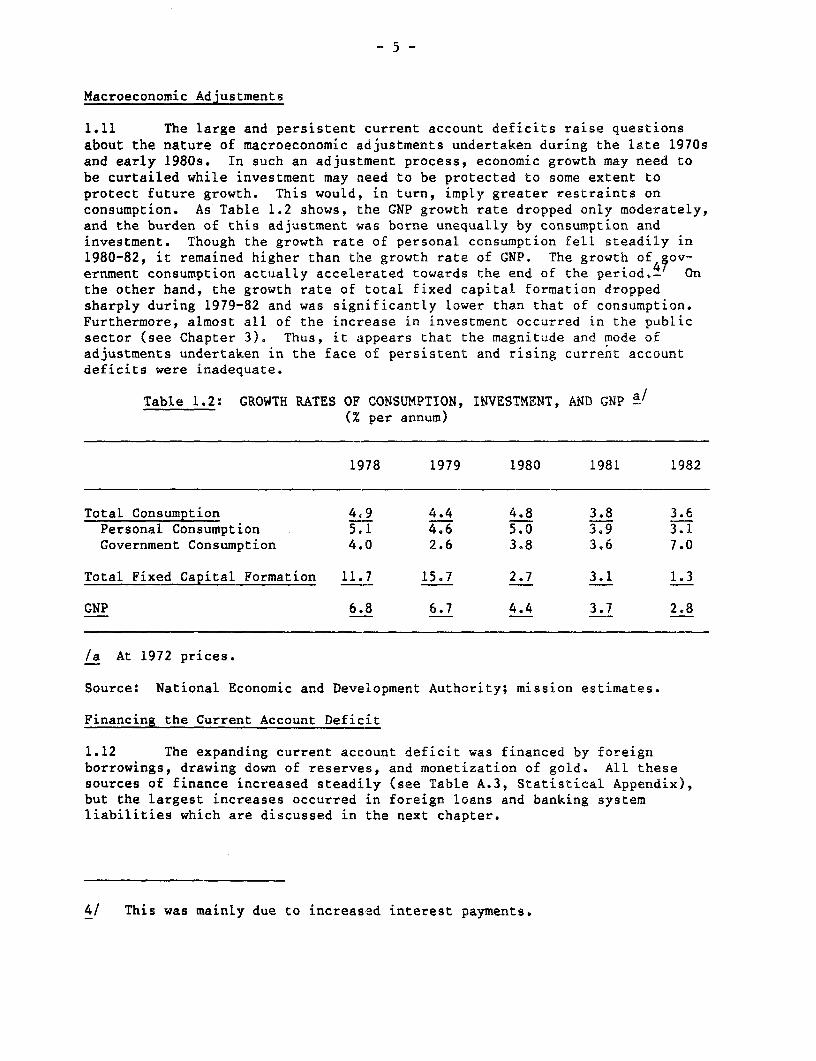
1.11 The large and persistent current account deficits raise questionsabout the nature of macroeconomic adjustments undertaken during the late 1970sand early 1980s. In such an adjustment process, economic growth may need tobe curtailed while investment may need to be protected to some extent toprotect future growth. This would, in turn, imply greater restraints onconsumption. As Table 1.2 shows, the GNP growth rate dropped only moderately,and the burden of this adjustment was borne unequally by consumption andinvestment. Though the growth rate of personal consumption fell steadily in1980-82, it remained higher than the growth rate of GNP. The growth of 0ov-ernment consumption actually accelerated towards the end of the period.- Onthe other hand, the growth rate of total fixed capital formation droppedsharply during 1979-82 and was significantly lower than that of consumption.Furthermore, almost all of the increase in investment occurred in the publicsector (see Chapter 3). Thus, it appears that the magnitude and mode ofadjustments undertaken in the face of persistent and rising current accountdeficits were inadequate.
Table 1.2: GROWTH RATES OF CONSUMPTION, INVESTMENT, AND GNP(% per annum)
1978 1979 1980 1981 1982
Total Consumption 4.9 4.4 4.8 3.8 3.6Personal Consumption 5.1 4.6 5.0 3.9 3.1Government Consumption 4.0 2.6 3.8 3.6 7.0
Total Fixed Capital Formation 11.7 15.7 2.7 3.1 1.3
GNP 6.8 6.7 4.4 3.7 2.8
/a At 1972 prices.
Source: National Economic and Development Authority; mission estimates.
Financing the Current Account Deficit
1.12 The expanding current account deficit was financed by foreignborrowings, drawing down of reserves, and monetization of gold. All thesesources of finance increased steadily (see Table A.3, Statistical Appendix),but the largest increases occurred in foreign loans and banking systemliabilities which are discussed in the next chapter.
4/ This was mainly due to increased interest payments.

-6-
2. TRENDS IN EXTERNAL DEBT
An Overview
2.01 A number of conclusions emerge from a review of the growth andstructure of the Philippine external debt during 1970-82. Fir 7, the coun-try's total debt had reached $24.4 billion at the end of 1982,- amounting toabout 62% of CNP. Second, the rapid expansion of this debt during 1979-82suggests that the Philippine authorities were not sufficiently responsive tothe sharp rise in real interest rates in the international markets in thepost-1978 period. Third, beginning in 1979, the country's debt structurebecame increasingly skewed toward short-term maturities, rendering the economyparticularly dependent on credit rollovers. Fourth, the share of financialinstitutions in the credit mix increased substantially. This was responsible,in part, for the rise in the share of non-concessional funds in total commit-ments. Fifth, a review of the borrower structure suggests that the publicsector has been claiming an increasing share of foreign resources, particu-larly since 1979. Finally, these changes in the size and structure of debthave resulted in a sharp increase in the debt service ratio particularly inthe last three years. The service obligations on MLT, IMF, and fixed short-term debt, interest obligations on short-term revolving credits, and interestobligations on net banking system liabilities yields a debt service ratio of38% in 1982. The share of the public sector, both a major borrower and amajor end user of foreign resources, in the total debt service obligationsreached about 50% in 1982.
The Evolution of External Debt
2.02 Following the balance of payments crisis of 1968-69, MLT and offi-cial short-term debt grew at fairly modest rates during 1970-74. The pace ofgrowth of total debt, and of short-term debt in particular, quickened afterthe first oil crisis of 1973-74 (see Table 2.1). Though the growth rateslackened thereafter, it was obvious that by 1980-82 the debt had become verylarge relation to the size of the economy. In absolute terms, total MLTdebt, - which stood at only $2.3 billion in 1974, jumped almost five-fold to$12 billion in 1982. During the period 1974-82, the growth rate of officialshort-term debt was even higher than that of medium- and long-term debt.Consequently, aggregate MLT and official short-term debt grew about six-foldsince 1974 to $16 billion in 1982.
5/ Includes gross short-term liabililties of the Central Bank and ofcommercial banks. The total debt had reached $25 billion by the end of1983.
6/ Including the IMF's Trust Fund, but excluding all other IMF obligationswhich are included in the net international reserves of the bankingsystem.

Table 2.1: STRUCTURE OF DEBT, 1970-82(US$ million)
Annual growth rate (%)1970 1974 1980 1981 1982 1970-74 1974-80 1980-82
Medium- and Long-Term (MLT) /a 11671 2,264 8,746 10,204 12,103 7.9 26.0 17.6
Total Public and PubliclyGuaranteed Debt n.a. 1,456 6,776 8,049 9,757 n.a. 29.0 20.0
Public Debt /a 631 1,051 6,292 7,443 8,874 13.6 35.0 18.8
Publicly GuaranteedPrivate Debt 405 484 606 883 3.0 35.0
1,040 3.9Private Nonguaranteed Debt 808 1J970 2,155 2,346 16.0 9.1
Official Short-Term Debt /b 309 331 2,548 3,664 3,993 2.3 40.0 25.0
Revolving 255 324 2,477 3,552 3,919 6.2 40.0 26.0
Fixed Term 54 7 71 112 74 -65.0 47.0 2.1
Total MLT /a and OfficialShort-Term Debt 1 80 2,59 294 13,868 i1659 7.0 28.0 19.4
Memorandum Items
Other IMF Obligations 108 131 936 1,030 908 4.9 39.0 -1.5
Total MLT Debt Includin IL7 78 2,395 9j6 1 1233 13,010 7.7 26.0 15.9IMF Obligations
Total MLT Debt, All IMF 2,087 2,726 12 330 14,898 172004 6.9 29.0 17.4Obligations and OfficialShort-Term Debt
/a Including IMF Trust Fund, but excluding other IMF obligations./b Excluding International Reserve Liabilities.
Source: Statistical Appendix, Table A.4.

2.03 These figures, since they exclude IMF obligations other than theTrust Fund and the short-term external liabilities of the banking system,present only part of the picture. From a "purist" point of view, there may begrounds for excluding IMF obligations and the Wnking system's short-termexternal liabilities from the capital acc:ount.- However, to gain acomprehensive view of the country's external debt, both of these obligationsshould be taken into account.
2.04 At the end of 1982, the gross external liabilities of the country'sbanking system stood at $7.3 billion and its obligations to the IMF (excludingthose to the Trust Fund) totalled nearly $1 billion (see Table 2.2). Thisbrings the country's total gross external, obligations to about $24.3 billionin December 1982. Netting out the external assets of the banking systemreduces the banking system's liabilities to $2.1 billion and brings the totalnet external obtigations of the Philippines at the end of 1982 to about$19.0 billion.-
7/ The rationale for omitting banking system liabilities from the debtstatistics is simple. In countries where the banking system's foreignexchange position is under the Central Bank control, changes in theshort-term external liabilities of commercial banks are considered asmonetary movements and are recorded as changes in international reserveliabilities. Similarly, IMF obligations other than the Trust Fund arenot considered debt, since the Fund borrower "purchases" foreign exchangewith its own currency.
8/ An alternative measure of the short-term liabilities of the banking sys-tem would comprise the net external liabilities of the commercial banks($2,233 million in 1982) and the grfoss external liabilities of theCentral Bank, ($2,214 million in 1982) on the assumption that CentralBank assets should be available to cover imports. According to thismeasure, the short-term liabilities of the banking system totalled $4,447million in 1982, implying that total external debt in 1982 amounted to$21,451 million.
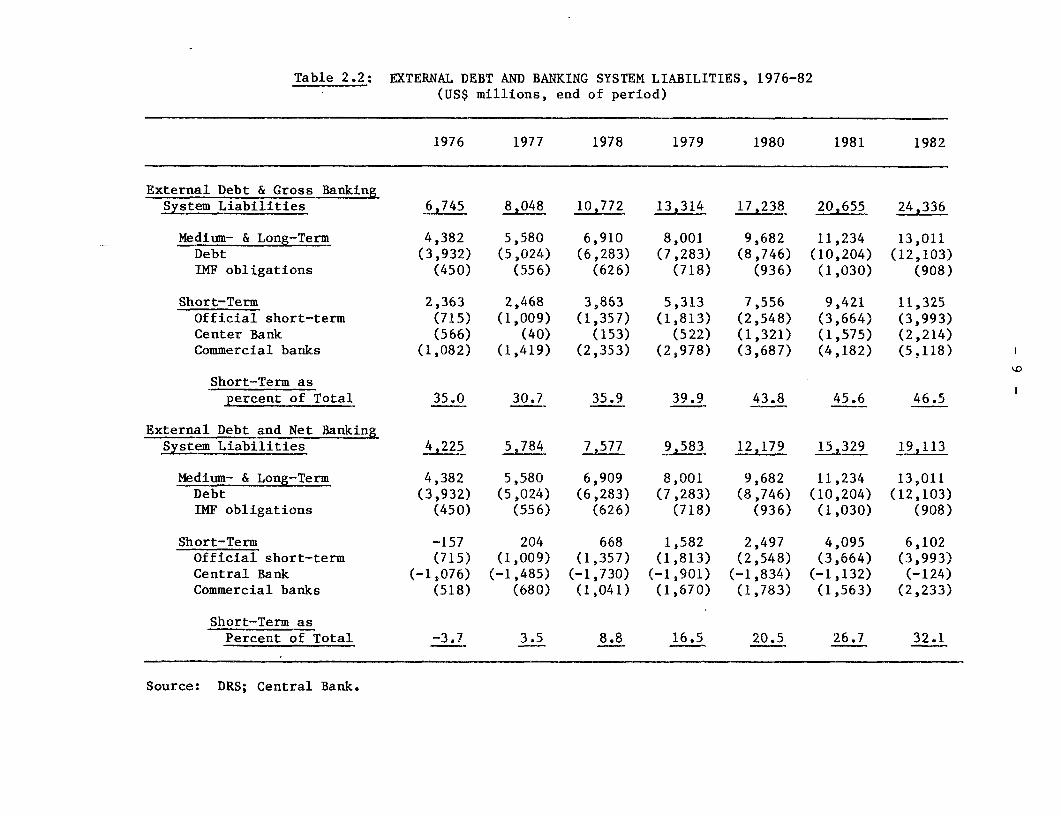
Table 2.2: EXTERNAL DEBT AND BANKING SYSTEM LIABILITIES, 1976-82(US$ millions, end of period)
1976 1977 1978 1979 1980 1981 1982
External Debt & Gross BankingSystem Liabilities 6,745 8,048 10,772 13,314 17,238 20,655 24,336
Medium- & Long-Term 4,382 5,580 6,910 8,001 9,682 11,234 13,011Debt (3,932) (5,024) (6,283) (7,283) (8,746) (10,204) (12,103)IMF obligations (450) (556) (626) (718) (936) (1,030) (908)
Short-Term 2,363 2,468 3,863 5,313 7,556 9,421 11,325Official short-term (715) (1,009) (1,357) (1,813) (2,548) (3,664) (3,993)Center Bank (566) (40) (153) (522) (1,321) (1,575) (2,214)Commercial banks (1,082) (1,419) (2,353) (2,978) (3,687) (4,182) (5.118)
Short-Term aspercent of Total 35.0 30.7 35.9 39.9 43.8 45.6 46.5
External Debt and Net BankingSystem Liabilities 4,225 9,583 12,179 1 9 9113
Medium- & Long-Term 4,382 5,580 6,909 8,001 9,682 11,234 13,011Debt (3,932) (5,024) (6 ,283) (7,283) (8,746) (10,204) (12,103)IMF obligations (450) (556) (626) (718) (936) (1,030) (908)
Short-Term -157 204 668 1,582 2,497 4,095 6,102Official short-term (715) (1,009) (1,357) (1,813) (2,548) (3,664) (3,993)Central Bank (-1,076) (-1,485) (-1,730) (-1,901) (-1,834) (-1,132) (-124)Commercial banks (518) (680) (1,041) (1,670) (1,783) (1,563) (2,233)
Short-Term asPercent of Total -3.7 3.5 8.8 16.5 20.5 26.7 32.1
Source: DRS; Central Bank.

- 10 -
Assessing Debt Levels
2.05 A convenient method of assessing the growth of debt burden is tocompare debt magnitudes to GNP. Since GNP, provides a convenient measure ofthe country size, the ratio of debt outstanding and disbursed (DOD) to GNPprovides a neat summary indicator of the economy's debt-carrying capacity.
2.06 In the Philippines the ratios of DOD/CNP shifted up significantlyduring the late 1970s (see Table 2.3). Before 1{78, the ratios of both MLTdebt - to GNP and of MLT and total short-term 10/ debt to GNP were below25%. After 1978, the ratios were consistently above this level. Moreover,between 1981 and 1982, due partly to the decline in the growth rate of GNP,both ratios increased sharply, reaching their highest yoint since the start ofthe 1970s. In 1982, the ratio of total MLT DOD!Ny - was 33% and that ofthe aggregate of MLT and short-term debt to GNP 2 was 49%.
2.07 The ratios of debt to an alternative scalar - exports of goods andservices - further illustrate the critically high levels of debt reached by1982 (see Table 2.3). The ratio of the aggregate of MLT debt, IMF obliga-tions, official short-term debt, and the banking system's net externalliabilities to export earnings had reached the high level of 239% andaffected outside perceptions of the country's creditworthiness.
9/ Including total IMF obligations.
10/ Including the net liabilities oE the banking system.
11/ Including total IMF obligations.
12/ Including the net liabilities of the banking system.

Table 2.3: DEBT INDICATORS
(%)
1970 1974 1976 1978 1979 1980 1981 1982
DOD/GNP
Total MLT Debt and IMF Obligations /a 25.7 16.3 24.6 28.6 26.7 27.4 29.2 33.1
Total MLT Debt, IMF Obligations, /aOfficial Short-term Debt, Net NA NA 23.7 31.4 32.0 34.5 39.9 48.6Banking System Liabilities
DOD/Exports of Goods and Services H
Total MLT Debt and IMF Obligations /a 132.6 67.3 127.2 140.7 127.9 120.9 130.4 162.5
Total MLT Debt, IMF Obligations,/aOfficial Short-Term Debt, Net NA NA 122.6 154.3 153.2 152.0 177.9 238.8Banking System Liabilities
/a Including all IMF obligations.
Source: Statistical Appendix, Table A.18.

12 -
Interpreting the Trends in Philippine Exposure
2.08 / Given the fairly high inflation rates that characterized the1970s,- the Philippine recourse to heavy external borrowing had itsbenefits. Developing countries which accurnulated debt during the inflationaryperiod of the 1970s were able to receive a sizable trvsfer of resources withonly modest acceleration in their real debt burdens.l1 Their borrowingcapacities were obviously supported by the high nominal growth rates for theirexports. The Philippines falls in this category, and, like other majordeveloping country borrowers, it was able t:o increase its growth rate byborrowing abroad during 1970-78 when real interest rates were relatively lowor even negative.
2.09 This position, however, reversed starting in the late 1970s and thePhilippine debt indicators worsened substantially. After 1978, the inter-national financial markets entered a periocl of rising real interest rates.Some developing countries which had borrowed heavily in the early 1970s, wheninternational liquidity was ample and real interest rates were low, had toadopt adjustment measures and restrain foreign borrowing after the second oilshock. The Philippines, however, continued to expand its foreign debt at arelatively high rate d yite high real interest rates and shortening maturi-ties of foreign loans. _
2.10 The pronounced growth of short-te!rm maturities in the Philippinedebt structure is especially noteworthy. Ihe share of short-term debt andgross liabilities in the total debt of the Philippines rose from 35% in 1976to 47% in 1982 (see Table 2.2 above). In general, the financial marketsinterpret a ldden accretion of short-term debt as a sign of reduced credit-worthiness.! At this stage, a debtor is often faced with restrictions onthe type of credits available, with creditcrs showing a preference for short-term rather than medium-term commitments. Thus, a country with an increasingshare of short-term borrowings in its debt portfolio faces a seriousdilemma: lenders' perceptions of its creditworthiness erode as the weight ofshort-term borrowings increases; on the other hand, in order to service the
13/ The MUV index (the unit value cf manufactured exports from developed todeveloping countries) rose almost three-fold between 1970 and 1979.
14/ The growth rate of "real" debt during the 1970s turns out to have beenquite modest, when debt outstanding and disbursed is deflated by any ofthree major price indicators. See Table A.17, Statistical Appendix.
15/ The Philippine was by no means alone in this category. Other East Asiancountries, such as Korea and Thailand, also continued to borrow heavilyabroad.
16/ IMF, "Fund Policies and External Debt Seirvicing Problems," SM/83/45,March 1983, Washington, D.C., p.4.
- 13 -
debt and thereby maintain creditworthiness, the borrowing country's dependenceon short-term rollovers continues to grow.
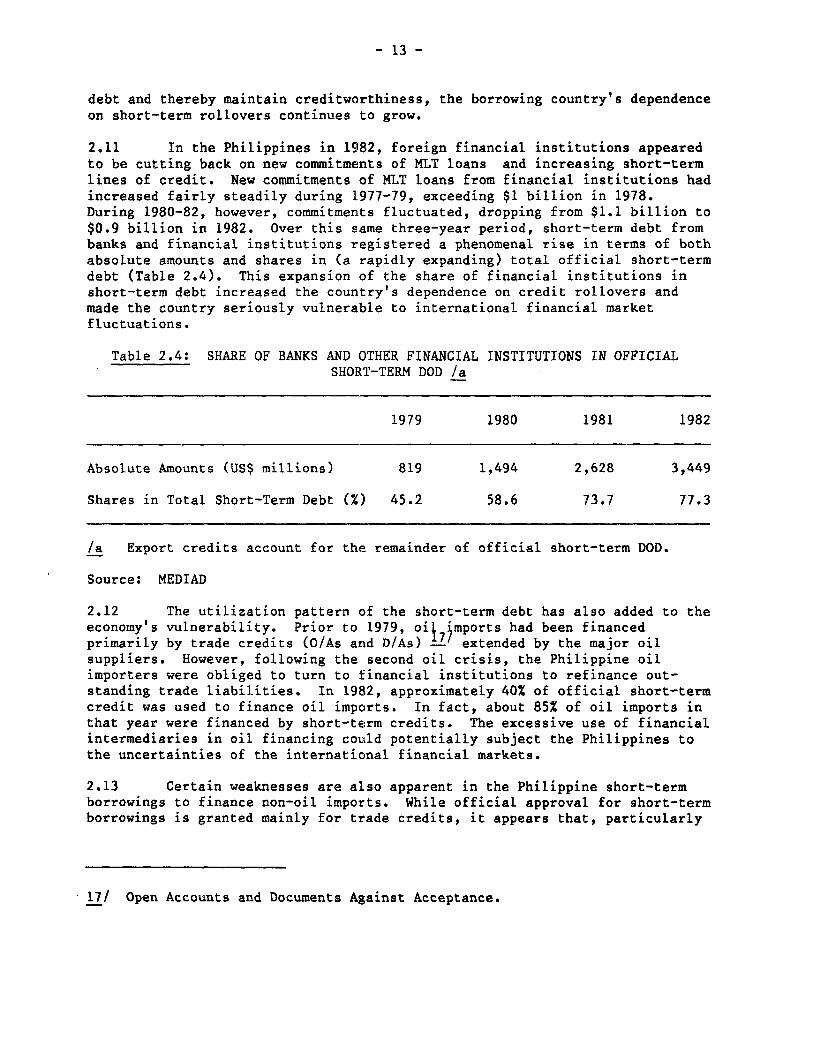
2.11 In the Philippines in 1982, foreign financial institutions appearedto be cutting back on new commitments of MLT loans and increasing short-termlines of credit. New commitments of MLT loans from financial institutions hadincreased fairly steadily during 1977-79, exceeding $1 billion in 1978.During 1980-82, however, commitments fluctuated, dropping from $1.1 billion to$0.9 billion in 1982. Over this same three-year period, short-term debt frombanks and financial institutions registered a phenomenal rise in terms of bothabsolute amounts and shares in (a rapidly expanding) total official short-termdebt (Table 2.4). This expansion of the share of financial institutions inshort-term debt increased the country's dependence on credit rollovers andmade the country seriously vulnerable to international financial marketfluctuations.
Table 2.4: SHARE OF BANKS AND OTHER FINANCIAL INSTITUTIONS IN OFFICIALSHORT-TERM DOD /a
1979 1980 1981 1982
Absolute Amounts (US$ millions) 819 1,494 2,628 3,449
Shares in Total Short-Term Debt (%) 45.2 58.6 73.7 77.3
/a Export credits account for the remainder of official short-term DOD.
Source: MEDIAD
2.12 The utilization pattern of the short-term debt has also added to theeconomy's vulnerability. Prior to 1979, oil imports had been financedprimarily by trade credits (O/As and D/As) 17' extended by the major oilsuppliers. However, following the second oil crisis, the Philippine oilimporters were obliged to turn to financial institutions to refinance out-standing trade liabilities. In 1982, approximately 40% of official short-termcredit was used to finance oil imports. In fact, about 85% of oil imports inthat year were financed by short-term credits. The excessive use of financialintermediaries in oil financing could potentially subject the Philippines tothe uncertainties of the international financial markets.
2.13 Certain weaknesses are also apparent in the Philippine short-termborrowings to finance non-oil imports. While official approval for short-termborrowings is granted mainly for trade credits, it appears that, particularly
17/ Open Accounts and Documents Against Acceptance.
- 14 -
in 1981-82, some short-term credits were not trade-related, but were obtainedto replace maturing longer term debts, and that: some producers in both thepublic and private sectors used short-term credits to continually financetheir working capital needs. Under normal circumstances, and if short-termexposure were low, this would not be a cause for alarm. But the country's(and some firms') creditworthiness had already worsened, making it difficultto obtain rollovers; moreover, when short-term credits are locked up in longerterm investments, they render firms doubly vulnerable.
Financing Patterns
2.14 The mix of creditors has varied substantially over time. In partbecause of heavy borrowing in the private financial markets in the late 1960sand the resulting debt crisis of 1969, the Philippine authorities tried, insubsequent years, to retain the bulk of foreign borrowing in public hands tocontrol the credit mix and the terms of foreign borrowing. In addition, withpublic enterprises controlling major capital intensive industries, the shareof debt directly incurred by the public sector (general government and publicsector entities) increased substantially. This- share rose from 38% in 1970 to50% in 1975, reaching the level of about 74% between 1979 and 1982 (see Table2.5).
2.15 The government control strengthened in part because of the high andsteady contribution of foreign official debt to the Philippine public andtotal MLT debt. Throughout the 1970s, the Government made assiduous effortsto tap official sources, and the share of official debt in total MLT debt wasconsistently above 31% since 1975. Within the official source debt, themultilateral debt grew the fastest, its share in the total increasing from 8%in 1970 to nearly 20% in 1980-82. This was partly due to the overall expan-sion of multilateral lending during the 1970s and partly due to the slowdownof bilateral lending.
2.16 The Philippines also began testing the international bond market inthe early 1970s. By 1979-80, it h1 d begun to draw about 10% of total MLTresources in the form of bonds. 18
18/ Smaller institutional lenders less well-equipped with country researchfacilities than the major commercial banlcs interpreted the Philippines'penetration of bond markets as recognition. by the international financialmarkets of the country's growing creditworthiness.

Table 2.5: STRUCTURE OF MLT DEBT BY CREDITOR
A. Share in percent
1970 1975 1979 1980 1981 1982
Total MLT Debt 100.0 100.0 100.0 100.0 100,0 100.0
Public Sector /a 38.3 50.2 71.4 72.5 73,3 73.7
Official Source 15.5 31.5 31.9 31.1 33.6 32.1
Multilateral 8.1 12.2 16.3 16.8 19.4 19.2Bilateral 7.4 19.3 15.6 14.3 14.2 12.9
Private Source 22.8 17.9 39.4 41.3 39.7 41.6
Bonds 0.7 0.8 10.8 10.1 8.2 7.3Financial Institutions 17.9 14.6 25.1 28.0 28.5 31.6Suppliers' Credits 4.2 2.5 3.5 3.2 2.9 2.7
Publicly Guaranteed Private Debt 20.6 17.1 5.7 5.4 6.6 7.7
Private Non-Guaranteed /b 41.1 33.5 23.0 22.1 20.1 18.6
Memorandum Item:
Public and Publicly Guaranteed 58.9 66.05 77.0 77.9 79.9 81.4
Private Non-Guaranteed 41.1 33.5 23.0 22.1 20.1 18.6
Banks/Financial Institutions n.a. 41.3/c 50.3 50.9 50.3 51.8
B. Average Nominal Growth Rates (I p.a.)
1970-75 1975-80 1980-82
Total MLT Debt 13.3 26.2 16.0
Public Sector /a 19.2 36.2 16.9
Official Source 30,6 25.9 17.7
l4ultilateral 23.0 102.4 23.8Bilateral 37.2 18.8 10.2
Private Source 8.0 49.2 16.3
Bonds 15.7 109.2 -1.4Financial Institutions 8.8 43.8 23.1Suppliers Credits 2.4 32.7 6.3
Publicly Guaranteed Private Debt 9,2 0.3 38.0
Private Non-Guaranteed /b 8.8 16.1 6.6
Public and Publicly Guaranteed 16.1 30.2 18.4
Memorandum Item:
Total MLT and OfficielShort Term Debt 11,8 28.9 19.8
/a Including IMF Trust Fund, but excluding other IMF obligations.T7 Information on the creditor structure of private guaranteed and non-guaranteed
debt is not available in the DRS,Ic Data relate to 1976.
Source) Table A.8, Statistical Appendix.

- 16 -
2.17 Despite the expansion of direct fore:ign borrowing by the publicsector and the fairly large share of official source debt, the Philippinecredit mix has some worrying features. In terrns of the sources of debt, byfar the fastest growing debt category has been that of banks and other finan-cial institutions whose share in total outstanding MLT debt had reached about32Z in 1982 (Table 2.5). If both the officiaLLy recorded short-term borrowingand the net external liab ilities of the banking system are taken into account,the share of banks and other financial institutions was almost three-fifths ofthe total outstanding external obligations of the Philippines in 1982.
2.18 This situation is of concern for several reasons. As mentionedearlier, the increase in the dependence on financial institutions has coincid-ed with the rise in nominal and real interest rates in the internationalmarkets that began in 1978. This, in turn, led to a rise in the share ofnon-concessional funds in the Philippines' public debt (see Table 2.6), aswell as in the interest service ratio. The share of non-concessional debt,which was already very high, rose to about 87% in 1982, precisely the periodof the Philippines' switch to a heavier reliance on financial institutions.
Table 2.6: DISTRIBUTION OF PUEILIC SECTOR DEBTBY CONCESSIONAL/NON-CONCESSIONAL CATEGORIES
(percent)
1975 1979 1980 1981 1982
Concessional 16.5 14.6 15.3 10.5 12.6O:fficial 16.5 14.6 13.9 10.5 12.6Private Source - 0.1 1.4 - -
Non-Concessional 83.5 85.4 84.7 89.5 87.4Official 35.8 23.0 43.4 38.9 38.9Private 47.7 62.3 41.3 50.7 48.5
Total Public Sector Debt 100.0O 100.0 100.0 100.0 100.0
Souirce: DRSO

- 17 -
2.19 During the last few years, some countries have tried to counteractthe impact of higher interest rates by switching to credits denominated in thecurren i s of countries with low inflation and consequently low interestrates. 9 Although there is some evidence that the Philippines may have donethis during 1979-81, when the share of borrowings in currencies with lowinterest rates almost doubled, the share of borrowings in currencies with highinterest rates has remained fairly large and increased dramatically in 1982(see Table 2.7). Obviously, the interest rate is only one of a number ofdeterminants of the currency mix of a country's borrowing program. Others arethe rates of change in the exchange rates of specific currencies, the currencycomposition of the import basket 2gd of debt service obligations, the currencycomposition of export earnings, -, and the market receptivity (e.g., lenders'considerations of country exposure and creditworthiness).
19/ This appeared to be the case in Thailand. See World Bank, "PublicForeign Borrowing in Thailand," mimeo, April 30, 1983, Washington, D.C.,p. 8.
20/ See Donogh C. McDonald, "Debt Capacity and Developing CountryBorrowings: A Survey of the Literature," IMF, Washington, D.C.,August 17, 1982. The theoretical literature has tended to concentrate onthe currency composition of reserves. In applying optimizing principlesto the currency composition of debt, a number of factors need to be bornein mind: (1) the past portfolio is not necessarily a good guide to thepresent; (2) the net position in different currencies is more importantthan the gross; (3) at the short end of the spectrum, it is important tofocus on the combined currency composition of reserves and credits; and(4) the literature on the optimum composition of reserves tends to focuson the interest rate, changes in exchange rates and the import currencybasket. Obviously, the range and complexity of the variables does notallow simple qualitative judgments. An adequate treatment of the problemrequires a properly specified model for optimizing behavior and theexistence of computer simulation capabilities.

- 18 -
Table 2.7: CURRENCY DISTRIBUTION OF PUBLIC SECTOR COMMITMENTS(in. perceit)
1975 1976 1977 1978 1979 1980 1981 1982
Low Interest Rate 29.4 27.7 58,9 25.8 44@8 55.0 46.4 21.5
French Franc /a 14.6 1.1 0.2 - 2,3 - - -
Deutsche Mark - 0.1 3.0 2.3 1.5 - 1.6 0.7
Yen 14.8 8.1 6D4 23.5 21.3 14.5 19.6 20.8
Multiple /b - 18.4 - - 19.7 39.5 25.2 -
High Interest Rate 70.1 69.9 35.8 72.9 54.7 40.0 51.9 75.1
US Dol.lar 44.8 69.9 (49.3)/c 49.0 54,7 40.0 51.9 46.6
Multiple /b 25.3 - 35.8 21.6 - - - 25.9
TOTAL Id 1000. 100.0 100.0 100l 0 100.0 100.0 100.0 100.0
/a Subsidized French credits.
/b Includes commitments denominated in multiple currencies, Note that in some yearsthis category is in the Low Interest Rate groap and in other years in the HighInterest Rate Group. This classification was based on a comparison of the averageinterest rate associated with loans denominated in multiple currencies, with theaverage interest rate characteristic of the specific year's total commitments.
/c Figures in parentheses denote loans for which average interest rates were lower thanon total commitments. Totals in the second category have been adjusted to excludethem,
/d The sum of the two main categories does not: add ap to 100% due to the exclusion of afew small loans.
Source: DRS
- 19 -
2.20 Finally, although the high share of financial institutions in thecreditor structure of the Philippines' external debt has ha 1 ittle or noadverse effect on the average maturity of public MLT debt, - it has affectedthe maturity structure of overall debt via a change in the mix of MLT andshort-term debt. As was pointed out before, this trend has greatly increasedthe economy's vulnerability to developments in international markets whichhave become particularly sensitive to creditworthiness issues on account oftheir recent experiences in other debtor LDCs.
The Structure of Borrowers
2.21 External debt data, broken down by major borrowers (see Table 2.8),show that the principal borrowers have been public sector institutions.During 1970-75, th7 debt of official development banks22 grew the fastest(40% per annum).2 In the next five-year period, government corporations, asseveral of them became increasingly better known, took the lead in borrowingabroad and doubled their share of MLT debt. By 1980, they accounted for alittle under a third of the total MLT debt. By contrast, in the following twoyears, 1980-82, the public corporations were induced to rein in their directborrowing activities, as the central government and the Central Bank took thelead in foreign borrowing. These two institutions, which had themselvesengaged in fairly heavy borrowing abroad during the 1975-80 period, expandedtheir activities as intermediaries for channelling foreign funds to domesticusers. Even the role of the official development banks as purveyors offoreign funds was severely curtailed - the growth rate of their debt in1980-82 was down to about 9% per annum while the public sector borrowing as awhole was still growing at about 17% per annum during the same period.
21/ With the exception of 1977, the average maturity of total public debtcommitments has been in excess of 15 years throughout the period 1975-82. Indeed, the average matturity period of commitments made in 1982almost equalled the peak maturity registered in 1975. Even the averagematurities obtained from financial institutions were confined to thenarrow band of 10-11 years all through the 5-year period 1978-82.
22/ The Philippine National Bank (PNB), the Development Bank of thePhilippines (DBP), and their subsidiaries.
23/ Their low base of debt in 1970 was, of course, a contributing factor.

- 20 -
Table 2.8 STRUCTURE O'P MLT DEBT BY BORROWER
A. STRUCTURE
(%)
1970 1975 1978 1979 1980 1982
Total 100,.0 100.0 100.0 100.0 100.0 ao0.0
Public Sector 38.3 49.3 66.9 71.4 72.5 73.7
Total Government 26.9 26.5 31.0 32.2 34.4 39.1
Central Government (10.8) (13.8) (19.3) (19.6) (21.6) (23.7)
Local Government (0.1) (0.0) (0.0) (0.0) (0.0) (0.0)
Central Bank (16.0) (12.7) (11.6) (12.5) (12.7) (15.4)
Public Corporations 9,.0 16.1 29.8 32.9 32.7 29.9
Official Development Banks 2.4 6.8 6.2 6.4 5.4 4.7
Private Sector 61.7 50.6 33.1 28.6 27.5 26.3
Publicly Guaranteed Debt 206 17.1 6.8 5.7 5.4 7.7
Private Non-guaranteed Debt 41.1 33.5 26.3 23.0 22.1 18.6
B. GROW`FH RATES(Z p.a.)
1970-75 1975-80 1980-82
Public Sector /a 19.2 36.2 16.9
Total Government 13.0 33.0 23.6
Central Government 18.9 38.1 21.4
Local Government _ /b
Central Bank 8.2 26.4 27.3
Public Corporations 27.2 45.4 10.8
Official Development Banks 40.0 20.4 8.8
Private Sector 8.9 11.7 13.4
Publicly Guaranteed Debt 9.2 0.3 38.0
Private Non-guaranteed Debt 8.8 16.1 6.6
/a Includes IMF Trust Fund but excludes other IMF obligaticins.
/b Calculated at 56.4% per annum for 1980-1982, but the amounts are insignificant.
Note: This table is based on the old (1983) debt data series. For details see footnote to Table A.8, StatisticalAppendix.
Source: DRS and MEDIAD.

- 21 -
2.22 Compared to the public sector borrowing, the private sector's directaccess to foreign funds remained modest. The Central Bank's approval processcombined with the Government's role as an intermediary for foreign fundsconstrained direct borrowing by the private sector.
The Structure of End-Users
2.23 The structure of major borrowers described above does not reflectthe ultimate pattern of use of MLT funds. Since the Government is empoweredby the Foreign Borrowing Act of 1970 to undertake foreign borrowing to lend tothe private sector, the direct borrowings of the private sector do not fullyreflect its access to foreign finance.
2.24 The Government's on-lending program has taken three forms: first,the official development banks have been a major vehicle for channelling for-eign funds to private sector end-users; second, the central government andCentral Bank have, from time to time, channelled concessional funds from bila-teral and multilateral donors, as well as long-term export credits, to privateentrepreneurs; and, finally, the Central Bank in 1978 expanded its on-lendingactivities through the Consolidated Foreign Borrowing Program (CFBP).
2.25 The CFBP was established by Presidential Decree No. 1309 of March1978. It enabled the Central Bank to on-lend foreign funds to banking insti-tutions either to finance development projects which had not obtained conces-sionary financing or to refinance existing debt. Since the Central Bank wasthe direct borrower, the amounts involved were large. By pooling demands inthe "jumbo loans," the Central Bank was able to reduce the number of competi-tive and simultaneous approaches to the market by individual Philippineborrowers and obtain better terms than would be available otherwise.
2.26 The total funds raised under the CFBP through 14 loans amounted to$1.9 billion during the period 1978-82. (An additional $300 million was raisedin early 1983.) Over 50% of these funds were re-lent to private sectorborrowers (See Table 2.9).

- 22 -
Table 2.9: TOTAL OUTSTANDING BORROWINGS UNDER THE CFBP(US $ milLions)
1978 197'3 1980 1981 1982
Total 384.0 680.0 937.0 1,198.3 1t848.6
y type
Revolving 100.0 100.0 100.0 100.0 100
Fixed Term 284.0 580.0 837.2 1,098.3 1,748.6
Loans from FCDUs /a 16.8 18.7 33.3 44.1 78.8
Loans from ForeignBanks/OBUs /b 267.2 561.3 803.9 1,054.2 1,669.8
CFBP Loans Included in FixcedTerm External Debt, by Sector
Loans from Foreign Banks/OBUs 267.2 561.3 803.9 1,054.2 1,669.8
Add (Deduct) CurrencyRevaluation Adjustments - (8.8) 4.3 (2.4) (6.6)
Adjusted Total 267.2 552.5 808.2 1,051.8 1,663.2
Not On-Lent - - 0.3 5.6 -
Re-Lent 267.2 552.5 807.9 1,046.2 1,663.2
Private Sector 180.8 327 .3 505.0 725.3 961.9
Public Sector 86.4 225.2 302.9 320.9 701.3
/a Foreign currency deposit units of the local commercial banks.
lb Offshore banking units.
/c The figures in parentheses refer to the share of the private sector inrelent CFBP funds.
Source. MEDIAD.
- 23 -
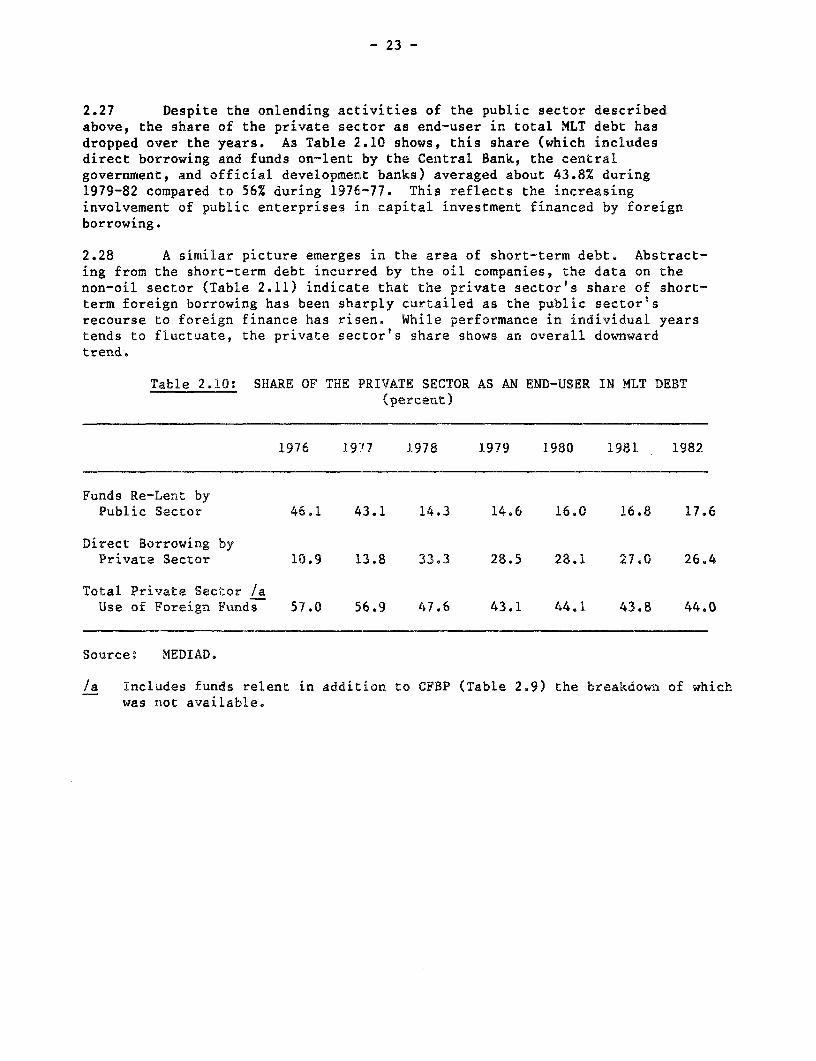
2.27 Despite the onlending activities of the public sector describedabove, the share of the private sector as end-user in total MLT debt hasdropped over the years. As Table 2.10 shows, this share (which includesdirect borrowing and funds on-lent by the Central Bank, the centralgovernment, and official development banks) averaged about 43.8% during1979-82 compared to 56% during 1976-77. This reflects the increasinginvolvement of public enterprises in capital investment financed by foreignborrowing.
2.28 A similar picture emerges in the area of short-term debt. Abstract-ing from the short-term debt incurred by the oil companies, the data on thenon-oil sector (Table 2.11) indicate that the private sector's share of short-term foreign borrowing has been sharply curtailed as the public sector'srecourse to foreign finance has risen. While performance in individual yearstends to fluctuate, the private sector's share shows an overall downwardtrend.
Table 2.10: SHARE OF THE PRIVATE SECTOR AS AN END-USER IN MLT DEBT(percent)
1976 1977 1978 1979 1980 1981 1982
Funds Re-Lent byPublic Sector 46.1 43.1 14.3 14.6 16.0 16.8 17.6
Direct Borrowing byPrivate Sector 10.9 13.8 33.3 28.5 28.1 27.0 26.4
Total Private Sector /aUse of Foreign Funds 57.0 56.9 47.6 43.1 44.1 43.8 44.0
Source: MEDIAD.
/a Includes funds relent in addition to CFBP (Table 2.9) the breakdown of whichwas not available.

- 24 -
Table 2.11: OFFICIAL NON-OIL SHORT-TERM DEBT(percent; US$ million)
1976 1977 L978 1979 1980 1981 1982
Non-Oil Sector 463 759 1,313 1,563 1,838 2,144 2,411
Share of:Public Sector(%) 10.8 18.2 21.8 20.2 12.9 31.7 36.0
Private Sector(Z) 89.2 81.8 78.2 79.8 87.1 68.3 64.0
Source: MEDIAD.
2.29 Data on loans extended by the foreign currency deposit units (FCDU)to Philippine borrowers are not available on an end-user basis. Interviewswith FCDU banks reveal, however, that a large part of their lending has beendirected to private sector units in the mining and manufacturing sectors. Thepublished data also reveal that the growth of the FCDU system has slowed inrecent years. Assuming that relative public/private sector access to FCDUlending has not changed drastically in the rectent period, the slower growth ofthe system would imply that private sectcr borrowing from the FCDUs has alsoslowed.
2.30 In terms of the use of all three types of foreign finance - medium-and long-term funds, short-term credits and foreign loans intermediatedthrough the FCDU system - it is evident that the private sector demand forforeign funds slowed down considerably. This perhaps reflected the combinedeffect of domestic recession, increased government use of foreign funds, take-over of private concerns by public enterprises, and the private sector'sresponse to hardening of loan terms. It would be useful in this context tofurther investigate if the private sector was really responsive to the changedeconomic and financial conditions and whether the public sector failed to doso.
Debt Service Obligations
2.31 The rapid growth of the Philippine foreign debt and the changes inits structure have led to a steep rise in the country's debt service obliga-tions during the last few years. Although deficient in several respects, thedebt service ratio (DSR), especially its trend over time, serves as a goodindicator of the country's ability to service its debt. Combined with ananalysis of export trends, import needs, and level of reserves, it can serveas a reliable indicator of emerging payments difficulties.
2.32 Table 2.12 presents alternative DSRs (see footnotes to the Table fortheir definitions). The top row presents the official Philippine DSR using astatutory definition laid down in 1970. The second block of DSRs gives

- 25 -
alternative definitions used in the World Bank which are increasinglycomprehensive in descending order. An examination of the various DRSs,especially the more comprehensive ones, leads to the following conclusions.First, the burden of debt shows an upward trend during 1977-82. This trendreflects the increasing share of commercial debt mitigatged by a moderatelyhigh growth rate of foreign exchange earnings/receipts through 1980. Second,the debt service burden rose sharply starting in 1981 (the Bank DSRs are moreindicative here). This was both due to a continued rise in the debt servicepayments for the reasons given earlier and a slow-down of export receipts in1981 and a drop in 1982. The DSRs thus clearly show that the economy hadbecome vulnerable towards the end of the period on account of the increaseddebt service burden.
2.33 Here, it would be useful to discuss the relative merits of variousdefinitions of DSR. It is worth noting, for example, that the divergenceamong various DSRs increases substantially between 1977 and 1982. Althoughthe trends of the Bank DSRs are similar (and therefore anyone of them couldhave indicated the increasing debt service burden), alternative IIc appears tobe the most comprehensive which captures all service Wbilities and shows howmuch of export receipts would be pre-empted by them .- In retrospect, wecould say that this definition was the most relevant to the Philippine situa-tion in the last few years and could have signaled the emerging paymentsdifficulties of the country. By the same measure, the official definition(see Table 2.12, footnote /a) was the least satisfactory. The official DSRdid not show any significant rise even in the critical years of 1981-82 whenthe other DSRs increased sharply. Even conceptually, debt service obligationsshould be related to current receipts (which are used to discharge them)rather than to the last year's, and to export earnings rather than to allreceipts. The official DSR also does not include interest payments on short-term revolving debt and banking system liabilities which have clearly becomeimportant in recent years. In view of these shortcomings, the PhilippineGovernment should reexamine the use of this definition. Even if the legalrequirement were to remain the same, at least for analytical and policypurposes the Central Bank should use the more commonly accepted definitions,such as those given in block II, Table 2.12.
24/ An even more stringent definition would be if the reduction in short-termdebt or banking liabilities, forced or discretionary, were to be includedin the debt service.

Table 2.12: EXTERNAL DEBT SERVICE RATIOS, 1977-82
(%)
1977 1978 1979 1980 1981 1982
I. Philippines debt service ratioas statutorily defined /a 13.8 18.0 18.6 18.7 19.1 19.4
II= World Bank debt service ratios lb
a. MLT debt 12.1 1.6.0 16.1 14.6 18.3 27.0
b. MLT debt, IMF obligations,ofricial short-term debt, and netbanking system liabilities /c 14.6 19.0 19.4 18.2 20.0 32.8
c. Same as b. but based on gross bankingsystem liabilities Ic 15.3 20.0 20.1 20.9 25.2 38.1 O
Ia Ratio of interest and principal payments on MLT debt, IMF obligations and fixed short-term debt(primarily bridge financing of development projects) to the previous year's total foreign exchangereceipts.
lb Ratio of principal and interest payments to exports of goods and services. Prepayments are excluded.
/c Only interest payments have been included for revolving credits (other than D/As and 0/As) and bankingsystem liabilities.
Source: Table A.21, Statistical Appendix.

- 27 -
2.34 The preceding sections have pointed to the large role played by thepublic sector both as a borrower and as an ultimate user of foreignresources. Reflecting this position, T,ble 2.13 shows that the public sec-tor's share in debt service payments 25 has generally been above 45% during1977-82 and that the trend has been sharply upward during the last threeyears.
Table 2.13: PUBLIC SECTOR DEBT SERVICE PAYMENTS(US$ millions percent)
Alternative IIb Ia 1977 1978 1979 1980 1981 1982
Total Debt Service Payments 324.4 681.3 766.0 720.7 1,029.0 1,479.6
MLT DebtPrincipal and Interest 315.7 644.7 805.4 585.3 850.3 1,029.0
IMF Obligations 48.3 92.2 91.5 194.9 123.1 148.7
Official Short-Term D bt 51.4 94.4 85.1 179.5 231.6 319.9Interest Payments u7 6.0 14.5 18.0 63.4 146.1 239.2Principal Payments onFixed Short-Term Debt 45.4 79.9 67.1 116.1 85.5 80.7
Net Liabilities of theCentral Bank -91.0 -150.0 -216.0 -239.0 -176.0 18.0
Public Sector DebtService Ratio (%) 7.7 13.9 12.2 9.0 11.9 18.5
Share of Public Sector DebtService in Total DebtService (x) 47.1. 46.2 44.3 43.0 47.8 49.8
Memo:Public Sector's Share ofOfficial Short-Term
Debt (Z) 28.6 42.6 52.8 58.2 59.4 60.7
/a See Table 2.12 for the explanation of components of Alternative IIb.Prepayments could not be excluded for this table. Therefore, the debtservice payments and ratios are overstated especially for 1978 and 1979.
/b Determined on the basis of the public sector's share in short-term debt.
Source: DRS, MEDIAD, IMF.
25/ Calculated according to Alternative IIb.

- 28 -
3. INVESTMENT AND SAVINGS
Investment and Savings Behavior
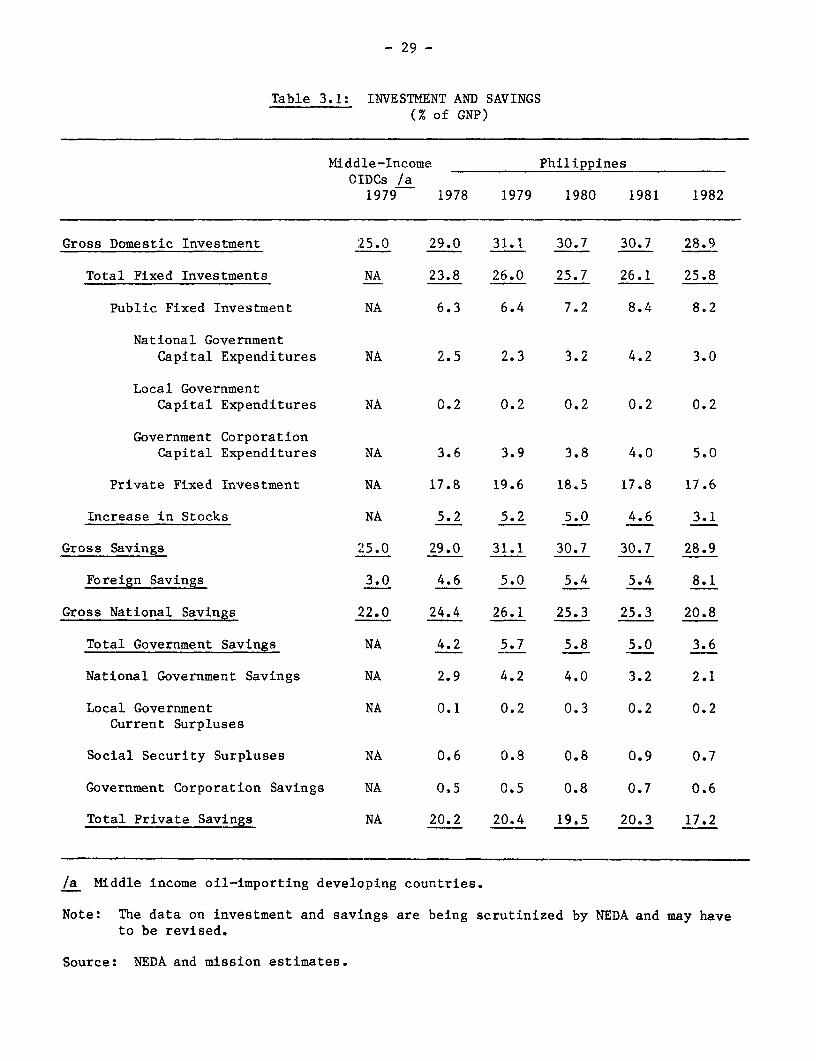
3.01 A fuller analysis of recent trends in the Philippine debt needs totake into account the behavior of investment and savings in the economy.Table 3.1 presents the investment and savings data for the Philippines forrecent years and for the middle income oil-importing developing countries(OIDCs) for 1979. These data show that comparea to the middle income OIDCs,the Philippines sustained a significantly higher investment/GNP ratio during1978-82. Even the oil crisis of 1971I80 and subsequent recession does notappear to have affected this ratio.- At'the same time, the share of grossnational savings in GNP has been decLining since! 1979. Consequently, the gapbetween gross domestic investment and gross national savings (i.e., thecurrent account deficit) has been met by an expanding inflow of foreignresources. Whereas in 1978 the share of foreign resources in GNP was 4.5%, by1982 it was over 8%.27/
26/ The decline in the rates of gross deomestic investment of 2 percentagepoints during 1979-82 was primarily due to the decline in stock accumula-tion rates. The stock figures, as well as overall investment figureswhich are considered to be somewhat overstated, are being scrutinized byNEDA. Even if the investment series is revised downwards, its trend islikely to remain unaffected. Similarly, the investment-savings gap mayremain unaffected since savings are a residual and will also have to berevised downwards.
27/ The investment-savings gap predates the period discussed here. Theinvestment/GNP ratio (including changes in stocks) had increased from21.5% in 1973 to 26.9% in 1974 anct then settled around 30% for theremainder of the period. National savings also increased but not suffi-ciently to offset the increase in investment. (These sharp jumps ininvestment and savings may partly be a statistical phenomenon.) Theresult was that the domestic investment and savings gap which wasnegligible during 1970-74, expanded to over 5% of GNP in subsequentyears. Thus, the investment-savings gap had become significant startingin 1974 which ties in with the analysis of Chapters 1 and 2 showing thatthe sizable capital inflows and the build-up of the external debt hadstarted in the mid-1970s. However, this Chapter focuses on the period1978-82 because adequate breakdown of the macro data was not availablefor the earlier years and the major build-up of the external debtoccurred in these years.
- 29 -
Table 3.1: INVESTMENT AND SAVINGS(% of GNP)
Middle-Income PhilippinesOIDCs /a1979 1978 1979 1980 1981 1982
Gross Domestic Investment 25e0 29.0 31.1 30.7 30.7 28.9
Total Fixed Investments NA 23.8 26.0 25.7 26.1 25.8
Public Fixed Investment NA 6.3 6.4 7.2 8.4 8.2
National GovernmentCapital Expenditures NA 2.5 2.3 3.2 4.2 3.0
Local GovernmentCapital Expenditures NA 0.2 0.2 0.2 0.2 0.2
Government CorporationCapital Expenditures NA 3.6 3.9 3.8 4.0 5.0
Private Fixed Investment NA 17.8 19.6 18.5 17.8 17.6
Increase in Stocks NA 5.2 5.2 5.0 4.6 3.1
Gross Savings 25.0 29.0 31.1 30.7 30.7 28.9
Foreign Savings 3.0 4.6 5.0 5.4 5.4 8.1
Gross National Savings 22.0 24.4 26.1 25.3 25.3 20.8
Total Government Savings NA 4.2 5.7 5.8 5.0 3.6
National Government Savings NA 2.9 4.2 4.0 3.2 2.1
Local Government NA 0.1 0.2 0.3 0.2 0.2Current Surpluses
Social Security Surpluses NA 0.6 0.8 0.8 0.9 0.7
Government Corporation Savings NA 0.5 0.5 0.8 0.7 0.6
Total Private Savings NA 20.2 20.4 19.5 20.3 17.2
/a Middle income oil-importing developing countries.
Note: The data on investment and savings are being scrutinized by NEDA and may haveto be revised.
Source: NEDA and mission estimates.

- 30 -
3.02 To identify the sources of investment-savings gap, we have decom-posed it into sectoral investment-savings deficits: those of the privat 8 /sector (an amalgam of the household and the private corporate sectors);- thegovernment sector (comprising national government, local government, and theSocial Security Administration); and the governiment corporations sector (seeTable 3.2).
3.03 Several conclusions emerge from the decomposition of the investment-savings gap. First, the public sector gap was relatively high (especially ifsome increases in stocks were to be attributed to the public sector) through-out the period 1978-82 and more than tripled by the end of the period.Second, the major increase in the public sector gap occurred on account ofgovernment corporations whose investment growth was not matched by theirsavings growth. Third, the private sector gap was relatively low during theperiod. Overall, we could say that, during 1978-82, the major source of thecountry's investment-savings gap was the public sector. This corroborates thefindings of Chapter 2 that the share of public sector as an end-user offoreign resources increased during 1978-82.
Resource Use by the Public Sector
3.04 We have seen above that the public sector investment-savings gap wasthe main source of the national gap. A further analysis of this gap pointstowards some other weaknesses of the public sector program in the context ofexternal debt and debt service capacity.
28/ Although investment data for the Philippines do not permit the privatesector to be disaggregated into households and corporations, it is expec-ted (as is generally true of other countries) that the Philippine house-hold sector is a net saver and that there is a net demand for savingsoriginating from the private corporate sector.
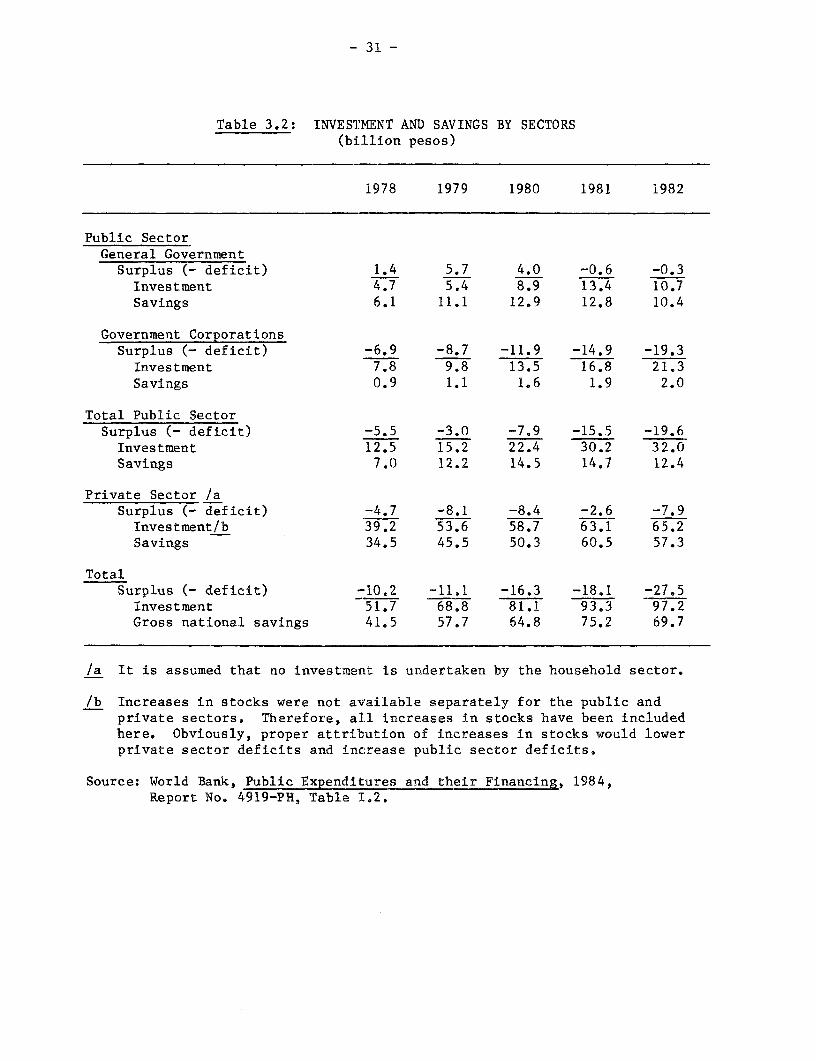
- 31 -
Table 3.2: INVESTMENT AND SAVINGS BY SECTORS(billion pesos)
1978 1979 1980 1981 1982
Public SectorGeneral GovernmentSurplus (- deficit) 1.4 5.7 4.0 -0.6 -0.3Investment 4.7 5.4 8.9 13.4 10.7Savings 6.1 11.1 12.9 12.8 10.4
Government CorporationsSurplus (- deficit) -6.9 -8.7 -11.9 -14.9 -19.3Investment 7.8 9.8 13.5 16.8 21.3Savings 0.9 1.1 1.6 1.9 2.0
Total Public SectorSurplus (- deficit) -5.5 -3.0 -7.9 -15.5 -19.6Investment 12.5 15.2 22.4 30.2 32.0Savings 7.0 12.2 14.5 14.7 12.4
Private Sector /aSurplus (- deficit) -4.7 -8.1 -8.4 -2.6 -7.9Investment/b 39.2 53.6 58.7 63.1 65.2Savings 34.5 45.5 50.3 60.5 57.3
TotalSurplus (- deficit) -10.2 -11.1 -16.3 -18.1 -27.5Investment 51.7 68.8 81.1 93.3 97.2Gross national savings 41e5 57.7 64.8 75.2 69.7
/a It is assumed that no investment is undertaken by the household sector.
/b Increases in stocks were not available separately for the public andprivate sectors. Therefore, all increases in stocks have been includedhere. Obviously, proper attribution of increases in stocks would lowerprivate sector deficits and increase public sector deficits.
Source: World Bank, Public Expenditures and their Financing, 1984,Report No. 4919-PH, Table 1.2.

- 32 -
3.05 National Government. According to the government budget, capitalexpenditures include capital outlays for infrastructure and non-infrastructureas well as for capitalization (equity contributions). Another element ofexpenditure which is similar to capital expenditure is net lending or advancesto special funds such as the Industrial Rehabilitation Fund. The task at handis to assess the relative importance of these capital expenditure categories,and to examine their financing with the object of identifying the respectiveroles of the current cash surplus, net foreign borrowings, and domesticfinancing.
3.06 Table 3.3 shows that during 1978-82 the share of direct capitaloutlays had declined while the shares of equity contributions and net lendinghad increased significantly. In 1978, the latter categories accounted for 37%of the aggregate of capital expenditures: by 1982 their share had risen toabout 54%.
3.07 Among the financing sources, the contribution of the cash surplus,which in the initial years was well in excess of the total of equity contribu-tions and net lending, declined over the period: by 1982 the latter had out-stripped the former. The sharp decline of the cash surplus in 1981-82 wasattributable in large part to the sluggish growth of tax revenues.
3.08 Thus, over the last three years, capitalization and net lending hasacquired greater share in government capital expenditures, and the latter havebeen increasingly financed by foreign and domestic borrowing. The share offoreign borrowing was sizable; in 1978-79, it financed about a third of thetotal capital expenditures and net lending. Domestic financing assumedgreater importance in 1981-82.297 The banking system's contributions wereparticularly large in the same two-year period. The non-bank sector's contri-bution rose to a substantial level by 1982 owing to its increased absorptionof Treasury bills, which was related to the Government's continuiniefforts todevelop the securities market as a tool of open market operations.J°/
29/ The year 1981 was to some extent an exception: a small spurt in foreignborrowing occurred in tandem with increasing recourse to domesticresources.
30/ In 1981-82, more Treasury bills were issued to the public and the termsand yields of government securities were rationalized. During the lastquarter of 1982, dollar-denominated Treasury bills were floated to helpfinance government projects.
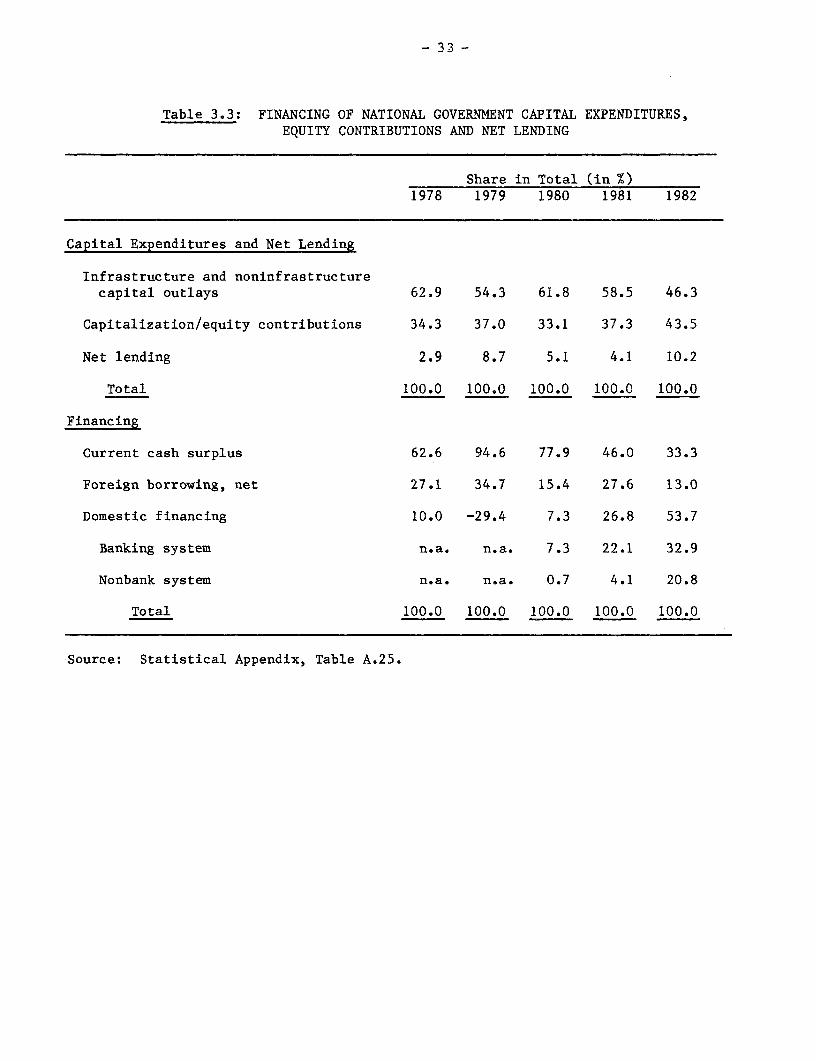
- 33 -
Table 3.3: FINANCING OF NATIONAL GOVERNMENT CAPITAL EXPENDITURES,EQUITY CONTRIBUTIONS AND NET LENDING
Share in Total (in %)1978 1979 1980 1981 1982
Capital Expenditures and Net Lending
Infrastructure and noninfrastructurecapital outlays 62.9 54.3 61.8 58.5 46.3
Capitalization/equity contributions 34.3 37.0 33.1 37.3 43.5
Net lending 2.9 8.7 5.1 4.1 10.2
Total 100.0 100.0 100.0 100.0 100.0
Financing
Current cash surplus 62.6 94.6 77.9 46.0 33.3
Foreign borrowing, net 27.1 34.7 15.4 27.6 13.0
Domestic financing 10.0 -29.4 7.3 26.8 53.7
Banking system n.a. n.a. 7.3 22.1 32.9
Nonbank system n.a. n.a. 0.7 4.1 20.8
Total 100.0 100.0 100.0 100.0 100.0
Source: Statistical Appendix, Table A.25.

- 34 --
3.09 Resource Mobilization by Public Corporations. We have seen earlier(Table 3.2) that public corporations accounted for the bulk of the investmentundertaken by the public sector. Here we examine in greater detail theinvestment financing of 12 major non-financial public corporations, whichconstitute the overwhelming share of the government corporate sector. AsTable 3.4 hows, investments of these corporations more than doubled during1978-82.31 However, the increase in the internal cash generated by them wasinsufficient. Consequently, their investment-savings gap, which was alreadysizable in 1978, more than doubled by 1982.
Table 3.4: MAJOR NON-FINANCIAL PUBLIC CORPORATIONSSUMMARY OF OPERATIONS
1978 1979 1980 1981 1982
(million pesos)
Investment outlays 7,086 8,543 10,146 12,776 15,157Internal cash generation /a 896 1,065 1,631 1,879 2,041Investment-savings gap 6,190 7,479 8,515 10,897 13,116Government contributions (Net) 3,545 4,331 4,282 4,458 6,414Other domestic financing /b -334 -3,588 -1,931 -1,128 -570Foreign financing (net) 2,979 6,735 6,164 7,567 7,272
(percent of investment outlays)
Internal cash generation 12.6 12.5 16.1 14.7 13.5Government contribution 50.0 50.7 42.2 35.0 42.3Other domestic financing -4.7 -42.0 -19.0 -8.9 -3.8Foreign financing 42.0 78.8 60.7 59.2 48.0
Source: Ministry of Budget; World Bank, Public Expenditures and TheirFinancing, 1984, Report No. 4919-PH, Table 1.9.
/a Depreciation plus net income.7i Treated as the residual and includes change!s in working capital.
31/ Table 3.4 focuses on fixed capital formation. Table 3.2 takes intoaccount changes in stocks also.

35 -
3.10 The major source of domestic funding for the investments of thepublic corporations were government contributions which remained above 40% forall but one year during 1978-82 and, in turn, required financing by foreignand domestic credit discussed earlier. However, the bulk of the investmentswas financed through foreign funds, averaging nearly 60% for the whole five-year period.
3.11 Investment Pattern and Debt Servicing Capacity. The discussion ofinvestment-savings gap, combined with the analysis of the preceding Chapters,sheds light on the sectoral sources of demand and use of foreign funds. How-ever, the utilization pattern of these resources is important from the pointof view of not only the overall growth performance but also the economy's debtservicing capacity (DSC). In aggregate terms, DSC depends on national savingsand foreign exchange earnings. If, however, the share of foreign funds ininvestment is large, the allocation of these funds has direct implications forthe future DSC. The DSC generated by these funds (as by domestic funds)depends on the rate of return of the investments undertaken, the time profileof these returns, the foreign exchange savings/earnings generated, and theimpact on marginal savings rate (including taxability of the returns). Wecannot here go into the details of the disaggregated data on the use of for-eign resources, but a few indicators show that the investment pattern was notespecially geared to expanding the DSC. As Table 3.5 shows, the economy-wideICOR has considerably increased during 1978-82. This may in part reflect theincreased idle capacity on account of the recent domestic recession anddeclining growth rate. But the ICOR was relatively high even in pre-recessionyears and had increased to 6.0 by 1980. This was partly a result of the largeweight of public sector infrastruciure projects in total investment withrelatively long gestation periods. 2 During the second half of the 1970s,close to 40% of public sector expenditures consisted of investment ininfrastructure. Such investment may be highly desirable for future growth,but its direct impact on savings and exports is likely to be small and/orlagged with the result that it may not contribute sufficiently to DSC in theimmediate future. That is, the time profile of the benefits may be quitedifferent from DSC needs. This problem is compounded if investments have beenfinanced by shorter maturity, high interest commercial loans, as they were inthe Philippines.
32/ The relatively high ICOR has also been interpreted to reflect investmentinefficiency in the economy.
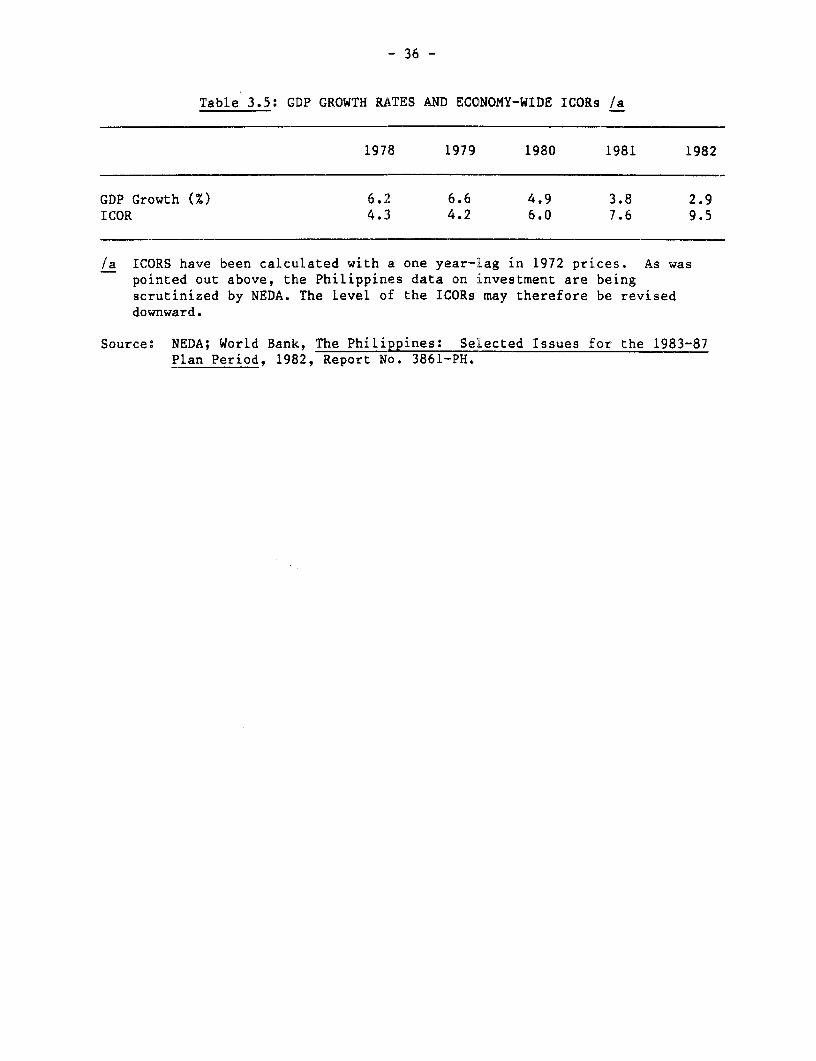
- 36 -
Table 3.5: GDP GROWTH RATES AND ECONOMY-WIDE ICORs _a
1978 1979 1980 1981 1982
GDP Growth (%) 6.2 6.6 4.9 3.8 2.9ICOR 4.3 4.2 6.0 7.6 9.5
/a ICORS have been calculated with a one year-Lag in 1972 prices. As waspointed out above, the Philippines data on :investment are beingscrutinized by NEDA. The level of the ICORs may therefore be reviseddownward.
Source: NEDA; World Bank, The Philippines: Seiected Issues for the 1983-87Plan Period, 1982, Report No. 3861-PH.

- 37 -
4. DEBT MANAGEMENT
The Institutional Framework
4.01 In the Philippines, the Central Bank has the responsibility formatters relating to external borrowing and balance of payments. Within theCentral Bank, the Management of External Debt and Investment Accounts Depart-ment (MEDIAD) is responsible for external borrowing and debt data collectionand classification. The genesis of MEDIAD's responsibilities lies in thepayments crisis that occurred in the Philippines toward the end of 1969, whichprompted the authorities to introduce a comprehensive system of controls overforeign capital inflow and non-monetary debt servicing. The major instrumentof control was a statistical system established early in 1971 for maintainingan accurate and up-to-date record of the country's external debt.
4.02 An effective debt management system must deal with three essentialand inter-related processes: knowing the debt size, dec W ng how much toborrow, and selecting appropriate financing techniques.- The first andthird are related specifically to debt but the second (how much to borrow) isrelated to the country's macroeconomic management decisions regardinginvestment, savings, and the size of the current account deficit.
4.03 An adequate debt management system must therefore have threeidentifiable foci: (1) the management of debt statistics; (2) the articula-tion of foreign borrowing strategies, or the management of debt per se; and(3) macroeconomic management. MEDIAD has primarily dealt with the first twotasks, focusing on the non-monetary sector borrowing. It has been involvedonly peripherally with the third. The decision as to how much to borrowflows, as mentioned earlier, from the macromanagement goals of the economy.This, in turn, is a composite of two factors: how much capital an economy canefficiently absorb, and how much debt it can service without risking externalpayments problems. MEDIAD has been concerned only with the second factor,that is, to alert the Government to potential payments problems based oncertain indicators, such as the statutorily defined DSR.
4.04 The more crucial links between macroeconomic management and borrow-ing decisions have been weak in the past. Although an Investment CoordinationCommittee (ICC) was set up in 1978, it does not yet play an effective role incoordinating investment allocation and foreign borrowing. The followingsections describe the roles of MEDIAD and ICC and examine the country's debtmanagement record.
33/ See Nicholas Hope, "Loan Capital in Development Finance, the Role ofBanks, and Some Implications for Managing Debt," EPDED Division WorkingPaper No. 1182-5, September, 1983; and Nicholas Hope and Thomas Klein,"Issues in Debt Management," Finance and Development, September 1983,Vol. 20, No. 3.

- 38 -
MEDIAD's Functions
4.05 The Management of Debt Statistics. MEDIAD debt statistics are builtup with the help of a monthly reporting system. All borrowing firms, finan-cial institutions, offshore banking units and authorized agent banks arerequired to report on individual loan drawdowns, repayments of the principal,interest payments, cancellations and outstanding amounts. An additionalresponsibility which has been vested in the Central Bank since 1970 is therecording of short-term debt. This follows from MEDIAD's responsibilities forevaluating and monitoring applicat:ions for short-term credit, reinforced inFebruary 1983, by a new set of guidelines on the approval and detailed moni-toring and recording of such debt. This is discussed more fully in thefollowing section.
4.06 Foreign Borrowing Strategy and the Management of Debt. MEDIAD playsa major role in determining the financing techniques used by the borrowers.Applications for foreign borrowing must include details of the proposedproject as well as on the type of financing envisaged to ensure Sh t thefinancing technique is compatible with the needs of the project .- Theserequirements apply uniformly to public and private sector borrowers.Borrowers are also asked to state whether they wish to receive funds from theCFBP.
4.07 MEDIAD also plays an active part in determining the terms of borrow-ing. As market conditions change, the Central Bank modifies the prescri gWmininium acceptable terms and conditions for approving foreign borrowing.-The positive effect of such interventions on the maturity distribution of out-standing public MLT debt has already beern noted. The other objective is tokeep the debt servicing capacity within the statutory limit.
4.08 For the last two years, MEDIAD has also enforced a queueing systemon the major foreign borrowers (those with loan demands in excess of $20 mil-lion) seeking to tap the international financial markets. The objective hasbeen to reduce competition among individual Philippine borrowers and to pre-vent "confusion" in the international markets.
4.09 MEDIAD has also monitored, the nature and extent of prepayments ofloans and has encouraged refinancing and restructuring, particularly in 1978-79, to induce borrowers to take advantage of changed market conditions,reduced interest costs, or improvements in the maturity structure. The record
34/ The information on financing must include details on amounts, thefinancing source, type of loan, and terms (maturity, grace period,repayment dates, and interest rate or spread). Project details mustinclude the total financing requirements, sources of domestic financing,project timetable, and potential economic benefits.
35/ Although no absolute ceiling is placed on the share of floating rate debtin total MLT debt, minimum maturities, grace periods, maximum interestrate spreads and other fees have been specified since 1970.
- 39 -
on prepayments since 1978 and on the pattern of approvals of external borrow-ing intended for refinancing and restructuring is set out in Table 4.1.
4.10 A major instrument used by the Central Bank, if not MEDIAD itself,to influence financing techniques is the CFBP program. The objective was toimprove the terms available to Philippine borrowers, particularly those whowould experience difficulty in arranging loans on their own account, by bor-rowing in the name of the Central Bank in relatively large amounts, and byreducing the number of times approaches were made to the market. An explicitobjective of the CFBP is to refinance foreign obligations obtained at rela-tively hard terms. As of the end of December 1982, of the $1.966 billionon-lent to sub-borrowers under the CFBP, 63% was for refinancing th 16 oreignobligations of both the public (41%) and the private (22%) sectors.-
4.11 The Central Bank and MEDIAD have also sought to influence the termstructure of foreign finance by monitoring and enforcing government policywith respect to short-term debt. Hiistorically, the control system was some-what flexible since approvals were granted to individual entities (rather thanto individual loans) to borrow short, subject to specific ceilings and forspecified purposes. The guidelines were, however, tightened in February 1983which required approval for each iniyidual credit if end-1982 balances ofindividual borrowers were exceeded. By way of reinforcement, aPresidential letter of instruction was issued in April 1983 that stressed thatshort-term commercial borrowing by public sector enterprises should bestrictly limited to that needed for use in trade-related transactions andshould not exceed the end of 1982 limit.
4.12 In addition, in recent years the Central Bank has taken steps tocontrol the exposure of Philippine residents under the foreign currencydeposit system, by specifying the purposes for which lending is allowed. Theauthorities have also taken steps to limit the availability of peso swapfacilities.
4.13 The most recent measure adopted by MEDIAD to monitor and influencethe finan5rjg mix is the establishment of a Committee to Monitor Foreign BankExposure.3 An attempt is also being made to provide systematic information
36/ Central Bank of the Philippines. The Philippine Economy: Policies andDevelopments, 1975 - 1982.
37/ Also, eligibility rules for the use of D/As and O/As were tightened,regulations on the opening of import letters of credit were revised,advance payment of import duties and taxes was required, an import sur-charge was imposed, and action was taken to reduce the petroleum stocksheld by oil companies.
38/ Its duties comprise the following: establishment of Creditor Data Banks;generation of reports for information release; establishment of files ondirect borrowing of banks; establishment of files on foreign equityinvestments; and interpretation of the Creditor Banks Corporate Profiles.

- 40 -
on the foreign exchange liabilities of the Philippine banking system and onthe net reserves of the Central Bank, the commercial banks and the bankingsystem as a whole. MEDIAD is also trying to prepare regular reports on theshare of total MLT debt and short-term debt attributable to banks and otherfinancial institutions and to monitor the exposure of Philippine residentswith individual foreign commercial banks.
4.14 Most of the measures adopted in early 1983 to improve the debt dataand approval system were in response to the deteriorating debt indicators andgrowing realization that certain aspects of the system, especially relating tothe short-term borrowing, were too weak. It is still too early to assess theeffectiveness of these measures; but, considering the rapid expansion ofshort-term debt in recent years and the resulting crisis, they came too late.
Table 4.1: REFINANCING, RESTRUCTURING AND REPAYMENT OF PRINCIPAL, 1976-82(US$ millions)
1976 1977 1978 1979 1980 1981 1982
Principal prepayments - - 505.7 492.3 91.7 24.1 96.0
Approvals Subject to Limits /a
Initial maturity of more thanone year, and up to and including12 years: Actuals 792 B60 1,128 975 1,800 1,481 1,016Of which
Refinancing and restructuring - - - - 152 508
Approvals Not Subject to Limits
Initial maturity exceeding 12 yrs 1,263 640 2,405 1,665 2,185 1,451 1,671Of WhichRefinancing loans 52 19 782 481 26 75 234Restructuring loans - 3 323 91 6 2 40
Total approvals 2,055 1 500 3,533 2,640 3,385 2,932 2,687
/a IMF or CB limits.
Source: MEDIAD.
4.15 Macroeconomic Management and the Borrowing Strategy. MEDIAD's inputinto government decisions regarding how much to borrow follows from itsresponsibilities under the "Foreign Borrowings Act," formally known as
- 41 -
Republic Act 4860 of September 1966.391 This Act, which authorizes thePresident to undertake and regulate foreign borrowing, specifies MEDIAD'smeans of control.
4.16 The first instrument of control is the statutory DSR. The lawspecifies that the size of foreign borrowing is to be determined with refer-ence to the debt service burden, which may not, in any given year, exceed 20%of the foreign exchange receipts (including capital inflows) of the immedi-ately preceding year. A second tool is the foreign borrowing approvalsystem: guidelines on permissible end-uses and the terms of foreign borrowingenable MEDIAD to influence the total amounts borrowed each year. Third,MEDIAD plays a valuable role in keeping the Central Bank, in its capacity asthe sole borrower under the Consolidated Foreign Borrowing Program, apprisedof the total demand for foreign funds emanating from public or private sectorunits which either fall outside the purview of concessional assistance or areunable to raise foreign funds at appropriate terms under their own names.This responsibility follows from MEDIAD's role as the recordkeeper of the exante demands for foreign funds projected by indiv'd al borrowers. Fourth,while the Investment Coordination Committee (ICC)- has recently been giventhe task of preparing an annual foreign resources budget for the economy, andwhile the Monetary Board determines the limits on foreign borrowing approvalsfor MLT loans, MEDIAD keeps actual demands below the stipulated annualceiling. It is MEDIAD, for example, that is responsible for ensurin1 that theIMF limits on external borrowing approvals are observed in practice.- Asnoted before, this is done by restricting the queueing of borrowers. Finally,MEDIAD is also responsible for maintaining a tally of the public/privatesector distribution of foreign funds. The CFBP explicitly stipulates that theproceeds of jumbo loans are to be divided equally between the private andpublic sectors.
4.17 There has been a loose relationship between approvals, commitmentsand disbursements in the past. Now the Central Bank is attempting to deter-mine the reasons for the long commitment-disbursement lags being recorded by
39/ Amended by Republic Act 6142 of November 1970 and other PresidentialDecrees.
40/ Specifically, the Foreign Resources Subcommittee of the ICC.
41/ The Fund ceilings have associated sub-ceilings. Under the 1976-78extended and the 1979 stand-by arrangements, ceilings were placed onborrowings with an initial maturity of more than 1 year up to and includ-ing 15 years, with sub-ceilings on borrowings of 1 to 10 years and 1 to 5years. In the 1980-81 and 1983 stand-by arrangements, ceilings wereplaced on borrowings with an initial maturity of more than 1 year up toand including 12 years, with a sub-ceiling on borrowings of 1 to 5years. In 1982, when no Fund arrangement was in effect, the authoritiesapplied a limit on borrowing of 1 to 12 years, and for 1983 the author-ities have announced limits on the volume of total borrowing that arelower than those specified in the stand-by arrangement.

- 42 -.
MEDIAD, with the purpose of stepping up disbursements as well as reducingborrowing costs in the form of the commitment fees associated with undisbursedloans.
4.18 In the past, strictly speaking, MEDIAD did not determine how muchshort-term debt ought to be contracted. However, because of its monitoringand its day-to-day contacts with the users of short-term facilities, it couldprovide, together with the BOP division, necessary information on prospectivetotal demand and the nature of the short-term credit being sought. InFebruary 1983, a new set of terms of reference were issued for the borrowersof short-term loans; MEDIAD monitors their implementation.
ICC and Macroeconomic Management
4.19 The analysis of the evolution and structure of the Philippine exter-nal debt suggests that the deterioration cf the country's debt indicators isin large part a result of deceleration of export receipts, a large publicsector investment program, inadequate internal savings, and excessive relianceon commercial sources of foreign capital. The timely identification of theseproblems requires a systematic assessment of export performance, public sectorinvestment, sectoral distribution of domestic and foreign resources, effi-ciency of resource use, domestic credit expansion, foreign borrowing, anddomestic savings generation.
4.20 Although the Government recognizes the need for such an assessment,and has a number of agencies involved in various tasks, it does not yet have asufficiently integrated institutional f2a ework for this purpose. In 1978,the Government had established the ICC, _ which, if effective, couldadequately perform several of the relevant functions. The ICC is an inter-agency body composed of the Minister of Finance (Chairman), Director-General,NEDA, Chairman, Board of Investments, Minister of the Budget, Governor,Central Bank, and heads of six public financial institutions. The mainresponsibilities of the conmittee are approving projects and setting upproject priorities within the context of the national development plans.
4.21 At present, the ICC reviews new project proposals (including privatesector projects costing 300 million pesos or more), which are submitted to itannually. The first step is to evaluate projects in terms of their fiscal,monetary, and foreign exchange earning/savings potential. The next step is tomatch the resource demand and availability (both domestic and foreign) of"tapproved" project list. The assessment of resource availability for majorprojects in the public sector is linked to an assessment of their impact onthe national budget and/or on the resource positions of the major publicsector entities. To complete the appraisal of the peso requirements of aproject, the analysis next addresses the implications for domestic credit andmonetary policies. The analysis of foreign resource demand and availability
42/ Investment Coordinating Committee. Its precursor was the Committee onForeign Assisted Projects, which was part of the Ministry of Finance, butits purview was more restricted.

- 43 -
builds on the assessment of the country's export prospects, repaymentobligations, and foreign borrowing potential.
4.22 All applications are initially considered by a subcommittee of theICC, called the Subcommittee on Major National Projects (SMNP). In the past,various working groups were responsible for project evaluation, assessment ofresource demands against budgetary and foreign exchange availabilities, andprogramming and monitoring. These functions have now been absorbed by NEDA.The assessment of projects is next submitted to a Technical Board composed ofsenior officials from the same institutions as are represented on the ICC andthe SMNP. The Technical Board then forwards its re-evaluated projectassessments to the SMNP. Following a further round of evaluation, the SMNPsubmits the list of approved and non-approved projects to the ICC for itsapproval. Final approval of projects with foreign financing must come fromthe NEDA Board, which is a ministerial group chaired by the President.
4.23 Although the ICC and its sub-groups have existed for a few years,they do not appear to have been very effective at least until recently. Theyare also not sufficiently integrated into other economic management deci-sions. The ICC is currently attempting to mesh the project approval processand the national budgetary cycle by imposing appropriate deadlines for projectsubmission, and coordinating these with the correspondini deadlines for theforeign borrowing approval process at the Central Bank.4 / It will take sometime before these procedures become fully effective.
Debt Management: Scrutinizing the Record
4.24 From the Bank's cross-country perspective, the Philippines alreadyhas in MEDIAD an institutional structure which should be adequate for debtdata management; the statistical system established early in 1971 to provideup-to-date data on debt is one of the best in Asia and the Far East. However,debt data management suffers from a number of weaknesses. MEDIAD has thecapability to generate from its External Debt Transactions Registers a matrixof information on private sector debt broken down into guaranteed and nongua-ranteed, with the latter categorized by borrower, terms, sources of finance,etc. However, for want of adequate computing facilities, much of these datacannot be generated accurately or on time. A quarterly report to the Governor
43/ Effective 1983, the deadline for submissions is January 15; applicationsfiled later in the year have a low priority or are not allowed access toforeign borrowing in that year. Borrowers who fulfill MEDIAD guidelinesregarding purpose, source of financing, legal and financial conditionsfor borrowing, terms and potential benefits, receive preliminary author-ity to negotiate with foreign creditors. Generally, in part because ofthe Central Bank's policy of queueing for entry into the internationalmarkets, the period between the granting of formal approval to borrow bythe Central Bank and the finalization of a commitment to borrow in theform of a loan agreement is relatively short. Again, the first drawingmust commence within 90 days of the finalization of a loan commitment.No controls are exercised for subsequent drawings.
- 44 -
on all fixed term debt (including private sector debt), which covers composi-tion, sources, maturity structure, terms of debt, currency of repayment andpurpose is currently being prepared manually. HIowever, the data on privatedebt need to be carefully checked and to be readily accessible in terms of therequisite detail and time series. Similar problems do not exist in the publicdebt data series because of the reporting requirements of the World Bank'sdebtor reporting system (DRS).
4.25 Another relatively simple problem that: has generated confusion amongoutside analysts of the Philippines' debt is the discrepancy between MEDIAD'sfigures on capital flows (both short-term and MLT) and flows entering thecapital account of the balance of payments (BOP). In recent years, theincrease in MLT debt recorded by MEDIAD has normally been higher than the netlong-term borrowing shown in the BOP statistics. The main reasons for thedifference have been late reporting by borrowers and valuation adjustmentsresulting from differences in the exchange rates used for computations at thebeginning and end of the year. The capital account in the balance of paymentsstatistics is generally not corrected for these changes. Rather, adjustmentsare entered in the errors and omissions line. MEDIAD, on the other hand,while it keeps an accurate record of all adjustments, does not correct thehistorical data to reflect them. The consequent inconsistency in the numbershas given rise to doubts about the accuracy of E'hilippine debt data.
4.26 Similar problems exist in the official short-term debt data. Inrecent years, the increase in official short-term debt as recorded by MEDIADhas been slightly higher than the net change in short-term lending identifiedin the balance of payments. Significant discrepancies between the two sets ofdata emerged in 1981 and 1982. One source of the difficulty has been therecording of trade credits in the form of 0/As and D/As. In particular, itwas discovered in mid-1982 that large repayments of these credits by oil com-panies had not been recorded for several years, leading to an overstatement ofoutstanding debt. Part of the discrepancy during 1976-79 was traced to someCentral Bank transactions that had been classified as capital movements in theBOP but which should have been recorded as net monetary movements. A furthersource of discrepancy is that the BO? statistics are not adjusted to reflectlate reporting by borrowers or changes in their outstanding debt.
4.27 In the area of short-term debt, MEDIAD's data suffer from anadditional limitation--they are internally consistent starting only in 1980,since MEDIAD's responsibilities for monitoring short-term debt data were notas clear prior to that year. To outsiders with no information or access tothe historical data on adjustments, the discrepancies raise the question ofwhich debt series should be used to represent the country's foreign obliga-tions and for debt service calculations.
4.28 A further source of uncertainty about the size of the Philippinedebt in the past has been due to the exclusion of the banking system's short-
- 45 -
term foreign exchange liabilities from the official debt statistics.44/Controversy has surrounded the treatment of the assets and liabilities of theCentral Bank and of commercial banks operating under the foreign currencydeposit system. Even if obligations to the IMF are excluded from the CentralBank's short term external liabilities, there is still considerable room forargument about the components of the banking system's gross and net externalliabilities. Problems regarding the gross liabilities relate to the degree ofdoublecounting which needs to be removed in consolidating the banking system'sliabilities; problems relating to the estimate of net liabilities relate tothe appropriate identification of the assets available to cover the bankingsystem's liabilities, as distinct from the reserves available as importcover. The figures for the banking system's external liabilities are
44/ The external debt contracted by the Offshore Banking Units (OBUs) and theexternal liabilities of the banking system with an initial maturityexceeding 1 year are included in MEDIAD's MLT debt statistics.
- 46 -
5, IMPLICATIONS FOR THE FUTURE
5.01 The previous chapters have reviLewed the sources, growth, and manage-ment of the external debt of the Philippines. This chapter draws the policyimplications of this review. The first section of the chapter briefly updatesthe economic and debt situation and indicates the n W re of policy responserequired in the context of foreign borrowing needs.- The second sectionsuggests institutional improvements to deal with the existing debt problemsand future issues. Some of these improvements have already been initiated bythe Government.
Macroeconomic Policy and Foreign Borrowirn
5.02 Recent Developments and the 1983 Crisis. The economic conditions inthe Philippines, which had weakened in 1980-81, deteriorated significantly in1982. The domestic recession continued and the growth rate of GNP dropped to2.8%. The authorities had continued to follow expansionary policies in theexpectation that a quick and strong workl economic recovery would sufficientlyboost export earnings. But the international recession deepened, exportgrowth slowed down, and interest rates remained at record levels. Because ofthe domestic recession, the government re.venues continued to fall, expandingthe budgetary deficit to 4.3% of GNP. Simultaneously, the deficit of thepublic sector corporations remained high at 5.6% of GNP. These factorscontributed to domestic demand pressures and expanded the current accountdeficit to 8.1% of GNP. Because of the constraints on the availability of MLTfunds, the country relied on short-term credit lines and the net internationalreserve position worsened to negative $3.7 billion.
5.03 In 1983, the Government was able to reduce the budgetary deficit to2% of GNP. But the investment outlays of public sector corporations continuedto increase as did the net domestic asset.s. This exerted strong pressures ondomestic demand and imports while export performance remained weak.Consequently, the current account deficit, expanded further from 8.1% of GNPin 1982 to 8.2% in 1983. The Government strengthened the policies towards themiddle of the year through further fiscal restraint and a 7% devaluation ofthe peso. These measures did not, however, prove to be adequate.Furthermore, due to both political and economic uncertainties, capital flightincreased, foreign credit availability decreased, and international reservesfell sharply. Consequently, the Government sought a moratorium on debtrepayments to commercial banks, further devalued the peso, reimposed foreignexchange controls, reduced public investment program, increased import duties,and opened discussions with the commercial banks for debt rescheduling. Atthe end of 1983, gross external obligations had increased to $25 billion, up
45/ These developments are being dealt with in detail in the Bank's CountryEconomic memorandum currently under prepa1ration.

- 47 -
from $24.3 billion in 1982. The total debt service ratio (on the basis ofscheduled payments) remained high at 36% although it was down from 38% in1982.
5.04 Policy Implications. To deal with the crisis, the Government isfollowing a three-pronged strategy. First, it has adopted short-term stabili-zation measures. Second, it has requested rescheduling of the countrytscommercial debt falling due between October 17, 1983 and end-1986. Third, itis continuing with most of its structural adjustment program designed toimprove allocation and efficiency of investment, current account balance, andresource mobilization in the energy sector.
5.05 In the context of this study, one of the main objectives of theGovernment's adjustment efforts will have to be to improve the country'screditworthiness: for example, net. official reserves need to be built up toequal the value of about three months of imports, the short-term debt andcommercial banks' liabilities need to be reduced, and the ratios of debt anddebt service to exports need to drop significantly. This, in turn, wouldimply adoption of policies (with somewhat different policy mix for the short-and medium-term) to curtail current account deficits and arrange requisitecapital inflows at reasonable terms.
5.06 In the short-term, the country will need to restrain domestic demandsufficiently to limit the annual current account deficit to about $1-1.5 bil-lion. This would imply increased domestic savings, lower public sector defi-cits, a tight monetary policy, and continued price corrections. Because ofthe disruptions in economic activity on account of foreign exchange con-straints and the consequent policy steps, the country will probably experiencelittle or no growth during 1984-85. The adjustment would be facilitated ifimprovement in the external environment continues: at least a moderate growthrate in the OECD countries to allow expansion in the Philippine exports,availability of sufficient funds, and a moderaLe rate of interest.
5.07 The demands of medium-term adjustment would be somewhat different.In view of the high level of country's indebtedness and debt service payments,the scope for additional borrowing will remain limited through the early1990s. The proposed rescheduling of debt will ease the immediate paymentsproblem but will necessarily cause a hump in the late 1980s and stretch outthe debt service payments into the 1990s. The country will, therefore, needto follow a very careful course of macroeconomic (including debt) manage-ment. First, domestic absorption will need to remain constrained and savingsincreased. Second, a delicate balance will need to be maintained in externalborrowing. Sufficient capital inflows (foreign savings) will be needed toresume growth, but too much borrowing (given the existing large debt), ifavailable, could damage creditworthiness. On the other hand, lack of accessto foreign capital could reduce investment levels, constrain growth of outputand exports, and prevent a long-term resolution of the debt problem. Thus,the country might be able to run only small deficits on the current accountduring the next few years to permit some net additional capital inflow.Third, as a corollary of the above, investment efficiency will need to beimproved, import growth restrained, and determined efforts made to expandexports. Continuation of the reforms in industrial, trade, and energy

- 48 -
policies initiated under the structural adjustment program should help improveresource allocation, investment efficiency, export growth, and domestic energysupply. The recent adoption of a floating exchange rate will greatly help innarrowing the import-export gap. The Government will also need to emphasizeincreased efficiency in the use of imported inputs and increased value addedin exports. Export growth will play an especially crucial role in thecountry's economic recovery by facilitating necessary growth in imports andinvestment, Simultaneously, the Government will need to tighten its debtmanagement and utilize foreign savings eEficiently as discussed below.
Institutional Framework
5.08 The Philippines has a reLativeLy gocd system in place for externalborrowing and data management. However, as discussed in Chapter 4, the systemhas suffered from some limitations in the past: its monitoring of short-termdebt, especially commercial bank liabilities, has remained weak; debt manage-merit is not sufficiently integrated with economic management; and the systemdid not adequately provide for forecasting debt servicing problems. Theresult was that although danger signals of an emerging debt and balance ofpayments crisis were present, the system did not sufficiently highlight themor the economic management did not act on them. These signals were the drama-tic rise in short-term debt and banking liabilities with the associatedvulnerability of the economy to a failure to rollover the debt, an increasingdebt service ratio, a relatively high ratio of debt to GNP and exports, a highshare of debt on commercial and variable interest rate terms, persistence ofhigh real interest rates, and a high share of interest payments in debtservice. When all of these indicators are poor or worsening, as they were inthe Philippines, the country needs to take strong and immediate action tocorrect the situation. In retrospect, it appears that the Philippines shouldhave adopted adjustment measures in. time to prevent the large current accountdeficits in the eariy 1980s and the resultant expansion in external debt. Thefollowing paragraphs summarize the main weaknesses in the present system andsuggest possible corrective steps.
5.09 Clarifying the Size of Debt, In recent years, uncertainty about thesize and structure of foreign debt had affectedl the country's creditworthi-ness. Establishing the size of the total debt, building up a consistent timeseries of debt and its components, and removing any remaining gaps and incon-sistencies are important steps in improving debt management. The Central Bankhas appointed a task force which is currently engaged in this work.
5.10 Clarification of the debt data would aid the debt management processin several ways. It would alert the Government: to the magnitude and timing ofthe rollovers required if payments problems are to be avoided. By educatinggovernment agencies outside the Central Bank oIn this account, it could helpcurb demand for public expenditure programs intensive in the use of foreignfinance. It could identify the purposes for which short-term debt is beingused: currently gross short-term debt outstanding, including banking systemliabilities, is well in excess of the total annual import bill, suggestingthat some amount of short-term debt may be financing working capital or long-term needs.

49 -
5.11 Improved Retrieval of Debt Data. Although MEDIAD's performance inthe collection and maintenance of debt data (especially MLT debt data) hasbeen impressive, the Department is currently handicapped by inadequate compu-tational facilities. It is unable to retrieve debt information or to monitortrends with sufficient speed. The cXuntry has been borrowing a large part ofits debt at variable interest rates;-/ the currency composition of debt isalso fairly diverse. As the discussion in Chapter 2 implies, these develop-ments especially require a high degree of market and technical sophisticationon the part of debt managers. MEDIA]D will, therefore, need substantial aug-mentation of technical and computational staff to enable it to keep track ofall foreign exchange liabilities, to simulate various scenarios involvingchanges in debt structure, terms, and exchange rates, to formulate alternativeborrowing strategies, and to interpret them for the management.
5.12 Reducing the Exposure to Foreign Banks. About 68% of the totalexternal debt of the Philippines (including MLT debt, IMF obligations, offi-cial short-term debt, 4n4 the banking system's gross liabilities) was owed toforeign banks in 1982,.- The country's increased dependence on commercialshort-term debt especially made it vulnerable to the volatile short-termbanking flows (particularly inter-bank lines of credit). Commercial bankq'exposure with respect to their capital was also high in the Philipines. 8Debt managers need to plan a smooth reduction in the level of the country'sexposure and keep it at a manageable level.
5.13 Improved Debt Management. Although MEDIAD has performed well inmanaging some aspects of debt management (for example, in record keeping, con-straining the terms of MLT debt, and regulating entry into foreign financialmarkets through queuing), it has been somewhat ineffectual or constrained infulfilling other requirements of debt management. It was unable to fullyenforce public sector approval limits. The country's vulnerability on accountof expanding debt and debt service was not sufficiently highlighted. Part ofthe problem lies in the limited concept of debt management applied toMEDIAD: namely, debt data management. This concept needs to be expanded and
46/ About 36% of total public sector debt in 1982 carried variable interestrates.
47/ See Statistical Appendix, Table A.14.
48/ As of June 1982, the Philippines ranked sixth among developing countrieswith respect to the US bank exposure. The exposure was 8% for all U.S.banks, 14% for the 9 largest banks, and about 8% for the next 15 banks.For banks other than the 15 largest, the exposure was 2%. Data wasobtained from the U.S. Federal Reserve Board, semi-annual "CountryExposure Reports," Washingtn, D.C.
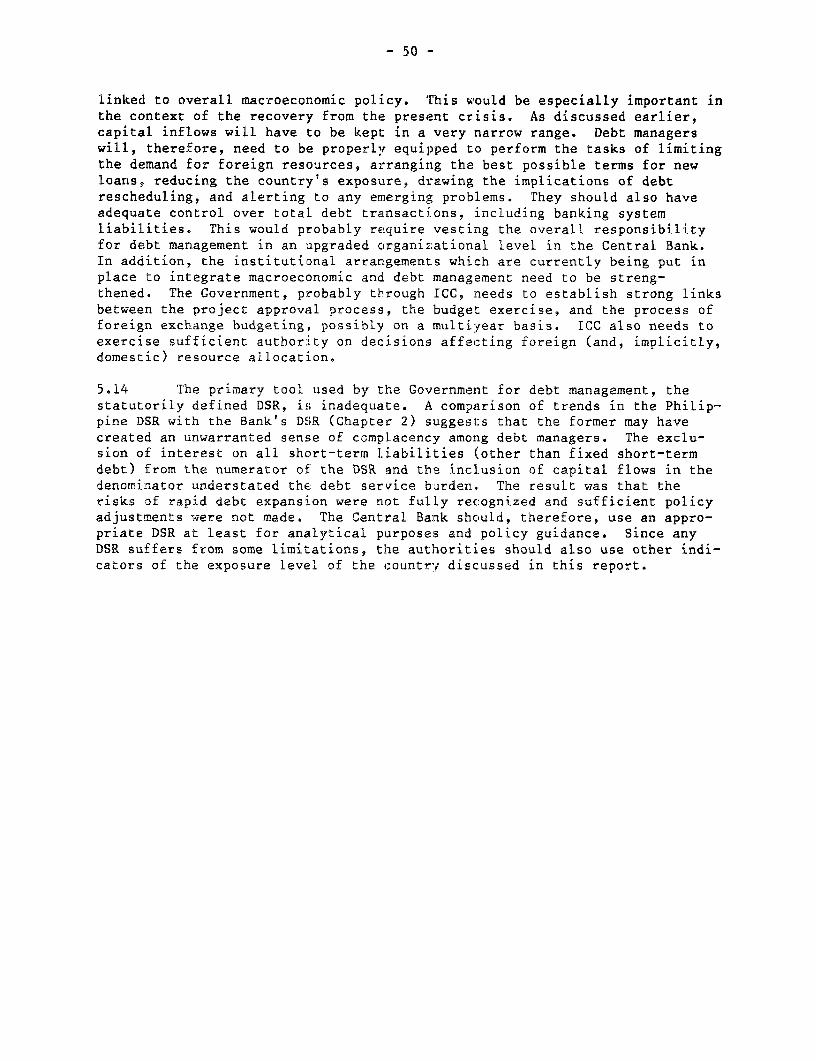
- 50 -
linked to overall macroeconomic policy. This would be especially important inthe context of the recovery from the preseBnt crisis. As discussed earlier,capital inflows will have to be kepl: in a very narrow range. Debt managerswill, therefore, need to be properly equipped to perform the tasks of limitingthe demand for foreign resources, arranging the best possible terms for newloans, reducing the country's exposure, drawing the implications of debtrescheduling, and alerting to any emerging problems. They should also haveadequate control over total debt transactions, including banking systemliabilities. This would probably require vesting the overall responsibilityfor debt management in an upgraded organizational level in the Central Bank.In addition, the institutionaL arrangements which are currently being put inplace to integrate macroeconomic and debt management need to be streng-thened. The Government, probably through ICC, needs to establish strong linksbetween the project approval process, the budget exercise, and the process offoreign exchange budgeting, possibly on a multiyear basis. ICC also needs toexercise sufficient authority on decisions affecting foreign (and, implicitly,domestic) resource allocation,
5.14 The primary tool used by the Government for debt management, thestatutorily defined DSR, is inadequate. A comparison of trends in the Philip-pine DSR with the Bank's DSR (Chapter 2) suggests that the former may havecreated an unwarranted sense of complacency among debt managers. The exclu-sion of interest on all short-term liabilities (other than fixed short-termdebt) from the numerator of the DSR and the inclusion of capital flows in thedenominator understated the debt service burden., The resuLt was that therisks of rapid debt expansion were not fully recognized and sufficient policyadjustments were not made. The Central Bank should, therefore, use an appro-priate DSR at least for analytical purposes and policy guidance. Since anyDSR suffers from some limitations, the authorities should also use other indi-cators of the exposure level of the country discussed in this report.

- 51 -
STATISTICAL APPENDIX
Table of Contents
Table No. Page No.
A.1 External Current Account Indicators, 1970-82 .... .............. 52A.2 Current Account of the Balance of Payments, 1970-83 .......... 53A.3 Balance of Payments 1972-83 ...... .0. .... ....... ................ . 54A.4 Total Debt, Outstanding and Disbursed, 1970-82 ............... 55A.5 External Medium- and Long-term Loan Commitments,
Classified by Type of Borrower ..........sees.. ................ 56A.6 External Medium- and Long-term Debt Transactions
Classified by Type of Borrower ............. ................. 57A.7 External Debt and Banking System Liabilities, 1976-82....,.... 58A.8 Structure of MLT Debt by Creditor, 1970-82 ................... 59A.9 Pattern of Private Sector MLT Debt ......0....................... 60A.10 Non-Oil Short-term Debt .. ............ . .. a. ... se .......... 61A.11 Structure of MLT Debt by Creditor, 1976-82 .................. O.. 62A.12 Public Sector Debt Commitments by Concessional/
Nonconcessional Categories ............. so.....es....es..... 63A.13 Public Sector Commitments by Currency ......................... 64A.14 Structure of External Obligations, 1981-82 ....... ...... . . 65A.15 Outstanding Borrowings under the CFBP ............ ............ 66A.16 Commitments and Approvals of MLT Debt. (1978-82) .............. 67A.17 Real Increase in Debt, 1970-82 ............................... 68A.18 Debt Indicators ...... o....... ......... ....... O...................... 69A.19 Foreign Exchange Reserves .................. ................. 70A.20 Structure of External Debt, 1976-82 .......................... 71A.21 External Debt Service Payments, 1977-82 ................ o.. 73A.22 External Debt Service, As Statutorily Defined, 1977-82 ....... 74A.23 Public Sector Debt Service Payments .......................... 75A.24 Consolidated Public Expenditures by Sector on an
Obligation Basis ..o.e .......... e .. .... ........ 00** ........... .... .. 76A.25 Financing of National Government Capital Expenditures,
Equity Contributions and Net Lending ....................... 77A.26 Trade Indexes ..* ....* * -. * * * * * * * * ** ....... .. . ... * **... 0.*...... 78A.27 Imports by Commodity Group 1981-82 ........................... 79

Table A.1: PHILIPPINES. EXTERNAL CURRENT ACCOUNT INDICATORS, 1970-82
1970 1971 1972 1973 1974 1975 1976 1977 1978 1979 1980 1981 1982
Exports /a 1,062 1,136 1,106 1,886 2,725 2,295 2,574 3,151 3,425 4,601 5,788 5,722 5,021(Annual % change) - (7) (-3) (71) (44) (-16) (12) (22) (9) (34) (26) (-1) (-12)
Volume index (1972=100) 88 96 100 108 96 102 131 157 153 167 201 204 215Price indices (1972=100) 111 106 100 146 242 193 169 171 192 236 246 241 200
Composition of exports(% of total)
Sugar 18 19 19 15 27 25 17 16 6 5 11 10 8Coconut. products 20 22 21 20 22 20 21 24 26 22 14 13 12Lumber, plywood, logs 25 16 19 21 10 9 10 8 9 10 7 5 5Copper 17 22 17 15 14 9 10 8 7 10 9 7 6Semiconductors - - - 1 1 2 3 3 5 6 9 11 15Garments - - - 3 3 4 7 8 10 9 9 11 11
Imports /a 1,090 1,186 1,230 1,597 3,143 3,459 3,634 3,915 4,732 6,142 7,727 7,946 7,667 u(Annual % change) - (9) (4) (30) (97) (10) (5) (8) (21) (30) (26) (3) (-4)
Volume index (1972=100) 93 99 100 94 110 116 123 119 141 154 156 143 163Price index (1972=100) 94 96 100 129 212 220 217 241 246 289 359 399 341
Composition of imports(Z of total)Mineral fuels & lubricants 11 12 12 12 21 22 24 25 22 23 29 31 27Machinery 27 27 24 23 17 23 22 19 20 22 17 17 18Road vehicles 7 8 8 6 5 6 5 5 6 5 4 3 3
Terms of trade (1972=100) 119 111 100 113 115 88 78 71 78 82 69 60 59
P/US$ 5.90 6.43 6.67 6.76 6.79 7.25 7.44 7.40 7,37 7.38 7.51 7.90 8.54REER /b 96.35 100,32 93.45 93.25 111.20 102.28 100.27 97.63 88e10 95.94 100.95 101.33 105.18
/a In US$ million./b Trade-weighted real effective exchange rate index with December 1980 = 100; increase in the index indicates appreciation
of the peso.
Source: Central Bank; IMF, International Financial Statistics.
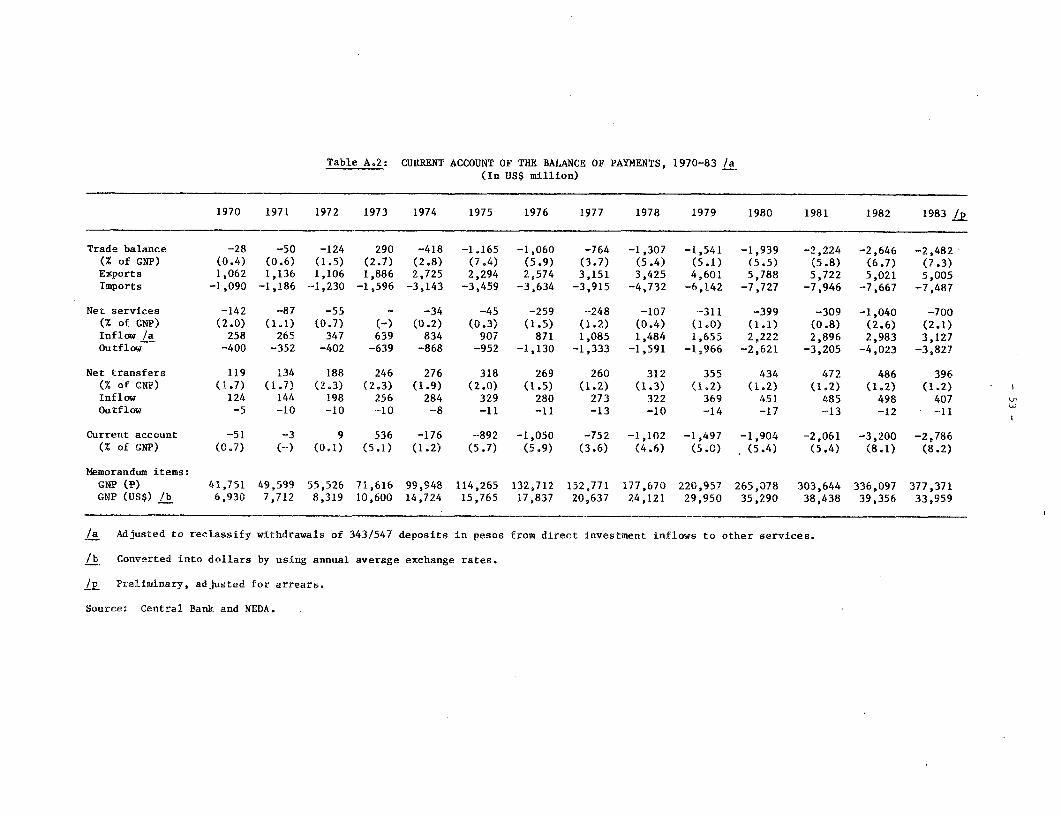
Table A.2: CURRENT ACCOUNT OF THE BALANCE OF PAYMENTS, 1970-83 /a(In US$ million)
1970 1971 1972 1973 1974 1975 1976 1977 1978 1979 1980 1981 1982 1983 /p
Trade balance -28 -50 -124 290 -418 -1.165 -1,060 -764 -1,307 -1,541 -1,939 -2,224 -2,646 -2,482(% of GNP) (0.4) (0.6) (1.5) (2.7) (2.8) (7.4) (5.9) (3.7) (5.4) (5.1) (5.5) (5.8) (6.7) (7.3)Exports 1,062 1,136 1,106 1,886 2,725 2,294 2,574 3,151 3,425 4,601 5,788 5,722 5,021 5,005Imports -1,090 -1,186 -1,230 -1,596 -3,143 -3,459 -3,634 -3,915 -4,732 -6,142 -7,727 -7,946 -7,667 -7,487
Net services -142 -87 -55 - -34 -45 -259 -248 -107 -311 -399 -309 -1,040 -700(% of GNP) (2.0) (1.1) (0.7) (-) (0.2) (0.3) (1.5) (1.2) (0.4) (1.0) (1.1) (0.8) (2.6) (2.1)Inflow /a 258 265 347 639 834 907 871 1,085 1,484 1,655 2,222 2,896 2,983 3,127Outflow -400 -352 -402 -639 -868 -952 -1,130 -1,333 -1,591 -1,966 -2,621 -3,205 -4,023 -3,827
Net transfers 119 134 188 246 276 318 269 260 312 355 434 472 486 396(% of GNP) (1.7) (1.7) (2.3) (2.3) (1.9) (2.0) (1.5) (1.2) (1.3) (1.2) (1.2) (1.2) (1.2) (1.2)Inflow 124 144 198 256 284 329 280 273 322 369 451 485 498 407Outflow -5 -10 -10 -10 -8 -11 -11 -13 -10 -14 -17 -13 -12 -11
Current account -51 -3 9 536 -176 -892 -1,050 -752 -1,102 -1,497 -1,904 -2,061 -3,200 -2,786(% of GNP) (0.7) (-) (0.1) (5.1) (1.2) (5.7) (5.9) (3.6) (4.6) (5.0) (5.4) (5-4) (8.1) (8.2)
Memorandum items:GNP (P) 41,751 49,599 55,526 71,616 99,948 114,265 132,712 152,771 177,670 220,957 265,078 303,644 336,097 377,371GNP (US$) /b 6,930 7,712 8,319 10,600 14,724 15,765 17,837 20,637 24,121 29,950 35,290 38,438 39,356 33,959
/a Adjusted to reclassify withdrawals of 343/547 deposits in pesos from direct investment inflows to other services.
/b Converted into dollars by using annual average exchange rates.
.j Preliminary, adjusted for arrears.
Source: Central Bank and NEDA.

Table A.3 : BALANCE OF PAYMENTS, 1972-83(US$ million)
1972 1973 1974 1975 1976 1977 1978 1979 1980 1981 1982 1983
Current AccountMerchandise trade (net) -124 290 - -1,165 -1,060 -764 -1,307 -1.541 -1.939 -2,224 -2,646 -2,482Exports 1,106 1,886 2,725 2,294 2,574 3,151 3,425 4,601 5,788 5,722 5,021 5,005Imports 1,230 1,596 3,143 3,459 3,634 3,915 4,732 6,142 7,727 7,946 7,667 7,487
net -55 - -34 -45 -259 -248 -107 -311 -399 -309 -1,040 -700Receipts /aa 347 639 834 907 871 1,085 1,484 1,655 2,222 2,896 2,983 3,127Payments 402 639 868 952 1,130 1,333 1,591 1,966 2,621 3,205 4,023 3,827
Private transfers (net) 152 169 201 252 237 240 283 229 300 325 322 237Receipts 158 172 202 255 239 244 286 234 3T5 328 324 242Payments 6 3 1 3 2 4 3 5 5 3 2 5
Official transfers (net) 36 77 75 66 32 20 29 126 134 147 164 159Receipts 40 82 74 41 29 36 135 146 157 174 165Payments 4 7 7 8 9 9 7 9 12 10 10 6
Current account balance 9 536 -176 -892 -1,050 -752 -1,102 -1,497 -1.904 -2.061 -3.200 -2,786
Capital accountDirective investments
(net) /a -22 64 28 125 144 216 100 20 -102 175 17 39
Private MLT loancapital (net) -17 -5 33 126 336 101 209 163 496 1Disbursements 137 196 27 6 331 33W8 476 90 790 875 9Repayments 154 201 243 205 202 375 696 627 374 } 1 332/d 1.548/d 1.316/d 4-
} 2,02 2,533 2,231Pu,blir M[4.T loan I
capital (net) 157 76 112 231 704 561 682 988 536 1 740 985 915Disbursements 235 184 180 346 869 766 945 1,320 709 1Repayments 78 108 68 115 165 205 263 332 173 1
Short-term capital (net) /c 37 -64 79 70 -332 -172 -90 -458 310 -219 -56 -755Inflows /b 579 657 1,138 1,283 1,381 2,475 3,442 4,265 7,537 8,767 12,127 13,670Outflows /b 542 721 1,059 1,213 1,713 2,647 3,532 4,723 7,227 8,986 12,183 14,425
Capital account balance 155 71 252 552 852 706 901 713 1.240 1.288 1.509 600
Errors and omissions /b -93 57 34 -181 37 210 115 145 126 -214 -207 -71Allocation of SDRs 16 - - - - - - 28 29 27 - -Monetization of gold 7 - - - - - 32 41 128 400 277 183
Overall Balance 94 664 110 -521 -161 164 -54 -570 -381 -560 -1621
/a Adjusted to reclassify withdrawals of 343/547 deposits in pesos from direct investments to other services (inflows).T7 Adjusted to relcassify constructive outward remittances, which represents the difference between export shipments and receipts arising
mainly from lag in remittances of export receipts, from errors and omissions to short-term capital./c original maturity up to and including one year.7T Total mediue and long-term loans.T Preliminary; adjusted for arrears.
Source: Central Bank of the Philippines.
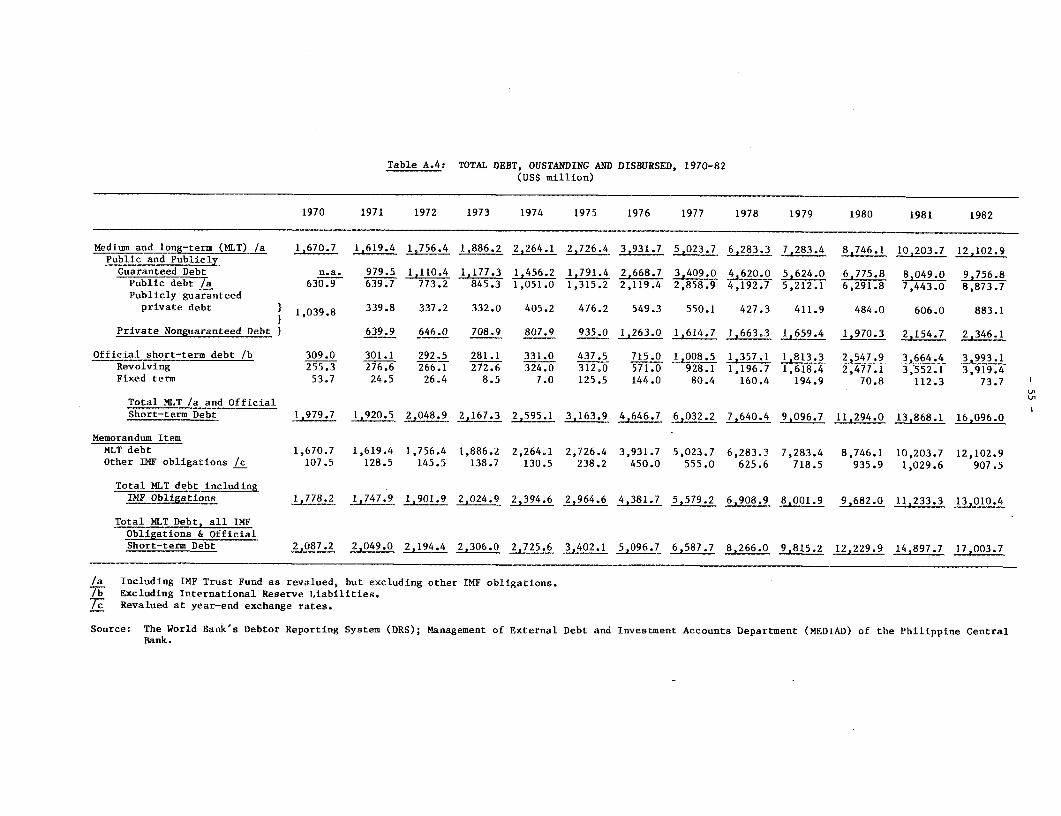
Table A.4: TOTAL DEBT, OUSTANDING AND DISBURSED, 1970-82(US$ million)
1970 1971 1972 1973 1974 1975 1976 1977 1978 1979 1980 1981 1982
Medium and long-term (MLT) /a 1,670.7 1,619.4 1,756.4 1,886.2 2,264.1 2,726.4 3,931.7 503.7 8 ,746.1 10, 203.7 12,102.9Public and Publicly
Guaranteed Debt n.a. 979.5 1,110.4 1,177.3 1,456.2 1,791.4 2,668.7 3 409.0 4 620.0 5,624.0 6,775.8 8,049.0 9,756.8Public debt /a 630.9 639.7 773.2 845.3 1,051.0 1,315.2 2,119.4 2,858,9 4,192.7 5,212.1 6,291.8 7,443.0 8,873.7Publicly guaranteed
private debt 1,039.8 339.8 337.2 332.0 405.2 476.2 549.3 550.1 427.3 411.9 484.0 606.0 883.1
Private Nonguaranteed Debt } 639.9 646.0 708.9 807.9 935.0 1,263.0 1 6 1,659.4 1,970.3 2,154.7 2,346.1
Official short-term debt /b 309.0 301.1 292.5 281.1 331.0 437.5 715.0 1_008.5 1,357.1 _ 2_~#79 31664.4 1,993.1Revolving 255.3 276.6 266.1 272.6 324.0 312.0 571.0 928.1 1,196.7 1,618.4 2,477.1 3,552.1 3,919.4Fixed term 53.7 24.5 26.4 8.5 7.0 125.5 144.0 80.4 160.4 194.9 70.8 112.3 73.7
Total MLT /a and OfficialShort-term Debt . 1,920.5 2 2,167.3 2,595.1 3,163.9 4,646.7 6,032.2 7,640.4 9,096.7 11,294.0 13,868.1
Memorandum Item
MLT debt 1,670.7 1,619.4 1,756.4 1,886.2 2,264.1 2,726.4 3,931.7 5,023.7 6,283.3 7,283.4 8,746.1 10,203.7 12,102.9Other LMF obligations /c 107.5 128.5 145.5 138.7 130.5 238.2 450.0 555.0 625.6 718.5 935.9 1,029.6 907.5
Total MLT debt including
IMF Obl.tions 1778.2 1 ,901.9 2,024.9 2,394.6 2,964.6 4,381.7 5,579.2 6,908.9 11,2 33.3 ,010.4
Total MLT Debt, all IMFObligations & OfficialShort-term Debt 2,0725 ,40 2,194.4 2,306.0 2,725.6 3402.1 1 2 12,229.9 14,897.7 17,03Z
/a Including IMF Trust Fund as revalued, but excluding other IMF obligations./b Excluding International Reserve Liabilities./c Revalued at year-end exchange rates.
Source: The World Bank's Debtor Reporting System (DRS); Management of External Debt and Investment Accounts Department (MEDIAD) of the Philippine CentralBank.

- .56 -
Table A.5: EXTERNAL MEDIUM- AND LONG-TERM LOAN COMMITMENTS,CLASSIFIED BY TYPE OF BORROWER /a
(In millions of US$)
TotalNew loan commitments /b Disbursed /c Undisbursed
Year commitments (end-year) (end-year) (end-year)
Public1972 455 1,346 919 4271973 369 1,552 984 5681974 739 2,134 1,182 9521975 803 2,844 1,554 1,2901976 1,709 4,520 2,570 1,9501977 1,160 5,699 3,415 2,2841978 2,649 8,336 4,818 3,5181979 1,954 9,483 5,930 3,5531980 2,070 11,600 7,228 4,3721981 1,884 12,843 8,473 4,3701982 2,062 14,650 9,782 4,868
Private1972 130 1,304i 983 3211973 128 1,299 1,041 2581974 206 1,456 1,213 2431975 283 1,676 1,411 2651976 472 2,295 1,812 4831977 347 2,482a 2,165 3171978 682 2,590 2,091 4991979 583 2,823 2,071 7521980 863 3,558 2,454 1,1041981 515 3,931 2,761 1,1701982 333 3,916i 3,229 687
Total1972 585 2,65CI 1,902 7481973 497 2,851 2,025 8261974 945 3,59C0 2,395 1,1951975 1,086 4,520 2,965 1,5551976 2,181 6,815 4,382 2,4331977 1,507 8,181 5,580 2,6011978 3,331 10,926 6,909 4,0171979 2,537 12,306 8,001 4,3051980 2,933 15,158 9,682 5,4761981 2,399 16,774 11,234 5,5401982 2,395 18,566 13,011 5,555
/a Revised series as of April 1984. Excludes revolving credits and fixed-term credits with maturities under one year.
/b Net of payments and cancellations.7_ Includes IMF credits, revalued at year-end exchange rates.
Source: Central Bank of the Philippines.

Table A.6: EXTERNAL MEDIUM- AND LONG-TERM DEBT TRANSACTIONS,CLASSIFIED BY TYPE OF BORROWER /a
(In millions of US$)
DebtDebt service Net outstanding
Disburse- Amorti- disburse- Adjust- & disbursedYear ments zation Interest Total ments ments /b at end-year
Public1972 269 125 37 162 144 +7 9191973 228 198 61 259 30 +35 9841974 300 186 58 244 114 +84 1,1821975 572 182 77 259 390 -18 1,5541976 1,125 178 75 253 947 +69 2,5701977 900 190 96 286 710 +135 3,4151978 1,479 547 131 678 932 +471 4,8181979 1,916 639 300 939 1,277 -165 5,9301980 1,502 372 420 792 1,130 +168 7,2281981 1,700 406 596 1,002 1,294 -49 8,4731982 1,966 613 803 1,416 1,353 -44 9,782
Private1972 180 154 46 201 25 -22 9831973 191 200 56 256 -9 +67 1,0411974 276 178 54 232 98 +74 1,2131975 307 134 65 199 173 +25 1,4111976 538 190 77 267 348 +53 1,8121977 476 188 87 275 288 +65 2,1651978 489 501 139 640 -12 -62 2,0911979 468 487 186 673 -19 -1 2,0711980 472 320 239 559 152 +231 2,4541981 607 387 299 686 220 +87 2,7611982 567 447 384 831 120 +348 3,229
Total1972 449 279 83 363 170 -16 1,9021973 419 398 117 515 21 +102 2,0251974 576 364 112 476 212 +158 2,3951975 879 316 142 458 563 +7 2,9651976 1,663 368 152 520 1,295 +122 4,3821977 1,376 378 183 561 998 +200 5,5801978 1,968/c 1,048/c 270 1,318/c 920 +409 6,9091979 2,384/c 1,126/c 486 1,612/c 1,258 -166 8,0011980 1,974/c 692/c 659 1,351/c 1,282 +399 9,6821981 2,307/c 793/c 895 1,688/c 1,514 +38 11,2341982 2,533/c 1,060757 1,187 2,2477/c 1,473 +304 13,011
/a Revised series as of April 1984. Excludes revolving credits and fixed-term creditswith maturities of one year or less.
/b Currency revaluation adjustments and audit adjustments.T_ Amortization and debt service include prepayments of $506 million in 1978, $492
million in 1979, $92 million in 1980, $24 million in 1981, and $20 million in 1982;disbursement includes financing of these prepayments.
Source: Central Bank of the Philippines.
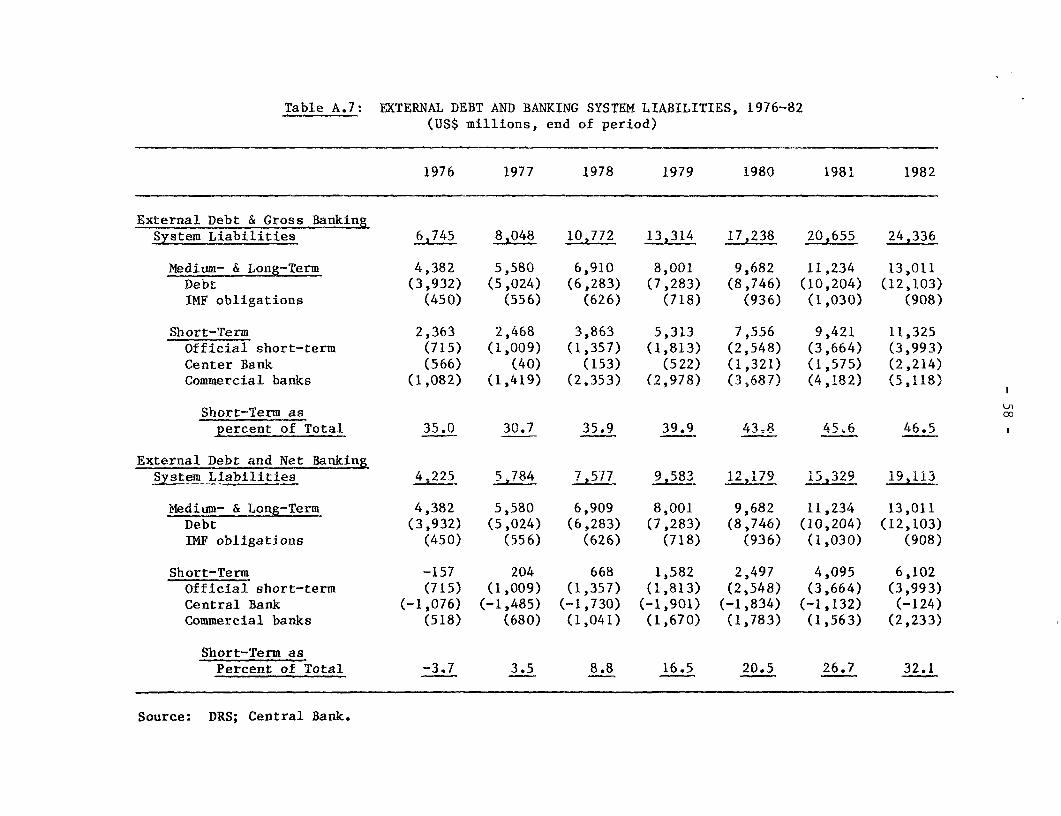
Table A.7: EXTERNAL DEBT AND BANKING SYSTEM LIABILITIES, 1976-82(US$ millions, end of period)
1976 1977 1978 1979 1980 1981 1982
External Debt & Gross BankingSystem Liabilities 6,745 1048 772 13314 17,238 20, 655 24,336
Medium- & _Long-Term 4,382 5,580 6,910 8,001 9,682 11,234 13,011Debt (3,932) (5,024) (6,283) (7,283) (8,746) (10,204) (12,103)IMF obligations (450) (556) (626) (718) (936) (1,030) (908)
Short-Term 2,363 2,468 3,863 5,313 7,556 9,421 11,325Official short-term (715) (1,009) (1,357) (1,813) (2,548) (3,664) (3,993)Center Bank (566) (40) (153) (522) (1,321) (1,575) (2,214)Commercial banks (1,082) (1,419) (2,353) (2,978) C3j687) (4,182) (5,118)
Short-Term as m
percent of Total 35.0 30.7 35.9 39.9 43e8 45.6 46.5$
External Debt and Net BankingSystem Liabilities 7 5574 7,577 91583 12,179 15,329 19,113
Medium- & Long-Term 4,382 5,580 6,909 8,001 9,682 11,234 13,011Debt (3,932) (5,024) (6,283) (7,283) (8,746) (10,204) (12,103)IMF obligations (450) (556) (626) (718) (936) (1,030) (908)
Short-Term -157 204 668 1,582 2,497 4,095 6,102Official short-term (715) (1,009) (1,357) (1,813) (2,548) (3,664) (3,993)Central Bank (-1,076) (-1,485) (-1,730) (-1,901) (-1,834) (-1,132) (-124)Commercial banks (518) (680) (1,041) (1,670) (1,783) (1,563) (2,233)
Short-Term asPercent of Total -3.7 3.5 8.8 16.5 20.5 26.7 32.1
Source: DRS; Central Bank.

- 59 -
Table A.8: STRUCTURE OF MLT DEBT BY CREDITOR, 1970-82(US$ million)
1970 1975 1979 1980 1981 1982
Total MLT Debt 1,490.8 2,788.5 7,230.3 8,918.2 10,338.3 11,992.4
Public Sector /a 571.5 1.377.3 5,159.0 6,463.9 7,577.6 8,836.0
Official Source 231.3 877.9 2,307.4 2,776.9 3,470.6 3,847.5Multilateral 120.3 338.9 1,179.9 1,501.4 2,005.9 2,299.6Bilateral 111.0 539.0 1,127.5 1,275.5 1,464.7 1,547.9
Private Source 340.2 499.4 2,851.5 3,687.0 4,107.0 4,988.4Bonds 10.8 22.4 783.4 896.6 852.3 872.4Financial institutions 267.0 406.8 1,817.6 2,501.5 2,951.4 3,789.7Suppliers credits 62.4 70.2 250.5 288.9 303.3 326.3
Public Guaranteed Private Debt 306.4 476.2 411.9 484.0 687.4 920.8
Private Nonguaranteed 612.9 935.0 1,659.4 1,970.3 2,073.3 2,235.6
Public and Publicly Guaranteed 877.9 1,853.5 5,570.9 6,947.9 8,265.0 9,756.8
Memorandum Item:
Total MLT & OfficialShort-Term DOD 1,849.8 3,226.0 9,043.6 11,466.1 13,904.8 16,452.4
/a Including IMF Trust Fund, but excluding other IMF obligations.
Note: The data series on debt has been revised since the preparation of this table in1983, but the appropriate break down of the data was not available. The dif-ferences between this table and the revised data used elsewhere in the reportare small except in 1970, for which the total debt shown here is $150 millionless; the components also have similar differences. These qualifications alsoapply to Table 2.8 in the text.
Source: DRS (World Bank); MEDIAD

- 60 -
Table A.9: PATTERN OF PRIVATE SECTOR MLT DEBT(US$ millions, end of period)
1976 1977 1978 1979 1980 1981 1982
Funds relent bypublic sector 427 691 901 1,066 1,400 1,723 2,108
Direct borrowing byprivate sector 1,812 2,165 2,091 2,071 2,454 2,761 3,229
Total Private SectorUse of Foreign Sector 2,239 2,856 2L9 9 2 3,137 3,854 4,484 5,337
Source: MEDIAD.

- 61 -
Table A.10: NON-OIL SHORT-TERM DEBT /a(US$ millions, end of period)
1976 1977 1978 1979 1980 1981 1982
Non-oil sector 463 759 1,313 1,563 1,838 2,144 2,411
Public 50 38 286 316 237 680 891
Private 413 621 1,027 1,247 1,601 1,464 1,520
/a Includes OA/DA credits.
Source: MEDIAD.
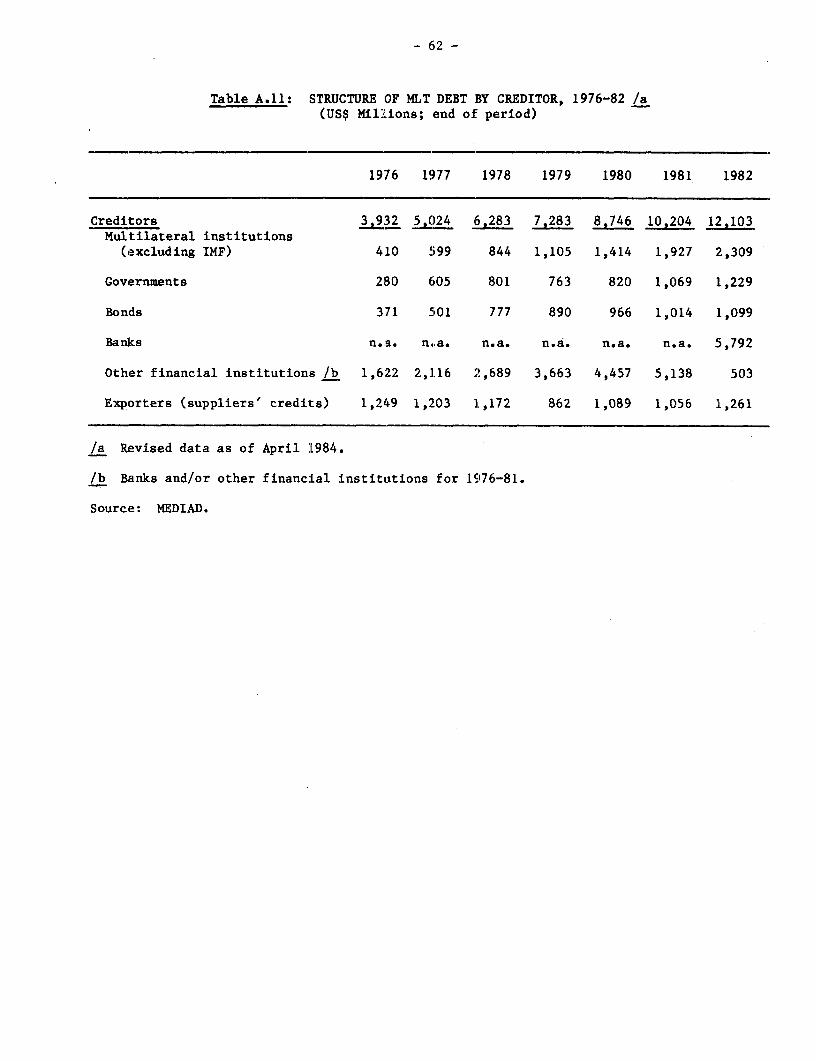
- 52 -
Table A.11: STRUCTURE OF MLT DEBT BY CREDITOR, 1976-82 /a(US$ Millions; end of period)
1976 1977 1978 1979 1980 1981 1982
Creditors 3,932 5,024 i,283 7,283 8,746 10,204 12,103Multilateral institutions(excluding IMF) 410 599 844 1,105 1,414 1,927 2,309
Governments 280 605 801 763 820 1,069 1,229
Bonds 371 5iO1 777 890 966 1,014 1,099
Banks n.a. n,a. n.a. n.a. n.a. n.a. 5,792
Other financial institutions /b 1,622 2,1.16 2,689 3,663 4,457 5,138 503
Exporters (suppliers' credits) 1,249 1,203 1,172 862 1,089 1,056 1,261
/a Revised data as of April 1984.
/b Banks and/or other financial institutions for 19I76-81.
Source: MEDIAD.

- 63 -
Table A.12: PUBLIC SECTOR DEBT COMMITMENTS BYCONCESSIONAL/NONCONCESSIONAL CATEGORIES
(US$ million)
1975 1979 1980 1981 1982
Concessional 127 300 318 248 268Official 127 298 288 248 268Private source - 2 30 - -
Nonconcessional 642 1,745 1,755 2,121 1,789Official 275 471 900 921 824Private 367 1,274 855 1,200 965
Total Public Sector Debt 769 2,045 22073 2,369 2,057
Source: DRS.
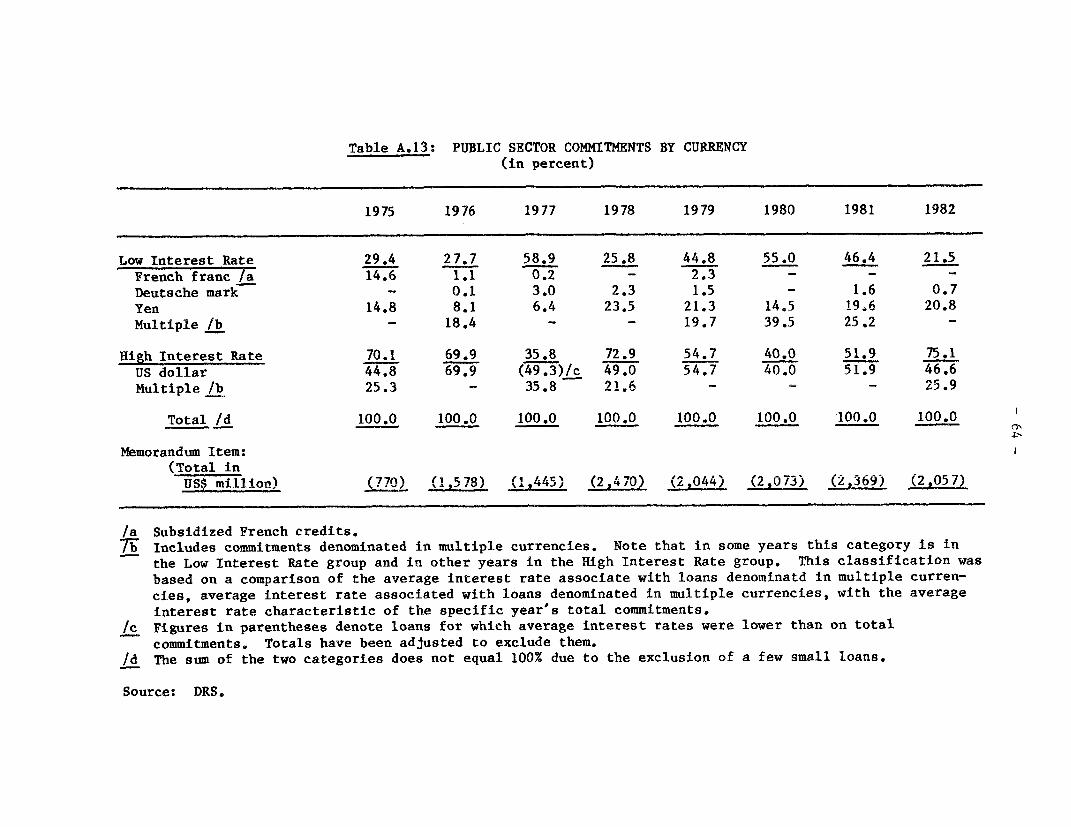
Table A.13: PUBLIC SECTOR COMMITMENTS BY CURRENCY(in percent)
1975 1976 1977 1978 1979 1980 1981 1982
Low Interest Rate 29.4 27.7 58.9 25.8 44.8 55.0 46.4 21.5French franc /a 14.6 1.1 0.2 - 2.3 - - -Deutsche mark - 0.1 3.0 2.3 1.5 - 1.6 0.7Yen 14.8 8.1 6.4 23.5 21.3 14.5 19.6 20.8Multiple lb - 18.4 - - 19.7 39.5 25.2 -
High Interest Rate 70.1 69.9 35.8 72.9 54.7 40.0 51.9 75.1US dollar 44.8 69.9 (49.3)/c 49.0 54.7 40.0 51.9 46.6Multiple /b 25.3 - 35.8 21.6 - - - 25.9
Total /d 100.0 100.0 100.0 100.0 100.0 100.0 100.0 100.0
Memorandum Item:(Total in
US rmillion) (7.70) (1.578) (1',445) (2.470) (2,044) (2 073) (2,369) (2,057)
/a Subsidized French credits.7i Includes commitments denominated in multiple currencies. Note that in some years this category is in
the Low Interest Rate group and in other years in the High Interest Rate group. This classification wasbased on a comparison of the average interest rate associate with loans denominatd in multiple curren-cies, average interest rate associated with loans denominated in multiple currencies, with the averageinterest rate characteristic of the specific year's total commitments.
/c Figures in parentheses denote loans for which average interest rates were lower than on totalcommitments. Totals have been adjusted to exclude them.
_d The sum of the two categories does not equal 100% due to the exclusion of a few small loans.
Source: DRS.

- 65 -
Table A.14: STRUCTURE OF EXTERNAL OBLIGATIONS /a 1981-82(US$ millions)
1981 1982
Creditors 14,898 17,004
Multilateral agencies (including Trust Fund) 1,927 2,309IMF (other) 1,030 908Governments 1,069 1,229Bonds 1,014 1,009Bank and other financial institutions 7,823 9,244Exporters (suppliers' credits) 2,035 2,305
/a Includes official short-term debt.
Source: MEDIAD.
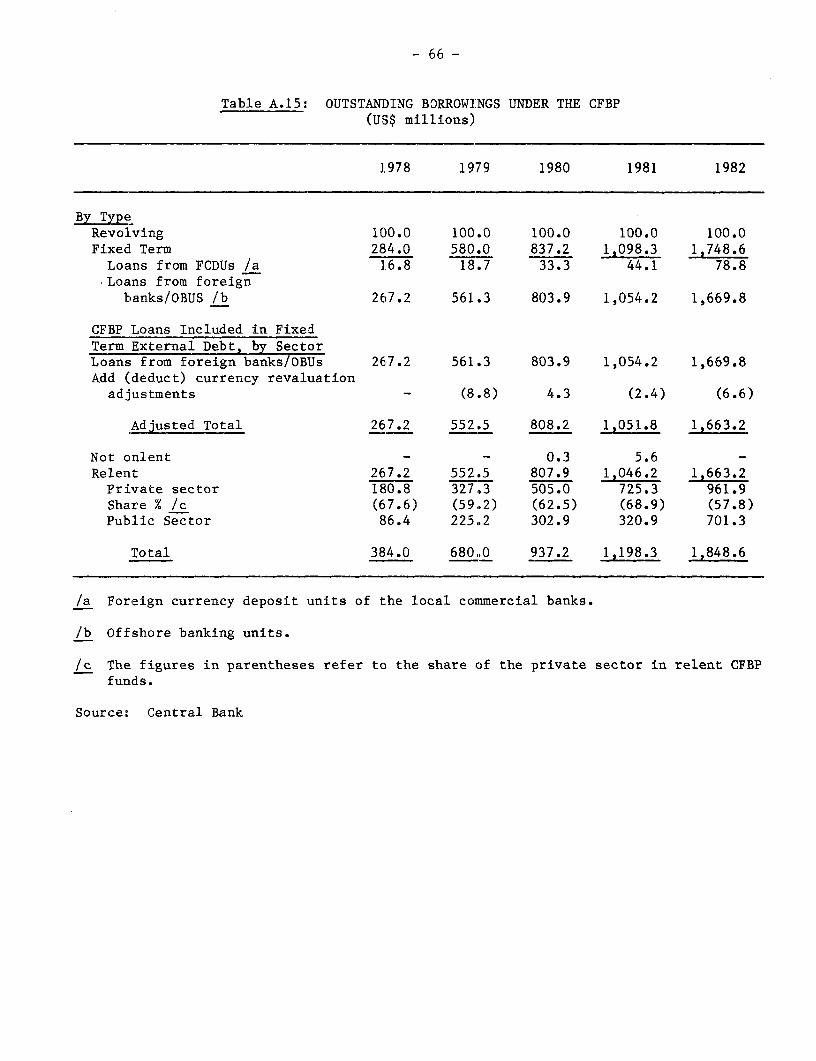
- 56 -
Table A.15: OUTSTANDING BORROWI:NGS UNDER THE CFBP(US$ millions)
1.978 1979 1980 1981 1982
By TypeRevolving 100.0 100.0 100.0 100.0 100.0Fixed Term 284.0 580.0 837.2 1,098.3 1,748.6Loans from FCDUs /a 1.6.8 18.7 33.3 44.1 78.8Loans from foreignbanks/OBUS /b 267.2 561.3 803.9 1,054.2 1,669.8
CFBP Loans Included in FixedTerm External Debt, by SectorLoans from foreign banks/OBUs 267.2 561.3 803.9 1,054.2 1,669.8Add (deduct) currency revaluationadjustments - (8.8) 4.3 (2.4) (6.6)
Adjusted Total 267.2 552.5 808.2 1,051.8 1,663.2
Not onlent - - 0.3 5.6 -Relent 267.2 552.5 807.9 1,046.2 1,663.2Private sector 180.8 327.3 505.0 725.3 961.9Share % /c (67.6) (59.2) (62.5) (68.9) (57.8)Public Sector 86.4 225.2 302.9 320.9 701.3
Total 384.0 680.0 937.2 1,198.3 1,848.6
/a Foreign currency deposit units of the local commercial banks.
/b Offshore banking units.
/c The figures in parentheses refer to the share of the private sector in relent CFBPfunds.
Source: Central Bank
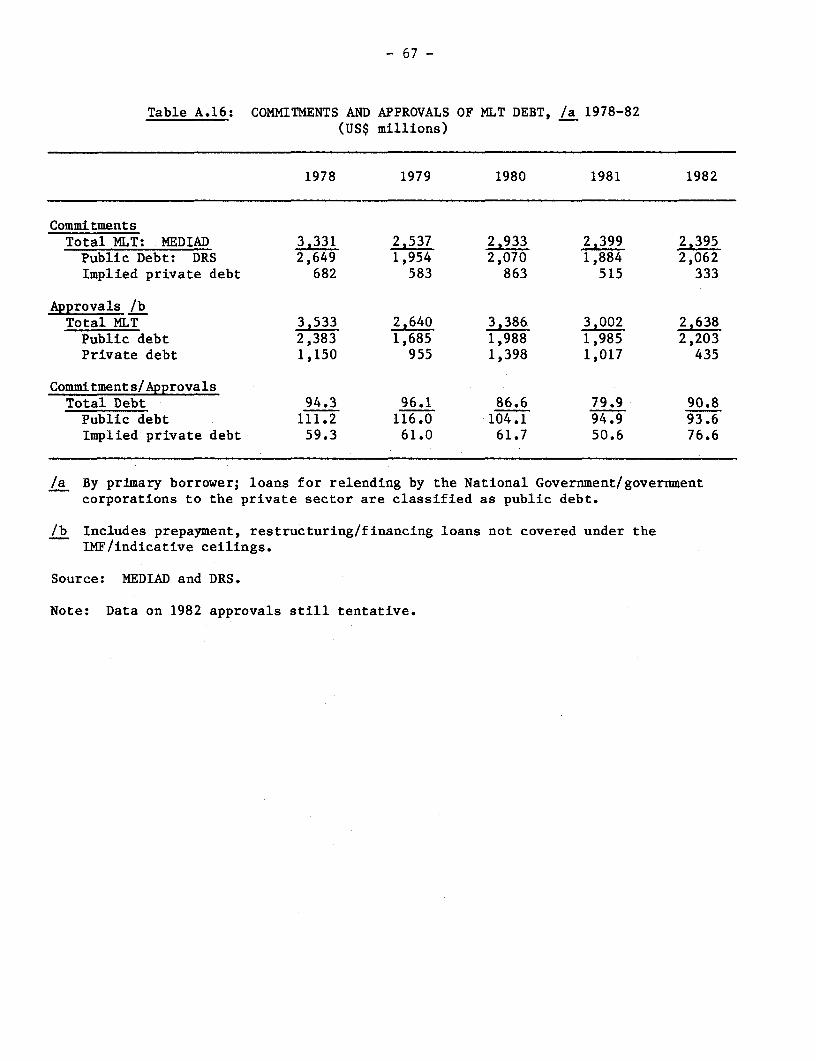
- 67 -
Table A.16: COMMITMENTS AND APPROVALS OF MLT DEBT, /a 1978-82(US$ millions)
1978 1979 1980 1981 1982
CommitmentsTotal MLT: MEDIAD 3,331 2,537 2,933 2,399 2,395Public Debt: DRS 2,649 1,954 2,070 1,884 2,062Implied private debt 682 583 863 515 333
Approvals /bTotal MLT 3,533 2,640 3,386 3,002 2,638Public debt 2,383 1,685 1,988 1,985 2,203Private debt 1,150 955 1,398 1,017 435
Commitments/ApprovalsTotal Debt 94.3 96.1 86.6 79.9 90.8Public debt 111.2 116.0 104.1 94.9 93.6Implied private debt 59.3 61.0 61.7 50.6 76.6
/a By primary borrower; loans for relending by the National Government/governmentcorporations to the private sector are classified as public debt.
/b Includes prepayment, restructuring/financing loans not covered under theIMF/indicative ceilings.
Source: MEDIAD and DRS.
Note: Data on 1982 approvals still tentative.

- 68 -
Table A.17: REAL INCREASE IN DEBT, 1970-82(million dollars)
Annual averagegrowth rates (%)
1970 1979 1982 1970-79 1979-82
DOD/Export Unit ValueTotal MLT, IMF obligations 1,475 3,389 6,507 9.7 24.0Total MLT, IMF obligations,
official short-term debt, netbanking system liabilities NA 4,058 9,560 NA 33.0
DOD/Import Unit ValueTotal ILT, IMF Obligations 1,1530 2,764 3,820 6.1 11.4Total MLT, IMF obligations,official short-term debt, netbanking system liabilities NA 3,312 5,613 NA 19.2
DOD/MUV /aTotal MLT, IMF obligations 2,116 :3,242 5,084 5.0 16.2Total MLT, IMF obligations,
official short-term debt netbanking system liabilities NA 3,882 7,468 NA 24.0
/a Unit value index for manufactured exports from developed to developingcountries used as a proxy for the international inflation rate.
Source: DRS; MEDIAD; IBRD internal documents for MUV.

Table A.18: DEBT INDICATORS(US$ million)
1970 1974 1976 1978 1979 1980 1981 1982
Total MLT debt and IMF Obligations /a 1,778 2,395 4,382 6,909 8,002 9,682 11,233 13,010
Total MLT debt and IMF obligations, /aofficial short-term Debt, netbanking system liabilities NA NA 4,225 7,577 9,583 12,179 15,329 19,113
GNP (billion pesos) 41.8 99.9 132.7 178.1 220.9 265.1 303.6 336.1
GNP (US$ million) 6,930 14,724 17,837 24,121 29,950 35,290 38,438 39,356
Exports of goods and services 1,341 3,559 3,446 4,909 6,256 8,010 8,617 8,004
/a Including all IMF obligations.
Source: Tables A.4 and A.7; World Bank, The Philippines: Selected Issues for the 1983-87 Plan Period,Washington, D.C., June 1, 1982.

- 70 -
Table A.19: FOREIGN EXCHANGE RESERVES /a(US$ million)
Foreign exchangeGross reserves liabilities Net Net
Central Commercial Central Commercial central bank totalYear bank banks bank /b banks reserves /b reserves
1970 251 128 435 160 -184 -2161971 375 149 396 280 -21 -1521972 549 186 399 453 150 -1171973 1,037 379 314 540 723 5621974 1,503 475 418 812 1,085 7481975 1,361 718 792 990 569 2971976 1,642 564 1,017 1,082 625 1071977 1,525 739 601 1,419 924 2441978 1,883 1,312 689 2,353 1,194 1531979 2,423 1,309 1,179 2,978 1,244 -4251980 3,155 1,903 2,149 3,687 1,006 -7781981 2,707 2,619 2,407 4,182 300 -1,2631982 /c 1,711 2,540 3,114 4,870 -829 -3,7331983 7c 865 1,576 3,803 /d 4,495 -2,938/d -5,857
/a Inclusive of revaluation adjustments
/b The net total reserves for 1970-81 are computed based on the old conceptwhere CB liabilities are already net of certain long-term liabilities(IBRD rural credit liabilities, long-term yen liabilities to OECF andconcessional loans) agreed with the IMF. The NIR for 1982-83 uses thenew concept of NIR computation under the 1L983 Standby Agreement whereonly short-term and IMF credits are included as CB liabilities.
/c Revised to reflect adjustment.
/d Inclusive of arrears.
Source: Central Bank.

- 71 -
Table A.20: STRUCTURE OF EXTERNAL DEBT, 1976-82(US$ Million)
1976 1977 1978 1979 1980 1981 1982
Total Debt /a 5,097 6,589 8,266 9,814 12,230 14,898 17,004Medium- & long-term (incl.Trust Fund) 3,932 5,024 6,283 7,283 8,746 10,204 12,103
IMF obligations (excl. TrustFund) /b 450 556 626 718 936 1,030 908
Short-term debt 715 1,009 1,357 1,813 2,548 3,664 3,993
Medium- & Long-Term DebtCreditors 3,932 5,024 6,283 7,283 10,204 12,103/dMultilateral institutions
(excl. IMF) 410 599 844 1,105 1,414 1,927 2,309Governments 280 605 801 763 820 1,069 1,229Bonds 371 501 777 890 966 1,014 1,009
Other financial institutions 1,622 2,116 2,689 3,663 4,457 5,138 503Exporters (suppliers' credits) 1,249 1,203 1,172 862 1,089 1,056 1,261
Borrowers 3,932 5,024 6^283 7,283 8,746 10,204 12,103Public sector (including relentto other sectors) 2,120 2,859 4_l.192 5,212 6 7443 8874Central Bank (including relentto other sectors) 350 355 803 1,110 1,141 1,355 1,998
National Government 1242 2,504 3,389 4,102 5,151 6,088 6,876
Private sector (direct) 1,812 2,165 2,091 2,071 2L454 2,761 3,229
End-Users/Purposes 5,024 _ 7,283 8,746 10L204 12,103Public 69J26 3,291 4,146 4 ,892 5,720 6,766/dPower & electrification 800 977 1,343 1,810 1,865 2,221 2,434Transport 200 298 428 507 550 843 855Agriculture 100 117 187 267 340 456 589Industry - 7 25 108 187 353 394Other 593 769 1,308 1,454 1,950 1,847 2,494
Private relent by public sector 427 691 901 1,066 1 ?723 2 108
Private (direct) 1 812 2,165 2,091 2,071 2,454 2,761 3,229/dManufacturing 752 936 944 957 1,090 1,041 1,204Transport, utilities 491 515 508 459 726 858 889Mining 321 451 379 422 417 580 843Other 248 263 260 233 221 282 293
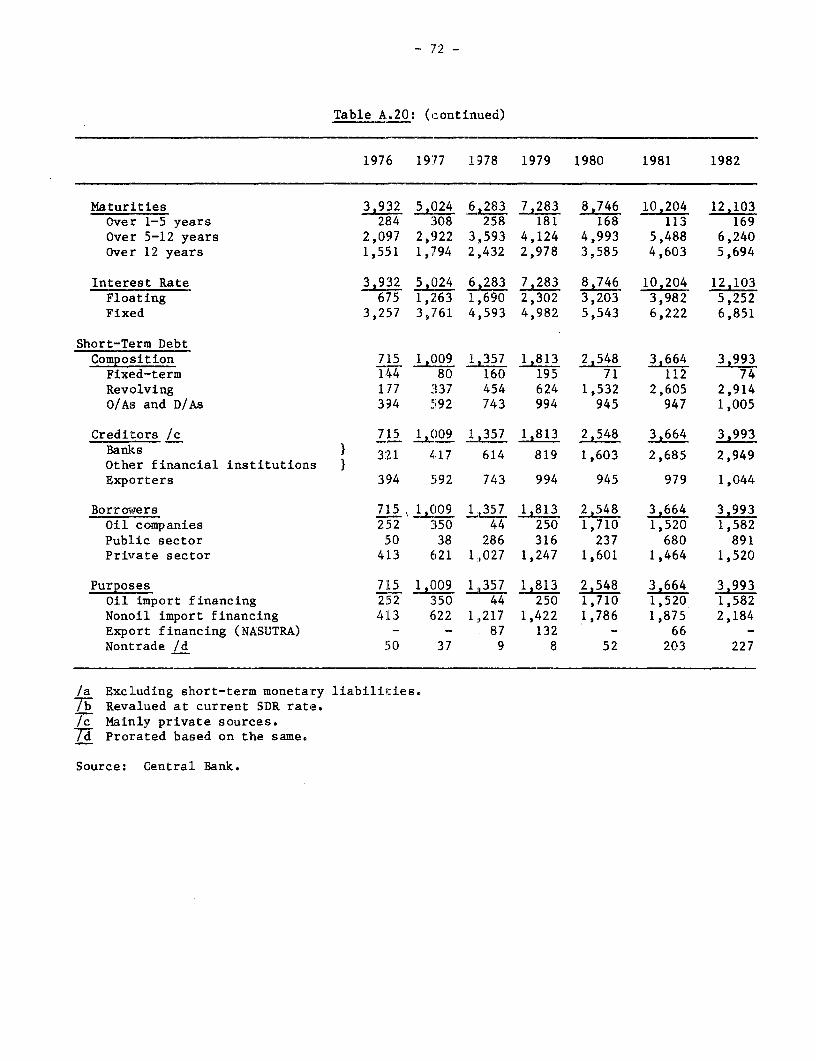
- 72 -
Table A.20: (continued)
1976 1977 1978 1979 1980 1981 1982
Maturities 3,932 5,024 6t&28 7,283 8,746 10,204 12,103Over 1-5 years 284 308 258 181 168 113 169Over 5-12 years 2,097 2,922 3,593 4,124 4,993 5,488 6,240Over 12 years 1,551 1,794 2,432 2,978 3,585 4,603 5,694
Interest Rate 3,932 5,024 6,283 7,283 8,746 10,204 12,103Floating 675 1,263 1,690 2,302 3,203 3,982 5,252Fixed 3,257 3,761 4,593 4,982 5,543 6,222 6,851
Short-Term DebtComposition 715 1 009 1 357 1813 2,548 3,664 3,993Fixed-term 144 80 160 195 71 112 74Revolving 177 337 454 624 1,532 2,605 2,914O/As and D/As 394 592 743 994 945 947 1 ,005
Creditors /c 715 1,()09 1,357 1,813 2,548 3,664 3,993Banks 321 417 614 819 1,603 2,685 2,949Other financial institutions }Exporters 394 592 743 994 945 979 1,044
Borrowers 715 1,009 11357 1,813 2,548 3,664 3,993Oil companies 252 350 44 250 1,710 1,520 1,582Public sector 50 38 286 316 237 680 891Private sector 413 621 1,027 1,247 1,601 1,464 1,520
Purposes 715 1,009 _ 357 1,813 2,548 3,664 3,993Oil import financing 252 350 44 250 1,710 1,520 1,582Nonoil import financing 413 622 1.,217 1,422 1,786 1,875 2,184Export financing (NASUTRA) - - 87 132 - 66 -
Nontrade /d 50 37 9 8 52 203 227
/a Excluding short-term monetary liabilities.7Wb Revalued at current SDR rate./c Mainly private sources.7W Prorated based on the same.
Source: Central Bank.

Table A.21: EXTERNAL DEBT SERVICE PAYMENTS, 1977-82(US$ millions)
1977 1978 1979 1980 1981 1982
I. Philippines Debt Service asStatutorily Defined /a 726 1,006 1,253 1,472 1,758 2,249
II. Debt Service /b (World Bank definitions) on:(a) MLT debt 513 786 1,009 1,166 1,580 2,159
(b) MLT debt, IMF obligations,official short-term debt, and netbanking system liabilities /c 618 935 1,216 1,457 1,721 2,627
(c) MLT debt, IMF obligations,short-term debt and grossbanking system liabilities /c 649 985 1,259 1,672 2,168 3,049
Memo:Exports of goods and services 4,236 4,909 6,256 8,010 8,617 8,004
/a Interest and principal payments on MLT debt, IMF obligations and fixed short-term debt.lb Excluding prepayments/c Only interest payments have been included for Revolving Credits (other than D/As and O/As) and banking
system liabilities.
Source: MEDIAD, Mission estimates, and IMF.

- 74 -
Table A.22: EXTERNAL DEBT SERVI]CE, AS; STATUTORILY DEFINED /a, 1977-82(US$ millions)
1977 1978 1979 1980 1981 1982
Debt Service Payments 726 1,006 1,253 1,472 1,758 2,249
Principal 537 730 761 799 855 1,052Medium- & Long-term (330) (958) (1,035:) (547) (739) (985)IMF obligations (48) (90) (91) (145) (54) (75)Short-term /b (159) (188) (127) (199) (86) (112)Prepayments (--) (-506) (-492) (-92) (-24) (-120)
Interest 189 276 492 673 903 1,197Medium- & long-term (183) (270) (486:) (609) (825) (1,097)IMF obligations (--) () () (50) (70) (90)Short-term /b (6) (6) (6;) (14) (8) (10)
ExternalReceipts /c 5,242 5,593 6,741 7,874 9,227 11,617
Current receipts 3,259 3,814 4,471 5,562 7,093 8,085Capital receipts 1,983 1,779 2,270 2,312 2,134 3,532
Debt service ratio /d(in percent) 13.8 18.0 18.6 18.7 19.1 19.4
/a In accordance with Republic Act Number 6142 of November 1970. Reviseddata.
/b Principal and interest on short-term fixed debt only.
/c On cash basis, excluding trade-rtelated short-term loans.
/d The maximum permitted debt service ratio is 20%.
Source: Data provided by the Philippine authorities.

- 75 -
Table A.23: PUBLIC SECTOR DEBT SERVICE PAYMENTS(US$ millions)
Alternative IIb /a 1977 1978 1979 1980 1981 1982
MLT Debt 315.7 644.7 805.4 585.3 850.3 1,029.0
IMF obligations 48.3 92.2 91.5 194.9 123.1 148.7
Official Short-Term Debt 51.4 94.4 85.1 179.5 231.6 319.9Interest payments /b 6.0 14.5 18.0 63.4 146.1 239.2Principal payments onfixed short-term debt 45.4 79.9 67.1 116.1 85.5 80.7
Net Liabilities ofthe Central Bank -91.0 -150.0 -216.0 -239.0 -176.0 18.0
Total Debt ServicePayments 324.4 681.3 766.0 720.7 1,029.0 1,479.6
Public Sector DebtService Ratio (%) 7.7 14.1 12.4 9.2 12.3 19.1
Share of Public SectorDebt Service in TotalDebt Service 47.1 46.2 44.3 43.0 47.8 49.8
Memo:Public sector's share ofOfficial short-term debt 28.6 42.6 52.8 58.2 59.4 60.7
/a See Table A.21 for explanation of components of Alternative IIb.
lb Determined on the basis of the public sector's share in short-term debt.
Source: DRS, MEDIAD, IMF.

- 76
Table A.24: CONSOLIDATED PUBLI:C EXPENDITURESBY SECTOR ON AN OBLIBATION BASIS
(Million PIesos)
1978 1979 1980 1981 1982
Economic Services 13.7 18.1 23.2 27.7 31.7
Noninfrastructure 4.5 4.3 4.7 6.6 7.6Agriculture, forestry, fishery 3.9 3.5 3.3 4.7 5.3Industry, trade, labor and
tourism 0.6 0.8 1.4 1.9 2.3
Total Infrastructure 9.2 13.8 18.5 21.4 24.0Energy, water supply 4.3 7.T3 10.3 11.1 12.1Transportation, telecommunica-
tions, other infrastructure 4.9 6,.5 8.2 10.3 11.9
Social Services 5.4 6.7 7.4 10.5 12.7
Defense 4.4 4,7 4.8 4.7 7.5
General Public Administration 2.7 3,5 5.0 3.8 4.9
Debt Service 2.1 2Z,5 3.6 4.0 5.2
Total (in billion pesos) 28.3 35.,5 44.0 50.2 61.9
Source: Ministry of Finance.
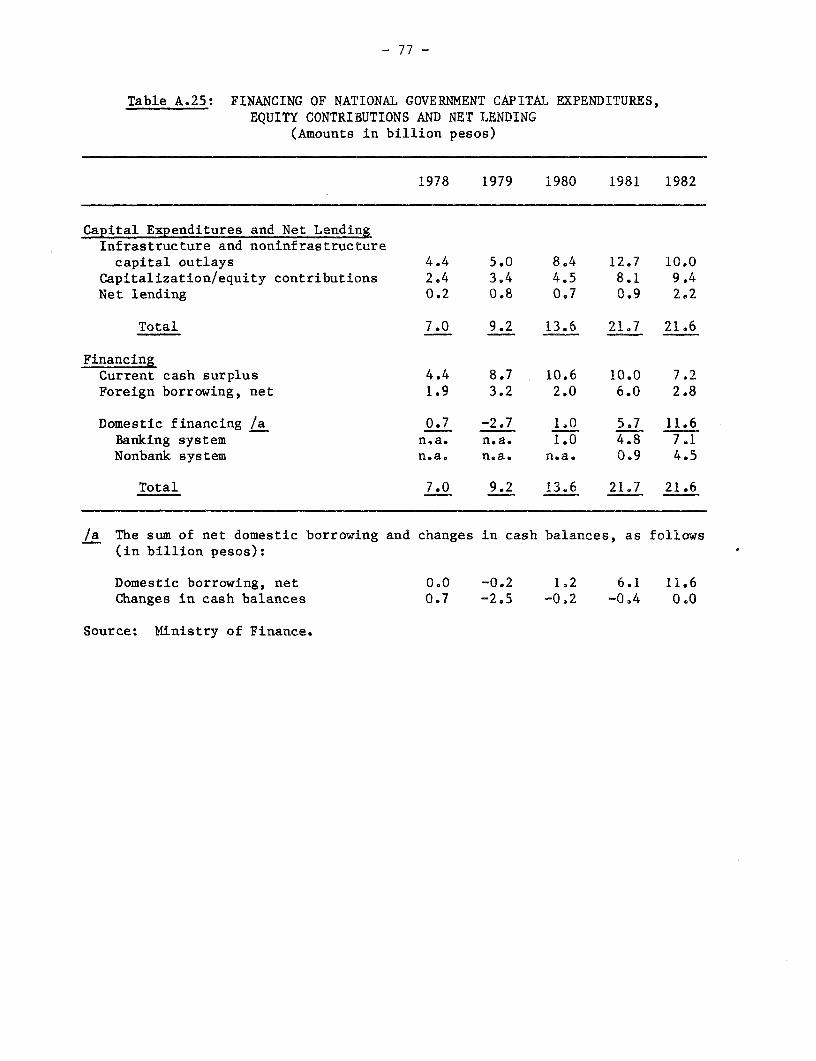
- 77 -
Table A.25: FINANCING OF NATIONAL GOVERNMENT CAPITAL EXPENDITURES,EQUITY CONTRIBUTIONS AND NET LENDING
(Amounts in billion pesos)
1978 1979 1980 1981 1982
Capital Expenditures and Net LendingInfrastructure and noninfrastructurecapital outlays 4.4 5.0 8.4 12.7 10.0
Capitalization/equity contributions 2.4 3.4 4.5 8.1 9.4Net lending 0.2 0.8 0.7 0.9 2.2
Total 7.0 9.2 13.6 21.7 21.6
FinancingCurrent cash surplus 4.4 8.7 10.6 10.0 7.2Foreign borrowing, net 1.9 3.2 2.0 6.0 2.8
Domestic financing /a 0.7 -2.7 1.0 5.7 11.6Banking system n.a. n.a. 1.0 4.8 7.1Nonbank system n.a. n.a. n.a. 0.9 4.5
Total 7.0 9.2 13.6 21.7 21.6
/a The sum of net domestic borrowing and changes in cash balances, as follows(in billion pesos):
Domestic borrowing, net 0.0 -0.2 1.2 6.1 11.6Changes in cash balances 0.7 -2,5 -0.2 -04 0.0
Source: Ministry of Finance.
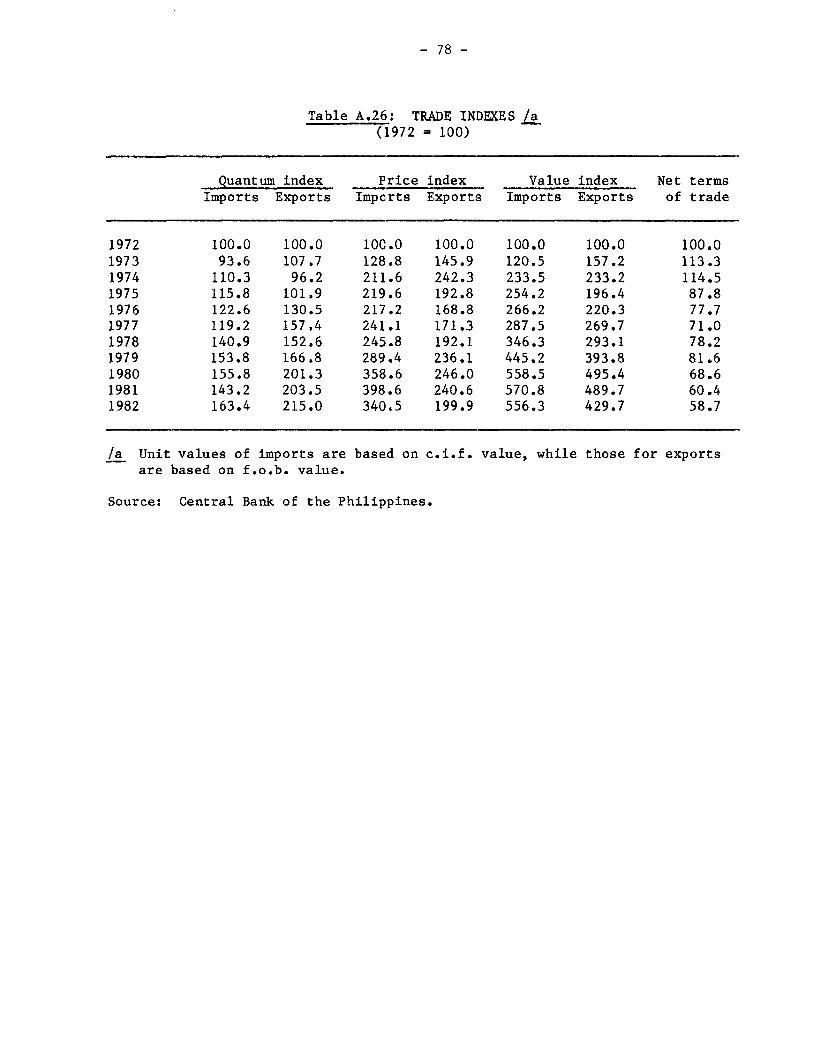
- 78 -
Table A.26: TRPDE INDEXES /a(1972 = 100)
Quantum index Price index Value index Net termsImports Exports Imports Exports Imports Exports of trade
1972 100.0 100.0 100.0 100.0 100.0 100.0 100.01973 93.6 107.7 128.8 145.9 120.5 157.2 113.31974 110.3 96.2 211.6 242.3 233.5 233.2 114.51975 115.8 101.9 219.6 192.8 254.2 196.4 87.81976 122.6 130.5 217.2 168.8 266.2 220.3 77.71977 119.2 157.4 241.1 171.3 287.5 269.7 71.01978 140.9 152.6 245.8 192.1 346.3 293.1 78.21979 153.8 166.8 289.4 236.1 445.2 393.8 81.61980 155.8 201.3 358.6 246.0 558.5 495.4 68.61981 143.2 203.5 398.6 240.6 570.8 489.7 60.41982 163.4 215.0 340.5 199.9 556.3 429.7 58.7
/a Unit values of imports are based on c.i.f. value, while those for exportsare based on f.o.b. value.
Source: Central Bank of the Philippines.

IBRD 17234116- CLASSIFICATION OF PROVINCES liO- 124- JUNE 1983
BYGEOGRAPHICAL REGIONS
NCR NATIONAL CAPITAL REGIONILOCOS VI WESTERN VISAYAS
I iowosNorte 38Aktan P H I2 Abra 39 C"piz P3 I tcocosSur 40Antique
_20e 4 Mountain 41Bo9O 8 20'-
5 La Union 42Negros Occidental6 Benguet viI CENTRAL VISAYAS Airport7Pengasisan 43Ceb. ____ od
44Negros Oriental RoadsCAGAYAN VALLEY 45Bohol 2
8 Batanes 468icuijor_ Ralways9 Cagayan \ I I EASTERN VISAYAS P i r
1 i KaSngaApayao 4 7 North,rn Samar -B- _____ Provincil BoundariesM1 lsalbeta 48 Samar Cnr, 12 lfuga 49 Eastern Samar \ Aprr Regionol Boundaries13 Nueva Viscaya SoLee 1t J -Y e a Bnr14 Ouirino 51 Southern Leyte Laoog - -/ - 4nlernotionolBouncones
Iit CENTRAL LUZON iX WESTERN MINDANAO 915 Nueva Ecija 52 Zamboanga del Norte /n s K16 Tarlac 53 Zamboanga del Sur17 Zasmbales 541Basilan18 Pampanga 55ulu Iig9 ulacan 56T9telvi A nraKt1120 Bataan X NORThERN MINlDANAOg
IVSOUTiiERN TAGALOG 57Sur,gaodelNorte S. a g 1 12 I121 Aurora 58Camigum Fernando 5 V - /22 Ounon gAguan del Narte Or 0 50 100 150 200 250 300
23CRizte 61 MisamisOccidental 1 KiLOMETERS-16' 24Cavi6eI 625 Lagunsa 628ukidnon MI 0 tES50 1 15
26 Batangas 63A SonelSr G 10 ~27 Marinduque XI EASTERN MiNDANAO P Jose2128 Mindoro Oriental 64 Suri0ao del Sur Tarlac29Mndoro Occidental 65 Davao Oriental I t1 uan30Rnomblon 66Davao Agele 1 131Pa'awan 67DavaodelSur 17
v BICOL 68 South Cotabato \J, 2o 23 2
32Camarires, Norte XII C'ENTRAL AINDsNAO ' IPP IN i f E A33Camarines Sur 69 Lanao del Norte34 Catduoranes 70 L~,ao det Oar/ 4 /35 Alb3uy 71 North Cola,bato 136Sttrsogon 72 M.gumidarao37 Fdasbate 73 Sultan Kudarat " 3337~ Masbate
SOUTH C HJNA AV 291
S Ef A 30\) ras120 ~~~~~~~~~~~~~~~~~~~~~~~~~~~~~~~~~~~~~~~~~~8120
~~~~Pri nuesa~~~~~~~~~~~~~~~~~~~~~i/1
Zn Nat Cag de
T.T NAM I N
SilO J <1,11 Ia^2 LIPPINES
PAZAIo- '~~
i? a 5 criti ............. , 1-MAtaLr A 5J <' Sr " TTS Nap has,xN ra,T(TL The VaIN da' liar b NstaO m T CV ITfWdfeTlnNaaTc EE T~~~~~~~~~~~~~~~~~~~~~~~~~TT0a,l,r TaU&3 TTa TIT TO rTsna n$e tSm°T rIthddeaoF WT,u0
1all Ta TaTTTTaTTT
rzz<>- j L < 120- 1240 128°L - I -1