international debt statistics 2021 - world bank
TRANSCRIPT

INTERNATIONALDEBT STATISTICS
2021


International Debt Statistics 2021


International Debt Statistics 2021

© 2020 International Bank for Reconstruction and Development / The World Bank1818 H Street NW, Washington, DC 20433Telephone: 202-473-1000; Internet: www.worldbank.org
Some rights reserved
1 2 3 4 23 22 21 20
This work is a product of the staff of The World Bank with external contributions. The findings, interpreta-tions, and conclusions expressed in this work do not necessarily reflect the views of The World Bank, its Board of Executive Directors, or the governments they represent. The World Bank does not guarantee the accuracy of the data included in this work. The boundaries, colors, denominations, and other information shown on any map in this work do not imply any judgment on the part of The World Bank concerning the legal status of any territory or the endorsement or acceptance of such boundaries.
Nothing herein shall constitute or be considered to be a limitation upon or waiver of the privileges and immuni-ties of The World Bank, all of which are specifically reserved.
Rights and Permissions
This work is available under the Creative Commons Attribution 3.0 IGO license (CC BY 3.0 IGO) http:// creativecommons.org/licenses/by/3.0/igo. Under the Creative Commons Attribution license, you are free to copy, distribute, transmit, and adapt this work, including for commercial purposes, under the following conditions:
Attribution—Please cite the work as follows: World Bank. 2021. International Debt Statistics 2021. Washington, DC: World Bank. doi:10.1596/978-1-4648-1610-9. License: Creative Commons Attribution CC BY 3.0 IGO
Translations—If you create a translation of this work, please add the following disclaimer along with the attribution: This translation was not created by The World Bank and should not be considered an official World Bank translation. The World Bank shall not be liable for any content or error in this translation.
Adaptations—If you create an adaptation of this work, please add the following disclaimer along with the attribution: This is an adaptation of an original work by The World Bank. Views and opinions expressed in the adaptation are the sole responsibility of the author or authors of the adaptation and are not endorsed by The World Bank.
Third-party content—The World Bank does not necessarily own each component of the content contained within the work. The World Bank therefore does not warrant that the use of any third-party-owned individual component or part contained in the work will not infringe on the rights of those third parties. The risk of claims resulting from such infringement rests solely with you. If you wish to re-use a component of the work, it is your responsibility to determine whether permission is needed for that re-use and to obtain permission from the copyright owner. Examples of components can include, but are not limited to, tables, figures, or images.
All queries on rights and licenses should be addressed to World Bank Publications, The World Bank Group, 1818 H Street NW, Washington, DC 20433, USA; fax: 202-522-2625; e-mail: [email protected].
ISBN (paper): 978-1-4648-1610-9ISBN (electronic): 978-1-4648-1611-6DOI: 10.1596/978-1-4648-1610-9
Cover design: Jomo Tariku, World Bank Group
Library of Congress Control Number has been requested.

v
Foreword vii
Acknowledgments ix
PART I: Overview 1
Executive Summary 3Aggregate Financial Flows to Low- and
Middle-Income Countries 5External Debt Stocks in 2019 6External Debt Flows in 2019 9Supporting Debt Data Transparency 12IDA Borrowers Eligible for the DSSI:
External Debt Stocks and Flows 15Debt Indicators, 2010–2019 17Equity Flows in 2019 18
PART II: Aggregate and Country Tables 23
All Low- and Middle-Income Countries 25East Asia and Pacific 26Europe and Central Asia 27Latin America and the Caribbean 28Middle East and North Africa 29South Asia 30Sub-Saharan Africa 31Afghanistan 32Albania 33Algeria 34Angola 35Argentina 36Armenia 37Azerbaijan 38Bangladesh 39Belarus 40Belize 41Benin 42Bhutan 43Bolivia, Plurinational State of 44Bosnia and Herzegovina 45
Botswana 46Brazil 47Bulgaria 48Burkina Faso 49Burundi 50Cabo Verde 51Cambodia 52Cameroon 53Central African Republic 54Chad 55China 56Colombia 57Comoros 58Congo, Democratic Republic of 59Congo, Republic of 60Costa Rica 61Côte d’Ivoire 62Djibouti 63Dominica 64Dominican Republic 65Ecuador 66Egypt, Arab Republic of 67El Salvador 68Eritrea 69Eswatini 70Ethiopia 71Fiji 72Gabon 73Gambia, The 74Georgia 75Ghana 76Grenada 77Guatemala 78Guinea 79Guinea-Bissau 80Guyana 81Haiti 82Honduras 83India 84Indonesia 85
Table of Contents

vi
T A B L E O F C O N T E N T S
Iran, Islamic Republic of 86Jamaica 87Jordan 88Kazakhstan 89Kenya 90Kosovo 91Kyrgyz Republic 92Lao People’s Democratic Republic 93Lebanon 94Lesotho 95Liberia 96Madagascar 97Malawi 98Maldives 99Mali 100Mauritania 101Mexico 102Moldova 103Mongolia 104Montenegro 105Morocco 106Mozambique 107Myanmar 108Nepal 109Nicaragua 110Niger 111Nigeria 112North Macedonia 113Pakistan 114Papua New Guinea 115Paraguay 116Peru 117Philippines 118Russian Federation 119Rwanda 120Samoa 121São Tomé and Príncipe 122Senegal 123Serbia 124Sierra Leone 125Solomon Islands 126Somalia 127South Africa 128Sri Lanka 129
St. Lucia 130St. Vincent and the Grenadines 131Sudan 132Syrian Arab Republic 133Tajikistan 134Tanzania 135Thailand 136Timor-Leste 137Togo 138Tonga 139Tunisia 140Turkey 141Turkmenistan 142Uganda 143Ukraine 144Uzbekistan 145Vanuatu 146Venezuela, RB 147Vietnam 148Yemen, Republic of 149Zambia 150Zimbabwe 151
APPENDIX: About the Data 153
User Guide to Tables 155User Guide to IDS Online Tables
and Database 157How to Access IDS Online Country Tables 157Indicators 159How to Access the Database 161
Data Sources and Methodology 163Data Sources 163Methodology 164External Debt and Its Components 166Data Documentation 169Sources of the Macroeconomic Indicators 173
Country Groups 175Regional Groups 175Income Groups 176
Glossary 177Debtor Reporting System (DRS) 177

vii
Foreword
The COVID-19 pandemic is a crisis like no other. It has taken lives and disrupted liveli-
hoods in every corner of the globe. It has knocked more economies into simultaneous recession than at any time since 1870. It has ended a two-decade streak of steady global progress in poverty reduction, pushing up to 150 million people into extreme poverty by 2021.
For the poorest countries, however, the crisis arrived at a moment of particular peril. In 2019, as this report shows, almost half of all low-income countries were either already in debt distress or at a high risk of it. Unsustainable debt burdens have the potential to siphon off resources these coun-tries need immediately to fund the health crisis and accelerate economic recovery efforts—an issue the World Bank and the International Monetary Fund have sought to address by calling for the Debt Service Suspension Initiative (DSSI). The overhang of debt may slow investment and growth for years to come—a burden on the poor that now needs to be addressed by creditors across the world taking prompt steps to permanently reduce unsustainable debt stocks for the poorest countries.
International Debt Statistics 2021 (IDS) affirms that achieving long-term debt sustain-ability will depend on a large-scale shift in the world’s approach to debt transparency. The report provides more detailed and more disaggregated data on external debt than ever before in its nearly 70-year history, taking important strides in filling existing data gaps for low- and middle-income countries where the risks are greatest.
The data include breakdowns of what each borrowing country owes to official and private creditors by creditor country and the expected month-by-month debt-service payments owed to them through 2021. Increased debt transparency will help many low- and middle-income countries assess and manage their external debt through the
current crisis and work with policy makers toward sustainable debt levels and terms.
IDS provides a unique data set to shape the solutions that will be needed in the coming years. It shows a creditor landscape that is changing quickly—with developing countries borrowing from new sources of bilateral and commercial financing and increasingly complex debt instru-ments. These trends compound the difficulty of managing COVID-19-related debt crises, adding to the value of more granular debt data.
We are also engaged in a continual review and refinement of the data. For example, we are work-ing to ensure that more debt instruments, includ-ing central bank deposits and currency swaps, are captured in the data set. We are also working to gather additional debt information such as the status of loan guarantees and collateral.
In addition, we are conducting data recon-ciliation with creditors. In this regard, I want to thank the creditor countries that have com-pared the new data with their own records to clarify gaps. This latest step in transparency will help improve our estimates of debt sustain-ability and—for some of the poorest countries— highlights the need for debt-stock reduction to start the recovery process.
According to the latest data, total external debt stocks of low-income countries eligible for the DSSI rose 9 percent in 2019 to $744 billion, equivalent on average to one-third of their com-bined gross national income. Lending from private creditors was the fastest-growing component of the external debt of DSSI-eligible borrowers, up fivefold since 2010. Obligations to private credi-tors totaled $102 billion at the end of 2019.
The debt stock of DSSI-eligible countries to official bilateral creditors, composed mostly of Group of Twenty (G-20) countries, reached $178 billion in 2019 and accounted for 27 percent of
I N T E R N A T I O N A L D E B T S T A T I S T I C S 2 0 2 1
viii
the long-term debt stock of low-income countries. Within the G-20 creditor group, there have been some important shifts characterized by a marked increase in lending by G-20 member countries that are themselves middle-income countries. For example, China, by far the largest creditor, has seen its share of the combined debt owed to G-20 countries rise from 45 percent in 2013 to 63 percent at end-2019. Over the same period the share for Japan, the second-largest G-20 creditor, has remained broadly the same at 15 percent.
These trends suggest that future sovereign debt restructurings will be more complex for many of the poorest countries. For most International Development Association borrowers, private creditors account for a relatively small share of the countries’ external public debt. However, they account for a significant share in several countries: for example, Côte d’Ivoire (60 percent), Ghana (58 percent), and Chad, St. Lucia, and Zambia (all 50 percent). Private sector participation in
achieving a sustainable debt trajectory will be critical.
The risk is that too many poor countries will emerge from the COVID-19 crisis with a large debt overhang that could take years to manage. To build durable economic recoveries, countries will need to achieve long-term debt sustainability. They will need to achieve a much greater level of productive investment and financing—for infra-structure, health, education, and employment.
Reliable data and accountability will be criti-cal for borrowers and creditors alike, providing the cornerstone for robust new investment and good development outcomes. The World Bank is committed to working with governments and partners to achieve that outcome—by continually improving data coverage, quality, timelessness, and transparency.
David MalpassPresident
The World Bank Group

ix
This volume was prepared by the Debt Statistics Team of the Development Data
Group (DECDG) at the World Bank, led by Evis Rucaj and comprising Parul Agarwal, Arzu Aytekin Balibek, Daniella Kathyuska Bolanos-Misas, Allen Charles Church Jr., Wendy Ven-dee Huang, Malvina Pollock, Rubena Sukaj, and Rasiel Vellos. The overview of current developments was prepared by the Debt Statistics Team; country economists reviewed the data tables. The team was assisted by Nancy Kebe. The work was carried out under the manage-ment of Nada Hamadeh, Program Manager, and the direction of Haishan Fu, Director, DECDG.
Valuable guidance and input was provided by Carmen M. Reinhart, Vice President and Chief Economist, Development Economics (DEC).
International Debt Statistics electronic prod-ucts were prepared by a team led by Anna Maria Kojzar and Sebastian Ariel Dolber and comprising Ramgopal Erabelly, Rahul Abhinav Polabiona, Fatih Dogan, Rajesh Kumar Danda, and Ugendran Machakkalai. The cover was designed by Jomo Tariku. Jewel McFadden from DEC Knowledge and Strategy and Michael Harrup and Orlando Mota from Global Corporate Solutions, Design and Publications, coordinated the publication and dissemination of the book.
Acknowledgments


1
PART IOverview
1


3
Executive Summary
Developments in the external debt of low- and middle-income countries in 2019 took place against the backdrop of a synchronized downturn in the global economy with deceleration in global gross domestic product (GDP) growth to about 2.4 percent, the lowest rate of expansion since the 2008 financial crisis. A combination of factors affected the global economy in 2019, including rising trade barriers, ongoing trade disputes, and increased geopolitical tensions. Growth prospects were also dampened by country-specific outcomes in several of the largest emerging market economies and by structural factors in advanced economies, such as low productivity growth and aging demo-graphics. Heightened policy uncertainty weighed on international trade and investor confidence, and the subdued outlook led to a decline in most com-modity prices. GDP growth in low- and middle-income countries, many of which are commodity exporters, contracted to about 3.5 percent in 2019 from 4.3 percent in 2018, reflecting a structural slowdown in China and a markedly slower pace of growth in several large emerging markets.
Aggregate financial inflows to low- and middle-income countries (debt and equity) fell 14 percent in 2019, relative to the 2018 level, the second consecutive year of decline, driven by lower flows to China. Even though China dominated the volume and trajectory of 2019 aggregate financial flows to low- and middle-income countries, its share fell to 39 percent from almost 49 percent of comparable flows in 2018. Aggregate financial flows to China fell 39 percent in 2019, driven down by a 29 percent reduction in net equity inflows and a 48 percent fall in net debt flows. This was in marked contrast to aggregate net financial flows to other low- and middle-income countries, which rose on average 9 percent in 2019, with a 24 percent rise in net equity inflows offsetting a 7 percent fall in net debt inflows.
Prior to the onset of the COVID-19 pandemic, rising public debt levels and heightened debt vulnerabilities were already a cause for concern,
particularly in many of the world’s poorest countries. Debt-related risks reflect higher public and private debt levels and a changing creditor landscape with new sources of bilateral and commercial financing and increasing complexity of debt instruments with nonstandard terms and clauses, including nondis-closure clauses. This evolution of external financing patterns compounds the task of managing COVID-19-related debt crises and gives rise to new demands for more granular debt data transparency regarding the volume and terms of amounts borrowed and lent.
The World Bank has long played a lead role in the compilation and dissemination of external debt statistics and the enhancement and expansion of debt data coverage to meet institutional needs, the needs of policy makers and analysts, and those of the international community. International Debt Statistics, the World Bank’s flagship publica-tion on external debt data instituted in response to the first global oil crisis of 1973 and now in its 57th consecutive year of publication, is frequently refined to provide more timely and disaggregated data series. This edition provides, for the first time, disaggregated information on public and publicly guaranteed debt stocks and flows by creditor country, including official bilateral credi-tors and multilateral institution entities. This data set will assist policy makers and analysts in assess-ing the potential impact of debt service suspension from the Debt Service Suspension Initiative (DSSI) launched by the Group of 20 (G-20) in April 2020 and implemented with the assistance of the World Bank and the International Monetary Fund (IMF) and sets a standard for greater debt data transpar-ency by member countries of the World Bank and the IMF, as borrowers and as lenders.
International Debt Statistics 2021 presents comprehensive stock and flow data for 120 low- and middle-income countries and a summary over-view of the key elements driving outcomes in 2019 debt stocks and financial flows. The headline num-bers may mask divergent trends because of the dom-inance of the largest economies. This is especially

I N T E R N A T I O N A L D E B T S T A T I S T I C S 2 0 2 1
4
true in regard to China, where the volumes of financial flows and external debt stock are not large relative to the size of the domestic economy (exter-nal debt as a share of gross national income [GNI] was 15 percent at end-2019), but are significant in relation to those of other low- and middle-income countries. To assist in the interpretation of the data, the overview takes a look behind the headline numbers and analyzes recent developments and trends at the regional and country level as well as for the subgroup of DSSI-eligible countries.
Key messages from the 2019 data are as follows:
• Net financial (debt and equity) flows to low- and middle-income countries totaled $0.9 trillion in 2019, 14 percent below the 2018 level and registering the second con-secutive year of decline. Net debt inflows fell 28 percent to $383 billion from $532 billion in 2018 in contrast to stable foreign direct investment (FDI) inflows of $479 billion, little changed from 2018, and rising portfolio equity inflows, up 23 percent to $48 billion.
• Net financial flows to countries eligible for the DSSI rose 16 percent in 2019 to $103 billion, a record high for the decade and much faster than those to other low- and middle-income countries. The increase in net financial flows was the outcome of a 10 percent rise in net debt inflows to $66 billion from $60 billion in 2018 and a 36 percent rise in FDI.
• External debt stocks at end-2019 passed the $8 trillion mark with the overall pace of accumulation (5.4 percent) unchanged from 2018. Long-term external debt was the fastest-growing component; it rose 7 percent to $6 trillion, equivalent to 73 percent of total external debt stock. Short-term external debt stocks rose marginally (1.5 percent) to $2.2 trillion at end-2019.
• Net debt inflows were $383 billion in 2019, 28 percent below the 2018 level and less than half the comparable inflows in 2017. Short-term debt inflows contracted 86 percent to $30 billion from $219 billion in 2018, following an outflow of short-term debt from China (–$14 billion) in 2019, compared to an inflow of $188 billion in 2018. On average, net short-term debt inflows to low- and middle-income countries, excluding China, rose 43 percent in 2019 to $43 billion.
• Net long-term inflows rose by 13 percent to $353 billion in 2019 with a 4 percent rise in inflows to public and publicly guaranteed borrowers and a 32 percent increase in inflows to nonguaranteed private sector borrowers. China’s long-term debt inflows rose 81 percent, equivalent to 45 percent of the combined 2019 long-term debt inflows to low- and middle-income countries. Long-term debt inflows to other low- and middle-income countries, excluding China, followed a different trajectory. They fell, on average, by 14 percent in 2019 to $195 billion: inflows to public and publicly guaranteed borrowers rose 9 percent and inflows to nonguaranteed private sector borrowers dropped precipitously by 57 percent.
• Bondholders accounted for the largest share of net long-term debt inflows to low- and middle-income countries in 2019. Net inflows from bondholders were $234 billion, 30 percent higher than the comparable 2018 figure, and equivalent to two-thirds of 2019 long-term net debt inflows. Bondholders accounted for two-thirds of long-term debt inflows to China and for 55 percent of comparable inflows to other low- and middle-income countries, on average.
• The World Bank was the mainstay of inflows from official creditors. Net inflows from the World Bank (International Bank for Reconstruction and Development [IBRD] and International Development Association [IDA]) rose 31 percent in 2019 to $19 billion, equivalent to just over half of inflows from multilateral creditors, excluding the IMF. Net inflows from bilateral creditors fell 50 percent to $9 billion, equivalent to just 3 percent of 2019 long-term debt inflows from official and private creditors, excluding the IMF, on account of a sharp contraction in China’s inflows resulting from the combined effect of a 28 percent fall in new disbursements and a 46 percent rise in principal payments.
• New bond issuance by the 120 low- and middle-income countries reporting to the Debtor Reporting System (DRS) totaled $376 billion in 2019, 16 percent higher than in 2018. Issuance in 2019 was characterized by a surge in bond issues by private sector entities, which rose 37 percent to $129 billion. China was the dominant player and accounted for 35 percent of bonds issued in 2019.

O v e r v i e w
5
Aggregate Financial Flows to Low-and Middle-Income Countries
Financial flows to low- and middle-income countries fell for the second consecutive year in 2019. Aggregate net financial flows, debt and equity combined, totaled $0.9 trillion in 2019, 14 percent lower than the comparable figure for 2018. Measured relative to borrower countries’ GNI, aggregate financial flows were equivalent to 2.9 percent, a marked decrease from 3.5 per-cent in 2018 and well short of the 6.9 percent recorded in 2010. The decline in net financial flows was the outcome of a 28 percent drop in net debt inflows (gross disbursements of new financing minus principal payments), which fell to $383 billion from $532 billion in 2018. The contraction in net debt inflows contrasted with equity inflows, which remained stable. FDI inflows, long considered the most resilient and least volatile component of financial flows, totaled $479 billion, down marginally from the 2018 level, whereas portfolio equity inflows rose 23 percent to $48 billion.
The headline number masks sharp divergence in the volume and trend of financial flows to China and other low- and middle-income countries in 2019. As in prior years, China dominated both
the volume and direction of aggregate financial flows to low- and middle-income countries, but in 2019, its share of these flows dropped sharply to 35 percent from almost 50 percent of compa-rable flows in 2018. Aggregate financial flows to China fell 39 percent in 2019, driven down by a 29 percent reduction in net equity inflows and a steeper reduction in net debt flows, which fell by 48 percent (box O.1). This was in marked contrast to aggregate net financial flows to other low- and middle-income countries: they rose 9 percent in 2019 with a 24 percent rise in net equity inflows offsetting a 7 percent fall in net debt inflows.
Table O.1 Aggregate Net Financial Flows to Low- and Middle-Income Countries, 2010–19US$ (billion)
2010 2011 2012 2013 2014 2015 2016 2017 2018 2019
Net financial flows, debt and equity 1,359.0 1,318.6 1,224.0 1,448.9 1,125.2 196.7 729.9 1,261.0 1,060.9 909.7
Percent of GNI (%) 6.9 5.7 4.9 5.5 4.1 0.8 2.8 4.4 3.5 2.9
Net Debt Inflows 716.4 718.5 594.2 813.9 535.7 −319.2 218.7 732.6 531.9 382.8
Long-term 288.5 411.9 471.4 448.8 392.2 160.6 254.7 405.9 313.4 353.1
Official creditors 63.9 32.6 34.6 32.8 53.1 51.8 61.5 57.7 82.0 68.0
World Bank (IBRD and IDA) 22.6 5.6 11.9 13.2 14.7 16.7 13.8 12.4 14.7 19.3
IMF 7.8 −0.7 −6.4 −11.6 −1.3 6.5 5.1 3.6 30.9 21.6
Private creditors 224.6 379.3 436.8 416.0 339.1 108.8 193.2 348.2 231.4 285.1
Bonds 108.3 155.7 220.2 165.7 168.1 60.5 126.6 281.4 180.1 233.7
Banks and other private 116.3 223.5 216.6 250.3 171.0 48.3 66.5 66.9 51.3 51.4
Short-term 427.9 306.6 122.8 365.2 143.5 −479.7 −36.0 326.7 218.5 29.8
Net equity flows 642.6 600.1 629.8 635.0 589.5 515.9 511.3 528.3 529.0 526.9
Net foreign direct investment inflows 524.3 602.3 537.0 567.4 505.0 496.0 462.4 462.9 490.4 479.4
Net portfolio equity inflows 118.4 −2.2 92.9 67.6 84.5 19.9 48.9 65.4 38.6 47.5
Change in reserves (− = increase) −689.8 −454.8 −285.5 −514.9 91.2 603.9 278.8 −308.3 84.6 −183.3
Memorandum item
Workers remittances 299.3 337.2 363.0 380.8 410.4 424.0 411.7 442.9 478.6 494.8
Sources: World Bank Debtor Reporting System, International Monetary Fund, and Bank for International Settlements.
Figure O.1 Aggregate Net Financial Flows to Low- and Middle-Income Countries, excluding China, 2010–19
Sources: World Bank Debtor Reporting System; International Monetary Fund; and Bank for International Settlements.
0
100
200
300
400
500
600
700
800
900
2010 2011 2012 2013 2014 2015 2016 2017 2018 2019
US
$ (b
illio
n)
Net financial flows Net equity flows Net debt flows

I N T E R N A T I O N A L D E B T S T A T I S T I C S 2 0 2 1
6
Box O.1 As China Implements Further Capital Market Liberalization Its Debt Portfolio Diversifies
China is by far the largest recipient of financial inflows, not only in the East Asia and Pacific region, but also among low- and middle-income countries. Over the last decade, China recorded almost $4 trillion in net financial inflows, which accounted for 37 percent of all inflows to low- and middle-income countries. In 2019, China recorded inflows of $330 billion with debt accounting for 45 percent and equity the remain-ing 55 percent, primarily from FDI.
China’s external debt stock at the end of 2019 was $2.1 trillion, 8 percent higher than the comparable debt stock at the end of 2018, with short-term external debt accounting for 57 percent of the total, of which 30 percent was trade credit. Most of the increase in debt stocks in 2019 is attributable to long-term external debt. By the end of 2019, China recorded close to $909 billion, an increase of 22 percent from the end of 2018. A major contributor was the $132 billion issuance of bonds, primarily private sector bonds, which increased
the debt stock by 42 percent. Bonds issued by the public sector made up about 46 percent. The share of domestic currency renminbi debt owed to non-residents has increased because of China’s efforts to liberalize their financial account. The new State Administration of Foreign Exchange regulation,a which opened foreign investors’ access to China’s domestic securities market, established the inclusion of the renminbi bonds in the Bloomberg Barclays Global Aggregate Index and China-A shares in the FTSE Russell emerging markets index and automated links between the Shanghai, London, and Hong Kong SAR, China, markets. These measures have supported domestic currency bond issuance and helped diversify China’s debt securities portfolio and attracted portfolio equity flows. Equity inflows slowed by 29 percent in 2019 from the previous year, but China remained the largest recipient among all low- and middle-income recipients of foreign direct investment and portfolio equity inflows, respectively, $131 billion and $45 billion.
a. State Administration of Foreign Exchange regulation on Foreign Exchange Administration for Domestic Securities Investments by Qualified Foreign Institutional Investors (June 2018).
Figure BO.1.1 Aggregate Net Financial Flows to China, 2010–19
–400
–200
0
200
400
600
800
2010 2011 2012 2013 2014 2015 2016 2017 2018 2019
US
$ (b
illio
n)
Net financial flows Net equity flows Net debt flows
Sources: World Bank Debtor Reporting System; International Monetary Fund; and Bank for International Settlements.
External Debt Stocks in 2019
External debt stocks topped $8 trillion at end-2019, with the pace of debt accumulation much the same as in 2018. The total external debt of the 120 low- and middle-income countries for which data are presented in International Debt Statistics 2021 rose by 5.4 percent in 2019 to $8.1 trillion, a rate of accumulation almost identical to that
in 2018, but close to half the 10.5 percent rise in external debt stock recorded in 2017. The increase in external debt stocks in 2019 was the outcome of net debt inflows of $383 billion and valuation changes in year-on-year exchange rates in relation to the US dollar (about half the external debt of low- and middle-income countries is denominated in currencies other than the US dollar). Long-term external debt was the fastest-growing component,

O v e r v i e w
7
rising 7 percent to $6 trillion, equivalent to 73 percent of total external debt stock. Short-term debt stocks rose marginally (1.5 percent) to $2.2 trillion at end-2019.
China accounted for 26 percent of the 2019 external debt stock of low- and middle-income countries and heavily influenced outcomes. China’s external debt stock rose 8 percent in 2019, propelled by a surge in long-term borrowing by both public and private sector entities. Long-term external debt stock rose 22 percent to $909 billion at the end of 2019, with a near parallel rate of increase in the obligations of the government and public sector entities and those of private borrowers without any government guarantee. Short-term debt stock fell $14 billion (a little more than 1 percent), reflecting the slowdown in trade volumes, but remained by far the most significant component of total external debt stock at 57 per-cent, down from 62 percent at the end of 2018.
Excluding China, external debt stocks in other low- and middle-income countries rose 4.6 percent on average in 2019 but with wide divergence in the pace of debt accumulation at the country level. The external debt stock of the top 10 borrowers,1 excluding China, rose on average 4.1 percent in 2019 to $3.6 trillion, with parallel rates of accumulation in long-term and short-term debt. The combined end-2019 debt stock of these countries accounted for almost 60 percent of the external debt stocks of low- and middle-income countries exclud-ing China. Outcomes for individual countries in the group ranged from an increase in debt stock of 9 percent in South Africa to a decline of 1.5 percent for Argentina, as the latter grappled with a challenging macroeconomic situation, an unwieldy stock of dollar-denominated debt, and double-digit inflation. In low- and middle-income countries (excluding China and other top 10 borrowers) external debt stock rose slightly faster, on average by 5.5 percent in 2019, with short-term debt stock rising at the same rate as long-term debt by 6.7 percent.
Outcomes at the regional and country levels were divergent. Countries in Sub-Saharan Africa
1 The top 10 borrowers, defined as those with the largest end-2019 external debt stock, are Argentina, Brazil, China, India, Indonesia, Mexico, the Russian Federation, Thailand, Turkey, and South Africa.
recorded the fastest accumulation of external debt stock in 2019, on average 9.4 percent, propelled by a comparable rise in the debt stock of the major regional economies, including Nigeria and South Africa and other borrowers across the region. India drove the 6 percent rise in debt stocks in the South Asia region, but the increase was mirrored in the 9.5 percent rise in the external debt stock of Bangladesh, reflecting the implementation of large infrastructure projects, and the 7.8 percent increase in Pakistan, driven by higher inflows of budgetary support from multilateral creditors, including the first disbursement under the IMF Extended Fund Facility in July 2019. External debt stock rose 6.4 percent in East Asia and the Pacific, excluding China, with the major borrow-ers (Indonesia, the Philippines, and Thailand) all recording an increase of 5–6 percent and Vietnam recording an increase of 10.9 percent, driven by
Figure O.3 Top 10 Low- and Middle-Income Borrowers, excluding China, 2018–19
Sources: World Bank Debtor Reporting System; and Bank for International Settlements.
0 100 200 300 400 500 600
Turkey
Thailand
South Africa
RussianFederation
Mexico
Indonesia
India
Brazil
Argentina
US$ (billion)
2019 2018
Figure O.2 External Debt Stocks of Low- and Middle-Income Countries, 2010–19
Sources: World Bank Debtor Reporting System; and Bank for International Settlements.
0
500
1,000
1,500
2,000
2,500
3,000
3,500
2010 2011 2012 2013 2014 2015 2016 2017 2018 2019
US
$ (b
illio
n)
Short-term debt
Private nonguaranteed
Public and publicly guaranteed (including IMF)

I N T E R N A T I O N A L D E B T S T A T I S T I C S 2 0 2 1
8
a 24.6 percent increase in short-term debt. Debt stocks rose on average 5.3 percent in the Middle East and North Africa region, propelled by a 14.9 percent rise in external debt stocks in the region’s largest borrower, the Arab Republic of Egypt, fol-lowing an $8 billion eurobond issuance and the disbursement of the last tranche ($4 billion) from the IMF 2016 Extended Fund Facility. External debt stocks rebounded in the Europe and Central Asia region, rising 3.1 percent in 2019 (after a 5 percent contraction in 2018), largely in response to an 8.1 percent increase in the obligations of the Russian Federation. Countries in Latin America
and the Caribbean recorded the smallest increase in external debt stocks in 2019, 2.3 percent, reflecting a general slowdown in economic activ-ity across the Latin American region, with moder-ate debt accumulation by Brazil and Mexico (on average, 3 percent), but offset by a 1.5 percent contraction in Argentina’s external debt stock.
The maturity structure and borrower com-position of external debt stocks is characterized by a stark difference between China and other low- and middle-income countries. For most low- and middle-income countries, external debt obligations are predominantly long term, and the largest share is owed by governments and other public sector entities. The composition of China’s external debt stock is atypical for low- and middle-income countries: more than half (57 percent) of the end-2019 external debt stock was short term, and only 15 percent of long-term obligations were accounted for by public sector borrowers. The combined end-2019 external debt stocks of low-and middle-income countries, including China, comprised public and publicly guarantee debt (40 percent), whereas the obligations of private sector entities without a government guarantee accounted for 33 percent, and short-term debt for 27 percent. Excluding China significantly alters the picture: the share of short-term debt falls to 16 percent, and the share of long-term debt owed by public and publicly guaranteed borrowers rises to 49 percent.
Sources: World Bank Debtor Reporting System; and Bank for International Settlements.
-10
East A
sia a
nd P
acific
East A
sia a
nd P
acific
(exc
luding
Chin
a)
Europ
e an
d Cen
tral A
sia
Latin
Am
erica
and
Car
ibbea
n
Midd
le Eas
t Nor
th A
frica
South
Asia
Sub-S
ahar
an A
frica
Low- a
nd M
iddle-
Inco
me
Count
ries
-5
0
5
10
15
20
Per
cent
cha
nge
2017 2018 2019
Figure O.4 External Debt Stocks: Regional Distribution and Trends, 2017–19
Figure O.5 External Debt Stocks of Low- and Middle-Income Countries, excluding China, Maturity Structure and Borrower Type, 2010–19
Sources: World Bank Debtor Reporting System; and Bank for International Settlements.
0
20
40
60
80
100
2010 2011 2012 2013 2014 2015 2016 2017 2018 2019
Per
cent
Public and publicly guaranteed (including IMF)
Private nonguaranteed
Short-term debt
Figure O.6 External Debt Stocks of China, Maturity Structure and Borrower Type, 2010–19
Sources: World Bank Debtor Reporting System; and Bank for International Settlements.
0102030405060708090
100
2010 2011 2012 2013 2014 2015 2016 2017 2018 2019
Per
cent
Short-term debt
Private non-guaranteed
Public and publicly guaranteed (including IMF)

O v e r v i e w
9
External Debt Flows in 2019
The synchronized global slowdown and ongo-ing trade disputes weighed heavily on external debt flows in 2019. Net debt inflows to low- and middle-income countries continued their down-ward trajectory in 2019, falling to $383 billion, 28 percent below the 2018 level and well below half the comparable inflows in 2017. The decline was primarily the outcome of a severe contraction in short-term debt inflows, which fell 86 percent to $30 billion from $219 billion in 2018. Much of the decline can be attributed to a precipitous drop in short-term debt flows to China, which turned negative (–$14 billion) in 2019, a marked con-trast to inflows of $188 billion recorded in 2018. Short-term debt inflows to Argentina also col-lapsed and those to Mexico fell 82 percent pulling short-term inflows to countries in Latin America and the Caribbean down 70 percent to $13 billion from $43 billion in 2018. In contrast, short-term inflows rebounded in Russia and Turkey to $9.4 billion and $6.6 billion, respectively, from outflows of $2.7 billion and $3.4 billion in 2018. Inflows to other regions held up and on average net short-term debt inflows to low- and middle-income countries, excluding China, rose 43 percent in 2019 to $43 billion.
Long-term debt inflows to China and those to other low- and middle-income countries were on a very different trajectory in 2019. Net long-term inflows rose 13 percent in 2019 to $353 billion from $313 billion in 2018, with a 4 percent increase in inflows to public and publicly guaran-teed borrowers followed by a 32 percent increase
in inflows to private sector borrowers without a government guarantee. China absorbed 45 percent of long-term debt inflows to low- and middle-income countries in 2019, up from one-third of comparable flows in 2018. It registered an 81 per-cent rise in net long-term inflows in 2019 driven by a threefold increase in inflows to nonguaran-teed private sector borrowers (box O.1). It was a very different story for other low- and middle-income countries: long-term debt inflows fell to $195 billion, 14 percent below the comparable inflow in 2018, on account of a 9 percent expan-sion in inflows to public and publicly guaranteed borrowers and a precipitous 57 percent drop in those to nonguaranteed private sector borrowers.
Net long-term debt inflows in 2019 were sustained by inflows from bondholders. Inflows from bondholders rose 30 percent in 2019 to $234 billion, offsetting a 17 percent downturn in inflows from official creditors. Almost half of the 2019 inflows from bondholders went to China. The increase in overall bond issuance in 2019 was accompanied by a shift in borrower composition, with a 5 percent drop in new issues by sovereigns and public sector borrowers more than offset by a 42 percent rise in issuance by private sector entities (box O.2). Bondholders accounted for two-thirds of long-term debt inflows to China in 2019 and, on average, for 55 percent of comparable inflows to other low- and middle-income countries.
The World Bank (IBRD and IDA) was the mainstay of inflows from official creditors. Inflows from official creditors fell 17 percent in 2019 to $68 billion from $82 billion in 2018, of which multilateral institutions accounted for
Figure O.7 Net Long-Term External Debt Flows, excluding China, Borrower Composition, 2010–19
Source: World Bank Debtor Reporting System.
050
100150200250300350400450
2010
US
$ (b
illio
n)
2011 2012 2013 2014 2015 2016 2017 2018 2019
Public and publicly guaranteed (including IMF) Private nonguaranteed
Figure O.8 Creditor Composition of Net Long-Term External Debt Flows, 2010–19
Source: World Bank Debtor Reporting System.
0
50
100
150
200
250
300
2010 2011 2012 2013 2014 2015 2016 2017 2018 2019
US
$ (b
illio
n)
Official bilateral creditors
Bondholders
Official multilateral creditors (including IMF)
Banks and other private entities

I N T E R N A T I O N A L D E B T S T A T I S T I C S 2 0 2 1
10
86 percent. Inflows from multilateral institu-tions declined 7 percent to $59 billion, dragged down by the 30 percent drop in IMF inflows: $22 billion in 2019 from $30 billion in 2018, in large measure because of the substantially lower flows to Argentina ($16.2 billion in 2019 versus $28.6 billion in 2018). Excluding the IMF, inflows from other multilateral institutions totaled $37 bil-lion, a 14.6 percent increase over the 2018 level, and were kept stable by inflows from the World Bank (IBRD and IDA). These inflows rose 31 per-cent in 2019 to $19 billion, equivalent to just over half of inflows from multilateral creditors in 2019. Bilateral creditors saw the sharpest contraction in flows, down 50 percent to $9 billion, equivalent to just 3 percent of 2019 long-term debt inflows from official and private creditors, driven by the sharp contraction in inflows from China to $3.8 billion in 2019 from $16.2 billion in 2018, resulting from the combined effect of a 28 percent fall in dis-bursements and a 46 percent increase in principal repayments.
The composition of 2019 net long-term debt inflows to public and publicly guaranteed borrowers differed markedly at the regional level. Net long-term debt inflows to public and
publicly guaranteed borrowers, excluding China, totaled $162 billion in 2019, of which bond-holders accounted for 67 percent; multilateral creditors, including the IMF, 36 percent; and bilateral creditors 7 percent. Flows from com-mercial banks and other private sector entities were negative (10 percent). Countries in Sub-Saharan Africa accounted for the largest share of net long-term inflows at 24 percent, followed by the East Asia and Pacific region, excluding China, at 18 percent. Inflows from bilateral creditors were directed primarily at Sub-Saharan Africa (41 percent) and Europe and Central Asia (26 percent), while those from multilateral credi-tors were concentrated in Latin America and the Caribbean (41 percent), reflecting the large IMF inflow to Argentina, and in Sub-Saharan African (26 percent). Inflows from bondholders were the dominant component of net inflows to countries in Europe and Central Asia but were also an important share of net inflows to all regions. Net inflows from bonds ranged from 35 percent of net inflows from all creditors to Europe and Central Asia, to 8 percent of comparable inflows to both South Asia and the Middle East and North Africa.
Source: World Bank Debtor Reporting System.
0
10
20
30
40
50
60
70
80
90
100
2010 2011 2012 2013 2014 2015 2016 2017 2018 2019
Per
cent
Bilateral creditors World Bank Other multilateral
Figure O.9 Net Long-Term Inflows from Official Creditors, excluding IMF, 2010–19
Figure O.10 Long-Term Debt Inflows to Public and Publicly Guaranteed Borrowers, Regional Distribution, 2019
–20
–10
0
10
20
30
40
50
US
$ (b
illio
n)
Bilateral creditors Multilateral creditors
Bondholders Other private creditors
East A
sia an
d Pac
ific
(exclu
ding C
hina)
Europ
e and
Cen
tral A
sia
Latin
Amer
ica an
d
the C
aribbea
n
Middle
East a
nd N
orth
Afric
a
South
Asia
Sub-S
ahar
an A
frica
Source: World Bank Debtor Reporting System.

O v e r v i e w
11
Box O.2 International Bond Issuance in 2019
Global slowdown, market turbulence, and credit downgrades did not deter bond issuance by low- and middle-income countries in 2019. Ultra-low interest rates in advanced economies fueled a search for higher yields elsewhere. New bond issu-ance by the 120 low- and middle-income countries reporting to the World Bank Debtor Reporting System totaled $376 billion in 2019, 16 percent higher than the comparable figure for 2018 but below the 2017 record high of $401 billion. Issuance in 2019 was characterized by a surge in bond issues by private sector entities; up 37 percent over the prior-year level to $129 billion. New issu-ance by sovereigns and other public sector entities increased at a more moderate pace, rising 7 percent to $247 billion.
China was the dominant player among low- and middle-income countries. It issued $132 billion in international bonds in 2019, 16 percent higher than the prior year, and equivalent to 35 percent of the combined issuance by low- and middle-income countries, the same percentage share as 2018. Bond issuance by private sector entities in China rose 42 percent in 2019 to $72 billion, in contrast to those by public sector entities, which fell 5 percent to $61 billion. Bond issues by other low- and middle-income countries rose, on average, 5 percent in 2019 to $73 billion and were also characterized by a sharp jump in issuance by private entities, up 65 percent, and a contraction in issues by sovereigns and public sector entities, down 23 percent.
The volume and composition of bond issuance at the regional level was mixed. Countries in the South Asia region issued $20 billion, a near threefold increase over the comparable figure for 2018. This increase was led by a surge in issuance by private sector entities in India, particularly in the energy and financial sector, and sovereign bond issues of $4.4 billion by Sri Lanka. In Europe and Central Asia, issuance rose 85 percent in 2019 to $66 billion; in contrast to other regions, the majority, about 75 percent, was by public sector borrowers. The Russian Federation and Turkey accounted for two-thirds of these issues and the same share of those by private sector entities in the region. Countries in Sub-Saharan Africa issued $20 billion, relatively unchanged from 2018 but with divergent push-pull factors: South Africa’s $5 billion sovereign issue, its largest ever eurobond, was offset by a 25 percent fall in issuance by other countries in the region after an $18 billion record high in 2018. Sovereign issues in 2019 from Sub-Saharan borrowers, for example, Angola, Ghana, and Kenya, were characterized by longer maturities and included 30-year tranches. Latin America and the Caribbean was the only region with lower bond issuance, down 13 percent from the prior year. This decline was driven by a 20 percent contraction in issuance by public sector entities, mostly in Argentina, and only partially offset by a 10 percent increase in issues by private sector entities, primarily those in Mexico.
Table BO.2.1 Bond Issuance by Low- and Middle-Income Countries, 2018–19US$ (billion)
Public issuers Corporate issuers All issuers
2018 2019 2018 2019 2018 2019
East Asia and Pacific 93.0 94.3 60.1 80.9 153.1 175.2
of which: China 63.7 60.7 50.4 71.6 114.1 132.3
Europe and Central Asia 25.3 50.2 10.4 15.7 35.6 65.8
Latin America and the Caribbean 73.7 59.0 20.9 22.9 94.6 82.0
Middle East and North Africa 12.7 13.3 0.3 0.0 13.0 13.3
South Asia 5.4 12.9 0.9 7.3 6.3 20.3
Sub-Saharan Africa 19.1 16.9 1.7 2.5 20.8 19.4
Low- and middle-income countries 229.1 246.7 94.4 129.3 323.4 376.0
Source: World Bank Debtor Reporting System.

I N T E R N A T I O N A L D E B T S T A T I S T I C S 2 0 2 1
12
Supporting Debt Data Transparency
The COVID-19 pandemic and its devastating effect on the global economy has highlighted once again the need for timely, accurate, and transpar-ent external debt data, a recurrent theme in earlier economic crises. National governments and their creditors rely on these data to reduce the risk of debt crises and to take remedial action should they occur. The World Bank and its sister institution, the IMF, have long been at the forefront of efforts to promote enhanced public debt transparency by member countries, as borrowers or as creditors. World Debt Tables, the forerunner of International Debt Statistics, represented the first public dissemi-nation by the World Bank of external debt data for individual low- and middle-income countries. It was launched in 1973 in response to the eco-nomic fallout from the first global oil crisis. The initiatives taken in International Debt Statistics 2021 are just one part of the World Bank’s much broader agenda to promote the comprehensive disclosure of public debt by borrowing countries and the institution’s extensive program of advisory and technical support to assist borrowers in com-prehensively recording and reporting public debt.
The World Bank is taking the lead in dissemi-nating data that provide the creditor composition of low- and middle-income countries’ external debt. International Debt Statistics 2020 provided users with new data on the borrower composi-tion of the external debt obligations of low- and middle-income countries, with information on bor-rowing disaggregated by public corporations and guarantees provided by governments. This year, International Debt Statistics 2021 presents, for the first time, an expanded data set that provides detailed information on the lending by creditor countries to low- and middle-income countries in addition to the disaggregation of countries’ external debt by type of creditor, which has been a long- standing element of the external debt data dis-seminated by the World Bank. Calls for greater debt transparency and the need for granular data have made these data set changes key tools with which to assess countries’ need for debt-service relief during the unfolding COVID-19 pandemic.
Information on the borrower-creditor matrix of external debt enhances transparency and analyses. The new series builds on the disaggregated data
set released early this year for IDA borrowers and other countries eligible for the DSSI. It sets a stan-dard for greater debt transparency to assist policy makers and analysts in evaluating the support the world’s poorest countries may need during the pandemic and the effort required from creditors. This new data set disaggregates public and publicly guaranteed debt external stocks and flows (dis-bursements and principal and interest payments) by creditor type and creditor country. The data are drawn from the World Bank DRS to which World Bank borrowers (IBRD and IDA) report annually, loan by loan, on stocks and flows for long-term external debt owed by public agencies or private agencies with public guarantees and in aggregate on long-term external debt owed by the private sector with no public guarantee, and quarterly, loan by loan, on the terms and conditions of new public and publicly guaranteed loan commitments.
External creditors are defined by residency and by lender, not by guarantor. From its origins, the DRS was set up to allow for the assessment of the volume and lending terms of individual credi-tors and creditor groups and to facilitate loan-level validation of debtor and creditor records. Creditor classification follows the definitions used in System of National Accounts (SNA 2008) and the Sixth Edition of the IMF’s Balance of Payments and International Investment Position Manual (BPM6) and is based on the criteria of residency, not nationality. For example, a loan from Citibank (London) is recorded as a loan from the United Kingdom, not the United States, where Citibank is headquartered. The definition of external debt also does not include contingent liabilities. This does not mean that debt guaranteed, on the side of the creditor, is excluded from the measure of the borrowers’ obligations but that it is attributed to the creditor, specified as the lender of record in the loan contract, and not the guarantor unless and until the guarantee is called. Thus, in the creditor type classification, a loan from a private sector entity with support (guarantee) from an official bilateral export credit agency or a multilateral institution will be classified as private creditor in category (3) or (4) described in the next paragraph.
There are limitations on identifying the creditor for some types of lending. Creditors are grouped into five creditor types: (1) bilateral creditors, (2) multilateral creditors, (3) suppliers’

O v e r v i e w
13
credits, (4) commercial banks and other private entities, and (5) bonds. Bilateral and multilateral creditors are combined as Official Creditors and the other three creditor types are combined as Private Creditors. DRS reporting countries pro-vide the creditor country and the name of the creditor extending the loan for public and publicly guaranteed loan commitments, except for bonds (where the multiplicity of individual holders ren-ders this intractable) and syndicated commercial bank loans where multiple banks may be involved.
The new data set enriches the ways in which external debt data can support analyses and policy making. Figure O.11, which disaggregates the composition of low- and middle-income countries’ bilateral obligations, is just one example. It sepa-rates these obligations between those owed to bilat-eral creditors from high-income countries and those owed to bilateral creditors from countries classified as low and middle income, and the major creditor in each of these categories is Japan and China. It confirms the rising importance of low- and middle-income countries lending to each other and the increasing importance of China in this process. Over the past decade low-and middle-income coun-tries’ share of their combined obligations to bilat-eral creditors has more than doubled to 45 percent from 20 percent in 2010, with China’s share rising more than threefold. The data set that underpins the figure can now also be analyzed for each credi-tor-debtor pair, for regions, or for select subgroups.
Ongoing efforts to bring greater debt transpar-ency to external debt data have also raised questions about how data in International Debt Statistics are defined and what they include. Data presented in
International Debt Statistics draw on information the World Bank collects and maintains on the external debt of its member countries through the DRS. Established in 1952, the DRS is the single most important source of verifiable information on the external indebtedness of low- and middle-income countries. The DRS defines external debt by residency and maturity as any debt obligation of a resident to a nonresident with an original maturity of more than one year. Debt includes (1) special drawing rights (SDR) allocations and currency and deposits (including unallocated gold accounts); (2) debt securities; (3) insurance, pension, and stan-dardized guarantee schemes; and (4) trade credit and advances and other accounts payable. All debt that falls within these parameters and is reported by debtor countries is captured in the DRS and included in the data presented in International Debt Statistics. Data on short-term obligations are drawn from information provided, on a voluntary basis, by national authorities in DRS reporting countries or from the short-term debt statistics compiled by the Bank for International Settlements.
A specific question is how accurately the deposits of foreign official entities at the central bank and currency swap arrangements that repre-sent loans from other central banks are reflected in external debt stocks of low- and middle-income countries. Deposits from one central bank to another are commonplace and often occur in low- and middle-income countries. How they are captured in the DRS depends on the original matu-rity structure of the deposit. Most deposits are of a short-term duration and thus outside the param-eters of the DRS reporting requirement. They will, however, be captured in central bank statis-tics in their measure of short-term obligations. Conversely, term deposits, for example, those extended by the Saudi Arabian Monetary Fund to Egypt and others, with fixed interest rates and average maturities beyond the one-year mark, fall within the definition of long-term debt, and are reported to the DRS and included in International Debt Statistics. The DRS also considers one-year deposits that are consistently rolled over (de facto) to be long-term debt. Currency swap arrange-ments have two aspects, the length of time the arrangement is in effect and the length of time the swap operation may be active (box O.3). Most currency swap arrangements have been of short-term duration.
Figure O.11 Creditor Composition of Debt Owed to Bilateral Creditors, 2010–19
05
101520253035404550
2010 2011 2012 2013 2014 2015 2016 2017 2018 2019
Per
cent
Japan Other high income
China Other low and middle income
Source: World Bank Debtor Reporting System.

I N T E R N A T I O N A L D E B T S T A T I S T I C S 2 0 2 1
14
Box O.3 Currency Swap Arrangements
Currency swaps between central banks are not new. The US Federal Reserve (the Fed) initiated them in the early 1960s, but they came to the fore-front during the 2008 financial crisis when such swaps by the Fed became one of the most impor-tant cross-border policy responses for helping to alleviate potentially devastating dollar funding problems for non-US banks. As part of the US response to the COVID-19 pandemic, the Fed has once again taken steps to ensure that foreign cen-tral banks have uninterrupted access to US dol-lars, and extended its currency swap arrangements to a broader group of countries.
Since the early 2000s and especially since 2008, many central banks, including those of low- and middle-income countries, have put in place currency swap arrangements. The core rationale for establishing a currency swap line is to promote orderly currency exchange markets. Currency swap arrangements are typically initially established for periods of one to three years and renewed when the term expires. Currency swap lines are a precautionary measure and a facility that central banks can activate quickly, should the need arise. In this sense they are akin to an overdraft facility on a checking account. New swap line arrangements between the Fed and the central banks of Canada and Mexico, for example, were put in place in 1994 under the North American Framework Agreement. They have a one-year duration, renewed annually. Canada has not drawn on its line, and Mexico drew in the mid-1990s on its currency swap line, which was increased to $9 billion in 2018.
Activation, that is, a draw on a currency swap line, involves two transactions, which will be illustrated using the example of a draw on a currency swap line with the Fed.a The first transaction is when central bank X draws on its swap line with the Fed; it sells a specified amount of its domestic currency to the Fed in exchange for US dollars at the prevailing market exchange rate.
The Fed holds the domestic currency it receives in its account at central bank X. The US dollars the Fed provides are deposited in the account that central bank X maintains with the Federal Reserve Bank of New York. Simultaneously, the Fed and central bank X enter into a binding agreement that specifies the date for the second swap transaction when central bank X is obligated to buy back its domestic currency at the same exchange rate. This second transaction effectively unwinds the swap. At the conclusion of the second transaction, central bank X also pays related interest charges, calculated at an agreed market-based rate. Maturities on currency swap line draws with the Fed have ranged historically from overnight to a maximum of twelve months. At present, the maximum is set at three months.
An important development of the past decade has been the renminbi currency swap program put in place by the People’s Bank of China (PBC). The PBC signed its first currency swap arrangement with the Central Bank of Korea in 2008 and since then has concluded about 35 renminbi swap arrangements estimated to total the equivalent of $500 billion. Information on central bank websites and press reports suggest that about 20 of these arrangements are with low- and middle-income countries. The PBC arrangements typically have a one- to three-year term and are subsequently renewed. PBC currency swap arrangements have been in place with the central banks of Argentina and Indonesia since 2009, and with the European Central Bank and the Bank of England since 2013. There is no currency swap arrangement between the Fed and the PBC. Some countries, including Argentina, Mongolia, Pakistan, and the Russian Federation, have activated their PBC currency swap lines in recent years to meet short-term liquidity needs where some renminbi received were exchanged for US dollars. Other swap lines include the Association of Southeast Asian Nations (ASEAN) Swap Arrangement and the Chiang Mai Initiative.
a. Draws on currency swap lines of other central banks operate in much the same manner.

O v e r v i e w
15
IDA Borrowers Eligible for the DSSI: External Debt Stocks and Flows
Aggregate financial flows to countries eligible for the DSSI2 rose 16 percent in 2019, far faster than to other low- and middle-income countries. Aggregate net financial flows, debt and equity combined, totaled $103 billion in 2019, and measured relative to DSSI-eligible countries’ GNI were equivalent to 5 percent. The increase in net financial flows was the outcome of a 10 percent rise in net debt inflows (gross disbursements of new financing minus principal payments), which rose to $66 billion from $60 billion in 2018 and a 28 percent rise in equity inflows. FDI inflows totaled $39 billion from $29 billion in 2018 and more than offset negative portfolio equity flows.
The external debt stock of DSSI-eligible countries accumulated at nearly twice the rate of
that in other low- and middle-income countries in 2019. The combined external debt stock of DSSI-eligible countries rose 9 percent in 2019 to $744 billion, equivalent on average to 33 percent of their combined GNI (measured in nominal terms). The pace of debt accumulation in 2019 was comparable to that of China and almost twice the rate of increase registered by other low- and middle-income countries. Long-term debt stocks rose by 9 percent and short-term debt rose by 16 percent, bringing external debt stocks at end-2019 to double the level at end-2010. The 11 percent rise in the long-term nonguaranteed external debt obligations of private sector entities in 2019 outpaced the 8 percent increase in the long-term external debt stock of public and pub-licly guaranteed borrowers. However, in relation to total long-term debt, the share of private sector entities stayed about the same from 2018 to 2019, roughly 25 percent.
The rise in public and publicly guaranteed external debt of DSSI-eligible countries over the past decade was coupled with an increase in market-based financing. The combined long-term external debt stock of public and publicly guar-anteed borrowers was $523 billion at the end of 2019, double the comparable figure at the end of 2010. Official creditors, including the IMF,
Table O.2 Aggregate Net Financial Flows to DSSI-Eligible Countries, 2010–19US$ (billion)
2010 2011 2012 2013 2014 2015 2016 2017 2018 2019
Net financial flows, debt and equity 73.3 88.0 84.7 96.6 90.2 83.4 75.3 89.3 88.7 102.8
Percent of GNI (%) 5.3 5.5 4.9 5.1 4.3 4.1 3.8 4.3 4.1 4.6
Net Debt Inflows 34.6 39.1 43.7 62.6 50.9 44.8 40.1 51.2 59.8 65.6
Long-term 27.1 38.2 38.4 53.0 53.1 40.9 42.2 44.7 62.8 57.2
Official creditors 16.0 17.1 17.2 20.1 25.7 24.7 33.3 29.8 33.6 36.5
World Bank (IBRD and IDA) 4.0 3.9 4.4 5.4 6.8 7.7 6.6 8.0 9.4 12.3
IMF 3.0 1.2 -1.1 -2.1 -0.1 1.7 1.0 0.4 1.0 1.9
Private creditors 11.1 21.1 21.1 32.8 27.4 16.2 8.9 14.9 29.3 20.7
Bonds -1.3 1.6 4.5 4.9 13.5 7.5 3.0 12.8 16.4 6.6
Banks and other private 12.4 19.5 16.7 27.9 13.9 8.8 5.9 2.1 12.9 14.1
Short-term 7.6 0.9 5.3 9.6 -2.2 3.9 -2.0 6.5 -3.1 8.4
Net equity flows 38.7 48.9 41.0 34.0 39.3 38.6 35.2 38.1 28.9 37.1
Net foreign direct investment inflows 35.2 46.0 34.1 27.9 36.0 38.6 34.9 35.4 28.5 38.7
Net portfolio equity inflows 3.5 2.9 6.9 6.1 3.3 0.0 0.3 2.6 0.4 -1.6
Change in reserves (- = increase) -8.0 -12.8 -24.8 -17.1 11.2 3.6 5.8 -19.0 7.2 5.5
Sources: World Bank Debtor Reporting System; International Monetary Fund; and Bank for International Settlements.
2 Eligibility for the Debt Service Suspension Initiative is reserved for countries eligible to borrow from IDA at the time the initiative was endorsed in April 2020 and for countries on the United Nations list of Least Developed Countries that are in current standing in regard to their debt service with the World Bank and the International Monetary Fund as of FY2020. The following IDA bor-rowers are not eligible for the DSSI: Eritrea, Sudan, the Syrian Arab Republic, and Zimbabwe.

I N T E R N A T I O N A L D E B T S T A T I S T I C S 2 0 2 1
16
accounted for the largest share of DSSI-eligible countries’ external public and publicly guaranteed debt stock at the end of 2019 (81 percent), but financing from private creditors was the fastest-growing component. Obligations to private credi-tors totaled $102 billion at the end of 2019, a near fivefold increase over the comparable figure at the start of the decade, and raised their share of the combined debt owed to all creditors to 19 percent (from 8 percent in 2010). Multilateral creditors, including the IMF, were DSSI-eligible countries’ most important creditors, with a total outstanding of $243 billion at end-2019, which is equivalent to 46 percent of total public and pub-licly guaranteed debt.
Financing from official creditors has been characterized by changes in the creditor com-position of bilateral creditors. DSSI-eligible
countries’ obligations to bilateral creditors have risen 77 percent since 2013 to $178 billion at end-2019, equivalent to 41 percent of debt owed to official creditors, up from 28 percent in 2013. Over this same period the creditor composition of obligations to bilateral credi-tors has undergone a significant change. G-20 countries account for most of the bilateral debt of DSSI-eligible countries, 91 percent of end-2019 obligations, up slightly from 85 percent at end-2013. However, within the G-20 creditor group there have been some important shifts characterized by a marked increase in lending by G-20 member countries that are themselves low- and middle-income countries (for example, China, India, and Russia). China, by far the largest creditor, has seen its share of the com-bined debt owed to G-20 countries rise from 45
Source: World Bank Debtor Reporting System.
Figure O.14 DSSI-Eligible Countries’ Bilateral Debt-Creditor Composition, 2013–19
0
10
20
30
40
50
60
70
2013 2014 2015 2016 2017 2018 2019
Per
cent
China Japan India
Other G-20 bilateral creditors Other bilateral creditors
Source: World Bank Debtor Reporting System.
Figure O.15 DSSI-Eligible Countries’ Share of Public and Publicly Guaranteed Debt Owed to Private Creditors at end-2019
0 20 40 60 80
Côte d'IvoireGhana
St. LuciaChad
ZambiaAngola
MongoliaNigeria
SenegalMaldives
BeninFiji
Cabo VerdeHonduras
EthiopiaKenya
GrenadaPakistan
Percent
Bondholders Other private creditors
Figure O.12 External Debt Stock of DSSI-Eligible Countries, 2010–19
0
100
200
300
400
500
600
2010 2011 2012 2013 2014 2015 2015 2017 2018 2019
US
$ (b
illio
n)
Public and publicly guaranteed (including IMF)
Private nonguaranteed
Short-term debt
Sources: World Bank Debtor Reporting System; and Bank for International Settlements.
Figure O.13 DSSI-Eligible Countries’ Creditor Composition of Long-Term Public and Publicly Guaranteed External Debt, 2010–19
0
100
200
300
400
500
600
2010 2011 2012 2013 2014 2015 2016 2017 2018 2019
US
$ (b
illio
n)
Bilateral creditors Multilateral creditors
Bondholders Other private creditors
Source: World Bank Debtor Reporting System.

O v e r v i e w
17
percent in 2013 to 63 percent at end-2019. Over the same period the share for Japan, the second largest G-20 creditor, has remained broadly the same at 15 percent.
Obligations to private creditors are owed mostly to bondholders. Public and publicly guaranteed debt owed to private creditors totaled $102 billion at end-2019, equivalent to 16 percent of DSSI-eligible countries’ combined long-term external public debt stock. Most of this debt, 65 percent, was owed to bondholders, with the remaining 35 percent of obligations owed to commercial banks and other private entities, including commodity trading com-panies. Governments have used funds raised from bond issues for budgetary support, infrastructure projects, and refinancing of prior bond issues to take advantage of longer maturities and lower interest rates. Debt owed to other private creditors includes company and commercial bank loans with official support (guarantees) from bilateral export credit agencies or multilateral institutions. Most of this debt has been used to finance large-scale infrastruc-ture projects, with some collateralized against future export receipts for oil or other commodities.
Obligations to private creditors were concen-trated in a few countries. Eighteen DSSI-eligible countries accounted for 90 percent of debt owed to all private creditors by DSSI countries at end-2019, and 92 percent of that was owed to bond-holders. In these 18 countries, private creditors’ share in end-2019 public and publicly guaran-teed debt stock averaged 33 percent and ranged from 60 percent in Côte d’Ivoire to 13 percent
in Pakistan, the largest debtor among DSSI-countries. Except for Cabo Verde and Chad, all DSSI- eligible countries with a significant share of debt owed to private creditors have issued eurobonds and half of the 18 countries are blend IBRD/IDA or IBRD borrowers assessed as credit-worthy for market-based financing.
Debt Indicators, 2010–2019
Debt indicators indicate that debt burdens may be key contributors to economic vulnerabilities in low- and middle-income countries. The external debt burden of low- and middle-income countries combined remains moderate. The ratio of external debt to GNI averaged 26 percent at end-2019, only marginally higher than the 2018 average of 25 percent, and the ratio of external debt to export earnings deteriorated slightly, rising to an average of 107 percent from 101 percent in 2018. China’s low level of external debt relative to GNI, 15 percent, and to exports, 73 percent, at end-2019 weighs heavily on the averages. For low- and middle-income countries, excluding China, the ratio of external debt to GNI averaged 35 percent and the external debt-to-exports ratio averaged 127 percent at end-2019.
The ratio of external debt stocks to GNI for borrower countries has risen over the past decade in many low- and middle-income coun-tries. Country-specific indicators vary widely but
Figure O.16 External Debt-to-GNI Ratio, Low- and Middle-Income Country Distribution, 2010 and 2019
Sources: World Bank Debtor Reporting System; and International Monetary Fund.
0
5
10
15
20
25
30
35
40
45
50
Below 30% 30–40% 40–60% 60–100% Above 100%
Per
cent
2010 2019
Figure O.17 External Debt-to-Export Ratio, Low- and Middle-Income Country Distribution, 2010 and 2019
Sources: World Bank Debtor Reporting System; and International Monetary Fund.
Below 100% 100–150% 150–200% 200–250% Above 250%
Per
cent
2010 2019
0
5
10
15
20
25
30
35
40
45

I N T E R N A T I O N A L D E B T S T A T I S T I C S 2 0 2 1
18
the number of low- and middle-income countries that have seen a marked increase in the ratio of external debt stocks to GNI suggest that mount-ing concerns over unsustainable debt burdens and heightened risk of debt crises in some countries are not unfounded. The percentage of low- and middle-income countries with a debt-to-GNI ratio below 30 percent fell from 45 percent in 2010 to 22 percent at end-2019. Thirty-two percent of low- and middle-income countries had external debt-to-GNI ratios above 60 percent at end-2019, compared with 23 percent in 2010, and in 9 per-cent of countries the ratio surpassed 100 percent, one-third more than the share of countries with a comparable ratio in 2010.
The number of low- and middle-income coun-tries registering increases in the ratio of external debt stock to exports of goods and services also increased sharply. At end-2019, 55 percent of low- and middle-income countries had external debt-to-export ratios of over 150 percent, as compared to 45 percent in 2010. In 17 percent of the countries the ratio exceeded 250 percent at end-2019, a sharp increase from 2010 when only 10 percent of countries had ratios in excess of 250 percent.
Equity Flows in 2019
Equity flows are a significant element of financial flows to low- and middle-income countries. Over the past decade they averaged $570 billion per year and typically accounted for more than half of annual aggregate flows (debt and equity com-bined) and a much higher share when debt flows fell sharply or, as in 2015, were negative. Most equity inflows consisted of FDI, on average 90 percent per year since 2010, with only a handful of low- and middle-income countries being the beneficiaries of portfolio equity flows to any sig-nificant degree.
FDI inflows to low- and middle-income coun-tries fell marginally in 2019 but were characterized by a marked change in destination for some of the largest recipients. FDI inflows to low- and middle-income countries totaled $479 billion in 2019, a marginal (2 percent) drop from the prior year. Inflows to China, the second-largest FDI recipient globally after the United States, contracted 29 per-cent to $131 billion, a sharp reversal from the 32 percent rise recorded in 2018. China’s share of FDI inflows to low- and middle-income countries fell
Box O.4 Debt-to-GDP versus Debt-to-GNI Ratios
Gross domestic product (GDP) and gross national income (GNI) both measure a country’s income, but GDP counts only income received from domestic sources, whereas GNI includes net income received from abroad. The World Bank favors the use of GNI for operational purposes. Member countries’ relative poverty is measured in relation to GNI per capita, and this measure underpins the annual income classification pub-lished by the World Bank and the IDA operational cut-off ($1,185 per capita for FY21) and the IBRD and IDA lending terms (interest rate and maturity) for specified borrowers. International Debt Statistics follows this convention and provides users with GNI data for each reporting country and the relevant external ratios of debt stock and debt service to GNI ratios.
The IMF uses the concept of GDP in Article IV consultation reports and IMF programs to measure macroeconomic outcomes. The practice is carried forward to the joint Bank-Fund Debt
Sustainability Analysis, with debt stocks and debt service measured in relation to GDP. Conceptually GDP may be regarded as a more accurate measure of a national government’s capacity to raise domestic resources from which debt-related obligations must be serviced.
For most countries the difference between GDP and GNI is minimal. For example, the World Bank calculates US GNI to be only 1.2 percent higher than GDP in 2019. GNI may be lower than GDP if nonresidents control a sizable proportion of a country’s production or higher than GDP if, for example, a country receives a large amount of foreign aid. For most low- and middle-income countries, the difference between end-2019 GDP and GNI was small but there were some outliers; aid-dependent Pacific islands such as Kiribati and Tuvalu had a GNI significantly higher than their GDP. Conversely, in countries such as Liberia and Sierra Leone, GDP surpassed GNI by 13 percent and 7 percent, respectively.

O v e r v i e w
19
to 27 percent from 38 percent in 2018. The com-bined FDI inflows to other major recipients, Brazil, India and Russia, rose 31 percent in 2019 to $140 billion, propelled by the threefold rise in inflows to Russia. For low- and middle-income countries other than the four largest recipients, FDI inflows rose, on average, 5 percent in 2019 to $208 billion from $198 billion in 2018, equivalent to 43 percent of 2019 FDI inflows, up from 40 percent in 2018.
There was significant divergence in 2019 inflows among regional groups. Four regions, Europe and Central Asia, Latin America and the Caribbean, South Asia, and Sub-Saharan Africa reported increases in FDI inflows in 2019 ranging from 11 percent in South Asia to 50 percent in Europe and Central Asia. FDI inflows to countries in East Asia and Pacific fell 24 percent, or a more moderate 5 percent when China is excluded. In the Middle East and North Africa FDI inflows in 2019 were down 13 percent from the prior year’s level.
European and Central Asian countries saw the biggest increase in FDI inflows, up 50 percent in 2019 to $66 billion, propelled by a rebound in inflows to Russia. They rose four-fold to $29 billion from $10 billion in 2018 with reinvested earnings topping $20 billion and new investment turning positive, after a large-scale disinvestment in 2018. Other countries in the region saw FDI inflows rise 9 percent, with a resurgence in inflows to Ukraine of 21 percent and a near threefold increase in FDI inflows to Uzbekistan, in response to economic liberalization. These increases offset the 16 percent contraction in inflows to Turkey, triggered by greater economic uncertainty and weaker economic growth.
Countries in Sub-Saharan Africa recorded a 26 percent increase in FDI inflows in 2019 to $23 billion. Much of this increase is attributable to a slowdown in net divestment from Angola caused by repatriation in the oil sector. FDI flows remained negative in 2019 (−$4.7 billion) but less so than in 2018 (−$7.1 billion). FDI inflows to Nigeria jumped 81 percent to $3.3 billion, accom-panied by some diversification from the oil sector, and rose 71 percent in Côte d’Ivoire, to $1 billion, in tandem with the country’s sustained economic growth. Net FDI inflows to Ethiopia, the largest FDI recipient in Eastern Africa, fell 25 percent to $2.5 billion partly because of instability in some regions, but with broad-based investment across manufacturing and services. FDI inflows to Ghana followed a similar trajectory, down 22 percent to $2.3 billion, but investments remained largely focused on oil and gas facilities.
FDI inflows to countries in Latin America and the Caribbean rose 14 percent in 2019 to $138 billion, with higher inflows to all major economies in the region except Argentina. FDI inflows to Brazil increased 19 percent to $68 billion, equivalent to almost half of 2019 inflows to the region, in response to improved economic conditions and the launch of a wide-ranging privatization program that raised more than $20 billion. FDI inflows to Colombia were up 22 percent to $12 billion, of which a third went to the oil and mining sector, and rose 42 percent in Peru to $9 billion boosted by inflows to the mining and energy sector. FDI inflows to Mexico rose 20 percent to $31 billion despite lingering uncertainties related to the ratification of the new regional trade agreement with the United States
Sources: International Monetary Fund; and United Nations Conference on Trade and Development (UNCTAD).
Figure O.18 Net Equity Inflows to Low- and Middle-Income Countries, 2010–19
(100) 0 100 200 300 400 500 600 700
2010
2011
2012
2013
2014
2015
2016
2017
2018
2019
US$ (billion)
Portfolio equity Foreign direct investment
Figure O.19 FDI to China and Other Select Low- and Middle-Income Countries, 2010–19
Sources: International Monetary Fund; and United Nations Conference on Trade and Development (UNCTAD).
0102030405060708090
100
2010 2011 2012 2013 2014 2015 2016 2017 2018 2019
Per
cent
Other low- and middle-income countries Russian Federation
Brazil India China

I N T E R N A T I O N A L D E B T S T A T I S T I C S 2 0 2 1
20
and Canada. Half of 2019 inflows went to the automotive industry. The deepening economic cri-sis in Argentina deterred investors and FDI inflows fell 38 percent from the 2018 level to $6.5 billion.
The 11 percent rise in FDI inflows to countries in South Asia was driven by India where addi-tional relaxation of investment barriers in mid-2019, including in retail and insurance, boosted FDI by 10 percent in 2019 to $43 billion, directed largely at the technology and communication industry. FDI inflows to Bangladesh also rose 10 percent to $1.4 billion, mostly into the garment industry, and inflows to Pakistan rebounded to $2 billion, up one-third compared with 2018 FDI inflows. The increase was driven by equity invest-ment in energy, the financial sector, and textiles and led by British and Chinese investors.
FDI inflows to the Middle East and North Africa region fell 13 percent, reflecting a marked slowdown in investment across the region. FDI inflows to Morocco decreased by half to $1.4 billion, dropped 18 percent in Tunisia to $817 million in tandem with slower economic growth, and fell 16 percent in Lebanon to $2.2 billion with investors deterred by the ongoing macroeconomic crisis. In contrast, Egypt was a bright spot. FDI inflows rose 11 percent to $9 billion in response to economic reforms that improved macroeconomic stability and bolstered investor confidence. A sig-nificant share of these flows went into the oil and
gas sector, but telecommunications and consumer goods also attracted investment.
Countries in the East Asia and Pacific region had the largest decline in FDI inflows in 2019. They fell 24 percent to $186 billion on account of the steep drop in FDI inflows to China, which fell 29 percent to $131 billion, equivalent to 71 percent of inflows to the region. The decline was driven in part by trade tensions but also by a shift toward intercompany lending, reflected in the 2019 increase in net debt inflows to pri-vate sector entities. FDI inflows to Indonesia were up 24 percent to a record $25 billion, with strong investment in manufacturing, mining, and financial services. Among the small economies, Cambodia received record high FDI inflows of $3.7 billion in 2019, led by increases in manu-facturing and services by predominantly Asian investors. FDI in Thailand fell 50 percent to $6.8 billion and 14 percent in Vietnam to $12 billion, pulling 2019 FDI to countries in the region other than China down 5 percent to $55 billion.
Portfolio equity flows are small in com-parison with FDI and are directed at only a small number of low- and middle-income countries. Portfolio equity inflows are by far the most concentrated element of financial flows to low and middle-income countries, and the number of low- and middle-income countries that have benefited to any significant degree from these flows over the past decade is limited. Cumulative portfolio equity inflows from 2010 to 2019 totaled $581 billion, of which 91 percent went to three countries: China, $331 billion (57 percent); Brazil, $94 billion (16 percent); and India, $101 billion (17 percent).
Portfolio equity flows to low- and middle-income countries centered on China and India in 2019. The volatility that marks portfolio equity flows to emerging markets was again evident in 2019. Portfolio equity inflows to low- and middle-income countries rose 23 percent in 2019 to $47 billion from $39 billion in 2018, with investors favoring China and India and again retreating from most other emerging markets in 2019 over concerns that centered on both domes-tic and global economic conditions and because of attractive options in alternative markets,
Figure O.20 Foreign Direct Investment Inflows: Regional Distribution, 2017–19
Sources: International Monetary Fund; and United Nations Conference on Trade and Development (UNCTAD).
0
50
100
150
200
250
US
$ (b
illio
n)
East A
sia an
d Pac
ific
East A
sia an
d Pac
ific
(exc
luding
Chin
a)
Europ
e and
Cen
tral A
sia
Latin
Amer
ica an
d the
Car
ibbea
n
Middle
East a
nd N
orth
Africa
South
Asia
Sub-S
ahar
an A
frica
2017 2018 2019

O v e r v i e w
21
particularly the United States. Net inflows to China fell 26 percent to $45 billion from $61 bil-lion in 2018 despite further measures in 2019 by the Chinese government to liberalize the financial market. These measures included implementa-tion of automated access between the Shanghai and London markets, following the link to the Hong Kong SAR, China, market in 2018, and FTSE Russell inclusion of Chinese A-shares in its emerging market index. Investor concerns
centered on slower economic growth, weakening of the renminbi, tight controls on outbound capi-tal, and ongoing trade tensions with the United States. In contrast to China, net portfolio inflows to India rebounded to $14 billion after register-ing an outflow of $4 billion in 2018 driven by attractive valuations and improvements in mar-ket access. Excluding China and India, portfolio equity flows to low- and middle-income countries saw an $11 billion outflow in 2019.
Figure O.22 Portfolio Equity Flows to Major Recipients, 2017–19
Source: International Monetary Fund.
–10 0 10 20
RussianFederation
Nigeria
Turkey
India
Mexico
South Africa
Brazil
US$ (billion)
2017 2018 2019
Figure O.21 Portfolio Equity Flows to Low- and Middle-Income Countries, 2017–19
Source: International Monetary Fund.
–30
–20
–10
0
10
20
30
40
50
60
70
China Low- and middle-incomecountries (excluding China)
US
$ (b
illio
n)
2017 2018 2019


part IIAggregate and Country Tables
23


25
ALL LOW- AND MIDDLE-INCOME COUNTRIES(US$ billion, unless otherwise indicated)
2009 2015 2016 2017 2018 2019Summary external debt data by debtor typeTotal external debt stocks 3,618 6,340 6,623 7,317 7,719 8,139 Use of IMF credit 131 110 112 122 150 170 Long-term external debt 2,751 4,613 4,924 5,281 5,433 5,801 Public and publicly guaranteed sector 1,465 2,305 2,448 2,760 2,904 3,100 Public sector 1,459 2,300 2,444 2,757 2,901 3,098 of which: General government 1,090 1,644 1,760 1,999 2,099 2,280 Private sector guaranteed by public sector 6 5 4 3 3 3 Private sector not guaranteed 1,286 2,309 2,476 2,521 2,530 2,701 Short-term external debt 736 1,617 1,588 1,914 2,136 2,168
Disbursements (long-term) 488 773 950 1,105 1,052 1,191 Public and publicly guaranteed sector 204 306 338 472 436 453 Public sector 202 306 338 471 436 453 of which: General government 139 210 228 308 278 317 Private sector guaranteed by public sector 2 0 0 0 0 0 Private sector not guaranteed 284 467 612 633 616 738
Principal repayments (long-term) 385 619 700 703 769 860 Public and publicly guaranteed sector 119 221 194 204 254 254 Public sector 118 220 193 203 253 254 of which: General government 71 113 100 108 133 125 Private sector guaranteed by public sector 0 1 1 1 1 0 Private sector not guaranteed 267 399 507 499 515 606
Interest payments (long-term) 107 169 170 185 205 222 Public and publicly guaranteed sector 50 79 83 97 105 119 Public sector 50 79 83 97 105 119 of which: General government 40 60 63 74 78 83 Private sector guaranteed by public sector 0 0 0 0 0 0 Private sector not guaranteed 57 91 87 89 100 103
Summary external debt stock by creditor typeLong-term external debt stocks 2,751 4,613 4,924 5,281 5,433 5,801 Public and publicly guaranteed debt from: 1,465 2,305 2,448 2,760 2,904 3,100 Official creditors 762 909 967 1,052 1,089 1,130 Multilateral 429 558 583 635 657 691 of which: World Bank 221 278 287 311 320 338 Bilateral 334 351 384 417 433 439 Private creditors 703 1,396 1,481 1,709 1,814 1,970 Bondholders 444 948 1,048 1,262 1,376 1,527 Commercial banks and others 259 447 433 446 438 443 Private nonguaranteed debt from: 1,286 2,309 2,476 2,521 2,530 2,701 Bondholders 180 365 396 475 484 564 Commercial banks and others 1,106 1,943 2,080 2,046 2,046 2,137Use of IMF credit 131 110 112 122 150 170
Net financial inflowsNet debt inflows Use of IMF credit 17 7 5 4 31 22 Long-term 103 154 250 402 282 331 Official creditors 52 45 56 54 51 46 Multilateral 43 33 33 31 32 37 of which: World Bank 17 17 14 12 15 19 Bilateral 9 12 24 23 19 9 Private creditors 50 109 193 348 231 285 Bondholders 47 61 127 281 180 234 Banks and others 3 48 67 67 51 51 Short-term 41 -480 -36 327 219 30Net equity inflows Foreign direct investment 358 496 462 463 490 479 Portfolio equity 124 20 49 65 39 47
Debt ratiosExternal debt stocks to exports (%) 85 99 108 105 101 107External debt stocks to GNI (%) 22 24 25 25 25 26Debt service to exports (%) 12 13 15 14 14 15Short-term to external debt stocks (%) 20 26 24 26 28 27Multilateral to external debt stocks (%) 12 9 9 9 9 8Reserves to external debt stocks (%) 125 91 83 79 74 72Gross national income (GNI) 16,159 26,092 26,205 28,810 30,561 31,423

26
EAST ASIA AND PACIFIC(US$ billion, unless otherwise indicated)
2009 2015 2016 2017 2018 2019Summary external debt data by debtor typeTotal external debt stocks 829 2,004 2,112 2,482 2,789 2,995 Use of IMF credit 19 16 16 17 17 17 Long-term external debt 501 1,042 1,166 1,277 1,400 1,619 Public and publicly guaranteed sector 297 442 476 546 641 729 Public sector 296 442 475 546 641 728 of which: General government 220 343 365 404 448 511 Private sector guaranteed by public sector 0 0 0 0 0 0 Private sector not guaranteed 205 599 691 731 759 890 Short-term external debt 309 945 930 1,188 1,372 1,359
Disbursements (long-term) 88 224 277 362 407 510 Public and publicly guaranteed sector 39 69 60 98 131 130 Public sector 39 69 60 98 131 130 of which: General government 28 46 45 49 65 82 Private sector guaranteed by public sector 0 0 0 0 0 0 Private sector not guaranteed 49 155 217 264 276 380
Principal repayments (long-term) 73 160 216 231 252 309 Public and publicly guaranteed sector 19 48 35 34 34 43 Public sector 19 48 35 34 34 43 of which: General government 13 14 22 15 18 19 Private sector guaranteed by public sector 0 0 0 0 0 0 Private sector not guaranteed 53 112 182 197 218 266
Interest payments (long-term) 13 33 29 35 47 57 Public and publicly guaranteed sector 9 12 12 14 18 22 Public sector 9 12 12 14 18 22 of which: General government 7 8 9 10 13 14 Private sector guaranteed by public sector 0 0 0 0 0 0 Private sector not guaranteed 4 21 17 21 29 35
Summary external debt stock by creditor typeLong-term external debt stocks 501 1,042 1,166 1,277 1,400 1,619 Public and publicly guaranteed debt from: 297 442 476 546 641 729 Official creditors 207 192 203 208 211 215 Multilateral 81 98 101 106 110 115 of which: World Bank 44 54 55 59 60 62 Bilateral 126 94 102 101 101 100 Private creditors 90 251 273 338 430 513 Bondholders 61 205 223 284 371 449 Commercial banks and others 29 46 50 54 59 64 Private nonguaranteed debt from: 205 599 691 731 759 890 Bondholders 21 115 132 183 216 275 Commercial banks and others 184 485 559 548 543 615Use of IMF credit 19 16 16 17 17 17
Net financial inflowsNet debt inflows Use of IMF credit 0 0 0 0 0 0 Long-term 16 63 60 131 155 201 Official creditors 6 2 0 0 4 4 Multilateral 6 6 4 4 5 5 of which: World Bank 2 3 2 2 2 2 Bilateral 0 -3 -4 -3 -1 -1 Private creditors 10 61 60 130 151 197 Bondholders 13 25 40 111 124 137 Banks and others -3 36 20 19 27 60 Short-term 68 -431 -16 259 184 -13Net equity inflows Foreign direct investment 151 259 193 190 244 186 Portfolio equity 40 4 24 35 49 46
Debt ratiosExternal debt stocks to exports (%) 46 60 66 69 72 77External debt stocks to GNI (%) 13 16 16 17 17 18Debt service to exports (%) 5 7 8 9 9 11Short-term to external debt stocks (%) 37 47 44 48 49 45Multilateral to external debt stocks (%) 10 5 5 4 4 4Reserves to external debt stocks (%) 324 186 163 146 128 122Gross national income (GNI) 6,250 12,896 13,175 14,438 16,109 16,738

27
EUROPE AND CENTRAL ASIA(US$ billion, unless otherwise indicated)
2009 2015 2016 2017 2018 2019Summary external debt data by debtor typeTotal external debt stocks 1,076 1,356 1,443 1,495 1,420 1,464 Use of IMF credit 43 28 29 30 29 27 Long-term external debt 864 1,121 1,209 1,231 1,163 1,189 Public and publicly guaranteed sector 302 436 447 501 466 493 Public sector 302 435 446 500 466 492 of which: General government 160 231 247 283 277 314 Private sector guaranteed by public sector 0 1 1 1 0 0 Private sector not guaranteed 562 685 762 730 696 696 Short-term external debt 169 206 206 234 228 249
Disbursements (long-term) 163 134 238 246 173 219 Public and publicly guaranteed sector 45 51 53 89 50 86 Public sector 45 51 53 89 50 86 of which: General government 26 39 31 46 32 57 Private sector guaranteed by public sector 0 0 0 0 0 0 Private sector not guaranteed 118 83 185 157 123 133
Principal repayments (long-term) 175 202 164 188 222 207 Public and publicly guaranteed sector 31 68 42 45 79 58 Public sector 31 68 42 45 79 58 of which: General government 11 35 13 19 34 20 Private sector guaranteed by public sector 0 0 0 0 0 0 Private sector not guaranteed 144 134 122 143 143 149
Interest payments (long-term) 40 43 44 44 43 43 Public and publicly guaranteed sector 9 12 15 17 19 19 Public sector 9 12 15 17 19 19 of which: General government 7 10 9 10 12 12 Private sector guaranteed by public sector 0 0 0 0 0 0 Private sector not guaranteed 30 31 29 27 24 24
Summary external debt stock by creditor typeLong-term external debt stocks 864 1,121 1,209 1,231 1,163 1,189 Public and publicly guaranteed debt from: 302 436 447 501 466 493 Official creditors 83 112 117 131 132 134 Multilateral 53 77 81 90 90 88 of which: World Bank 30 37 37 40 40 40 Bilateral 30 35 37 41 42 45 Private creditors 220 324 329 370 335 359 Bondholders 73 147 164 196 194 232 Commercial banks and others 146 177 165 174 141 127 Private nonguaranteed debt from: 562 685 762 730 696 696 Bondholders 36 56 67 78 77 84 Commercial banks and others 525 629 696 652 619 613Use of IMF credit 43 28 29 30 29 27
Net financial inflowsNet debt inflows Use of IMF credit 11 5 1 0 -1 -2 Long-term -12 -68 74 57 -50 11 Official creditors 12 7 7 7 4 3 Multilateral 10 5 5 4 2 0 of which: World Bank 2 1 1 1 1 0 Bilateral 2 2 2 3 2 3 Private creditors -24 -76 67 51 -54 9 Bondholders -12 -8 25 35 0 44 Banks and others -13 -68 42 16 -54 -36 Short-term -26 -61 -2 27 -6 20Net equity inflows Foreign direct investment 58 49 77 60 44 66 Portfolio equity 7 -8 -1 -5 -7 -4
Debt ratiosExternal debt stocks to exports (%) 140 147 171 149 121 126External debt stocks to GNI (%) 46 48 53 49 46 47Debt service to exports (%) 29 27 25 24 24 22Short-term to external debt stocks (%) 16 15 14 16 16 17Multilateral to external debt stocks (%) 5 6 6 6 6 6Reserves to external debt stocks (%) 55 38 36 38 41 44Gross national income (GNI) 2,362 2,847 2,703 3,032 3,106 3,146

28
LATIN AMERICA AND THE CARIBBEAN(US$ billion, unless otherwise indicated)
2009 2015 2016 2017 2018 2019Summary external debt data by debtor typeTotal external debt stocks 899 1,667 1,703 1,789 1,883 1,927 Use of IMF credit 23 20 20 21 48 65 Long-term external debt 747 1,386 1,447 1,521 1,544 1,557 Public and publicly guaranteed sector 434 758 814 878 912 919 Public sector 430 756 812 876 911 917 of which: General government 336 517 559 605 631 641 Private sector guaranteed by public sector 4 3 2 2 2 2 Private sector not guaranteed 313 628 632 644 632 638 Short-term external debt 129 261 236 247 291 304
Disbursements (long-term) 156 241 276 272 260 243 Public and publicly guaranteed sector 72 92 126 137 128 101 Public sector 70 91 126 137 128 101 of which: General government 47 52 80 87 84 65 Private sector guaranteed by public sector 2 0 0 0 0 0 Private sector not guaranteed 84 150 150 135 132 142
Principal repayments (long-term) 93 163 196 182 171 228 Public and publicly guaranteed sector 41 55 63 76 74 94 Public sector 40 54 62 75 74 94 of which: General government 29 29 30 43 30 44 Private sector guaranteed by public sector 0 1 1 1 1 0 Private sector not guaranteed 53 108 134 106 96 134
Interest payments (long-term) 39 65 67 74 71 76 Public and publicly guaranteed sector 22 40 39 48 43 50 Public sector 22 40 39 48 43 50 of which: General government 18 31 32 38 34 35 Private sector guaranteed by public sector 0 0 0 0 0 0 Private sector not guaranteed 17 25 27 26 28 27
Summary external debt stock by creditor typeLong-term external debt stocks 747 1,386 1,447 1,521 1,544 1,557 Public and publicly guaranteed debt from: 434 758 814 878 912 919 Official creditors 142 198 202 211 217 217 Multilateral 110 151 156 158 167 173 of which: World Bank 40 56 57 57 58 61 Bilateral 32 47 46 53 50 44 Private creditors 292 561 613 667 695 702 Bondholders 253 425 480 535 555 558 Commercial banks and others 39 135 133 131 140 144 Private nonguaranteed debt from: 313 628 632 644 632 638 Bondholders 97 170 170 182 158 167 Commercial banks and others 217 458 462 462 474 470Use of IMF credit 23 20 20 21 48 65
Net financial inflowsNet debt inflows Use of IMF credit 0 0 0 0 29 17 Long-term 63 79 80 90 89 15 Official creditors 17 7 5 8 6 1 Multilateral 13 8 6 3 8 6 of which: World Bank 6 2 2 -1 2 2 Bilateral 3 -1 0 6 -2 -6 Private creditors 47 72 74 82 83 14 Bondholders 42 27 55 70 43 16 Banks and others 5 45 19 12 39 -2 Short-term -3 8 -30 13 43 13Net equity inflows Foreign direct investment 61 105 104 130 121 138 Portfolio equity 41 14 21 20 -2 -4
Debt ratiosExternal debt stocks to exports (%) 124 173 178 166 162 164External debt stocks to GNI (%) 24 35 37 34 38 39Debt service to exports (%) 19 24 28 24 22 27Short-term to external debt stocks (%) 14 16 14 14 15 16Multilateral to external debt stocks (%) 12 9 9 9 9 9Reserves to external debt stocks (%) 56 43 43 43 41 39Gross national income (GNI) 3,779 4,800 4,652 5,193 4,964 4,880

29
MIDDLE EAST AND NORTH AFRICA(US$ billion, unless otherwise indicated)
2009 2015 2016 2017 2018 2019Summary external debt data by debtor typeTotal external debt stocks 183 240 267 301 323 340 Use of IMF credit 8 11 13 17 18 22 Long-term external debt 142 188 202 231 256 267 Public and publicly guaranteed sector 114 146 158 182 200 215 Public sector 113 145 157 182 199 215 of which: General government 89 110 117 135 148 162 Private sector guaranteed by public sector 1 0 0 0 0 0 Private sector not guaranteed 28 42 44 48 57 52 Short-term external debt 33 41 52 53 49 52
Disbursements (long-term) 21 39 40 44 49 37 Public and publicly guaranteed sector 12 27 28 31 32 29 Public sector 12 27 28 31 32 29 of which: General government 10 20 18 23 22 24 Private sector guaranteed by public sector 0 0 0 0 0 0 Private sector not guaranteed 9 13 12 13 17 8
Principal repayments (long-term) 19 20 24 23 22 25 Public and publicly guaranteed sector 11 11 15 13 12 13 Public sector 11 11 15 13 12 13 of which: General government 7 8 10 9 7 9 Private sector guaranteed by public sector 0 0 0 0 0 0 Private sector not guaranteed 8 10 10 10 11 12
Interest payments (long-term) 6 6 7 8 9 11 Public and publicly guaranteed sector 4 4 5 5 7 8 Public sector 4 4 5 5 7 8 of which: General government 3 3 4 4 5 6 Private sector guaranteed by public sector 0 0 0 0 0 0 Private sector not guaranteed 1 2 2 2 3 3
Summary external debt stock by creditor typeLong-term external debt stocks 142 188 202 231 256 267 Public and publicly guaranteed debt from: 114 146 158 182 200 215 Official creditors 78 91 103 115 117 121 Multilateral 35 44 49 57 58 62 of which: World Bank 12 16 18 22 24 26 Bilateral 43 47 53 57 58 59 Private creditors 35 55 55 68 83 94 Bondholders 24 46 47 59 70 78 Commercial banks and others 11 9 8 8 13 16 Private nonguaranteed debt from: 28 42 44 48 57 52 Bondholders 1 1 1 0 1 1 Commercial banks and others 28 42 44 48 56 51Use of IMF credit 8 11 13 17 18 22
Net financial inflowsNet debt inflows Use of IMF credit 0 1 3 3 2 4 Long-term 2 19 15 21 27 12 Official creditors 3 8 13 7 4 5 Multilateral 3 3 7 5 2 4 of which: World Bank 1 2 2 2 2 3 Bilateral -1 5 6 2 2 1 Private creditors 0 11 2 14 23 7 Bondholders 0 7 1 11 11 9 Banks and others -1 5 1 3 12 -2 Short-term 3 1 11 1 -5 3Net equity inflows Foreign direct investment 27 16 19 21 19 17 Portfolio equity 1 -1 1 -1 0 1
Debt ratiosExternal debt stocks to exports (%) 58 82 97 101 98 117External debt stocks to GNI (%) 18 20 22 26 27 27Debt service to exports (%) 8 9 12 11 10 13Short-term to external debt stocks (%) 18 17 19 18 15 15Multilateral to external debt stocks (%) 19 18 18 19 18 18Reserves to external debt stocks (%) 153 101 84 .. .. ..Gross national income (GNI) 1,012 1,204 1,232 1,170 1,188 1,239

30
SOUTH ASIA(US$ billion, unless otherwise indicated)
2009 2015 2016 2017 2018 2019Summary external debt data by debtor typeTotal external debt stocks 366 635 624 707 733 789 Use of IMF credit 19 15 16 17 16 17 Long-term external debt 293 517 501 564 586 636 Public and publicly guaranteed sector 170 271 270 318 330 354 Public sector 170 271 270 318 330 353 of which: General government 151 222 224 273 279 297 Private sector guaranteed by public sector 0 0 0 0 0 0 Private sector not guaranteed 123 245 231 246 256 282 Short-term external debt 54 103 107 126 130 136
Disbursements (long-term) 36 80 59 104 84 103 Public and publicly guaranteed sector 18 35 26 61 43 50 Public sector 18 35 26 61 43 50 of which: General government 14 24 20 54 29 35 Private sector guaranteed by public sector 0 0 0 0 0 0 Private sector not guaranteed 18 45 33 43 41 53
Principal repayments (long-term) 15 45 72 48 58 52 Public and publicly guaranteed sector 9 17 25 20 29 26 Public sector 9 17 25 20 29 26 of which: General government 6 8 16 11 21 17 Private sector guaranteed by public sector 0 0 0 0 0 0 Private sector not guaranteed 7 28 47 28 29 27
Interest payments (long-term) 6 12 12 13 18 18 Public and publicly guaranteed sector 3 4 4 5 6 7 Public sector 3 4 4 5 6 7 of which: General government 2 2 3 4 5 5 Private sector guaranteed by public sector 0 0 0 0 0 0 Private sector not guaranteed 4 8 8 9 12 10
Summary external debt stock by creditor typeLong-term external debt stocks 293 517 501 564 586 636 Public and publicly guaranteed debt from: 170 271 270 318 330 354 Official creditors 146 164 171 188 203 219 Multilateral 95 107 109 118 121 129 of which: World Bank 62 67 68 72 72 75 Bilateral 51 57 61 70 82 90 Private creditors 24 107 100 130 126 135 Bondholders 13 73 69 101 94 102 Commercial banks and others 11 34 31 29 33 33 Private nonguaranteed debt from: 123 245 231 246 256 282 Bondholders 16 8 10 15 14 19 Commercial banks and others 107 237 220 231 242 263Use of IMF credit 19 15 16 17 16 17
Net financial inflowsNet debt inflows Use of IMF credit 4 1 1 0 0 1 Long-term 20 35 -13 56 26 51 Official creditors 7 6 8 11 17 16 Multilateral 6 4 4 4 5 8 of which: World Bank 2 2 2 1 2 3 Bilateral 2 2 4 6 12 8 Private creditors 13 29 -22 45 9 35 Bondholders 2 13 -2 36 -7 14 Banks and others 11 17 -20 9 16 21 Short-term 4 0 4 19 4 5Net equity inflows Foreign direct investment 37 45 48 42 43 48 Portfolio equity 24 2 2 6 -5 14
Debt ratiosExternal debt stocks to exports (%) 111 119 116 117 110 117External debt stocks to GNI (%) 22 24 21 21 21 22Debt service to exports (%) 7 11 16 11 12 11Short-term to external debt stocks (%) 15 16 17 18 18 17Multilateral to external debt stocks (%) 26 17 18 17 17 16Reserves to external debt stocks (%) 82 63 66 66 60 64Gross national income (GNI) 1,687 2,700 2,905 3,343 3,444 3,597

31
SUB-SAHARAN AFRICA(US$ billion, unless otherwise indicated)
2009 2015 2016 2017 2018 2019Summary external debt data by debtor typeTotal external debt stocks 266 439 474 543 571 625 Use of IMF credit 20 19 19 20 21 23 Long-term external debt 203 359 399 458 484 535 Public and publicly guaranteed sector 149 251 283 336 355 392 Public sector 148 251 283 336 354 392 of which: General government 134 221 248 299 317 356 Private sector guaranteed by public sector 1 0 0 0 0 0 Private sector not guaranteed 54 108 116 122 129 143 Short-term external debt 43 60 57 65 66 68
Disbursements (long-term) 25 55 61 77 79 79 Public and publicly guaranteed sector 18 33 45 55 52 57 Public sector 18 33 45 55 52 57 of which: General government 14 28 34 49 46 54 Private sector guaranteed by public sector 0 0 0 0 0 0 Private sector not guaranteed 7 22 16 22 27 22
Principal repayments (long-term) 11 29 27 30 44 38 Public and publicly guaranteed sector 8 22 14 15 26 20 Public sector 8 22 14 15 26 20 of which: General government 4 18 9 10 22 16 Private sector guaranteed by public sector 0 0 0 0 0 0 Private sector not guaranteed 2 7 13 15 18 18
Interest payments (long-term) 4 11 12 12 16 17 Public and publicly guaranteed sector 3 7 8 8 11 13 Public sector 3 7 8 8 11 13 of which: General government 3 6 7 7 10 11 Private sector guaranteed by public sector 0 0 0 0 0 0 Private sector not guaranteed 1 4 4 4 4 4
Summary external debt stock by creditor typeLong-term external debt stocks 203 359 399 458 484 535 Public and publicly guaranteed debt from: 149 251 283 336 355 392 Official creditors 106 152 172 199 209 224 Multilateral 55 81 87 104 110 124 of which: World Bank 32 48 52 61 65 74 Bilateral 51 71 85 95 99 101 Private creditors 43 99 111 136 145 168 Bondholders 21 52 64 87 93 109 Commercial banks and others 23 46 47 50 52 59 Private nonguaranteed debt from: 54 108 116 122 129 143 Bondholders 8 16 16 17 17 18 Commercial banks and others 46 93 99 105 112 124Use of IMF credit 20 19 19 20 21 23
Net financial inflowsNet debt inflows Use of IMF credit 2 0 0 1 2 1 Long-term 14 26 34 47 35 41 Official creditors 8 16 23 21 15 18 Multilateral 5 9 8 12 10 14 of which: World Bank 3 6 5 6 6 9 Bilateral 3 7 15 9 5 5 Private creditors 6 11 11 26 20 23 Bondholders 2 -4 7 18 9 14 Banks and others 4 14 4 8 11 9 Short-term -4 3 -4 8 -2 1Net equity inflows Foreign direct investment 24 23 22 19 19 23 Portfolio equity 11 8 2 10 4 -6
Debt ratiosExternal debt stocks to exports (%) 88 128 148 147 137 153External debt stocks to GNI (%) 25 28 33 35 36 38Debt service to exports (%) 5 12 13 12 15 14Short-term to external debt stocks (%) 16 14 12 12 12 11Multilateral to external debt stocks (%) 21 19 18 19 19 20Reserves to external debt stocks (%) 58 36 30 29 28 ..Gross national income (GNI) 1,073 1,576 1,455 1,540 1,601 1,652

32
AFGHANISTAN(US$ million, unless otherwise indicated)
2009 2015 2016 2017 2018 2019Summary external debt data by debtor typeTotal external debt stocks 2,480 2,597 2,596 2,752 2,679 2,662 Use of IMF credit 353 300 277 285 275 277 Long-term external debt 2,106 2,009 1,965 1,998 1,970 1,965 Public and publicly guaranteed sector 2,106 1,990 1,950 1,982 1,949 1,944 Public sector 2,106 1,990 1,950 1,982 1,949 1,944 of which: General government 2,106 1,990 1,950 1,982 1,949 1,944 Private sector guaranteed by public sector .. .. .. .. .. .. Private sector not guaranteed .. 19 15 16 22 21 Short-term external debt 21 288 355 470 434 420
Disbursements (long-term) 109 26 12 3 16 29 Public and publicly guaranteed sector 109 26 12 3 16 29 Public sector 109 26 12 3 16 29 of which: General government 109 26 12 3 16 29 Private sector guaranteed by public sector .. .. .. .. .. .. Private sector not guaranteed .. .. .. .. .. ..
Principal repayments (long-term) 3 24 27 27 31 31 Public and publicly guaranteed sector 3 19 23 23 25 25 Public sector 3 19 23 23 25 25 of which: General government 3 19 23 23 25 25 Private sector guaranteed by public sector .. .. .. .. .. .. Private sector not guaranteed .. 5 4 4 6 6
Interest payments (long-term) 7 10 8 9 9 9 Public and publicly guaranteed sector 7 9 8 8 8 7 Public sector 7 9 8 8 8 7 of which: General government 7 9 8 8 8 7 Private sector guaranteed by public sector .. .. .. .. .. .. Private sector not guaranteed .. 1 1 1 1 1
Summary external debt stock by creditor typeLong-term external debt stocks 2,106 2,009 1,965 1,998 1,970 1,965 Public and publicly guaranteed debt from: 2,106 1,990 1,950 1,982 1,949 1,944 Official creditors 2,106 1,990 1,950 1,982 1,949 1,944 Multilateral 1,017 1,030 991 1,023 983 955 of which: World Bank 466 370 351 364 348 338 Bilateral 1,089 960 958 959 965 989 Private creditors 0 .. .. .. .. .. Bondholders .. .. .. .. .. .. Commercial banks and others 0 .. .. .. .. .. Private nonguaranteed debt from: .. 19 15 16 22 21 Bondholders .. .. .. .. .. .. Commercial banks and others .. 19 15 16 22 21Use of IMF credit 353 300 277 285 275 277
Net financial inflowsNet debt inflows Use of IMF credit 17 -20 -15 -8 -4 4 Long-term 106 2 -15 -24 -14 -2 Official creditors 106 7 -11 -19 -8 3 Multilateral 108 -8 -9 -19 -15 -20 of which: World Bank 27 -8 -8 -8 -8 -8 Bilateral -2 16 -2 0 7 23 Private creditors .. -5 -4 -4 -6 -6 Bondholders .. .. .. .. .. .. Banks and others .. -5 -4 -4 -6 -6 Short-term .. 88 26 80 -68 -44Net equity inflows Foreign direct investment 56 169 94 52 119 23 Portfolio equity 0 0 0 0 0 0
Debt ratiosExternal debt stocks to exports (%) 113 152 189 189 141 143External debt stocks to GNI (%) 20 13 13 13 14 14Debt service to exports (%) 0 3 4 4 3 3Short-term to external debt stocks (%) 1 11 14 17 16 16Multilateral to external debt stocks (%) 41 40 38 37 37 36Reserves to external debt stocks (%) 141 240 249 261 273 279Gross national income (GNI) 12,404 20,087 19,542 20,440 19,675 19,402

33
ALBANIA(US$ million, unless otherwise indicated)
2009 2015 2016 2017 2018 2019Summary external debt data by debtor typeTotal external debt stocks 4,605 8,447 8,516 9,801 9,868 9,626 Use of IMF credit 144 244 387 489 470 448 Long-term external debt 3,780 6,617 6,482 7,421 7,494 7,367 Public and publicly guaranteed sector 2,874 3,844 3,761 4,335 4,559 4,442 Public sector 2,874 3,844 3,761 4,335 4,559 4,442 of which: General government 2,487 3,550 3,489 4,051 4,246 4,160 Private sector guaranteed by public sector .. .. .. .. .. .. Private sector not guaranteed 906 2,773 2,722 3,085 2,935 2,924 Short-term external debt 681 1,586 1,647 1,892 1,904 1,812
Disbursements (long-term) 725 1,322 450 776 1,269 457 Public and publicly guaranteed sector 558 957 205 421 931 207 Public sector 558 957 205 421 931 207 of which: General government 496 953 189 420 792 202 Private sector guaranteed by public sector .. .. .. .. .. .. Private sector not guaranteed 167 365 245 355 338 250
Principal repayments (long-term) 122 1,073 488 407 922 498 Public and publicly guaranteed sector 80 500 191 222 554 263 Public sector 80 500 191 222 554 263 of which: General government 57 479 161 198 456 234 Private sector guaranteed by public sector .. .. .. .. .. .. Private sector not guaranteed 43 573 297 185 368 234
Interest payments (long-term) 96 98 95 96 147 122 Public and publicly guaranteed sector 71 90 84 83 120 105 Public sector 71 90 84 83 120 105 of which: General government 60 86 82 80 114 102 Private sector guaranteed by public sector .. .. .. .. .. .. Private sector not guaranteed 24 9 11 12 28 17
Summary external debt stock by creditor typeLong-term external debt stocks 3,780 6,617 6,482 7,421 7,494 7,367 Public and publicly guaranteed debt from: 2,874 3,844 3,761 4,335 4,559 4,442 Official creditors 2,134 2,586 2,532 2,984 3,037 3,004 Multilateral 1,467 1,946 1,890 2,279 2,362 2,338 of which: World Bank 874 1,020 991 1,300 1,301 1,330 Bilateral 666 641 642 705 675 666 Private creditors 740 1,258 1,229 1,351 1,522 1,438 Bondholders 82 631 611 696 942 925 Commercial banks and others 658 626 617 656 580 514 Private nonguaranteed debt from: 906 2,773 2,722 3,085 2,935 2,924 Bondholders 23 133 148 192 329 306 Commercial banks and others 884 2,640 2,573 2,894 2,606 2,618Use of IMF credit 144 244 387 489 470 448
Net financial inflowsNet debt inflows Use of IMF credit -10 100 156 77 -7 -20 Long-term 603 249 -38 369 347 -40 Official creditors 177 13 3 243 137 -1 Multilateral 151 -19 -11 240 148 1 of which: World Bank 32 -3 2 226 40 44 Bilateral 26 33 14 3 -11 -2 Private creditors 426 236 -40 126 210 -39 Bondholders -1 56 15 43 340 -20 Banks and others 426 180 -56 83 -130 -19 Short-term -469 -162 61 245 12 -92Net equity inflows Foreign direct investment 1,040 877 1,048 1,073 1,271 1,245 Portfolio equity -4 9 -15 -12 -3 7
Debt ratiosExternal debt stocks to exports (%) 134 240 219 213 188 182External debt stocks to GNI (%) 39 73 71 75 65 64Debt service to exports (%) 7 34 15 11 21 12Short-term to external debt stocks (%) 15 19 19 19 19 19Multilateral to external debt stocks (%) 32 23 22 23 24 24Reserves to external debt stocks (%) 50 37 36 36 39 38Gross national income (GNI) 11,852 11,521 12,054 13,054 15,130 15,122
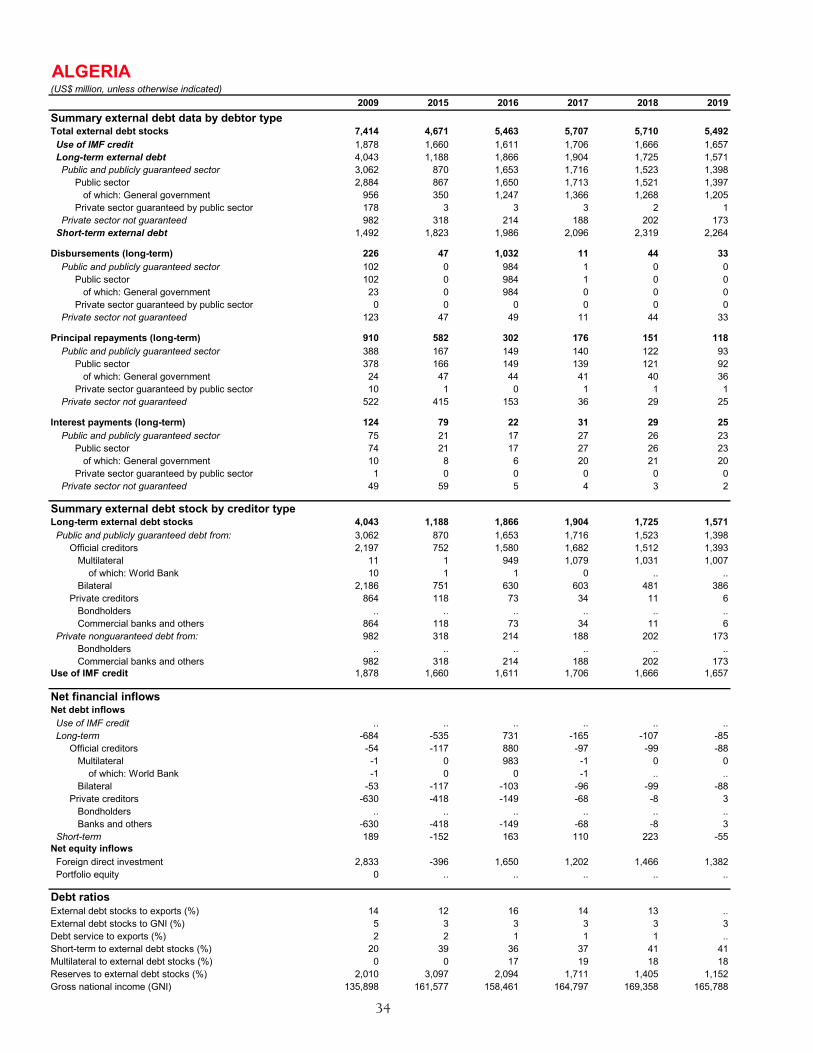
34
ALGERIA(US$ million, unless otherwise indicated)
2009 2015 2016 2017 2018 2019Summary external debt data by debtor typeTotal external debt stocks 7,414 4,671 5,463 5,707 5,710 5,492 Use of IMF credit 1,878 1,660 1,611 1,706 1,666 1,657 Long-term external debt 4,043 1,188 1,866 1,904 1,725 1,571 Public and publicly guaranteed sector 3,062 870 1,653 1,716 1,523 1,398 Public sector 2,884 867 1,650 1,713 1,521 1,397 of which: General government 956 350 1,247 1,366 1,268 1,205 Private sector guaranteed by public sector 178 3 3 3 2 1 Private sector not guaranteed 982 318 214 188 202 173 Short-term external debt 1,492 1,823 1,986 2,096 2,319 2,264
Disbursements (long-term) 226 47 1,032 11 44 33 Public and publicly guaranteed sector 102 0 984 1 0 0 Public sector 102 0 984 1 0 0 of which: General government 23 0 984 0 0 0 Private sector guaranteed by public sector 0 0 0 0 0 0 Private sector not guaranteed 123 47 49 11 44 33
Principal repayments (long-term) 910 582 302 176 151 118 Public and publicly guaranteed sector 388 167 149 140 122 93 Public sector 378 166 149 139 121 92 of which: General government 24 47 44 41 40 36 Private sector guaranteed by public sector 10 1 0 1 1 1 Private sector not guaranteed 522 415 153 36 29 25
Interest payments (long-term) 124 79 22 31 29 25 Public and publicly guaranteed sector 75 21 17 27 26 23 Public sector 74 21 17 27 26 23 of which: General government 10 8 6 20 21 20 Private sector guaranteed by public sector 1 0 0 0 0 0 Private sector not guaranteed 49 59 5 4 3 2
Summary external debt stock by creditor typeLong-term external debt stocks 4,043 1,188 1,866 1,904 1,725 1,571 Public and publicly guaranteed debt from: 3,062 870 1,653 1,716 1,523 1,398 Official creditors 2,197 752 1,580 1,682 1,512 1,393 Multilateral 11 1 949 1,079 1,031 1,007 of which: World Bank 10 1 1 0 .. .. Bilateral 2,186 751 630 603 481 386 Private creditors 864 118 73 34 11 6 Bondholders .. .. .. .. .. .. Commercial banks and others 864 118 73 34 11 6 Private nonguaranteed debt from: 982 318 214 188 202 173 Bondholders .. .. .. .. .. .. Commercial banks and others 982 318 214 188 202 173Use of IMF credit 1,878 1,660 1,611 1,706 1,666 1,657
Net financial inflowsNet debt inflows Use of IMF credit .. .. .. .. .. .. Long-term -684 -535 731 -165 -107 -85 Official creditors -54 -117 880 -97 -99 -88 Multilateral -1 0 983 -1 0 0 of which: World Bank -1 0 0 -1 .. .. Bilateral -53 -117 -103 -96 -99 -88 Private creditors -630 -418 -149 -68 -8 3 Bondholders .. .. .. .. .. .. Banks and others -630 -418 -149 -68 -8 3 Short-term 189 -152 163 110 223 -55Net equity inflows Foreign direct investment 2,833 -396 1,650 1,202 1,466 1,382 Portfolio equity 0 .. .. .. .. ..
Debt ratiosExternal debt stocks to exports (%) 14 12 16 14 13 ..External debt stocks to GNI (%) 5 3 3 3 3 3Debt service to exports (%) 2 2 1 1 1 ..Short-term to external debt stocks (%) 20 39 36 37 41 41Multilateral to external debt stocks (%) 0 0 17 19 18 18Reserves to external debt stocks (%) 2,010 3,097 2,094 1,711 1,405 1,152Gross national income (GNI) 135,898 161,577 158,461 164,797 169,358 165,788

35
ANGOLA(US$ million, unless otherwise indicated)
2009 2015 2016 2017 2018 2019Summary external debt data by debtor typeTotal external debt stocks 20,168 56,269 56,815 50,910 51,912 52,460 Use of IMF credit 787 532 396 389 1,374 1,861 Long-term external debt 16,789 47,571 52,040 46,827 48,227 47,776 Public and publicly guaranteed sector 13,630 27,301 34,463 33,892 35,557 35,031 Public sector 13,630 27,301 34,463 33,892 35,557 35,031 of which: General government 6,986 14,855 18,412 20,353 22,633 23,368 Private sector guaranteed by public sector 0 .. .. .. .. .. Private sector not guaranteed 3,158 20,270 17,577 12,934 12,669 12,745 Short-term external debt 2,593 8,166 4,379 3,694 2,311 2,822
Disbursements (long-term) 6,701 5,380 13,189 4,985 7,722 7,236 Public and publicly guaranteed sector 3,543 3,592 13,189 4,985 6,693 5,365 Public sector 3,543 3,592 13,189 4,985 6,693 5,365 of which: General government 1,726 3,592 5,189 3,725 4,893 4,365 Private sector guaranteed by public sector 0 .. .. .. .. .. Private sector not guaranteed 3,158 1,788 .. .. 1,028 1,871
Principal repayments (long-term) 3,531 6,017 8,015 9,249 6,257 7,184 Public and publicly guaranteed sector 3,131 3,964 5,988 5,733 4,964 5,865 Public sector 3,130 3,964 5,988 5,733 4,964 5,865 of which: General government 802 1,176 1,594 1,954 2,551 3,604 Private sector guaranteed by public sector 1 .. .. .. .. .. Private sector not guaranteed 400 2,054 2,027 3,515 1,293 1,319
Interest payments (long-term) 459 1,379 1,775 1,071 2,280 2,308 Public and publicly guaranteed sector 392 1,078 1,413 751 1,838 1,885 Public sector 392 1,078 1,413 751 1,838 1,885 of which: General government 206 563 991 380 1,103 1,205 Private sector guaranteed by public sector 0 .. .. .. .. .. Private sector not guaranteed 67 301 362 320 442 423
Summary external debt stock by creditor typeLong-term external debt stocks 16,789 47,571 52,040 46,827 48,227 47,776 Public and publicly guaranteed debt from: 13,630 27,301 34,463 33,892 35,557 35,031 Official creditors 4,661 11,909 21,333 22,567 21,451 19,388 Multilateral 448 1,602 2,018 2,239 2,268 2,847 of which: World Bank 385 929 940 1,025 1,042 1,636 Bilateral 4,213 10,307 19,314 20,328 19,183 16,541 Private creditors 8,969 15,392 13,131 11,325 14,106 15,643 Bondholders .. 2,500 2,500 2,500 6,000 8,000 Commercial banks and others 8,969 12,892 10,631 8,825 8,106 7,643 Private nonguaranteed debt from: 3,158 20,270 17,577 12,934 12,669 12,745 Bondholders .. .. .. .. .. .. Commercial banks and others 3,158 20,270 17,577 12,934 12,669 12,745Use of IMF credit 787 532 396 389 1,374 1,861
Net financial inflowsNet debt inflows Use of IMF credit 353 -345 -124 -30 1,012 495 Long-term 3,170 -637 5,174 -4,264 1,465 51 Official creditors 788 -439 9,431 1,187 -1,104 -2,059 Multilateral 15 479 432 184 44 585 of which: World Bank 13 472 26 55 31 600 Bilateral 772 -918 8,999 1,002 -1,148 -2,645 Private creditors 2,383 -197 -4,256 -5,451 2,569 2,110 Bondholders .. 1,500 0 .. 3,500 2,000 Banks and others 2,383 -1,697 -4,256 -5,451 -931 110 Short-term 187 514 -3,785 -660 -1,362 513Net equity inflows Foreign direct investment 2,743 4,974 -122 -7,293 -7,104 -4,739 Portfolio equity .. 0 0 0 0 0
Debt ratiosExternal debt stocks to exports (%) 49 163 198 142 124 146External debt stocks to GNI (%) 32 51 59 44 56 60Debt service to exports (%) 10 23 35 29 21 27Short-term to external debt stocks (%) 13 15 8 7 4 5Multilateral to external debt stocks (%) 2 3 4 4 4 5Reserves to external debt stocks (%) 68 42 42 34 30 31Gross national income (GNI) 63,484 110,286 95,850 114,618 93,524 87,199

36
ARGENTINA(US$ million, unless otherwise indicated)
2009 2015 2016 2017 2018 2019Summary external debt data by debtor typeTotal external debt stocks 133,695 177,185 189,332 236,963 283,624 279,306 Use of IMF credit 3,167 2,799 2,716 2,877 30,923 46,924 Long-term external debt 111,243 114,951 145,599 178,626 185,119 165,120 Public and publicly guaranteed sector 75,797 72,821 105,908 127,552 134,909 116,662 Public sector 75,664 72,821 105,908 127,552 134,909 116,640 of which: General government 72,687 71,911 105,193 126,958 134,476 116,134 Private sector guaranteed by public sector 133 0 0 0 0 22 Private sector not guaranteed 35,446 42,130 39,691 51,074 50,210 48,458 Short-term external debt 19,286 59,434 41,017 55,461 67,583 67,262
Disbursements (long-term) 7,547 16,520 54,737 58,921 58,211 17,839 Public and publicly guaranteed sector 3,602 8,599 40,188 41,047 48,369 10,927 Public sector 3,602 8,599 40,188 41,047 48,369 10,905 of which: General government 3,165 8,272 40,090 41,047 48,369 10,719 Private sector guaranteed by public sector .. 0 .. .. .. 22 Private sector not guaranteed 3,946 7,920 14,549 17,873 9,842 6,913
Principal repayments (long-term) 11,306 10,821 11,677 24,169 20,855 27,428 Public and publicly guaranteed sector 5,592 6,365 5,363 17,821 15,787 22,611 Public sector 5,565 6,364 5,363 17,821 15,787 22,611 of which: General government 5,342 5,977 5,106 17,723 15,698 22,524 Private sector guaranteed by public sector 27 1 .. .. .. .. Private sector not guaranteed 5,714 4,455 6,313 6,348 5,069 4,817
Interest payments (long-term) 3,366 6,076 13,404 14,814 12,285 9,907 Public and publicly guaranteed sector 2,031 5,146 12,304 12,427 10,989 9,060 Public sector 2,030 5,146 12,304 12,427 10,989 9,060 of which: General government 1,906 5,110 12,270 12,394 10,959 9,032 Private sector guaranteed by public sector 1 0 .. .. .. .. Private sector not guaranteed 1,335 931 1,100 2,387 1,296 847
Summary external debt stock by creditor typeLong-term external debt stocks 111,243 114,951 145,599 178,626 185,119 165,120 Public and publicly guaranteed debt from: 75,797 72,821 105,908 127,552 134,909 116,662 Official creditors 22,295 27,156 26,697 28,236 29,040 29,101 Multilateral 16,267 19,778 20,237 21,342 23,005 23,873 of which: World Bank 5,305 5,852 6,048 6,327 6,879 7,128 Bilateral 6,028 7,379 6,460 6,894 6,034 5,228 Private creditors 53,502 45,664 79,212 99,316 105,869 87,561 Bondholders 51,276 42,709 76,838 97,400 104,593 86,588 Commercial banks and others 2,226 2,955 2,374 1,916 1,276 972 Private nonguaranteed debt from: 35,446 42,130 39,691 51,074 50,210 48,458 Bondholders 6,850 8,516 11,703 16,405 15,508 15,271 Commercial banks and others 28,595 33,614 27,988 34,669 34,702 33,187Use of IMF credit 3,167 2,799 2,716 2,877 30,923 46,924
Net financial inflowsNet debt inflows Use of IMF credit .. .. .. .. 28,623 16,166 Long-term -3,759 5,699 43,061 34,752 37,356 -9,588 Official creditors 1,703 702 -465 1,358 892 88 Multilateral 1,420 -78 462 1,066 1,669 874 of which: World Bank 236 -142 198 239 557 249 Bilateral 283 780 -927 292 -778 -785 Private creditors -5,462 4,997 43,526 33,394 36,464 -9,676 Bondholders -1,185 3,123 39,003 27,275 31,366 -11,021 Banks and others -4,276 1,873 4,523 6,120 5,098 1,345 Short-term -904 25,341 -18,073 17,471 12,149 -986Net equity inflows Foreign direct investment 5,027 9,377 7,992 9,095 10,449 6,496 Portfolio equity -212 239 985 3,013 -508 65
Debt ratiosExternal debt stocks to exports (%) 191 245 255 303 340 326External debt stocks to GNI (%) 41 30 35 38 57 65Debt service to exports (%) 21 25 35 51 41 47Short-term to external debt stocks (%) 14 34 22 23 24 24Multilateral to external debt stocks (%) 12 11 11 9 8 9Reserves to external debt stocks (%) 34 13 19 22 23 15Gross national income (GNI) 322,658 582,645 545,339 626,315 501,244 432,302

37
ARMENIA(US$ million, unless otherwise indicated)
2009 2015 2016 2017 2018 2019Summary external debt data by debtor typeTotal external debt stocks 4,935 8,831 9,856 10,228 10,726 11,887 Use of IMF credit 725 536 528 530 451 375 Long-term external debt 3,681 7,631 8,256 8,810 9,141 9,918 Public and publicly guaranteed sector 2,379 3,998 4,472 5,228 5,371 5,655 Public sector 2,379 3,998 4,472 5,228 5,371 5,655 of which: General government 2,361 3,899 4,351 5,015 5,151 5,441 Private sector guaranteed by public sector .. .. .. .. .. .. Private sector not guaranteed 1,302 3,633 3,784 3,583 3,770 4,262 Short-term external debt 529 664 1,072 889 1,134 1,595
Disbursements (long-term) 1,247 1,967 1,855 1,501 1,678 2,380 Public and publicly guaranteed sector 941 984 603 677 347 870 Public sector 941 984 603 677 347 870 of which: General government 934 911 575 588 321 856 Private sector guaranteed by public sector .. .. .. .. .. .. Private sector not guaranteed 306 984 1,252 824 1,331 1,510
Principal repayments (long-term) 300 1,308 1,173 1,117 1,282 1,586 Public and publicly guaranteed sector 21 260 73 91 138 568 Public sector 21 260 73 91 138 568 of which: General government 21 257 69 85 125 550 Private sector guaranteed by public sector .. .. .. .. .. .. Private sector not guaranteed 279 1,048 1,101 1,026 1,144 1,018
Interest payments (long-term) 79 199 224 238 269 362 Public and publicly guaranteed sector 23 100 123 140 162 189 Public sector 23 100 123 140 162 189 of which: General government 23 99 120 136 156 183 Private sector guaranteed by public sector .. .. .. .. .. .. Private sector not guaranteed 56 99 101 98 107 174
Summary external debt stock by creditor typeLong-term external debt stocks 3,681 7,631 8,256 8,810 9,141 9,918 Public and publicly guaranteed debt from: 2,379 3,998 4,472 5,228 5,371 5,655 Official creditors 2,375 2,955 3,423 4,163 4,310 4,499 Multilateral 1,427 2,466 2,824 3,237 3,278 3,352 of which: World Bank 1,214 1,652 1,742 1,810 1,798 1,824 Bilateral 948 489 599 927 1,032 1,147 Private creditors 4 1,043 1,049 1,064 1,061 1,156 Bondholders .. 1,000 1,000 1,000 1,000 1,098 Commercial banks and others 4 43 49 64 61 59 Private nonguaranteed debt from: 1,302 3,633 3,784 3,583 3,770 4,262 Bondholders .. .. .. .. .. .. Commercial banks and others 1,302 3,633 3,784 3,583 3,770 4,262Use of IMF credit 725 536 528 530 451 375
Net financial inflowsNet debt inflows Use of IMF credit 442 -9 8 -29 -68 -73 Long-term 947 660 681 384 396 795 Official creditors 920 403 522 578 208 207 Multilateral 309 385 410 301 87 86 of which: World Bank 177 92 123 5 14 31 Bilateral 611 18 113 277 122 120 Private creditors 28 257 159 -193 188 588 Bondholders .. 300 0 0 0 98 Banks and others 28 -43 159 -193 188 490 Short-term 8 -245 408 -183 245 461Net equity inflows Foreign direct investment 718 154 219 70 302 161 Portfolio equity 1 4 4 -3 0 -5
Debt ratiosExternal debt stocks to exports (%) 203 220 223 188 184 181External debt stocks to GNI (%) 55 80 91 86 85 86Debt service to exports (%) 17 38 33 26 29 32Short-term to external debt stocks (%) 11 8 11 9 11 13Multilateral to external debt stocks (%) 29 28 29 32 31 28Reserves to external debt stocks (%) 41 20 22 23 21 24Gross national income (GNI) 9,007 10,982 10,791 11,935 12,619 13,901

38
AZERBAIJAN(US$ million, unless otherwise indicated)
2009 2015 2016 2017 2018 2019Summary external debt data by debtor typeTotal external debt stocks 4,549 13,319 14,590 15,301 16,211 15,840 Use of IMF credit 303 213 206 219 214 212 Long-term external debt 3,651 11,558 12,988 14,407 15,428 15,011 Public and publicly guaranteed sector 3,337 8,712 10,624 12,470 13,956 13,976 Public sector 3,337 8,712 10,624 12,470 13,956 13,976 of which: General government 1,958 6,675 7,339 8,052 7,540 7,776 Private sector guaranteed by public sector .. .. .. .. .. .. Private sector not guaranteed 314 2,847 2,363 1,937 1,471 1,035 Short-term external debt 595 1,548 1,396 675 570 617
Disbursements (long-term) 857 3,499 2,813 2,886 3,269 1,270 Public and publicly guaranteed sector 807 1,087 2,702 2,822 3,250 1,266 Public sector 807 1,087 2,702 2,822 3,250 1,266 of which: General government 372 737 1,178 1,104 902 767 Private sector guaranteed by public sector .. .. .. .. .. .. Private sector not guaranteed 50 2,412 111 64 19 4
Principal repayments (long-term) 265 1,584 1,329 1,771 2,122 1,647 Public and publicly guaranteed sector 213 583 735 1,262 1,639 1,201 Public sector 213 583 735 1,262 1,639 1,201 of which: General government 99 387 488 510 1,384 523 Private sector guaranteed by public sector .. .. .. .. .. .. Private sector not guaranteed 53 1,001 594 509 483 447
Interest payments (long-term) 67 294 403 443 538 496 Public and publicly guaranteed sector 55 208 259 326 446 429 Public sector 55 208 259 326 446 429 of which: General government 28 149 165 201 252 257 Private sector guaranteed by public sector .. .. .. .. .. .. Private sector not guaranteed 12 86 144 117 91 66
Summary external debt stock by creditor typeLong-term external debt stocks 3,651 11,558 12,988 14,407 15,428 15,011 Public and publicly guaranteed debt from: 3,337 8,712 10,624 12,470 13,956 13,976 Official creditors 2,287 4,796 5,644 6,662 6,885 7,318 Multilateral 1,459 3,722 4,587 5,569 5,789 6,084 of which: World Bank 939 2,096 2,203 2,665 2,538 2,395 Bilateral 829 1,073 1,057 1,093 1,096 1,234 Private creditors 1,050 3,916 4,981 5,809 7,071 6,658 Bondholders .. 2,250 3,250 3,750 3,750 3,750 Commercial banks and others 1,050 1,666 1,731 2,059 3,321 2,908 Private nonguaranteed debt from: 314 2,847 2,363 1,937 1,471 1,035 Bondholders .. .. .. .. .. .. Commercial banks and others 314 2,847 2,363 1,937 1,471 1,035Use of IMF credit 303 213 206 219 214 212
Net financial inflowsNet debt inflows Use of IMF credit -19 -2 .. .. .. .. Long-term 592 1,915 1,483 1,115 1,147 -377 Official creditors 334 339 865 901 246 433 Multilateral 319 385 891 914 245 302 of which: World Bank 158 200 122 435 -116 -140 Bilateral 15 -46 -26 -13 0 130 Private creditors 258 1,575 618 214 901 -810 Bondholders .. .. 1,000 500 .. 0 Banks and others 258 1,575 -382 -286 901 -810 Short-term -541 -473 -152 -721 -105 47Net equity inflows Foreign direct investment 2,525 4,048 4,500 2,867 1,403 1,504 Portfolio equity 0 24 0 0 0 19
Debt ratiosExternal debt stocks to exports (%) 20 63 79 72 60 63External debt stocks to GNI (%) 11 26 41 39 36 34Debt service to exports (%) 2 9 10 11 10 9Short-term to external debt stocks (%) 13 12 10 4 4 4Multilateral to external debt stocks (%) 32 28 31 36 36 38Reserves to external debt stocks (%) 118 47 40 44 41 44Gross national income (GNI) 40,772 51,047 35,395 39,106 44,653 45,987

39
BANGLADESH(US$ million, unless otherwise indicated)
2009 2015 2016 2017 2018 2019Summary external debt data by debtor typeTotal external debt stocks 25,372 35,960 38,474 46,812 52,132 57,088 Use of IMF credit 1,475 1,613 1,546 1,625 1,536 1,414 Long-term external debt 21,964 27,716 29,093 34,422 41,566 45,937 Public and publicly guaranteed sector 21,179 24,370 26,000 31,027 36,328 41,037 Public sector 21,179 24,370 26,000 31,027 36,328 41,037 of which: General government 21,125 23,825 25,441 30,445 35,753 40,441 Private sector guaranteed by public sector .. .. .. .. .. .. Private sector not guaranteed 785 3,346 3,093 3,395 5,238 4,901 Short-term external debt 1,933 6,631 7,835 10,765 9,029 9,737
Disbursements (long-term) 1,931 2,774 3,259 5,521 9,690 9,181 Public and publicly guaranteed sector 1,497 2,236 3,079 4,743 6,994 6,068 Public sector 1,497 2,236 3,079 4,743 6,994 6,068 of which: General government 1,497 2,211 3,048 4,720 6,949 6,005 Private sector guaranteed by public sector .. .. .. .. .. .. Private sector not guaranteed 434 538 180 778 2,696 3,113
Principal repayments (long-term) 770 1,266 1,325 1,468 2,033 4,688 Public and publicly guaranteed sector 699 965 892 993 1,180 1,257 Public sector 699 965 892 993 1,180 1,257 of which: General government 695 965 892 974 1,142 1,220 Private sector guaranteed by public sector .. .. .. .. .. .. Private sector not guaranteed 71 301 433 475 853 3,431
Interest payments (long-term) 208 233 269 418 485 639 Public and publicly guaranteed sector 197 208 228 359 372 487 Public sector 197 208 228 359 372 487 of which: General government 195 198 217 347 360 476 Private sector guaranteed by public sector .. .. .. .. .. .. Private sector not guaranteed 11 25 40 59 113 152
Summary external debt stock by creditor typeLong-term external debt stocks 21,964 27,716 29,093 34,422 41,566 45,937 Public and publicly guaranteed debt from: 21,179 24,370 26,000 31,027 36,328 41,037 Official creditors 21,136 24,338 25,973 30,999 36,305 41,018 Multilateral 18,378 19,987 20,819 23,492 24,944 27,158 of which: World Bank 10,746 11,534 11,890 13,621 14,501 15,788 Bilateral 2,758 4,351 5,155 7,507 11,361 13,860 Private creditors 43 32 27 28 23 19 Bondholders .. .. .. .. .. .. Commercial banks and others 43 32 27 28 23 19 Private nonguaranteed debt from: 785 3,346 3,093 3,395 5,238 4,901 Bondholders .. .. .. .. .. .. Commercial banks and others 785 3,346 3,093 3,395 5,238 4,901Use of IMF credit 1,475 1,613 1,546 1,625 1,536 1,414
Net financial inflowsNet debt inflows Use of IMF credit -23 209 -19 -13 -52 -114 Long-term 1,161 1,508 1,934 4,053 7,656 4,493 Official creditors 809 1,274 2,191 3,753 5,818 4,814 Multilateral 952 1,022 1,390 1,580 1,954 2,350 of which: World Bank 63 599 716 1,020 1,219 1,387 Bilateral -143 252 801 2,174 3,864 2,464 Private creditors 351 234 -257 299 1,839 -321 Bondholders .. .. .. .. .. .. Banks and others 351 234 -257 299 1,839 -321 Short-term 40 2,480 1,204 2,930 -1,736 708Net equity inflows Foreign direct investment 584 2,437 2,127 1,477 1,242 1,371 Portfolio equity -104 -105 114 258 -33 -28
Debt ratiosExternal debt stocks to exports (%) 149 102 102 119 117 127External debt stocks to GNI (%) 23 17 16 18 18 18Debt service to exports (%) 6 5 5 5 6 13Short-term to external debt stocks (%) 8 18 20 23 17 17Multilateral to external debt stocks (%) 72 56 54 50 48 48Reserves to external debt stocks (%) 40 75 83 70 60 56Gross national income (GNI) 110,603 207,743 234,168 260,441 286,536 316,907

40
BELARUS(US$ million, unless otherwise indicated)
2009 2015 2016 2017 2018 2019Summary external debt data by debtor typeTotal external debt stocks 22,079 38,258 37,516 39,584 38,768 40,730 Use of IMF credit 3,449 511 496 525 513 510 Long-term external debt 9,553 26,273 26,398 29,335 28,729 30,026 Public and publicly guaranteed sector 6,242 15,837 18,142 20,988 19,988 19,511 Public sector 6,223 15,800 18,142 20,988 19,988 19,511 of which: General government 4,548 12,444 13,642 16,727 16,894 17,132 Private sector guaranteed by public sector 19 37 0 .. .. .. Private sector not guaranteed 3,311 10,436 8,257 8,346 8,741 10,514 Short-term external debt 9,076 11,474 10,622 9,725 9,526 10,194
Disbursements (long-term) 1,985 3,778 2,615 5,811 3,743 4,106 Public and publicly guaranteed sector 1,265 2,992 2,143 4,349 2,673 1,996 Public sector 1,265 2,992 2,143 4,349 2,673 1,996 of which: General government 1,242 2,173 1,935 4,039 2,367 1,656 Private sector guaranteed by public sector .. 0 0 .. .. .. Private sector not guaranteed 720 786 472 1,462 1,070 2,111
Principal repayments (long-term) 1,283 3,710 5,014 3,030 4,130 2,900 Public and publicly guaranteed sector 458 2,483 2,314 1,680 3,455 2,563 Public sector 458 2,478 2,277 1,680 3,455 2,563 of which: General government 119 1,926 893 1,029 1,998 1,512 Private sector guaranteed by public sector .. 5 37 .. .. .. Private sector not guaranteed 825 1,228 2,701 1,350 675 338
Interest payments (long-term) 186 980 964 1,110 1,288 1,307 Public and publicly guaranteed sector 115 781 745 868 1,022 1,015 Public sector 113 777 743 868 1,022 1,015 of which: General government 100 593 559 688 789 817 Private sector guaranteed by public sector 2 4 2 .. .. .. Private sector not guaranteed 71 199 219 241 265 292
Summary external debt stock by creditor typeLong-term external debt stocks 9,553 26,273 26,398 29,335 28,729 30,026 Public and publicly guaranteed debt from: 6,242 15,837 18,142 20,988 19,988 19,511 Official creditors 4,694 13,005 14,071 15,974 16,495 16,595 Multilateral 261 2,838 3,360 3,942 3,810 3,480 of which: World Bank 256 642 725 822 905 948 Bilateral 4,433 10,167 10,710 12,032 12,685 13,115 Private creditors 1,548 2,832 4,071 5,014 3,493 2,916 Bondholders 19 800 800 2,200 2,000 2,162 Commercial banks and others 1,528 2,032 3,271 2,814 1,493 755 Private nonguaranteed debt from: 3,311 10,436 8,257 8,346 8,741 10,514 Bondholders .. .. .. .. .. .. Commercial banks and others 3,311 10,436 8,257 8,346 8,741 10,514Use of IMF credit 3,449 511 496 525 513 510
Net financial inflowsNet debt inflows Use of IMF credit 2,825 -77 .. .. .. .. Long-term 702 67 -2,400 2,780 -388 1,206 Official creditors 1,155 1,350 914 1,812 727 15 Multilateral 211 -293 526 563 -124 -329 of which: World Bank 213 52 83 98 83 39 Bilateral 943 1,643 387 1,249 851 344 Private creditors -453 -1,283 -3,313 968 -1,115 1,191 Bondholders .. -1,000 0 1,400 -200 154 Banks and others -453 -283 -3,313 -432 -915 1,036 Short-term 1,517 -1,353 -852 -897 -199 667Net equity inflows Foreign direct investment 1,823 1,434 1,086 1,068 1,390 1,093 Portfolio equity 1 5 0 6 4 7
Debt ratiosExternal debt stocks to exports (%) 89 115 123 106 89 95External debt stocks to GNI (%) 44 71 82 75 67 67Debt service to exports (%) 7 15 20 12 13 10Short-term to external debt stocks (%) 41 30 28 25 25 25Multilateral to external debt stocks (%) 1 7 9 10 10 9Reserves to external debt stocks (%) 22 7 9 14 13 17Gross national income (GNI) 50,065 53,957 45,508 52,645 57,886 61,171

41
BELIZE(US$ million, unless otherwise indicated)
2009 2015 2016 2017 2018 2019Summary external debt data by debtor typeTotal external debt stocks 1,291 1,280 1,290 1,339 1,349 1,378 Use of IMF credit 35 25 24 25 25 25 Long-term external debt 1,246 1,248 1,262 1,309 1,320 1,349 Public and publicly guaranteed sector 1,037 1,153 1,177 1,231 1,260 1,286 Public sector 1,037 1,153 1,177 1,231 1,260 1,286 of which: General government 1,012 1,147 1,167 1,215 1,226 1,244 Private sector guaranteed by public sector 0 .. .. .. .. .. Private sector not guaranteed 209 94 85 78 61 63 Short-term external debt 10 7 4 5 4 4
Disbursements (long-term) 79 95 69 107 77 79 Public and publicly guaranteed sector 66 93 67 98 71 70 Public sector 66 93 67 98 71 70 of which: General government 66 89 63 91 53 60 Private sector guaranteed by public sector 0 .. .. .. .. .. Private sector not guaranteed 13 2 2 9 6 9
Principal repayments (long-term) 69 52 54 57 65 50 Public and publicly guaranteed sector 51 40 43 44 42 44 Public sector 51 40 43 44 42 44 of which: General government 44 39 42 44 41 41 Private sector guaranteed by public sector 0 .. .. .. .. .. Private sector not guaranteed 18 12 11 12 22 6
Interest payments (long-term) 56 46 48 48 49 54 Public and publicly guaranteed sector 45 37 42 42 43 50 Public sector 45 37 42 42 43 50 of which: General government 43 37 42 41 43 48 Private sector guaranteed by public sector 0 .. .. .. .. .. Private sector not guaranteed 11 9 7 6 6 4
Summary external debt stock by creditor typeLong-term external debt stocks 1,246 1,248 1,262 1,309 1,320 1,349 Public and publicly guaranteed debt from: 1,037 1,153 1,177 1,231 1,260 1,286 Official creditors 432 627 650 679 706 734 Multilateral 251 307 317 336 348 368 of which: World Bank 17 14 17 16 19 19 Bilateral 182 320 334 344 358 366 Private creditors 604 527 527 552 554 552 Bondholders 21 527 527 527 527 527 Commercial banks and others 583 0 .. 25 27 25 Private nonguaranteed debt from: 209 94 85 78 61 63 Bondholders .. .. .. .. .. .. Commercial banks and others 209 94 85 78 61 63Use of IMF credit 35 25 24 25 25 25
Net financial inflowsNet debt inflows Use of IMF credit 7 .. .. .. .. .. Long-term 10 43 14 50 13 28 Official creditors 28 53 24 28 27 28 Multilateral 19 16 10 18 13 19 of which: World Bank -5 1 3 0 2 0 Bilateral 9 37 13 10 14 8 Private creditors -18 -11 -9 22 -14 0 Bondholders -1 0 0 0 0 0 Banks and others -17 -11 -9 22 -14 0 Short-term 0 0 0 0 0 0Net equity inflows Foreign direct investment 102 59 33 32 122 103 Portfolio equity 0 .. .. 0 0 0
Debt ratiosExternal debt stocks to exports (%) 176 123 132 129 125 121External debt stocks to GNI (%) 105 79 77 80 80 81Debt service to exports (%) 17 9 10 10 11 9Short-term to external debt stocks (%) 1 1 0 0 0 0Multilateral to external debt stocks (%) 19 24 25 25 26 27Reserves to external debt stocks (%) 17 34 29 23 22 20Gross national income (GNI) 1,227 1,628 1,667 1,681 1,690 1,707

42
BENIN(US$ million, unless otherwise indicated)
2009 2015 2016 2017 2018 2019Summary external debt data by debtor typeTotal external debt stocks 1,327.6 2,191.2 2,277.9 2,817.0 3,607.5 3,898.9 Use of IMF credit 131.6 202.3 187.0 226.4 244.6 266.7 Long-term external debt 983.9 1,913.9 2,029.0 2,519.2 3,307.5 3,611.1 Public and publicly guaranteed sector 983.9 1,913.9 2,029.0 2,519.2 3,307.5 3,611.1 Public sector 983.9 1,913.9 2,029.0 2,519.2 3,307.5 3,611.1 of which: General government 983.9 1,913.9 2,029.0 2,519.2 3,307.5 3,611.1 Private sector guaranteed by public sector .. .. .. .. .. .. Private sector not guaranteed .. .. .. .. .. .. Short-term external debt 212.0 74.9 61.9 71.4 55.4 21.0
Disbursements (long-term) 140.9 285.4 240.2 386.1 1,061.1 760.8 Public and publicly guaranteed sector 140.9 285.4 240.2 386.1 1,061.1 760.8 Public sector 140.9 285.4 240.2 386.1 1,061.1 760.8 of which: General government 140.9 285.4 240.2 386.1 1,061.1 760.8 Private sector guaranteed by public sector .. .. .. .. .. .. Private sector not guaranteed .. .. .. .. .. ..
Principal repayments (long-term) 31.6 45.2 60.6 54.1 169.6 415.6 Public and publicly guaranteed sector 31.6 45.2 60.6 54.1 169.6 415.6 Public sector 31.6 45.2 60.6 54.1 169.6 415.6 of which: General government 31.6 45.2 60.6 54.1 169.6 415.6 Private sector guaranteed by public sector .. .. .. .. .. .. Private sector not guaranteed .. .. .. .. .. ..
Interest payments (long-term) 11.9 24.2 27.9 32.7 40.1 76.7 Public and publicly guaranteed sector 11.9 24.2 27.9 32.7 40.1 76.7 Public sector 11.9 24.2 27.9 32.7 40.1 76.7 of which: General government 11.9 24.2 27.9 32.7 40.1 76.7 Private sector guaranteed by public sector .. .. .. .. .. .. Private sector not guaranteed .. .. .. .. .. ..
Summary external debt stock by creditor typeLong-term external debt stocks 983.9 1,913.9 2,029.0 2,519.2 3,307.5 3,611.1 Public and publicly guaranteed debt from: 983.9 1,913.9 2,029.0 2,519.2 3,307.5 3,611.1 Official creditors 983.9 1,913.9 2,029.0 2,478.1 2,492.0 2,546.8 Multilateral 820.7 1,557.1 1,675.9 2,058.2 2,040.5 2,107.7 of which: World Bank 309.2 680.5 764.5 914.2 983.9 1,081.8 Bilateral 163.2 356.8 353.0 419.9 451.6 439.1 Private creditors .. 0.0 0.0 41.1 815.5 1,064.3 Bondholders .. .. .. .. .. 556.6 Commercial banks and others .. 0.0 0.0 41.1 815.5 507.7 Private nonguaranteed debt from: .. .. .. .. .. .. Bondholders .. .. .. .. .. .. Commercial banks and others .. .. .. .. .. ..Use of IMF credit 131.6 202.3 187.0 226.4 244.6 266.7
Net financial inflowsNet debt inflows Use of IMF credit 15.7 -8.4 -9.7 27.6 23.9 23.5 Long-term 109.4 240.2 179.6 332.0 891.5 345.2 Official creditors 109.3 240.2 179.6 293.3 90.7 81.9 Multilateral 100.8 168.6 166.3 245.3 42.0 88.2 of which: World Bank 51.4 87.0 107.9 102.5 93.4 104.3 Bilateral 8.6 71.6 13.3 47.9 48.7 -6.2 Private creditors .. .. .. 38.7 800.8 263.3 Bondholders .. .. .. .. .. 554.7 Banks and others .. .. .. 38.7 800.8 -291.4 Short-term 96.3 -9.1 -7.4 8.7 -14.9 -1.0Net equity inflows Foreign direct investment -32.2 96.7 31.2 44.3 -13.8 230.2 Portfolio equity 9.0 77.1 9.4 17.5 -0.3 ..
Debt ratiosExternal debt stocks to exports (%) 88.8 77.3 69.0 82.1 91.2 ..External debt stocks to GNI (%) 13.7 19.4 19.4 22.4 25.6 27.4Debt service to exports (%) 3.2 2.8 3.0 3.0 5.9 ..Short-term to external debt stocks (%) 16.0 3.4 2.7 2.5 1.5 0.5Multilateral to external debt stocks (%) 61.8 71.1 73.6 73.1 56.6 54.1Reserves to external debt stocks (%) 92.6 33.4 .. .. .. ..Gross national income (GNI) 9,666.6 11,295.6 11,718.3 12,561.4 14,106.0 14,247.2

43
BHUTAN(US$ million, unless otherwise indicated)
2009 2015 2016 2017 2018 2019Summary external debt data by debtor typeTotal external debt stocks 786.5 2,011.1 2,289.7 2,607.9 2,552.0 2,703.3 Use of IMF credit 9.4 8.3 8.1 8.5 8.3 8.3 Long-term external debt 772.2 2,002.8 2,281.5 2,596.4 2,539.3 2,667.2 Public and publicly guaranteed sector 772.2 1,945.1 2,221.2 2,540.8 2,484.2 2,616.3 Public sector 772.2 1,945.1 2,221.2 2,540.8 2,484.2 2,616.3 of which: General government 707.9 1,839.5 2,118.2 2,431.3 2,383.9 2,505.1 Private sector guaranteed by public sector .. .. .. .. .. .. Private sector not guaranteed .. 57.7 60.3 55.6 55.1 50.9 Short-term external debt 5.0 0.0 0.1 3.0 4.3 27.8
Disbursements (long-term) 117.9 354.4 402.0 219.8 168.1 198.4 Public and publicly guaranteed sector 117.9 297.0 365.0 219.8 168.1 197.7 Public sector 117.9 297.0 365.0 219.8 168.1 197.7 of which: General government 55.9 297.0 365.0 219.8 168.1 184.7 Private sector guaranteed by public sector .. .. .. .. .. .. Private sector not guaranteed .. 57.3 36.9 .. .. 0.7
Principal repayments (long-term) 41.1 91.7 75.4 46.3 51.3 28.4 Public and publicly guaranteed sector 41.1 90.3 41.6 41.6 50.8 23.6 Public sector 41.1 90.3 41.6 41.6 50.8 23.6 of which: General government 41.1 43.5 41.6 41.6 50.8 23.6 Private sector guaranteed by public sector .. .. .. .. .. .. Private sector not guaranteed .. 1.4 33.8 4.7 0.5 4.9
Interest payments (long-term) 34.4 37.2 35.2 36.1 35.8 32.2 Public and publicly guaranteed sector 34.4 37.1 34.3 33.9 34.0 30.8 Public sector 34.4 37.1 34.3 33.9 34.0 30.8 of which: General government 34.4 31.2 29.1 28.6 28.9 23.4 Private sector guaranteed by public sector .. .. .. .. .. .. Private sector not guaranteed .. 0.1 1.0 2.2 1.7 1.5
Summary external debt stock by creditor typeLong-term external debt stocks 772.2 2,002.8 2,281.5 2,596.4 2,539.3 2,667.2 Public and publicly guaranteed debt from: 772.2 1,945.1 2,221.2 2,540.8 2,484.2 2,616.3 Official creditors 767.1 1,904.4 2,186.0 2,505.5 2,455.0 2,592.0 Multilateral 284.4 468.9 460.2 532.5 563.4 646.2 of which: World Bank 113.9 183.4 177.6 219.0 243.7 270.9 Bilateral 482.7 1,435.5 1,725.8 1,973.0 1,891.6 1,945.8 Private creditors 5.1 40.6 35.2 35.3 29.2 24.3 Bondholders .. .. .. .. .. .. Commercial banks and others 5.1 40.6 35.2 35.3 29.2 24.3 Private nonguaranteed debt from: .. 57.7 60.3 55.6 55.1 50.9 Bondholders .. .. .. .. .. .. Commercial banks and others .. 57.7 60.3 55.6 55.1 50.9Use of IMF credit 9.4 8.3 8.1 8.5 8.3 8.3
Net financial inflowsNet debt inflows Use of IMF credit .. .. .. .. .. .. Long-term 76.8 262.7 326.6 173.5 116.8 170.0 Official creditors 71.9 211.1 327.8 182.6 122.0 178.5 Multilateral 45.6 14.9 1.3 48.1 41.4 85.3 of which: World Bank 18.7 20.7 -0.4 29.7 30.5 28.8 Bilateral 26.3 196.2 326.4 134.5 80.5 93.2 Private creditors 4.9 51.5 -1.2 -9.1 -5.2 -8.6 Bondholders .. .. .. .. .. .. Banks and others 4.9 51.5 -1.2 -9.1 -5.2 -8.6 Short-term -3.0 -3.4 0.1 2.9 1.3 23.5Net equity inflows Foreign direct investment 6.2 5.7 11.5 -0.7 3.3 12.6 Portfolio equity .. 0.0 0.0 0.0 0.0 0.0
Debt ratiosExternal debt stocks to exports (%) 132.1 268.8 343.4 349.4 313.5 329.9External debt stocks to GNI (%) 66.5 108.1 116.0 116.6 114.6 ..Debt service to exports (%) 12.7 17.2 16.6 11.1 10.7 7.5Short-term to external debt stocks (%) 0.6 0.0 0.0 0.1 0.2 1.0Multilateral to external debt stocks (%) 36.2 23.3 20.1 20.4 22.1 23.9Reserves to external debt stocks (%) 113.3 54.9 49.2 46.3 38.7 45.4Gross national income (GNI) 1,183.4 1,860.8 1,973.5 2,237.5 2,226.5 ..

44
BOLIVIA, PLURINATIONAL STATE OF(US$ million, unless otherwise indicated)
2009 2015 2016 2017 2018 2019Summary external debt data by debtor typeTotal external debt stocks 5,780 9,895 10,994 12,990 13,248 14,344 Use of IMF credit 257 227 221 234 228 227 Long-term external debt 5,219 9,242 10,299 12,486 12,317 13,435 Public and publicly guaranteed sector 2,572 6,335 7,010 9,151 9,905 10,951 Public sector 2,572 6,335 7,010 9,151 9,905 10,951 of which: General government 2,364 6,304 6,984 9,126 9,884 10,933 Private sector guaranteed by public sector .. 0 0 .. .. .. Private sector not guaranteed 2,647 2,906 3,289 3,336 2,412 2,484 Short-term external debt 304 426 475 270 703 683
Disbursements (long-term) 523 1,408 1,432 2,661 1,373 1,698 Public and publicly guaranteed sector 426 1,016 1,002 2,390 1,198 1,472 Public sector 426 1,016 1,002 2,390 1,198 1,472 of which: General government 369 1,016 1,002 2,390 1,198 1,472 Private sector guaranteed by public sector .. 0 .. .. .. .. Private sector not guaranteed 97 392 430 271 176 227
Principal repayments (long-term) 455 811 550 688 640 658 Public and publicly guaranteed sector 197 374 280 331 360 412 Public sector 197 373 280 331 360 412 of which: General government 192 246 276 328 356 409 Private sector guaranteed by public sector .. 0 0 .. .. .. Private sector not guaranteed 257 438 270 357 280 246
Interest payments (long-term) 119 170 211 283 346 399 Public and publicly guaranteed sector 71 153 185 250 316 371 Public sector 71 153 185 250 316 371 of which: General government 70 150 184 250 316 370 Private sector guaranteed by public sector .. 0 0 .. .. .. Private sector not guaranteed 48 17 26 33 30 28
Summary external debt stock by creditor typeLong-term external debt stocks 5,219 9,242 10,299 12,486 12,317 13,435 Public and publicly guaranteed debt from: 2,572 6,335 7,010 9,151 9,905 10,951 Official creditors 2,480 5,323 5,999 7,141 7,897 8,910 Multilateral 1,989 4,648 5,282 6,156 6,710 7,418 of which: World Bank 316 735 770 830 847 927 Bilateral 491 674 717 985 1,187 1,492 Private creditors 92 1,013 1,011 2,010 2,008 2,041 Bondholders 0 1,000 1,000 2,000 2,000 2,000 Commercial banks and others 92 13 11 10 8 41 Private nonguaranteed debt from: 2,647 2,906 3,289 3,336 2,412 2,484 Bondholders .. .. .. .. .. .. Commercial banks and others 2,647 2,906 3,289 3,336 2,412 2,484Use of IMF credit 257 227 221 234 228 227
Net financial inflowsNet debt inflows Use of IMF credit .. .. .. .. .. .. Long-term 68 596 882 1,973 733 1,040 Official creditors 234 644 724 1,060 840 1,027 Multilateral 172 786 661 826 613 713 of which: World Bank 32 259 57 19 37 84 Bilateral 62 -142 63 235 227 314 Private creditors -166 -48 159 913 -106 13 Bondholders -10 0 0 1,000 0 0 Banks and others -156 -48 159 -87 -106 13 Short-term 34 137 49 -205 433 -20Net equity inflows Foreign direct investment 505 371 193 706 220 -186 Portfolio equity 0 19 21 30 24 13
Debt ratiosExternal debt stocks to exports (%) 102 99 131 132 126 138External debt stocks to GNI (%) 35 31 33 36 34 36Debt service to exports (%) 10 10 9 10 10 10Short-term to external debt stocks (%) 5 4 4 2 5 5Multilateral to external debt stocks (%) 34 47 48 47 51 52Reserves to external debt stocks (%) 131 117 77 65 54 30Gross national income (GNI) 16,666 31,873 33,320 36,448 39,316 40,101

45
BOSNIA AND HERZEGOVINA(US$ million, unless otherwise indicated)
2009 2015 2016 2017 2018 2019Summary external debt data by debtor typeTotal external debt stocks 14,006 13,824 14,323 15,236 15,980 16,600 Use of IMF credit 539 800 770 592 466 398 Long-term external debt 12,010 12,377 12,905 14,359 14,748 15,843 Public and publicly guaranteed sector 3,570 4,390 4,401 4,841 4,929 4,880 Public sector 3,570 4,390 4,401 4,841 4,929 4,880 of which: General government 3,562 4,064 4,035 4,430 4,523 4,532 Private sector guaranteed by public sector .. .. .. .. .. .. Private sector not guaranteed 8,440 7,987 8,504 9,517 9,819 10,964 Short-term external debt 1,457 647 647 286 766 359
Disbursements (long-term) 474 1,247 1,407 1,468 1,053 1,699 Public and publicly guaranteed sector 321 362 401 308 607 410 Public sector 321 362 401 308 607 410 of which: General government 321 235 330 293 556 392 Private sector guaranteed by public sector .. .. .. .. .. .. Private sector not guaranteed 153 885 1,007 1,160 446 1,290
Principal repayments (long-term) 230 510 757 451 485 536 Public and publicly guaranteed sector 110 342 267 304 342 391 Public sector 110 342 267 304 342 391 of which: General government 109 333 250 286 302 321 Private sector guaranteed by public sector .. .. .. .. .. .. Private sector not guaranteed 120 168 490 147 143 145
Interest payments (long-term) 217 240 261 283 303 332 Public and publicly guaranteed sector 63 56 65 63 77 80 Public sector 63 56 65 63 77 80 of which: General government 63 53 62 61 75 77 Private sector guaranteed by public sector .. .. .. .. .. .. Private sector not guaranteed 153 184 196 219 226 253
Summary external debt stock by creditor typeLong-term external debt stocks 12,010 12,377 12,905 14,359 14,748 15,843 Public and publicly guaranteed debt from: 3,570 4,390 4,401 4,841 4,929 4,880 Official creditors 3,029 4,136 4,203 4,672 4,606 4,594 Multilateral 2,198 3,319 3,397 3,769 3,734 3,739 of which: World Bank 1,520 1,551 1,514 1,572 1,610 1,584 Bilateral 831 817 806 903 872 855 Private creditors 540 254 198 169 322 286 Bondholders 322 121 98 89 256 231 Commercial banks and others 219 132 100 80 66 55 Private nonguaranteed debt from: 8,440 7,987 8,504 9,517 9,819 10,964 Bondholders .. .. .. .. .. .. Commercial banks and others 8,440 7,987 8,504 9,517 9,819 10,964Use of IMF credit 539 800 770 592 466 398
Net financial inflowsNet debt inflows Use of IMF credit 282 -54 -6 -218 -114 -66 Long-term 245 737 650 1,018 568 1,164 Official creditors 208 55 183 58 100 49 Multilateral 187 91 175 27 102 56 of which: World Bank -7 57 0 -36 81 -12 Bilateral 22 -36 8 30 -3 -6 Private creditors 36 682 467 960 468 1,114 Bondholders .. -21 -21 -21 176 -21 Banks and others 36 703 487 981 291 1,135 Short-term 295 -134 1 -362 481 -407Net equity inflows Foreign direct investment -202 264 281 433 560 429 Portfolio equity 0 2 3 5 -2 1
Debt ratiosExternal debt stocks to exports (%) 263 220 215 191 176 192External debt stocks to GNI (%) 77 85 85 85 79 83Debt service to exports (%) 9 13 17 12 11 11Short-term to external debt stocks (%) 10 5 5 2 5 2Multilateral to external debt stocks (%) 16 24 24 25 23 23Reserves to external debt stocks (%) 32 34 35 42 42 43Gross national income (GNI) 18,292 16,321 16,936 18,015 20,125 20,016

46
BOTSWANA(US$ million, unless otherwise indicated)
2009 2015 2016 2017 2018 2019Summary external debt data by debtor typeTotal external debt stocks 1,643 2,237 2,126 1,741 1,782 1,565 Use of IMF credit 90 80 77 82 80 79 Long-term external debt 1,395 1,772 1,670 1,552 1,451 1,346 Public and publicly guaranteed sector 1,395 1,772 1,670 1,552 1,451 1,334 Public sector 1,395 1,772 1,670 1,552 1,451 1,334 of which: General government 1,382 1,741 1,648 1,538 1,447 1,334 Private sector guaranteed by public sector .. .. .. .. .. .. Private sector not guaranteed .. 0 .. .. 0 12 Short-term external debt 158 385 379 108 251 139
Disbursements (long-term) 1,007 13 44 12 47 48 Public and publicly guaranteed sector 1,007 13 44 12 47 26 Public sector 1,007 13 44 12 47 26 of which: General government 1,007 13 44 12 47 26 Private sector guaranteed by public sector .. .. .. .. .. .. Private sector not guaranteed .. .. .. .. .. 22
Principal repayments (long-term) 36 220 141 144 144 152 Public and publicly guaranteed sector 36 141 141 144 144 141 Public sector 36 141 141 144 144 141 of which: General government 32 132 133 135 135 137 Private sector guaranteed by public sector .. .. .. .. .. .. Private sector not guaranteed .. 80 .. .. .. 10
Interest payments (long-term) 9 20 18 29 31 40 Public and publicly guaranteed sector 9 16 18 29 31 40 Public sector 9 16 18 29 31 40 of which: General government 9 16 18 29 31 40 Private sector guaranteed by public sector .. .. .. .. .. .. Private sector not guaranteed .. 5 .. .. .. 1
Summary external debt stock by creditor typeLong-term external debt stocks 1,395 1,772 1,670 1,552 1,451 1,346 Public and publicly guaranteed debt from: 1,395 1,772 1,670 1,552 1,451 1,334 Official creditors 1,394 1,741 1,648 1,538 1,447 1,334 Multilateral 1,251 1,667 1,583 1,476 1,389 1,287 of which: World Bank 5 131 159 151 174 172 Bilateral 143 75 65 63 58 47 Private creditors 2 31 22 13 4 0 Bondholders .. .. .. .. .. .. Commercial banks and others 2 31 22 13 4 0 Private nonguaranteed debt from: .. 0 .. .. 0 12 Bondholders .. 0 .. .. .. .. Commercial banks and others .. .. .. .. 0 12Use of IMF credit 90 80 77 82 80 79
Net financial inflowsNet debt inflows Use of IMF credit .. .. .. .. .. .. Long-term 971 -208 -97 -132 -97 -104 Official creditors 972 -119 -88 -123 -88 -111 Multilateral 976 -108 -81 -118 -84 -100 of which: World Bank 0 -1 27 -7 22 -2 Bilateral -4 -11 -7 -5 -4 -11 Private creditors -1 -89 -9 -9 -9 8 Bondholders .. -80 .. .. .. .. Banks and others -1 -9 -9 -9 -9 8 Short-term 113 -35 -6 -271 143 -112Net equity inflows Foreign direct investment 213 311 47 160 174 195 Portfolio equity 18 -104 -123 -47 -137 -45
Debt ratiosExternal debt stocks to exports (%) 37 30 25 24 23 25External debt stocks to GNI (%) 16 16 15 11 10 9Debt service to exports (%) 1 3 2 2 2 3Short-term to external debt stocks (%) 10 17 18 6 14 9Multilateral to external debt stocks (%) 76 75 74 85 78 82Reserves to external debt stocks (%) 530 337 338 430 374 394Gross national income (GNI) 10,029 13,967 14,376 16,122 17,248 16,961

47
BRAZIL(US$ million, unless otherwise indicated)
2009 2015 2016 2017 2018 2019Summary external debt data by debtor typeTotal external debt stocks 281,651 543,397 543,257 543,000 557,741 569,398 Use of IMF credit 4,526 4,001 3,881 4,112 4,015 3,992 Long-term external debt 237,339 487,055 482,174 486,480 486,882 485,471 Public and publicly guaranteed sector 87,513 172,887 174,683 181,161 190,192 193,734 Public sector 84,931 170,432 172,853 179,675 189,132 192,745 of which: General government 66,846 68,703 71,178 70,026 70,449 74,583 Private sector guaranteed by public sector 2,582 2,455 1,830 1,485 1,060 988 Private sector not guaranteed 149,826 314,168 307,492 305,320 296,690 291,737 Short-term external debt 39,786 52,341 57,202 52,408 66,844 79,935
Disbursements (long-term) 57,675 93,786 106,247 96,730 105,057 114,547 Public and publicly guaranteed sector 13,732 20,051 19,729 30,315 28,808 23,867 Public sector 12,217 19,814 19,608 30,188 28,675 23,682 of which: General government 6,603 3,032 5,732 7,094 4,655 8,921 Private sector guaranteed by public sector 1,515 238 121 128 134 185 Private sector not guaranteed 43,943 73,735 86,518 66,415 76,249 90,680
Principal repayments (long-term) 30,473 71,342 94,709 75,668 74,509 123,447 Public and publicly guaranteed sector 7,788 22,929 18,983 23,218 28,432 30,489 Public sector 7,649 22,031 18,238 22,718 27,874 30,236 of which: General government 6,025 5,141 3,809 8,450 3,645 4,659 Private sector guaranteed by public sector 138 898 745 500 558 252 Private sector not guaranteed 22,685 48,413 75,726 52,450 46,077 92,958
Interest payments (long-term) 13,554 17,724 21,605 18,467 18,681 25,696 Public and publicly guaranteed sector 5,656 5,895 5,537 6,696 5,679 11,379 Public sector 5,585 5,811 5,460 6,639 5,630 11,339 of which: General government 4,891 3,330 3,163 3,348 3,186 3,543 Private sector guaranteed by public sector 72 85 78 57 49 40 Private sector not guaranteed 7,898 11,828 16,068 11,771 13,002 14,317
Summary external debt stock by creditor typeLong-term external debt stocks 237,339 487,055 482,174 486,480 486,882 485,471 Public and publicly guaranteed debt from: 87,513 172,887 174,683 181,161 190,192 193,734 Official creditors 32,702 42,083 41,064 48,327 47,860 43,167 Multilateral 25,013 31,657 32,071 32,678 33,386 33,262 of which: World Bank 10,065 15,753 16,255 16,390 16,213 16,253 Bilateral 7,689 10,426 8,993 15,650 14,474 9,905 Private creditors 54,811 130,805 133,619 132,833 142,332 150,567 Bondholders 47,350 46,628 46,843 44,874 41,979 43,507 Commercial banks and others 7,461 84,176 86,776 87,959 100,354 107,060 Private nonguaranteed debt from: 149,826 314,168 307,492 305,320 296,690 291,737 Bondholders 53,342 51,276 46,930 48,026 32,686 37,553 Commercial banks and others 96,483 262,891 260,562 257,294 264,004 254,184Use of IMF credit 4,526 4,001 3,881 4,112 4,015 3,992
Net financial inflowsNet debt inflows Use of IMF credit .. .. .. .. .. .. Long-term 27,202 22,444 11,538 21,062 30,548 -8,900 Official creditors 3,387 -239 -1,012 7,140 -358 -4,689 Multilateral 405 507 427 633 787 -105 of which: World Bank -598 474 516 159 -114 43 Bilateral 2,982 -746 -1,439 6,506 -1,144 -4,584 Private creditors 23,815 22,682 12,550 13,922 30,906 -4,211 Bondholders 17,770 -5,443 -7,710 -643 1,287 -521 Banks and others 6,045 28,125 20,260 14,565 29,619 -3,689 Short-term 3,142 -5,818 4,860 -4,798 14,440 13,092Net equity inflows Foreign direct investment 19,906 41,888 48,854 63,999 57,322 67,961 Portfolio equity 37,071 9,787 11,040 5,674 -3,062 -2,689
Debt ratiosExternal debt stocks to exports (%) 149 240 236 197 194 199External debt stocks to GNI (%) 17 31 31 27 30 32Debt service to exports (%) 23 40 51 35 33 53Short-term to external debt stocks (%) 14 10 11 10 12 14Multilateral to external debt stocks (%) 9 6 6 6 6 6Reserves to external debt stocks (%) 84 65 67 68 67 62Gross national income (GNI) 1,630,133 1,768,302 1,757,604 2,024,254 1,832,171 1,790,969

48
BULGARIA(US$ million, unless otherwise indicated)
2009 2015 2016 2017 2018 2019Summary external debt data by debtor typeTotal external debt stocks 55,683 40,379 39,994 40,989 40,103 40,501 Use of IMF credit 958 847 821 870 850 845 Long-term external debt 36,928 30,759 30,563 30,583 29,708 29,762 Public and publicly guaranteed sector 5,080 8,781 11,050 11,630 11,506 11,186 Public sector 5,080 8,781 11,050 11,630 11,506 11,186 of which: General government 4,287 8,495 10,171 10,424 10,419 10,195 Private sector guaranteed by public sector .. .. .. .. .. .. Private sector not guaranteed 31,848 21,978 19,513 18,953 18,202 18,576 Short-term external debt 17,797 8,773 8,609 9,536 9,546 9,895
Disbursements (long-term) 8,635 7,236 7,090 5,445 5,052 4,554 Public and publicly guaranteed sector 530 3,752 2,875 312 917 150 Public sector 530 3,752 2,875 312 917 150 of which: General government 500 3,712 2,216 46 892 150 Private sector guaranteed by public sector .. .. .. .. .. .. Private sector not guaranteed 8,105 3,484 4,215 5,132 4,135 4,405
Principal repayments (long-term) 3,990 7,175 5,795 6,844 5,055 4,286 Public and publicly guaranteed sector 404 230 274 1,355 300 256 Public sector 404 230 274 1,355 300 256 of which: General government 316 174 220 1,294 203 179 Private sector guaranteed by public sector .. .. .. .. .. .. Private sector not guaranteed 3,585 6,945 5,521 5,489 4,754 4,029
Interest payments (long-term) 800 2,106 2,170 1,713 1,388 1,179 Public and publicly guaranteed sector 208 169 247 304 269 276 Public sector 208 169 247 304 269 276 of which: General government 181 162 237 290 253 261 Private sector guaranteed by public sector .. .. .. .. .. .. Private sector not guaranteed 592 1,936 1,923 1,408 1,118 903
Summary external debt stock by creditor typeLong-term external debt stocks 36,928 30,759 30,563 30,583 29,708 29,762 Public and publicly guaranteed debt from: 5,080 8,781 11,050 11,630 11,506 11,186 Official creditors 3,331 2,685 3,046 3,664 3,214 3,050 Multilateral 2,516 2,376 2,786 3,339 2,966 2,839 of which: World Bank 1,509 786 920 1,148 831 727 Bilateral 815 309 261 325 247 211 Private creditors 1,749 6,096 8,004 7,967 8,292 8,136 Bondholders 1,725 6,089 7,997 7,960 8,286 8,130 Commercial banks and others 24 7 6 7 6 6 Private nonguaranteed debt from: 31,848 21,978 19,513 18,953 18,202 18,576 Bondholders 146 1,497 1,549 1,686 1,405 1,489 Commercial banks and others 31,702 20,481 17,964 17,267 16,797 17,086Use of IMF credit 958 847 821 870 850 845
Net financial inflowsNet debt inflows Use of IMF credit .. .. .. .. .. .. Long-term 4,646 61 1,295 -1,399 -2 268 Official creditors 263 27 434 31 -91 -107 Multilateral 268 81 492 -14 -15 -70 of which: World Bank 285 -87 150 -80 -60 -87 Bilateral -5 -54 -58 45 -76 -36 Private creditors 4,383 34 861 -1,430 89 375 Bondholders -495 3,548 2,220 -941 560 86 Banks and others 4,878 -3,514 -1,359 -488 -471 289 Short-term -537 -2,331 -159 897 -113 260Net equity inflows Foreign direct investment 2,249 2,791 1,498 983 1,404 490 Portfolio equity 8 -9 -20 155 109 -52
Debt ratiosExternal debt stocks to exports (%) 228 121 112 99 89 91External debt stocks to GNI (%) 111 82 77 71 60 61Debt service to exports (%) 20 28 23 21 15 13Short-term to external debt stocks (%) 32 22 22 23 24 24Multilateral to external debt stocks (%) 5 6 7 8 7 7Reserves to external debt stocks (%) 31 51 59 65 67 64Gross national income (GNI) 50,333 49,050 52,132 57,542 66,815 66,046

49
BURKINA FASO(US$ million, unless otherwise indicated)
2009 2015 2016 2017 2018 2019Summary external debt data by debtor typeTotal external debt stocks 1,918 2,632 2,825 3,129 3,286 3,662 Use of IMF credit 201 283 286 284 269 310 Long-term external debt 1,718 2,349 2,539 2,845 3,017 3,353 Public and publicly guaranteed sector 1,716 2,339 2,532 2,835 3,006 3,342 Public sector 1,716 2,339 2,532 2,835 3,006 3,342 of which: General government 1,716 2,339 2,532 2,835 3,006 3,342 Private sector guaranteed by public sector .. .. .. .. .. .. Private sector not guaranteed 2 10 7 10 11 10 Short-term external debt 0 0 0 0 0 0
Disbursements (long-term) 218 274 264 184 340 462 Public and publicly guaranteed sector 217 271 262 183 338 462 Public sector 217 271 262 183 338 462 of which: General government 217 271 262 183 338 462 Private sector guaranteed by public sector .. .. .. .. .. .. Private sector not guaranteed 1 3 2 1 2 ..
Principal repayments (long-term) 28 71 71 78 78 92 Public and publicly guaranteed sector 28 70 70 77 77 91 Public sector 28 70 70 77 77 91 of which: General government 28 70 70 77 77 91 Private sector guaranteed by public sector .. .. .. .. .. .. Private sector not guaranteed 0 1 1 1 1 1
Interest payments (long-term) 15 23 31 33 32 32 Public and publicly guaranteed sector 15 22 31 32 31 31 Public sector 15 22 31 32 31 31 of which: General government 15 22 31 32 31 31 Private sector guaranteed by public sector .. .. .. .. .. .. Private sector not guaranteed 0 0 0 0 1 0
Summary external debt stock by creditor typeLong-term external debt stocks 1,718 2,349 2,539 2,845 3,017 3,353 Public and publicly guaranteed debt from: 1,716 2,339 2,532 2,835 3,006 3,342 Official creditors 1,694 2,336 2,531 2,835 3,006 3,342 Multilateral 1,403 2,039 2,195 2,506 2,664 3,003 of which: World Bank 721 1,038 1,171 1,334 1,458 1,673 Bilateral 292 298 336 329 342 340 Private creditors 22 3 1 0 .. 0 Bondholders .. .. .. .. .. .. Commercial banks and others 22 3 1 0 .. 0 Private nonguaranteed debt from: 2 10 7 10 11 10 Bondholders .. .. .. .. .. .. Commercial banks and others 2 10 7 10 11 10Use of IMF credit 201 283 286 284 269 310
Net financial inflowsNet debt inflows Use of IMF credit 54 12 12 -18 -9 42 Long-term 190 203 193 106 262 370 Official creditors 190 204 194 107 261 371 Multilateral 183 163 199 129 241 370 of which: World Bank 90 130 166 78 166 228 Bilateral 7 41 -5 -23 20 1 Private creditors 0 -1 0 -1 1 -1 Bondholders .. .. .. .. .. .. Banks and others 0 -1 0 -1 1 -1 Short-term -8 0 0 0 0 0Net equity inflows Foreign direct investment 9 108 166 93 242 208 Portfolio equity 0 4 35 28 31 ..
Debt ratiosExternal debt stocks to exports (%) 168 90 82 80 69 ..External debt stocks to GNI (%) .. 23 24 23 21 24Debt service to exports (%) 4 4 4 3 3 ..Short-term to external debt stocks (%) 0 0 0 0 0 0Multilateral to external debt stocks (%) 73 77 78 80 81 82Reserves to external debt stocks (%) 68 10 .. .. .. ..Gross national income (GNI) .. 11,321 11,997 13,640 15,719 15,326

50
BURUNDI(US$ million, unless otherwise indicated)
2009 2015 2016 2017 2018 2019Summary external debt data by debtor typeTotal external debt stocks 607.2 626.0 602.8 614.0 589.3 578.4 Use of IMF credit 206.7 217.6 193.6 188.1 166.4 149.1 Long-term external debt 393.5 408.1 408.9 425.6 422.7 428.9 Public and publicly guaranteed sector 393.5 408.1 408.9 425.6 422.7 428.9 Public sector 393.5 408.1 408.9 425.6 422.7 428.9 of which: General government 392.2 408.1 397.6 414.4 411.5 413.3 Private sector guaranteed by public sector .. .. .. .. .. .. Private sector not guaranteed .. .. .. .. .. .. Short-term external debt 7.0 0.3 0.3 0.3 0.3 0.3
Disbursements (long-term) 39.3 21.0 19.0 20.1 10.7 27.6 Public and publicly guaranteed sector 39.3 21.0 19.0 20.1 10.7 27.6 Public sector 39.3 21.0 19.0 20.1 10.7 27.6 of which: General government 39.3 21.0 7.8 20.1 10.7 22.9 Private sector guaranteed by public sector .. .. .. .. .. .. Private sector not guaranteed .. .. .. .. .. ..
Principal repayments (long-term) 8.5 5.7 11.5 15.7 8.4 20.6 Public and publicly guaranteed sector 8.5 5.7 11.5 15.7 8.4 20.6 Public sector 8.5 5.7 11.5 15.7 8.4 20.6 of which: General government 7.8 5.7 11.5 15.7 8.4 20.3 Private sector guaranteed by public sector .. .. .. .. .. .. Private sector not guaranteed .. .. .. .. .. ..
Interest payments (long-term) 3.6 3.7 3.7 2.7 3.1 2.5 Public and publicly guaranteed sector 3.6 3.7 3.7 2.7 3.1 2.5 Public sector 3.6 3.7 3.7 2.7 3.1 2.5 of which: General government 3.6 3.7 3.7 2.7 3.0 2.5 Private sector guaranteed by public sector .. .. .. .. .. .. Private sector not guaranteed .. .. .. .. .. ..
Summary external debt stock by creditor typeLong-term external debt stocks 393.5 408.1 408.9 425.6 422.7 428.9 Public and publicly guaranteed debt from: 393.5 408.1 408.9 425.6 422.7 428.9 Official creditors 393.5 408.1 408.9 425.6 422.7 428.9 Multilateral 303.4 307.2 310.6 318.4 314.5 318.5 of which: World Bank 147.2 150.6 143.0 148.2 141.5 137.5 Bilateral 90.1 100.9 98.3 107.2 108.3 110.4 Private creditors .. .. .. .. .. .. Bondholders .. .. .. .. .. .. Commercial banks and others .. .. .. .. .. .. Private nonguaranteed debt from: .. .. .. .. .. .. Bondholders .. .. .. .. .. .. Commercial banks and others .. .. .. .. .. ..Use of IMF credit 206.7 217.6 193.6 188.1 166.4 149.1
Net financial inflowsNet debt inflows Use of IMF credit 13.4 -10.5 -18.0 -16.6 -17.6 -16.2 Long-term 30.8 15.3 7.5 4.4 2.3 7.0 Official creditors 30.8 15.3 7.5 4.4 2.3 7.0 Multilateral 25.8 2.9 9.0 -3.4 0.4 4.9 of which: World Bank 8.6 -3.2 -3.2 -3.2 -3.3 -3.2 Bilateral 5.0 12.4 -1.5 7.7 1.9 2.1 Private creditors .. .. .. .. .. .. Bondholders .. .. .. .. .. .. Banks and others .. .. .. .. .. .. Short-term -7.0 -48.0 0.0 0.0 0.0 0.0Net equity inflows Foreign direct investment 0.3 49.6 0.1 0.3 1.0 1.0 Portfolio equity .. .. .. .. .. ..
Debt ratiosExternal debt stocks to exports (%) 507.2 323.5 289.1 216.1 195.2 ..External debt stocks to GNI (%) 34.4 20.2 20.4 19.4 19.4 19.2Debt service to exports (%) 16.6 13.9 16.0 12.3 9.7 ..Short-term to external debt stocks (%) 1.2 0.0 0.0 0.0 0.0 0.0Multilateral to external debt stocks (%) 50.0 49.1 51.5 51.9 53.4 55.1Reserves to external debt stocks (%) 53.0 21.6 15.6 15.7 11.3 19.0Gross national income (GNI) 1,764.5 3,102.7 2,958.8 3,167.5 3,043.0 3,019.5

51
CABO VERDE(US$ million, unless otherwise indicated)
2009 2015 2016 2017 2018 2019Summary external debt data by debtor typeTotal external debt stocks 724.6 1,550.2 1,551.7 1,790.0 1,767.5 1,821.2 Use of IMF credit 25.4 12.7 12.3 13.1 12.8 12.7 Long-term external debt 697.7 1,537.5 1,539.4 1,776.9 1,754.7 1,808.5 Public and publicly guaranteed sector 697.7 1,537.5 1,539.4 1,776.9 1,754.7 1,808.5 Public sector 697.7 1,534.3 1,536.3 1,774.0 1,752.1 1,806.5 of which: General government 697.7 1,534.3 1,536.3 1,774.0 1,752.1 1,806.5 Private sector guaranteed by public sector .. 3.2 3.1 2.9 2.6 2.0 Private sector not guaranteed .. .. .. .. .. .. Short-term external debt 1.5 0.0 0.0 0.0 0.0 0.1
Disbursements (long-term) 102.3 141.2 69.5 111.8 75.2 118.4 Public and publicly guaranteed sector 102.3 141.2 69.5 111.8 75.2 118.4 Public sector 102.3 141.2 69.5 111.8 75.2 118.4 of which: General government 102.3 141.2 69.5 111.8 75.2 118.4 Private sector guaranteed by public sector .. .. .. .. .. .. Private sector not guaranteed .. .. .. .. .. ..
Principal repayments (long-term) 24.5 23.7 25.6 32.6 36.7 42.1 Public and publicly guaranteed sector 24.5 23.7 25.6 32.6 36.7 42.1 Public sector 24.5 23.7 25.6 32.2 36.5 41.5 of which: General government 24.5 23.7 25.6 32.2 36.5 41.5 Private sector guaranteed by public sector .. .. .. 0.4 0.2 0.6 Private sector not guaranteed .. .. .. .. .. ..
Interest payments (long-term) 6.8 17.8 18.1 18.1 19.2 19.2 Public and publicly guaranteed sector 6.8 17.8 18.1 18.1 19.2 19.2 Public sector 6.8 17.8 18.1 18.1 19.2 19.1 of which: General government 6.8 17.8 18.1 18.1 19.2 19.1 Private sector guaranteed by public sector .. .. .. .. .. 0.1 Private sector not guaranteed .. .. .. .. .. ..
Summary external debt stock by creditor typeLong-term external debt stocks 697.7 1,537.5 1,539.4 1,776.9 1,754.7 1,808.5 Public and publicly guaranteed debt from: 697.7 1,537.5 1,539.4 1,776.9 1,754.7 1,808.5 Official creditors 691.2 1,076.7 1,077.7 1,238.3 1,240.5 1,301.5 Multilateral 533.9 735.2 737.2 811.6 816.9 882.5 of which: World Bank 286.4 357.4 344.7 361.7 351.4 406.1 Bilateral 157.3 341.5 340.5 426.7 423.6 419.0 Private creditors 6.5 460.7 461.7 538.6 514.2 507.0 Bondholders .. .. .. .. .. .. Commercial banks and others 6.5 460.7 461.7 538.6 514.2 507.0 Private nonguaranteed debt from: .. .. .. .. .. .. Bondholders .. .. .. .. .. .. Commercial banks and others .. .. .. .. .. ..Use of IMF credit 25.4 12.7 12.3 13.1 12.8 12.7
Net financial inflowsNet debt inflows Use of IMF credit -1.5 -0.3 .. .. .. .. Long-term 77.8 117.5 43.9 79.2 38.5 76.3 Official creditors 81.4 88.9 27.5 66.7 38.5 73.9 Multilateral 45.8 57.7 20.7 17.0 28.4 74.1 of which: World Bank 0.5 17.4 -2.0 -6.3 -1.0 57.0 Bilateral 35.6 31.2 6.8 49.7 10.1 -0.2 Private creditors -3.6 28.6 16.4 12.5 0.0 2.5 Bondholders .. .. .. .. .. .. Banks and others -3.6 28.6 16.4 12.5 0.0 2.5 Short-term .. .. .. .. .. ..Net equity inflows Foreign direct investment 122.8 99.9 125.5 120.0 107.8 100.0 Portfolio equity 1.9 0.0 0.0 0.0 0.0 0.0
Debt ratiosExternal debt stocks to exports (%) 123.8 230.6 209.7 216.8 177.1 175.2External debt stocks to GNI (%) 43.4 100.8 96.8 104.8 92.0 93.9Debt service to exports (%) 5.6 6.2 5.9 6.1 5.6 5.9Short-term to external debt stocks (%) 0.2 0.0 0.0 0.0 0.0 0.0Multilateral to external debt stocks (%) 73.7 47.4 47.5 45.3 46.2 48.5Reserves to external debt stocks (%) 54.9 31.9 36.9 34.5 34.3 40.5Gross national income (GNI) 1,668.5 1,537.7 1,603.7 1,708.7 1,920.6 1,939.5

52
CAMBODIA(US$ million, unless otherwise indicated)
2009 2015 2016 2017 2018 2019Summary external debt data by debtor typeTotal external debt stocks 3,295 9,424 10,049 11,414 13,522 15,329 Use of IMF credit 132 116 113 120 117 116 Long-term external debt 2,933 7,988 8,209 9,516 11,039 11,801 Public and publicly guaranteed sector 2,739 5,626 5,820 6,566 6,984 7,562 Public sector 2,739 5,626 5,820 6,566 6,984 7,562 of which: General government 2,739 5,626 5,820 6,566 6,984 7,562 Private sector guaranteed by public sector .. .. .. .. .. .. Private sector not guaranteed 194 2,362 2,388 2,951 4,056 4,239 Short-term external debt 230 1,320 1,727 1,778 2,366 3,413
Disbursements (long-term) 404 1,654 1,075 1,967 2,749 2,049 Public and publicly guaranteed sector 209 619 520 658 716 824 Public sector 209 619 520 658 716 824 of which: General government 209 619 520 658 716 824 Private sector guaranteed by public sector .. .. .. .. .. .. Private sector not guaranteed 194 1,036 555 1,310 2,033 1,226
Principal repayments (long-term) 26 610 642 887 1,109 1,260 Public and publicly guaranteed sector 26 80 113 139 180 218 Public sector 26 80 113 139 180 218 of which: General government 26 80 113 139 180 218 Private sector guaranteed by public sector .. .. .. .. .. .. Private sector not guaranteed .. 530 529 747 928 1,042
Interest payments (long-term) 21 63 83 87 103 139 Public and publicly guaranteed sector 21 57 72 72 85 93 Public sector 21 57 72 72 85 93 of which: General government 21 57 72 72 85 93 Private sector guaranteed by public sector .. .. .. .. .. .. Private sector not guaranteed 1 7 11 15 17 47
Summary external debt stock by creditor typeLong-term external debt stocks 2,933 7,988 8,209 9,516 11,039 11,801 Public and publicly guaranteed debt from: 2,739 5,626 5,820 6,566 6,984 7,562 Official creditors 2,739 5,626 5,820 6,566 6,984 7,562 Multilateral 1,501 1,681 1,735 1,938 1,957 2,102 of which: World Bank 566 541 518 550 544 585 Bilateral 1,237 3,945 4,086 4,628 5,026 5,459 Private creditors .. .. .. .. .. .. Bondholders .. .. .. .. .. .. Commercial banks and others .. .. .. .. .. .. Private nonguaranteed debt from: 194 2,362 2,388 2,951 4,056 4,239 Bondholders .. .. .. .. 300 300 Commercial banks and others 194 2,362 2,388 2,951 3,756 3,939Use of IMF credit 132 116 113 120 117 116
Net financial inflowsNet debt inflows Use of IMF credit .. .. .. .. .. .. Long-term 377 1,044 433 1,081 1,641 790 Official creditors 183 539 407 518 536 606 Multilateral 68 64 106 98 65 157 of which: World Bank 16 -11 -7 1 7 44 Bilateral 115 475 301 420 470 450 Private creditors 194 505 26 562 1,105 183 Bondholders .. .. .. .. 300 .. Banks and others 194 505 26 562 805 183 Short-term 149 233 407 51 588 1,046Net equity inflows Foreign direct investment 928 1,823 2,476 2,788 3,213 3,663 Portfolio equity 0 0 0 0 0 0
Debt ratiosExternal debt stocks to exports (%) 66 69 68 70 71 70External debt stocks to GNI (%) 33 56 53 55 59 62Debt service to exports (%) 1 5 5 6 7 7Short-term to external debt stocks (%) 7 14 17 16 17 22Multilateral to external debt stocks (%) 46 18 17 17 14 14Reserves to external debt stocks (%) 87 73 84 99 99 111Gross national income (GNI) 9,951 16,945 18,788 20,800 22,915 24,752

53
CAMEROON(US$ million, unless otherwise indicated)
2009 2015 2016 2017 2018 2019Summary external debt data by debtor typeTotal external debt stocks 3,237 7,305 7,827 10,010 10,864 12,815 Use of IMF credit 453 358 318 602 714 760 Long-term external debt 2,782 6,648 7,246 8,880 9,717 11,678 Public and publicly guaranteed sector 2,167 5,731 6,234 7,954 9,014 10,275 Public sector 2,167 5,731 6,234 7,954 9,014 10,275 of which: General government 2,157 5,729 6,233 7,953 9,013 10,274 Private sector guaranteed by public sector .. .. .. .. .. .. Private sector not guaranteed 615 918 1,012 925 703 1,403 Short-term external debt 3 299 262 528 433 377
Disbursements (long-term) 356 1,703 1,458 1,648 1,692 2,644 Public and publicly guaranteed sector 147 1,646 1,209 1,588 1,638 1,807 Public sector 147 1,646 1,209 1,588 1,638 1,807 of which: General government 147 1,646 1,209 1,588 1,638 1,807 Private sector guaranteed by public sector .. .. .. .. .. .. Private sector not guaranteed 209 57 249 61 53 837
Principal repayments (long-term) 344 317 614 413 621 788 Public and publicly guaranteed sector 115 270 341 175 371 463 Public sector 115 270 341 175 371 463 of which: General government 110 270 340 175 370 462 Private sector guaranteed by public sector .. .. .. .. .. .. Private sector not guaranteed 229 47 273 238 250 325
Interest payments (long-term) 57 157 280 272 405 349 Public and publicly guaranteed sector 26 115 168 240 237 237 Public sector 26 115 168 240 237 237 of which: General government 26 115 168 240 237 237 Private sector guaranteed by public sector .. .. .. .. .. .. Private sector not guaranteed 31 42 112 32 168 112
Summary external debt stock by creditor typeLong-term external debt stocks 2,782 6,648 7,246 8,880 9,717 11,678 Public and publicly guaranteed debt from: 2,167 5,731 6,234 7,954 9,014 10,275 Official creditors 2,156 4,746 5,283 6,880 7,800 8,954 Multilateral 687 1,619 1,886 2,448 3,208 3,768 of which: World Bank 303 798 897 1,306 1,432 1,733 Bilateral 1,469 3,127 3,396 4,431 4,592 5,186 Private creditors 11 984 951 1,075 1,214 1,321 Bondholders .. 750 687 687 687 687 Commercial banks and others 11 234 265 388 527 635 Private nonguaranteed debt from: 615 918 1,012 925 703 1,403 Bondholders .. .. .. .. .. .. Commercial banks and others 615 918 1,012 925 703 1,403Use of IMF credit 453 358 318 602 714 760
Net financial inflowsNet debt inflows Use of IMF credit 147 -31 -30 258 128 50 Long-term 12 1,386 845 1,235 1,071 1,856 Official creditors 24 547 896 1,318 1,112 1,230 Multilateral 71 209 247 480 857 599 of which: World Bank 41 90 127 353 165 312 Bilateral -47 339 649 837 255 630 Private creditors -12 839 -51 -82 -41 626 Bondholders .. 750 -63 .. .. .. Banks and others -12 89 12 -82 -41 626 Short-term 0 123 -36 262 -95 -62Net equity inflows Foreign direct investment 817 65 48 219 476 782 Portfolio equity 0 -21 0 0 0 ..
Debt ratiosExternal debt stocks to exports (%) 59 106 121 148 145 ..External debt stocks to GNI (%) 12 24 24 29 29 34Debt service to exports (%) 7 7 14 11 14 ..Short-term to external debt stocks (%) 0 4 3 5 4 3Multilateral to external debt stocks (%) 21 22 24 24 30 29Reserves to external debt stocks (%) 114 48 28 32 32 ..Gross national income (GNI) 25,904 30,492 32,085 34,348 37,875 38,004

54
CENTRAL AFRICAN REPUBLIC(US$ million, unless otherwise indicated)
2009 2015 2016 2017 2018 2019Summary external debt data by debtor typeTotal external debt stocks 550.6 730.7 735.3 762.5 819.5 880.2 Use of IMF credit 162.1 174.9 184.6 235.4 279.1 296.5 Long-term external debt 303.1 465.5 461.9 438.2 452.0 451.8 Public and publicly guaranteed sector 303.1 465.5 461.9 438.2 452.0 451.8 Public sector 303.1 465.5 461.9 438.2 452.0 451.8 of which: General government 282.2 450.6 447.5 435.2 449.4 450.1 Private sector guaranteed by public sector .. .. .. .. .. .. Private sector not guaranteed .. .. .. .. .. .. Short-term external debt 85.5 90.3 88.7 88.9 88.4 131.9
Disbursements (long-term) 22.6 88.1 11.0 14.6 61.1 27.5 Public and publicly guaranteed sector 22.6 88.1 11.0 14.6 61.1 27.5 Public sector 22.6 88.1 11.0 14.6 61.1 27.5 of which: General government 22.6 88.1 11.0 14.6 61.1 27.5 Private sector guaranteed by public sector .. .. .. .. .. .. Private sector not guaranteed .. .. .. .. .. ..
Principal repayments (long-term) 8.4 0.9 4.3 15.3 9.9 14.2 Public and publicly guaranteed sector 8.4 0.9 4.3 15.3 9.9 14.2 Public sector 8.4 0.9 4.3 15.3 9.9 14.2 of which: General government 8.3 0.8 4.3 2.7 9.6 13.4 Private sector guaranteed by public sector .. .. .. .. .. .. Private sector not guaranteed .. .. .. .. .. ..
Interest payments (long-term) 3.0 2.6 1.5 3.2 2.0 2.2 Public and publicly guaranteed sector 3.0 2.6 1.5 3.2 2.0 2.2 Public sector 3.0 2.6 1.5 3.2 2.0 2.2 of which: General government 3.0 2.6 1.5 1.3 2.0 2.2 Private sector guaranteed by public sector .. .. .. .. .. .. Private sector not guaranteed .. .. .. .. .. ..
Summary external debt stock by creditor typeLong-term external debt stocks 303.1 465.5 461.9 438.2 452.0 451.8 Public and publicly guaranteed debt from: 303.1 465.5 461.9 438.2 452.0 451.8 Official creditors 266.7 419.7 416.2 392.2 406.1 407.2 Multilateral 49.8 75.6 78.5 95.9 151.8 149.9 of which: World Bank 9.0 58.6 59.9 64.2 98.5 107.0 Bilateral 217.0 344.1 337.7 296.3 254.3 257.3 Private creditors 36.3 45.8 45.7 46.0 45.9 44.6 Bondholders .. .. .. .. .. .. Commercial banks and others 36.3 45.8 45.7 46.0 45.9 44.6 Private nonguaranteed debt from: .. .. .. .. .. .. Bondholders .. .. .. .. .. .. Commercial banks and others .. .. .. .. .. ..Use of IMF credit 162.1 174.9 184.6 235.4 279.1 296.5
Net financial inflowsNet debt inflows Use of IMF credit 20.3 5.4 15.5 38.8 50.1 19.0 Long-term 14.2 87.2 6.7 -0.6 51.2 13.2 Official creditors 12.4 67.2 6.7 -0.6 51.2 13.2 Multilateral -2.2 8.7 4.5 13.4 59.7 2.2 of which: World Bank 2.1 7.9 3.1 1.1 37.1 9.0 Bilateral 14.6 58.5 2.2 -14.0 -8.5 11.0 Private creditors 1.8 20.0 0.0 0.0 0.0 0.0 Bondholders .. .. .. .. .. .. Banks and others 1.8 20.0 0.0 0.0 0.0 0.0 Short-term -8.0 -0.8 -2.7 0.6 -0.2 10.3Net equity inflows Foreign direct investment 42.3 3.0 7.3 6.9 18.0 25.6 Portfolio equity .. .. .. .. .. ..
Debt ratiosExternal debt stocks to exports (%) .. .. .. .. .. ..External debt stocks to GNI (%) 26.8 42.6 39.8 35.0 34.3 36.9Debt service to exports (%) .. .. .. .. .. ..Short-term to external debt stocks (%) 15.5 12.4 12.1 11.7 10.8 15.0Multilateral to external debt stocks (%) 9.0 10.3 10.7 12.6 18.5 17.0Reserves to external debt stocks (%) 38.2 29.3 32.6 47.6 44.1 ..Gross national income (GNI) 2,053.3 1,716.9 1,847.8 2,177.9 2,386.7 2,386.0

55
CHAD(US$ million, unless otherwise indicated)
2009 2015 2016 2017 2018 2019Summary external debt data by debtor typeTotal external debt stocks 1,874 2,894 3,034 3,405 3,523 3,571 Use of IMF credit 113 137 193 254 395 470 Long-term external debt 1,750 2,756 2,824 3,123 3,098 3,075 Public and publicly guaranteed sector 1,750 2,756 2,824 3,123 3,098 3,075 Public sector 1,750 2,756 2,824 3,123 3,098 3,075 of which: General government 1,715 2,756 2,824 3,123 3,098 3,075 Private sector guaranteed by public sector .. .. .. .. .. .. Private sector not guaranteed .. .. .. .. .. .. Short-term external debt 12 0 17 28 31 26
Disbursements (long-term) 34 51 151 242 52 20 Public and publicly guaranteed sector 34 51 151 242 52 20 Public sector 34 51 151 242 52 20 of which: General government 34 51 151 242 52 20 Private sector guaranteed by public sector .. .. .. .. .. .. Private sector not guaranteed .. .. .. .. .. ..
Principal repayments (long-term) 42 34 19 14 43 30 Public and publicly guaranteed sector 42 34 19 14 43 30 Public sector 42 34 19 14 43 30 of which: General government 41 34 19 14 43 30 Private sector guaranteed by public sector .. .. .. .. .. .. Private sector not guaranteed .. .. .. .. .. ..
Interest payments (long-term) 23 56 105 111 134 127 Public and publicly guaranteed sector 23 56 105 111 134 127 Public sector 23 56 105 111 134 127 of which: General government 23 56 105 111 134 127 Private sector guaranteed by public sector .. .. .. .. .. .. Private sector not guaranteed .. .. .. .. .. ..
Summary external debt stock by creditor typeLong-term external debt stocks 1,750 2,756 2,824 3,123 3,098 3,075 Public and publicly guaranteed debt from: 1,750 2,756 2,824 3,123 3,098 3,075 Official creditors 1,731 1,218 1,286 1,584 1,559 1,537 Multilateral 1,522 549 562 687 660 652 of which: World Bank 896 187 180 189 181 176 Bilateral 210 668 724 897 898 884 Private creditors 19 1,539 1,539 1,539 1,539 1,539 Bondholders .. .. .. .. .. .. Commercial banks and others 19 1,539 1,539 1,539 1,539 1,539 Private nonguaranteed debt from: .. .. .. .. .. .. Bondholders .. .. .. .. .. .. Commercial banks and others .. .. .. .. .. ..Use of IMF credit 113 137 193 254 395 470
Net financial inflowsNet debt inflows Use of IMF credit -13 44 62 49 149 77 Long-term -8 17 132 228 10 -10 Official creditors -7 17 132 228 10 -10 Multilateral -2 10 57 84 -9 -2 of which: World Bank -15 -10 -2 -1 -4 -4 Bilateral -5 7 75 143 18 -8 Private creditors -1 .. 0 0 0 0 Bondholders .. .. .. .. .. .. Banks and others -1 .. 0 0 0 0 Short-term 8 0 0 0 0 0Net equity inflows Foreign direct investment 375 560 245 363 461 567 Portfolio equity .. .. .. .. .. ..
Debt ratiosExternal debt stocks to exports (%) .. .. .. .. .. ..External debt stocks to GNI (%) 21 27 31 34 32 32Debt service to exports (%) .. .. .. .. .. ..Short-term to external debt stocks (%) 1 0 1 1 1 1Multilateral to external debt stocks (%) 81 19 19 20 19 18Reserves to external debt stocks (%) 33 13 0 0 4 ..Gross national income (GNI) 8,868 10,618 9,912 9,870 11,075 11,141

56
CHINA(US$ million, unless otherwise indicated)
2009 2015 2016 2017 2018 2019Summary external debt data by debtor typeTotal external debt stocks 454,515 1,333,777 1,413,804 1,704,516 1,961,528 2,114,163 Use of IMF credit 10,958 9,686 9,396 9,954 9,721 9,665 Long-term external debt 203,049 501,847 603,012 663,929 732,906 899,185 Public and publicly guaranteed sector 100,892 146,070 160,192 196,294 259,689 318,065 Public sector 100,749 146,009 160,144 196,260 259,669 318,058 of which: General government 55,343 98,751 99,109 101,853 126,558 161,780 Private sector guaranteed by public sector 143 61 48 34 20 7 Private sector not guaranteed 102,157 355,777 442,820 467,635 473,217 581,120 Short-term external debt 240,509 822,244 801,396 1,030,633 1,218,901 1,205,312
Disbursements (long-term) 24,317 108,771 162,013 227,029 247,602 338,243 Public and publicly guaranteed sector 7,150 26,681 20,639 51,019 79,731 79,493 Public sector 7,150 26,681 20,639 51,019 79,731 79,493 of which: General government 3,314 13,873 10,264 6,482 29,611 38,598 Private sector guaranteed by public sector 0 0 0 0 0 0 Private sector not guaranteed 17,167 82,090 141,374 176,010 167,870 258,750
Principal repayments (long-term) 33,468 84,115 131,319 144,688 160,496 180,605 Public and publicly guaranteed sector 6,492 32,254 16,476 15,447 15,293 20,634 Public sector 6,477 32,240 16,462 15,433 15,279 20,620 of which: General government 3,034 3,678 9,951 3,775 4,779 3,376 Private sector guaranteed by public sector 15 14 14 14 14 14 Private sector not guaranteed 26,976 51,862 114,844 129,241 145,203 159,972
Interest payments (long-term) 3,206 9,414 11,211 16,565 27,184 35,730 Public and publicly guaranteed sector 2,191 2,370 2,035 3,350 6,135 8,670 Public sector 2,188 2,370 2,034 3,349 6,134 8,670 of which: General government 1,334 665 754 1,479 2,825 3,387 Private sector guaranteed by public sector 3 1 1 1 1 1 Private sector not guaranteed 1,015 7,044 9,175 13,215 21,049 27,059
Summary external debt stock by creditor typeLong-term external debt stocks 203,049 501,847 603,012 663,929 732,906 899,185 Public and publicly guaranteed debt from: 100,892 146,070 160,192 196,294 259,689 318,065 Official creditors 75,211 53,659 59,894 56,215 54,502 53,840 Multilateral 33,493 33,568 33,430 34,191 34,439 35,427 of which: World Bank 22,461 17,048 16,215 16,356 16,095 16,271 Bilateral 41,718 20,091 26,464 22,025 20,062 18,413 Private creditors 25,681 92,410 100,298 140,079 205,188 264,225 Bondholders 11,626 66,945 69,469 101,554 163,960 214,523 Commercial banks and others 14,055 25,466 30,829 38,524 41,228 49,701 Private nonguaranteed debt from: 102,157 355,777 442,820 467,635 473,217 581,120 Bondholders 7,020 84,370 101,999 152,191 179,902 234,623 Commercial banks and others 95,137 271,408 340,821 315,443 293,314 346,497Use of IMF credit 10,958 9,686 9,396 9,954 9,721 9,665
Net financial inflowsNet debt inflows Use of IMF credit .. .. .. .. .. .. Long-term -9,151 24,655 30,694 82,340 87,106 157,638 Official creditors 1,366 -3,893 -3,814 -3,653 -1,702 -698 Multilateral 1,120 -226 31 399 382 1,063 of which: World Bank -38 -623 -727 -15 -205 205 Bilateral 246 -3,667 -3,844 -4,052 -2,083 -1,761 Private creditors -10,516 28,548 34,508 85,993 88,808 158,336 Bondholders -39 8,776 22,273 82,189 94,185 105,319 Banks and others -10,477 19,773 12,234 3,805 -5,377 53,017 Short-term 53,321 -417,208 -20,848 229,237 188,268 -13,589Net equity inflows Foreign direct investment 126,956 211,785 164,930 140,569 185,911 131,251 Portfolio equity 29,117 14,964 23,416 36,209 60,668 44,906
Debt ratiosExternal debt stocks to exports (%) 33 52 58 63 68 73External debt stocks to GNI (%) 9 12 13 14 14 15Debt service to exports (%) 3 5 7 8 8 10Short-term to external debt stocks (%) 53 62 57 60 62 57Multilateral to external debt stocks (%) 7 3 2 2 2 2Reserves to external debt stocks (%) 532 251 214 185 158 148Gross national income (GNI) 5,093,171 11,019,762 11,188,326 12,300,722 13,843,520 14,308,060

57
COLOMBIA(US$ million, unless otherwise indicated)
2009 2015 2016 2017 2018 2019Summary external debt data by debtor typeTotal external debt stocks 53,678 113,363 120,504 125,546 132,742 138,695 Use of IMF credit 1,157 1,023 993 1,051 1,027 1,021 Long-term external debt 48,508 100,405 108,231 111,466 116,798 121,746 Public and publicly guaranteed sector 35,547 69,100 73,026 73,968 74,384 74,587 Public sector 35,020 68,844 72,780 73,731 74,161 74,377 of which: General government 29,950 45,479 47,784 50,856 54,100 54,522 Private sector guaranteed by public sector 527 256 246 237 224 210 Private sector not guaranteed 12,961 31,306 35,205 37,498 42,414 47,159 Short-term external debt 4,013 11,935 11,280 13,029 14,918 15,928
Disbursements (long-term) 13,136 19,254 18,508 17,291 22,912 15,786 Public and publicly guaranteed sector 8,095 10,414 6,857 7,074 6,887 5,036 Public sector 8,044 10,414 6,857 7,074 6,887 5,036 of which: General government 5,618 6,854 4,611 5,454 5,712 3,779 Private sector guaranteed by public sector 51 0 .. 0 0 0 Private sector not guaranteed 5,041 8,840 11,651 10,217 16,025 10,750
Principal repayments (long-term) 5,929 9,120 10,494 16,280 17,863 12,065 Public and publicly guaranteed sector 1,803 1,754 2,742 6,651 6,754 4,658 Public sector 1,803 1,745 2,733 6,642 6,741 4,644 of which: General government 1,454 1,374 2,058 2,887 2,143 3,248 Private sector guaranteed by public sector 0 10 10 10 13 13 Private sector not guaranteed 4,126 7,365 7,752 9,628 11,109 7,408
Interest payments (long-term) 2,708 4,555 4,820 5,480 5,875 6,401 Public and publicly guaranteed sector 1,981 3,103 3,117 3,528 3,581 3,802 Public sector 1,966 3,100 3,111 3,522 3,574 3,794 of which: General government 1,751 2,041 2,005 2,278 2,257 2,498 Private sector guaranteed by public sector 15 3 5 5 7 7 Private sector not guaranteed 727 1,452 1,703 1,952 2,293 2,600
Summary external debt stock by creditor typeLong-term external debt stocks 48,508 100,405 108,231 111,466 116,798 121,746 Public and publicly guaranteed debt from: 35,547 69,100 73,026 73,968 74,384 74,587 Official creditors 15,328 23,120 24,970 25,351 27,522 27,552 Multilateral 14,793 18,090 19,764 20,325 21,795 22,468 of which: World Bank 6,571 8,610 9,516 9,520 10,233 10,582 Bilateral 535 5,030 5,206 5,026 5,727 5,083 Private creditors 20,219 45,980 48,056 48,617 46,862 47,035 Bondholders 17,438 38,508 39,601 42,576 40,852 41,581 Commercial banks and others 2,781 7,472 8,456 6,041 6,011 5,454 Private nonguaranteed debt from: 12,961 31,306 35,205 37,498 42,414 47,159 Bondholders 2,709 8,650 9,146 10,206 9,521 10,481 Commercial banks and others 10,252 22,656 26,058 27,292 32,892 36,677Use of IMF credit 1,157 1,023 993 1,051 1,027 1,021
Net financial inflowsNet debt inflows Use of IMF credit .. .. .. .. .. .. Long-term 7,207 10,134 8,014 1,011 5,049 3,721 Official creditors 1,467 1,286 2,039 152 2,501 180 Multilateral 1,579 1,003 1,861 344 1,683 795 of which: World Bank 1,115 357 945 -279 908 410 Bilateral -112 283 178 -192 818 -615 Private creditors 5,740 8,848 5,976 859 2,547 3,541 Bondholders 6,759 5,409 1,606 3,820 -2,284 1,715 Banks and others -1,018 3,439 4,369 -2,961 4,831 1,826 Short-term -1,620 -286 -655 1,749 1,889 1,011Net equity inflows Foreign direct investment 7,303 9,718 9,176 12,043 9,931 12,162 Portfolio equity 67 640 -363 472 -823 -1,232
Debt ratiosExternal debt stocks to exports (%) 134 225 257 234 220 233External debt stocks to GNI (%) 24 39 43 41 41 44Debt service to exports (%) 22 28 34 42 41 32Short-term to external debt stocks (%) 7 11 9 10 11 11Multilateral to external debt stocks (%) 28 16 16 16 16 16Reserves to external debt stocks (%) 46 41 38 37 36 37Gross national income (GNI) 225,258 289,331 279,763 306,185 325,127 313,494

58
COMOROS(US$ million, unless otherwise indicated)
2009 2015 2016 2017 2018 2019Summary external debt data by debtor typeTotal external debt stocks 286.8 130.6 190.6 197.2 255.6 275.6 Use of IMF credit 23.4 29.2 26.6 26.1 22.3 30.7 Long-term external debt 258.6 99.9 162.5 170.1 232.0 243.3 Public and publicly guaranteed sector 258.6 99.9 162.5 170.1 232.0 243.3 Public sector 258.6 99.9 162.5 170.1 232.0 243.3 of which: General government 258.6 99.9 132.8 140.0 152.8 165.6 Private sector guaranteed by public sector .. .. .. .. .. .. Private sector not guaranteed .. .. .. .. .. .. Short-term external debt 4.7 1.5 1.5 1.1 1.2 1.6
Disbursements (long-term) 0.3 .. 69.4 5.5 68.2 14.5 Public and publicly guaranteed sector 0.3 .. 69.4 5.5 68.2 14.5 Public sector 0.3 .. 69.4 5.5 68.2 14.5 of which: General government 0.3 .. 37.0 5.5 14.1 14.5 Private sector guaranteed by public sector .. .. .. .. .. .. Private sector not guaranteed .. .. .. .. .. ..
Principal repayments (long-term) 7.2 6.9 4.4 1.9 2.0 0.7 Public and publicly guaranteed sector 7.2 6.9 4.4 1.9 2.0 0.7 Public sector 7.2 6.9 4.4 1.9 2.0 0.7 of which: General government 7.2 6.9 3.1 0.3 0.4 0.7 Private sector guaranteed by public sector .. .. .. .. .. .. Private sector not guaranteed .. .. .. .. .. ..
Interest payments (long-term) 2.9 0.2 0.2 0.1 1.0 0.1 Public and publicly guaranteed sector 2.9 0.2 0.2 0.1 1.0 0.1 Public sector 2.9 0.2 0.2 0.1 1.0 0.1 of which: General government 2.9 0.2 0.2 0.1 0.7 0.1 Private sector guaranteed by public sector .. .. .. .. .. .. Private sector not guaranteed .. .. .. .. .. ..
Summary external debt stock by creditor typeLong-term external debt stocks 258.6 99.9 162.5 170.1 232.0 243.3 Public and publicly guaranteed debt from: 258.6 99.9 162.5 170.1 232.0 243.3 Official creditors 258.6 99.9 162.5 170.1 232.0 243.3 Multilateral 213.0 56.9 53.2 54.2 54.0 68.0 of which: World Bank 120.4 13.5 12.9 13.3 12.7 12.3 Bilateral 45.6 43.0 109.3 115.8 178.0 175.3 Private creditors .. .. .. .. .. .. Bondholders .. .. .. .. .. .. Commercial banks and others .. .. .. .. .. .. Private nonguaranteed debt from: .. .. .. .. .. .. Bondholders .. .. .. .. .. .. Commercial banks and others .. .. .. .. .. ..Use of IMF credit 23.4 29.2 26.6 26.1 22.3 30.7
Net financial inflowsNet debt inflows Use of IMF credit 4.8 -0.4 -1.8 -2.0 -3.2 8.5 Long-term -6.9 -6.9 64.9 3.6 66.2 13.9 Official creditors -6.9 -6.9 64.9 3.6 66.2 13.9 Multilateral -6.9 -2.0 -3.1 -0.3 0.3 14.1 of which: World Bank -2.7 -0.3 -0.3 -0.3 -0.3 -0.3 Bilateral .. -4.9 68.0 3.9 65.9 -0.3 Private creditors .. .. .. .. .. .. Bondholders .. .. .. .. .. .. Banks and others .. .. .. .. .. .. Short-term 0.0 0.0 0.0 0.0 0.0 0.0Net equity inflows Foreign direct investment 13.8 4.9 3.6 3.9 6.9 7.9 Portfolio equity 0.0 .. .. .. .. ..
Debt ratiosExternal debt stocks to exports (%) 353.1 126.6 164.6 145.0 158.9 181.7External debt stocks to GNI (%) 31.8 13.5 18.7 18.2 21.6 23.2Debt service to exports (%) 14.6 7.2 5.5 3.0 3.8 3.1Short-term to external debt stocks (%) 1.7 1.1 0.8 0.6 0.5 0.6Multilateral to external debt stocks (%) 74.3 43.6 27.9 27.5 21.1 24.7Reserves to external debt stocks (%) 52.4 153.1 83.3 105.0 77.7 73.0Gross national income (GNI) 900.5 969.9 1,018.2 1,083.4 1,185.4 1,190.5

59
CONGO, DEMOCRATIC REPUBLIC OF(US$ million, unless otherwise indicated)
2009 2015 2016 2017 2018 2019Summary external debt data by debtor typeTotal external debt stocks 13,093 5,328 5,022 5,084 4,956 5,438 Use of IMF credit 1,601 1,098 989 954 839 1,130 Long-term external debt 10,873 4,065 3,817 4,004 4,023 4,099 Public and publicly guaranteed sector 10,873 4,065 3,817 4,004 4,023 4,099 Public sector 10,873 4,065 3,817 4,004 4,023 4,099 of which: General government 10,381 4,065 3,817 4,004 4,023 4,099 Private sector guaranteed by public sector .. .. .. .. .. .. Private sector not guaranteed .. .. .. .. .. .. Short-term external debt 619 165 215 126 94 209
Disbursements (long-term) 131 282 65 348 233 480 Public and publicly guaranteed sector 131 282 65 348 233 480 Public sector 131 282 65 348 233 480 of which: General government 131 282 65 348 233 480 Private sector guaranteed by public sector .. .. .. .. .. .. Private sector not guaranteed .. .. .. .. .. ..
Principal repayments (long-term) 225 222 271 182 180 366 Public and publicly guaranteed sector 225 222 271 182 180 366 Public sector 225 222 271 182 180 366 of which: General government 198 222 271 182 180 366 Private sector guaranteed by public sector .. .. .. .. .. .. Private sector not guaranteed .. .. .. .. .. ..
Interest payments (long-term) 241 134 132 119 98 824 Public and publicly guaranteed sector 241 134 132 119 98 824 Public sector 241 134 132 119 98 824 of which: General government 235 134 132 119 98 824 Private sector guaranteed by public sector .. .. .. .. .. .. Private sector not guaranteed .. .. .. .. .. ..
Summary external debt stock by creditor typeLong-term external debt stocks 10,873 4,065 3,817 4,004 4,023 4,099 Public and publicly guaranteed debt from: 10,873 4,065 3,817 4,004 4,023 4,099 Official creditors 10,525 4,055 3,816 4,003 3,993 3,997 Multilateral 4,186 1,872 1,724 1,995 2,037 2,122 of which: World Bank 2,497 841 827 942 1,098 1,288 Bilateral 6,339 2,182 2,091 2,008 1,956 1,875 Private creditors 349 11 2 1 30 102 Bondholders .. .. .. .. .. .. Commercial banks and others 349 11 2 1 30 102 Private nonguaranteed debt from: .. .. .. .. .. .. Bondholders .. .. .. .. .. .. Commercial banks and others .. .. .. .. .. ..Use of IMF credit 1,601 1,098 989 954 839 1,130
Net financial inflowsNet debt inflows Use of IMF credit 132 -38 -78 -92 -94 295 Long-term -94 60 -206 166 53 114 Official creditors -73 58 -197 166 37 41 Multilateral 53 -31 -126 182 73 93 of which: World Bank 78 -8 11 65 180 195 Bilateral -126 89 -71 -16 -36 -52 Private creditors -21 2 -9 -1 16 72 Bondholders .. .. .. .. .. .. Banks and others -21 2 -9 -1 16 72 Short-term -57 -17 15 9 -33 116Net equity inflows Foreign direct investment -243 1,674 1,205 1,340 1,617 1,478 Portfolio equity .. -94 0 -10 -7 -30
Debt ratiosExternal debt stocks to exports (%) 259 50 42 44 31 36External debt stocks to GNI (%) 73 15 14 14 11 12Debt service to exports (%) 12 4 4 3 2 8Short-term to external debt stocks (%) 5 3 4 2 2 4Multilateral to external debt stocks (%) 32 35 34 39 41 39Reserves to external debt stocks (%) 8 23 14 14 13 ..Gross national income (GNI) 17,863 35,127 36,345 36,946 45,550 45,879

60
CONGO, REPUBLIC OF(US$ million, unless otherwise indicated)
2009 2015 2016 2017 2018 2019Summary external debt data by debtor typeTotal external debt stocks 5,046 4,219 3,998 4,361 4,314 5,181 Use of IMF credit 168 123 116 120 115 157 Long-term external debt 4,623 3,648 3,696 3,969 3,933 4,801 Public and publicly guaranteed sector 4,623 3,648 3,696 3,969 3,933 4,801 Public sector 4,623 3,648 3,696 3,969 3,933 4,801 of which: General government 4,620 3,648 3,696 3,969 3,933 4,801 Private sector guaranteed by public sector .. .. .. .. .. .. Private sector not guaranteed .. .. .. .. .. .. Short-term external debt 256 448 187 272 266 223
Disbursements (long-term) 12 122 348 957 478 2,449 Public and publicly guaranteed sector 12 122 348 957 478 2,449 Public sector 12 122 348 957 478 2,449 of which: General government 12 122 348 957 478 2,449 Private sector guaranteed by public sector .. .. .. .. .. .. Private sector not guaranteed .. .. .. .. .. ..
Principal repayments (long-term) 114 338 259 289 301 405 Public and publicly guaranteed sector 114 338 259 289 301 405 Public sector 114 338 259 289 301 405 of which: General government 114 338 259 289 301 405 Private sector guaranteed by public sector .. .. .. .. .. .. Private sector not guaranteed .. .. .. .. .. ..
Interest payments (long-term) 63 34 33 34 79 84 Public and publicly guaranteed sector 63 34 33 34 79 84 Public sector 63 34 33 34 79 84 of which: General government 63 34 33 34 79 84 Private sector guaranteed by public sector .. .. .. .. .. .. Private sector not guaranteed .. .. .. .. .. ..
Summary external debt stock by creditor typeLong-term external debt stocks 4,623 3,648 3,696 3,969 3,933 4,801 Public and publicly guaranteed debt from: 4,623 3,648 3,696 3,969 3,933 4,801 Official creditors 3,626 2,827 2,970 3,401 3,462 4,429 Multilateral 446 224 259 687 675 894 of which: World Bank 298 110 122 153 192 243 Bilateral 3,181 2,604 2,711 2,713 2,787 3,535 Private creditors 996 821 726 569 471 372 Bondholders 454 399 377 350 322 295 Commercial banks and others 542 421 349 219 148 77 Private nonguaranteed debt from: .. .. .. .. .. .. Bondholders .. .. .. .. .. .. Commercial banks and others .. .. .. .. .. ..Use of IMF credit 168 123 116 120 115 157
Net financial inflowsNet debt inflows Use of IMF credit 4 -5 -4 -2 -2 43 Long-term -103 -215 88 668 177 2,044 Official creditors -44 -118 181 766 275 2,142 Multilateral -6 11 51 407 -2 223 of which: World Bank 1 10 16 23 43 53 Bilateral -38 -130 130 360 277 1,919 Private creditors -58 -97 -93 -99 -97 -98 Bondholders .. -18 -23 -27 -27 -27 Banks and others -58 -79 -70 -72 -70 -71 Short-term 121 240 -266 135 -63 -47Net equity inflows Foreign direct investment 555 -261 -232 4,417 4,315 3,366 Portfolio equity 1 .. .. .. .. ..
Debt ratiosExternal debt stocks to exports (%) 80 82 87 .. .. ..External debt stocks to GNI (%) 72 50 48 53 42 54Debt service to exports (%) 3 7 6 .. .. ..Short-term to external debt stocks (%) 5 11 5 6 6 4Multilateral to external debt stocks (%) 9 5 6 16 16 17Reserves to external debt stocks (%) 75 53 18 9 10 ..Gross national income (GNI) 6,979 8,469 8,384 8,191 10,318 9,640

61
COSTA RICA(US$ million, unless otherwise indicated)
2009 2015 2016 2017 2018 2019Summary external debt data by debtor typeTotal external debt stocks 7,760 23,589 25,563 25,616 28,369 29,823 Use of IMF credit 245 217 210 223 218 216 Long-term external debt 5,271 20,768 22,797 22,855 24,782 26,851 Public and publicly guaranteed sector 3,208 10,147 11,054 11,037 11,940 13,414 Public sector 3,208 10,147 11,054 11,037 11,940 13,414 of which: General government 2,315 5,845 6,142 6,264 6,581 8,457 Private sector guaranteed by public sector .. .. .. .. .. .. Private sector not guaranteed 2,063 10,621 11,744 11,817 12,841 13,437 Short-term external debt 2,243 2,604 2,555 2,538 3,370 2,755
Disbursements (long-term) 1,329 4,810 3,991 1,985 4,418 3,591 Public and publicly guaranteed sector 559 1,649 1,351 599 1,701 2,508 Public sector 559 1,649 1,351 599 1,701 2,508 of which: General government 257 1,229 434 248 449 2,006 Private sector guaranteed by public sector .. .. .. .. .. .. Private sector not guaranteed 770 3,161 2,640 1,386 2,716 1,083
Principal repayments (long-term) 849 1,687 1,721 1,797 2,024 1,959 Public and publicly guaranteed sector 573 318 444 485 897 1,073 Public sector 573 318 444 485 897 1,073 of which: General government 420 135 134 135 127 131 Private sector guaranteed by public sector .. .. .. .. .. .. Private sector not guaranteed 276 1,369 1,277 1,312 1,127 886
Interest payments (long-term) 342 1,028 1,055 1,109 1,261 1,123 Public and publicly guaranteed sector 218 823 601 638 687 674 Public sector 218 823 601 638 687 674 of which: General government 173 470 356 364 368 375 Private sector guaranteed by public sector .. .. .. .. .. .. Private sector not guaranteed 124 205 454 471 574 448
Summary external debt stock by creditor typeLong-term external debt stocks 5,271 20,768 22,797 22,855 24,782 26,851 Public and publicly guaranteed debt from: 3,208 10,147 11,054 11,037 11,940 13,414 Official creditors 1,578 2,658 3,176 3,230 4,662 4,910 Multilateral 1,180 2,337 2,751 2,777 4,199 4,443 of which: World Bank 58 602 736 788 903 955 Bilateral 398 321 426 453 464 466 Private creditors 1,630 7,489 7,877 7,807 7,278 8,504 Bondholders 1,310 5,750 6,251 6,250 6,250 7,600 Commercial banks and others 320 1,739 1,626 1,557 1,028 904 Private nonguaranteed debt from: 2,063 10,621 11,744 11,817 12,841 13,437 Bondholders .. 1,350 1,850 2,150 2,100 2,100 Commercial banks and others 2,063 9,271 9,894 9,667 10,741 11,337Use of IMF credit 245 217 210 223 218 216
Net financial inflowsNet debt inflows Use of IMF credit .. .. .. .. .. .. Long-term 480 3,123 2,270 188 2,394 1,632 Official creditors 168 322 519 184 1,333 209 Multilateral 94 278 414 171 1,321 208 of which: World Bank 17 2 135 52 115 52 Bilateral 75 45 105 13 12 1 Private creditors 312 2,800 1,751 3 1,061 1,423 Bondholders -300 1,000 1,001 299 -50 1,350 Banks and others 612 1,800 750 -296 1,111 73 Short-term -1,745 257 -49 -16 831 -614Net equity inflows Foreign direct investment 1,661 2,291 1,468 2,410 1,970 1,931 Portfolio equity 8 1 42 43 44 55
Debt ratiosExternal debt stocks to exports (%) 70 135 134 129 134 137External debt stocks to GNI (%) 26 45 47 46 50 51Debt service to exports (%) 11 16 15 15 16 14Short-term to external debt stocks (%) 29 11 10 10 12 9Multilateral to external debt stocks (%) 15 10 11 11 15 15Reserves to external debt stocks (%) 52 33 30 28 26 30Gross national income (GNI) 29,548 52,361 54,676 55,570 57,266 58,186

62
CÔTE D'IVOIRE(US$ million, unless otherwise indicated)
2009 2015 2016 2017 2018 2019Summary external debt data by debtor typeTotal external debt stocks 14,896 11,388 11,457 13,449 15,653 19,182 Use of IMF credit 839 1,508 1,495 1,738 1,814 1,915 Long-term external debt 13,574 9,879 9,693 11,683 13,702 16,378 Public and publicly guaranteed sector 12,726 8,510 8,369 10,445 12,690 15,099 Public sector 12,726 8,510 8,369 10,445 12,690 15,099 of which: General government 12,724 8,510 8,369 10,445 12,673 15,069 Private sector guaranteed by public sector .. .. .. .. .. .. Private sector not guaranteed 848 1,370 1,324 1,238 1,011 1,279 Short-term external debt 482 0 269 28 138 890
Disbursements (long-term) 405 2,661 1,237 3,232 3,318 4,968 Public and publicly guaranteed sector 85 2,660 897 3,091 3,198 4,396 Public sector 85 2,660 897 3,091 3,198 4,396 of which: General government 85 2,660 897 3,091 3,181 4,383 Private sector guaranteed by public sector .. .. .. .. .. .. Private sector not guaranteed 320 1 341 141 120 572
Principal repayments (long-term) 698 458 1,096 1,730 1,035 2,247 Public and publicly guaranteed sector 533 134 726 1,418 701 1,946 Public sector 533 134 726 1,418 701 1,946 of which: General government 533 134 726 1,418 701 1,946 Private sector guaranteed by public sector .. .. .. .. .. .. Private sector not guaranteed 165 324 370 312 334 302
Interest payments (long-term) 289 289 402 399 453 556 Public and publicly guaranteed sector 241 264 315 329 407 518 Public sector 241 264 315 329 407 518 of which: General government 241 264 315 329 406 517 Private sector guaranteed by public sector .. .. .. .. .. .. Private sector not guaranteed 48 26 87 70 47 38
Summary external debt stock by creditor typeLong-term external debt stocks 13,574 9,879 9,693 11,683 13,702 16,378 Public and publicly guaranteed debt from: 12,726 8,510 8,369 10,445 12,690 15,099 Official creditors 10,660 4,377 4,108 5,007 5,187 6,002 Multilateral 2,419 895 1,021 1,582 2,011 2,592 of which: World Bank 1,823 394 522 781 883 1,204 Bilateral 8,241 3,481 3,087 3,425 3,176 3,410 Private creditors 2,066 4,133 4,261 5,438 7,503 9,097 Bondholders 1,931 4,082 4,219 5,398 7,230 7,589 Commercial banks and others 135 51 43 40 273 1,508 Private nonguaranteed debt from: 848 1,370 1,324 1,238 1,011 1,279 Bondholders .. .. .. .. .. .. Commercial banks and others 848 1,370 1,324 1,238 1,011 1,279Use of IMF credit 839 1,508 1,495 1,738 1,814 1,915
Net financial inflowsNet debt inflows Use of IMF credit 158 82 33 150 119 111 Long-term -293 2,202 142 1,502 2,283 2,720 Official creditors -448 1,534 43 540 328 811 Multilateral -441 191 152 450 497 513 of which: World Bank -101 165 140 205 132 236 Bilateral -7 1,342 -109 90 -169 298 Private creditors 155 668 99 962 1,955 1,909 Bondholders .. 1,000 136 1,136 1,928 404 Banks and others 155 -332 -38 -173 27 1,506 Short-term 384 0 269 -241 110 752Net equity inflows Foreign direct investment 401 378 531 644 590 1,009 Portfolio equity 2 0 8 24 15 ..
Debt ratiosExternal debt stocks to exports (%) 118 89 95 102 117 ..External debt stocks to GNI (%) 64 25 24 27 28 34Debt service to exports (%) 9 6 13 17 12 ..Short-term to external debt stocks (%) 3 0 2 0 1 5Multilateral to external debt stocks (%) 16 8 9 12 13 14Reserves to external debt stocks (%) 22 41 .. .. .. ..Gross national income (GNI) 23,343 44,807 46,888 50,052 55,809 56,976

63
DJIBOUTI(US$ million, unless otherwise indicated)
2009 2015 2016 2017 2018 2019Summary external debt data by debtor typeTotal external debt stocks 898.1 1,226.5 1,701.1 2,266.8 2,321.2 2,552.4 Use of IMF credit 39.5 49.1 45.8 44.0 36.7 31.6 Long-term external debt 738.3 1,173.4 1,601.7 1,944.7 2,044.8 2,145.3 Public and publicly guaranteed sector 738.3 1,173.4 1,601.7 1,944.7 2,044.8 2,145.3 Public sector 738.3 1,173.4 1,601.7 1,944.7 2,044.8 2,145.3 of which: General government 622.4 500.7 712.5 914.1 963.4 1,035.8 Private sector guaranteed by public sector .. .. .. .. .. .. Private sector not guaranteed .. .. .. .. .. .. Short-term external debt 120.3 4.0 53.7 278.1 239.6 375.4
Disbursements (long-term) 67.4 415.2 472.9 337.1 140.6 136.3 Public and publicly guaranteed sector 67.4 415.2 472.9 337.1 140.6 136.3 Public sector 67.4 415.2 472.9 337.1 140.6 136.3 of which: General government 60.8 28.4 243.8 195.7 75.6 94.1 Private sector guaranteed by public sector .. .. .. .. .. .. Private sector not guaranteed .. .. .. .. .. ..
Principal repayments (long-term) 22.6 27.5 31.0 25.1 27.2 34.7 Public and publicly guaranteed sector 22.6 27.5 31.0 25.1 27.2 34.7 Public sector 22.6 27.5 31.0 25.1 27.2 34.7 of which: General government 10.8 19.2 23.4 18.3 17.4 21.8 Private sector guaranteed by public sector .. .. .. .. .. .. Private sector not guaranteed .. .. .. .. .. ..
Interest payments (long-term) 8.2 15.1 25.2 35.7 406.4 29.1 Public and publicly guaranteed sector 8.2 15.1 25.2 35.7 406.4 29.1 Public sector 8.2 15.1 25.2 35.7 406.4 29.1 of which: General government 5.3 6.7 6.1 11.9 13.2 16.7 Private sector guaranteed by public sector .. .. .. .. .. .. Private sector not guaranteed .. .. .. .. .. ..
Summary external debt stock by creditor typeLong-term external debt stocks 738.3 1,173.4 1,601.7 1,944.7 2,044.8 2,145.3 Public and publicly guaranteed debt from: 738.3 1,173.4 1,601.7 1,944.7 2,044.8 2,145.3 Official creditors 714.1 1,168.5 1,597.5 1,940.7 2,040.9 2,141.7 Multilateral 399.5 456.5 492.4 535.4 572.5 633.7 of which: World Bank 158.4 129.9 127.9 143.6 152.2 161.3 Bilateral 314.6 712.0 1,105.1 1,405.3 1,468.4 1,508.0 Private creditors 24.2 4.9 4.2 4.0 3.9 3.6 Bondholders .. .. .. .. .. .. Commercial banks and others 24.2 4.9 4.2 4.0 3.9 3.6 Private nonguaranteed debt from: .. .. .. .. .. .. Bondholders .. .. .. .. .. .. Commercial banks and others .. .. .. .. .. ..Use of IMF credit 39.5 49.1 45.8 44.0 36.7 31.6
Net financial inflowsNet debt inflows Use of IMF credit -1.9 -1.5 -1.9 -4.4 -6.3 -4.9 Long-term 44.8 387.7 441.9 312.0 113.4 101.5 Official creditors 49.9 390.3 442.6 312.2 113.6 101.8 Multilateral 35.0 41.1 43.0 24.7 43.8 62.3 of which: World Bank 5.5 -0.7 2.0 7.8 12.1 10.0 Bilateral 14.9 349.2 399.5 287.5 69.8 39.5 Private creditors -5.1 -2.7 -0.7 -0.2 -0.1 -0.3 Bondholders .. .. .. .. .. .. Banks and others -5.1 -2.7 -0.7 -0.2 -0.1 -0.3 Short-term -28.0 -74.0 49.1 220.4 -56.0 108.6Net equity inflows Foreign direct investment 96.9 143.8 160.0 164.9 170.0 181.9 Portfolio equity .. .. .. .. .. ..
Debt ratiosExternal debt stocks to exports (%) 205.8 34.4 62.0 54.1 50.2 48.8External debt stocks to GNI (%) 83.9 47.6 62.0 78.9 74.5 74.0Debt service to exports (%) 8.3 1.2 2.1 1.7 9.7 1.5Short-term to external debt stocks (%) 13.4 0.3 3.2 12.3 10.3 14.7Multilateral to external debt stocks (%) 44.5 37.2 28.9 23.6 24.7 24.8Reserves to external debt stocks (%) 26.9 29.7 23.9 24.5 19.6 19.7Gross national income (GNI) 1,070.8 2,574.6 2,745.4 2,874.2 3,113.7 3,451.5

64
DOMINICA(US$ million, unless otherwise indicated)
2009 2015 2016 2017 2018 2019Summary external debt data by debtor typeTotal external debt stocks 272 317 300 300 283 283 Use of IMF credit 32 27 24 24 22 21 Long-term external debt 218 285 267 264 248 251 Public and publicly guaranteed sector 218 285 267 264 248 251 Public sector 218 285 267 264 248 251 of which: General government 191 260 243 243 229 231 Private sector guaranteed by public sector .. .. .. .. .. .. Private sector not guaranteed .. .. .. .. .. .. Short-term external debt 22 6 9 11 13 12
Disbursements (long-term) 9 24 4 11 5 22 Public and publicly guaranteed sector 9 24 4 11 5 22 Public sector 9 24 4 11 5 22 of which: General government 8 15 2 10 4 19 Private sector guaranteed by public sector .. .. .. .. .. .. Private sector not guaranteed .. .. .. .. .. ..
Principal repayments (long-term) 15 14 18 20 18 19 Public and publicly guaranteed sector 15 14 18 20 18 19 Public sector 15 14 18 20 18 19 of which: General government 11 12 15 15 15 16 Private sector guaranteed by public sector .. .. .. .. .. .. Private sector not guaranteed .. .. .. .. .. ..
Interest payments (long-term) 6 7 7 8 9 7 Public and publicly guaranteed sector 6 7 7 8 9 7 Public sector 6 7 7 8 9 7 of which: General government 5 6 7 7 8 6 Private sector guaranteed by public sector .. .. .. .. .. .. Private sector not guaranteed .. .. .. .. .. ..
Summary external debt stock by creditor typeLong-term external debt stocks 218 285 267 264 248 251 Public and publicly guaranteed debt from: 218 285 267 264 248 251 Official creditors 144 225 209 207 193 183 Multilateral 118 133 127 129 124 122 of which: World Bank 29 26 24 33 34 36 Bilateral 26 92 81 78 69 61 Private creditors 74 61 58 57 55 68 Bondholders 57 29 29 30 30 45 Commercial banks and others 17 32 30 28 26 23 Private nonguaranteed debt from: .. .. .. .. .. .. Bondholders .. .. .. .. .. .. Commercial banks and others .. .. .. .. .. ..Use of IMF credit 32 27 24 24 22 21
Net financial inflowsNet debt inflows Use of IMF credit 4 7 -2 -1 -2 -1 Long-term -6 10 -14 -9 -13 4 Official creditors -4 9 -12 -8 -11 -9 Multilateral -1 5 -5 0 -4 -2 of which: World Bank 0 0 -1 7 2 2 Bilateral -3 4 -7 -8 -7 -7 Private creditors -2 1 -2 -1 -2 13 Bondholders -2 3 0 1 .. 15 Banks and others 0 -2 -2 -2 -2 -3 Short-term -2 0 0 2 2 -2Net equity inflows Foreign direct investment 26 18 42 25 14 33 Portfolio equity .. 0 0 0 0 ..
Debt ratiosExternal debt stocks to exports (%) 176 118 111 134 164 ..External debt stocks to GNI (%) 57 61 54 59 51 48Debt service to exports (%) 14 9 10 13 17 ..Short-term to external debt stocks (%) 8 2 3 4 5 4Multilateral to external debt stocks (%) 43 42 42 43 44 43Reserves to external debt stocks (%) 28 40 74 71 68 59Gross national income (GNI) 475 519 561 508 552 587

65
DOMINICAN REPUBLIC(US$ million, unless otherwise indicated)
2009 2015 2016 2017 2018 2019Summary external debt data by debtor typeTotal external debt stocks 11,854 26,727 28,291 31,168 33,974 35,919 Use of IMF credit 1,094 403 281 297 290 289 Long-term external debt 9,005 23,145 24,958 28,869 31,496 33,115 Public and publicly guaranteed sector 8,162 15,815 17,186 20,226 23,485 27,584 Public sector 8,158 15,813 17,185 20,225 23,484 27,584 of which: General government 7,287 15,579 17,044 20,136 23,436 27,547 Private sector guaranteed by public sector 4 1 1 1 1 0 Private sector not guaranteed 843 7,330 7,772 8,643 8,011 5,531 Short-term external debt 1,755 3,179 3,053 2,001 2,187 2,515
Disbursements (long-term) 1,483 6,096 3,724 5,055 5,073 4,963 Public and publicly guaranteed sector 1,483 5,020 2,259 3,780 4,104 4,963 Public sector 1,483 5,020 2,259 3,780 4,104 4,963 of which: General government 1,456 5,020 2,259 3,780 4,104 4,962 Private sector guaranteed by public sector 0 0 .. 0 0 0 Private sector not guaranteed .. 1,076 1,465 1,275 969 ..
Principal repayments (long-term) 896 3,782 2,075 1,961 1,478 3,280 Public and publicly guaranteed sector 896 2,757 861 808 808 800 Public sector 895 2,756 861 807 808 799 of which: General government 729 2,688 770 748 769 788 Private sector guaranteed by public sector 1 0 0 0 0 0 Private sector not guaranteed 0 1,026 1,214 1,154 670 2,480
Interest payments (long-term) 433 1,022 1,205 1,012 1,559 1,855 Public and publicly guaranteed sector 325 775 922 716 1,087 1,435 Public sector 324 775 922 716 1,087 1,435 of which: General government 283 767 917 713 1,085 1,435 Private sector guaranteed by public sector 0 0 0 0 0 0 Private sector not guaranteed 108 247 282 296 472 419
Summary external debt stock by creditor typeLong-term external debt stocks 9,005 23,145 24,958 28,869 31,496 33,115 Public and publicly guaranteed debt from: 8,162 15,815 17,186 20,226 23,485 27,584 Official creditors 5,479 5,678 5,818 5,710 5,986 6,608 Multilateral 2,614 4,150 4,439 4,454 4,704 5,093 of which: World Bank 756 932 933 923 923 939 Bilateral 2,865 1,528 1,379 1,256 1,281 1,515 Private creditors 2,683 10,137 11,368 14,516 17,499 20,976 Bondholders 490 8,312 9,812 13,212 16,308 18,755 Commercial banks and others 2,194 1,825 1,556 1,304 1,192 2,221 Private nonguaranteed debt from: 843 7,330 7,772 8,643 8,011 5,531 Bondholders 843 1,575 1,945 1,945 1,945 1,395 Commercial banks and others 0 5,755 5,827 6,698 6,066 4,136Use of IMF credit 1,094 403 281 297 290 289
Net financial inflowsNet debt inflows Use of IMF credit 261 -368 -114 .. .. .. Long-term 587 2,313 1,650 3,094 3,595 1,684 Official creditors 1,042 -1,252 157 -124 282 625 Multilateral 712 561 291 10 253 390 of which: World Bank 298 44 1 -10 0 16 Bilateral 331 -1,813 -134 -134 29 235 Private creditors -455 3,565 1,493 3,218 3,313 1,059 Bondholders -125 3,700 1,870 3,400 3,108 1,937 Banks and others -330 -135 -377 -182 205 -878 Short-term -182 693 -127 -1,051 186 328Net equity inflows Foreign direct investment 1,070 2,187 2,340 3,733 2,677 2,887 Portfolio equity 0 0 0 0 0 0
Debt ratiosExternal debt stocks to exports (%) 140 152 152 160 164 171External debt stocks to GNI (%) 25 39 39 41 42 42Debt service to exports (%) 17 30 19 16 15 25Short-term to external debt stocks (%) 15 12 11 6 6 7Multilateral to external debt stocks (%) 22 16 16 14 14 14Reserves to external debt stocks (%) 30 20 22 22 23 25Gross national income (GNI) 46,539 68,228 72,452 76,204 81,710 84,775

66
ECUADOR(US$ million, unless otherwise indicated)
2009 2015 2016 2017 2018 2019Summary external debt data by debtor typeTotal external debt stocks 13,366 28,402 35,377 41,152 44,935 51,725 Use of IMF credit 452 400 739 783 765 2,114 Long-term external debt 11,568 26,940 33,766 39,276 43,094 48,757 Public and publicly guaranteed sector 7,102 20,153 25,572 31,629 35,481 38,396 Public sector 7,076 20,126 25,547 31,606 35,461 38,379 of which: General government 6,592 18,806 23,770 29,208 33,620 37,174 Private sector guaranteed by public sector 26 27 25 23 20 18 Private sector not guaranteed 4,466 6,787 8,195 7,647 7,613 10,360 Short-term external debt 1,346 1,062 871 1,093 1,076 854
Disbursements (long-term) 1,180 7,370 9,991 10,228 10,360 9,625 Public and publicly guaranteed sector 384 4,762 7,326 8,895 7,153 6,877 Public sector 375 4,762 7,326 8,895 7,153 6,877 of which: General government 374 4,742 6,481 7,849 6,941 6,748 Private sector guaranteed by public sector 9 0 .. 0 0 0 Private sector not guaranteed 796 2,609 2,666 1,334 3,207 2,748
Principal repayments (long-term) 7,277 3,807 3,861 4,559 6,443 6,508 Public and publicly guaranteed sector 6,618 2,116 1,859 2,906 3,202 3,919 Public sector 6,618 2,114 1,857 2,904 3,200 3,917 of which: General government 6,570 1,841 1,469 2,476 2,431 3,152 Private sector guaranteed by public sector 0 2 2 2 2 2 Private sector not guaranteed 659 1,691 2,002 1,653 3,241 2,588
Interest payments (long-term) 592 1,278 1,507 2,032 2,663 2,792 Public and publicly guaranteed sector 400 1,057 1,200 1,753 2,238 2,385 Public sector 399 1,056 1,199 1,752 2,237 2,384 of which: General government 384 984 1,094 1,633 2,099 2,292 Private sector guaranteed by public sector 1 1 1 1 1 1 Private sector not guaranteed 191 221 306 279 425 407
Summary external debt stock by creditor typeLong-term external debt stocks 11,568 26,940 33,766 39,276 43,094 48,757 Public and publicly guaranteed debt from: 7,102 20,153 25,572 31,629 35,481 38,396 Official creditors 5,806 14,149 16,742 16,785 16,901 17,832 Multilateral 4,386 7,555 8,202 8,707 9,495 10,794 of which: World Bank 542 257 246 399 617 1,251 Bilateral 1,420 6,594 8,540 8,078 7,405 7,038 Private creditors 1,297 6,004 8,830 14,844 18,580 20,564 Bondholders 1,098 3,397 6,114 12,565 15,250 18,307 Commercial banks and others 198 2,607 2,716 2,278 3,330 2,257 Private nonguaranteed debt from: 4,466 6,787 8,195 7,647 7,613 10,360 Bondholders .. .. .. .. .. .. Commercial banks and others 4,466 6,787 8,195 7,647 7,613 10,360Use of IMF credit 452 400 739 783 765 2,114
Net financial inflowsNet debt inflows Use of IMF credit .. .. 364 0 0 1,353 Long-term -6,096 3,563 6,130 5,669 3,917 3,117 Official creditors -101 2,005 2,637 -11 180 956 Multilateral 54 1,617 649 519 813 1,306 of which: World Bank -82 73 -11 153 218 634 Bilateral -155 388 1,988 -530 -632 -350 Private creditors -5,995 1,558 3,493 5,680 3,737 2,161 Bondholders -6,090 376 2,717 6,451 2,685 3,057 Banks and others 95 1,182 776 -772 1,052 -896 Short-term -306 36 -206 206 -33 -235Net equity inflows Foreign direct investment 534 1,272 879 682 702 600 Portfolio equity 2 2 6 4 6 2
Debt ratiosExternal debt stocks to exports (%) 84 132 175 181 175 197External debt stocks to GNI (%) 22 29 36 40 43 50Debt service to exports (%) 50 24 27 29 36 36Short-term to external debt stocks (%) 10 4 2 3 2 2Multilateral to external debt stocks (%) 33 27 23 21 21 21Reserves to external debt stocks (%) 21 7 11 4 4 4Gross national income (GNI) 61,249 97,562 98,125 101,978 104,733 104,330

67
EGYPT, ARAB REPUBLIC OF(US$ million, unless otherwise indicated)
2009 2015 2016 2017 2018 2019Summary external debt data by debtor typeTotal external debt stocks 35,398 49,846 69,164 84,722 100,186 115,080 Use of IMF credit 1,408 1,245 3,856 7,401 9,220 13,130 Long-term external debt 31,428 44,177 53,362 66,193 80,625 90,665 Public and publicly guaranteed sector 31,354 44,154 53,206 65,787 80,179 90,305 Public sector 30,880 44,045 53,129 65,729 80,153 90,305 of which: General government 27,144 30,073 32,200 42,283 51,239 60,963 Private sector guaranteed by public sector 474 110 77 58 26 0 Private sector not guaranteed 74 23 157 406 446 360 Short-term external debt 2,561 4,424 11,945 11,128 10,341 11,284
Disbursements (long-term) 2,127 10,962 14,675 15,850 20,287 15,322 Public and publicly guaranteed sector 2,118 10,933 14,515 15,552 20,161 15,251 Public sector 2,118 10,933 14,515 15,552 20,161 15,251 of which: General government 1,601 7,849 6,280 11,927 11,302 12,329 Private sector guaranteed by public sector 0 0 .. .. .. .. Private sector not guaranteed 9 29 160 298 126 71
Principal repayments (long-term) 2,054 2,887 5,106 4,622 5,119 4,633 Public and publicly guaranteed sector 2,035 2,859 5,102 4,575 5,032 4,477 Public sector 1,928 2,849 5,071 4,547 5,002 4,451 of which: General government 1,540 2,286 3,987 2,704 1,994 2,115 Private sector guaranteed by public sector 106 10 31 27 30 26 Private sector not guaranteed 20 28 3 48 87 156
Interest payments (long-term) 809 715 1,027 1,579 2,220 3,389 Public and publicly guaranteed sector 807 714 1,026 1,565 2,204 3,370 Public sector 788 713 1,024 1,564 2,203 3,369 of which: General government 692 604 785 1,105 1,616 2,209 Private sector guaranteed by public sector 19 1 1 1 1 1 Private sector not guaranteed 2 0 2 14 16 19
Summary external debt stock by creditor typeLong-term external debt stocks 31,428 44,177 53,362 66,193 80,625 90,665 Public and publicly guaranteed debt from: 31,354 44,154 53,206 65,787 80,179 90,305 Official creditors 28,467 37,854 47,544 52,767 55,970 57,636 Multilateral 8,723 11,716 15,846 18,876 20,119 21,508 of which: World Bank 3,250 5,597 7,114 8,435 9,930 11,250 Bilateral 19,743 26,138 31,698 33,891 35,851 36,128 Private creditors 2,887 6,300 5,662 13,020 24,209 32,669 Bondholders 2,175 4,850 3,600 10,000 15,800 23,273 Commercial banks and others 712 1,450 2,062 3,020 8,409 9,396 Private nonguaranteed debt from: 74 23 157 406 446 360 Bondholders .. .. .. .. .. .. Commercial banks and others 74 23 157 406 446 360Use of IMF credit 1,408 1,245 3,856 7,401 9,220 13,130
Net financial inflowsNet debt inflows Use of IMF credit .. .. 2,738 3,229 2,029 3,959 Long-term 73 8,075 9,570 11,227 15,168 10,689 Official creditors 134 5,673 10,020 3,772 3,790 1,866 Multilateral 909 1,185 4,304 2,562 1,426 1,454 of which: World Bank 545 723 1,545 1,289 1,507 1,321 Bilateral -776 4,488 5,716 1,210 2,364 411 Private creditors -61 2,402 -450 7,455 11,379 8,823 Bondholders .. 1,500 -1,250 6,400 5,868 7,887 Banks and others -61 902 800 1,055 5,511 937 Short-term -281 1,103 7,521 -817 -787 943Net equity inflows Foreign direct investment 6,712 6,925 8,107 7,409 8,141 9,010 Portfolio equity 393 14 610 224 220 -12
Debt ratiosExternal debt stocks to exports (%) 78 132 203 194 191 211External debt stocks to GNI (%) 19 15 21 37 41 39Debt service to exports (%) 7 10 20 15 15 16Short-term to external debt stocks (%) 7 9 17 13 10 10Multilateral to external debt stocks (%) 25 24 23 22 20 19Reserves to external debt stocks (%) 91 27 30 39 39 35Gross national income (GNI) 189,136 326,961 328,426 230,777 244,596 292,150

68
EL SALVADOR(US$ million, unless otherwise indicated)
2009 2015 2016 2017 2018 2019Summary external debt data by debtor typeTotal external debt stocks 10,406 15,570 16,567 17,179 17,392 18,061 Use of IMF credit 257 227 220 233 228 227 Long-term external debt 9,286 13,326 13,814 14,903 15,093 15,621 Public and publicly guaranteed sector 6,147 8,604 8,710 9,489 9,505 9,856 Public sector 6,144 8,603 8,710 9,489 9,505 9,856 of which: General government 5,525 7,969 7,965 8,655 8,727 9,063 Private sector guaranteed by public sector 3 1 0 0 0 .. Private sector not guaranteed 3,139 4,722 5,103 5,414 5,588 5,765 Short-term external debt 863 2,018 2,533 2,043 2,070 2,214
Disbursements (long-term) 1,216 1,259 1,029 3,513 2,945 4,960 Public and publicly guaranteed sector 910 394 410 978 588 1,419 Public sector 910 394 410 978 588 1,419 of which: General government 570 220 130 748 496 1,266 Private sector guaranteed by public sector .. .. .. .. .. .. Private sector not guaranteed 306 865 619 2,535 2,357 3,541
Principal repayments (long-term) 687 635 693 2,995 2,620 4,522 Public and publicly guaranteed sector 560 406 455 434 437 1,179 Public sector 560 405 455 434 437 1,179 of which: General government 254 241 284 292 290 1,039 Private sector guaranteed by public sector 0 0 0 0 0 .. Private sector not guaranteed 127 229 238 2,561 2,183 3,343
Interest payments (long-term) 476 643 660 768 889 1,029 Public and publicly guaranteed sector 374 494 514 547 589 684 Public sector 374 494 514 547 589 684 of which: General government 341 469 483 511 539 632 Private sector guaranteed by public sector 0 0 0 0 0 .. Private sector not guaranteed 102 149 145 221 300 345
Summary external debt stock by creditor typeLong-term external debt stocks 9,286 13,326 13,814 14,903 15,093 15,621 Public and publicly guaranteed debt from: 6,147 8,604 8,710 9,489 9,505 9,856 Official creditors 3,871 4,276 4,229 4,224 4,367 4,396 Multilateral 3,195 3,847 3,804 3,804 3,996 4,049 of which: World Bank 578 921 912 906 876 831 Bilateral 676 429 425 420 371 346 Private creditors 2,276 4,328 4,481 5,265 5,138 5,460 Bondholders 2,174 4,283 4,438 5,238 5,109 5,423 Commercial banks and others 103 45 43 27 29 37 Private nonguaranteed debt from: 3,139 4,722 5,103 5,414 5,588 5,765 Bondholders .. 38 38 38 38 12 Commercial banks and others 3,139 4,684 5,065 5,376 5,550 5,753Use of IMF credit 257 227 220 233 228 227
Net financial inflowsNet debt inflows Use of IMF credit .. .. .. .. .. .. Long-term 529 624 336 518 325 438 Official creditors 354 -7 -44 -26 148 30 Multilateral 395 -7 -37 -2 194 54 of which: World Bank 168 -27 -9 0 -31 -45 Bilateral -40 0 -7 -25 -46 -24 Private creditors 174 631 380 544 177 408 Bondholders 0 0 0 589 0 196 Banks and others 174 631 380 -44 177 212 Short-term -679 0 515 -490 27 143Net equity inflows Foreign direct investment 241 320 415 844 129 582 Portfolio equity 0 0 0 0 0 0
Debt ratiosExternal debt stocks to exports (%) 242 221 237 233 225 220External debt stocks to GNI (%) 61 70 72 73 71 70Debt service to exports (%) 27 19 20 52 46 68Short-term to external debt stocks (%) 8 13 15 12 12 12Multilateral to external debt stocks (%) 31 25 23 22 23 22Reserves to external debt stocks (%) 28 18 19 20 20 24Gross national income (GNI) 17,046 22,346 22,945 23,592 24,647 25,716

69
ERITREA(US$ million, unless otherwise indicated)
2009 2015 2016 2017 2018 2019Summary external debt data by debtor typeTotal external debt stocks 1,050.7 873.3 797.3 820.8 791.2 771.7 Use of IMF credit 23.8 21.0 20.4 21.6 21.1 21.0 Long-term external debt 1,013.0 782.4 750.3 772.0 736.1 718.1 Public and publicly guaranteed sector 1,013.0 782.4 750.3 772.0 736.1 718.1 Public sector 1,013.0 782.4 750.3 772.0 736.1 718.1 of which: General government 1,013.0 782.4 750.3 772.0 736.1 718.1 Private sector guaranteed by public sector .. .. .. .. .. .. Private sector not guaranteed .. .. .. .. .. .. Short-term external debt 13.9 69.9 26.6 27.1 34.0 32.7
Disbursements (long-term) 57.6 14.7 9.5 6.9 4.2 4.2 Public and publicly guaranteed sector 57.6 14.7 9.5 6.9 4.2 4.2 Public sector 57.6 14.7 9.5 6.9 4.2 4.2 of which: General government 57.6 14.7 9.5 6.9 4.2 4.2 Private sector guaranteed by public sector .. .. .. .. .. .. Private sector not guaranteed .. .. .. .. .. ..
Principal repayments (long-term) 11.3 28.8 23.4 23.7 24.9 18.4 Public and publicly guaranteed sector 11.3 28.8 23.4 23.7 24.9 18.4 Public sector 11.3 28.8 23.4 23.7 24.9 18.4 of which: General government 11.3 28.8 23.4 23.7 24.9 18.4 Private sector guaranteed by public sector .. .. .. .. .. .. Private sector not guaranteed .. .. .. .. .. ..
Interest payments (long-term) 10.3 3.8 3.5 3.2 3.1 2.6 Public and publicly guaranteed sector 10.3 3.8 3.5 3.2 3.1 2.6 Public sector 10.3 3.8 3.5 3.2 3.1 2.6 of which: General government 10.3 3.8 3.5 3.2 3.1 2.6 Private sector guaranteed by public sector .. .. .. .. .. .. Private sector not guaranteed .. .. .. .. .. ..
Summary external debt stock by creditor typeLong-term external debt stocks 1,013.0 782.4 750.3 772.0 736.1 718.1 Public and publicly guaranteed debt from: 1,013.0 782.4 750.3 772.0 736.1 718.1 Official creditors 972.1 751.5 720.3 738.0 703.6 686.2 Multilateral 657.5 572.5 557.5 587.3 571.6 567.1 of which: World Bank 476.8 432.9 420.0 444.9 434.5 432.0 Bilateral 314.6 179.0 162.8 150.7 132.0 119.0 Private creditors 40.9 30.9 29.9 34.1 32.5 31.9 Bondholders .. .. .. .. .. .. Commercial banks and others 40.9 30.9 29.9 34.1 32.5 31.9 Private nonguaranteed debt from: .. .. .. .. .. .. Bondholders .. .. .. .. .. .. Commercial banks and others .. .. .. .. .. ..Use of IMF credit 23.8 21.0 20.4 21.6 21.1 21.0
Net financial inflowsNet debt inflows Use of IMF credit .. .. .. .. .. .. Long-term 46.3 -14.1 -13.8 -16.8 -20.6 -14.2 Official creditors 46.3 -14.1 -13.8 -16.8 -20.6 -14.2 Multilateral 4.8 -0.4 -1.0 -1.6 -3.8 -1.7 of which: World Bank 0.8 0.0 0.0 0.0 0.0 .. Bilateral 41.6 -13.7 -12.8 -15.2 -16.8 -12.5 Private creditors .. .. 0.0 .. .. .. Bondholders .. .. .. .. .. .. Banks and others .. .. 0.0 .. .. .. Short-term -5.0 11.7 -45.7 -4.0 4.4 -4.4Net equity inflows Foreign direct investment 91.0 49.3 52.3 55.5 61.0 67.1 Portfolio equity .. .. .. .. .. ..
Debt ratiosExternal debt stocks to exports (%) .. .. .. .. .. ..External debt stocks to GNI (%) 57.1 .. .. .. .. ..Debt service to exports (%) .. .. .. .. .. ..Short-term to external debt stocks (%) 1.3 8.0 3.3 3.3 4.3 4.2Multilateral to external debt stocks (%) 62.6 65.6 69.9 71.6 72.2 73.5Reserves to external debt stocks (%) 8.6 16.6 18.2 17.5 20.6 24.8Gross national income (GNI) 1,840.5 .. .. .. .. ..

70
ESWATINI(US$ million, unless otherwise indicated)
2009 2015 2016 2017 2018 2019Summary external debt data by debtor typeTotal external debt stocks 524.2 367.5 487.6 652.2 515.4 631.3 Use of IMF credit 75.7 66.9 64.9 68.8 67.2 66.8 Long-term external debt 428.0 286.0 359.7 397.7 424.4 533.0 Public and publicly guaranteed sector 428.0 286.0 359.7 397.7 424.4 533.0 Public sector 428.0 286.0 359.7 397.7 424.4 533.0 of which: General government 416.6 281.2 348.9 386.8 413.6 522.2 Private sector guaranteed by public sector .. .. .. .. .. .. Private sector not guaranteed .. .. .. .. .. .. Short-term external debt 20.5 14.6 63.0 185.8 23.9 31.5
Disbursements (long-term) 14.7 38.9 99.8 55.7 69.5 142.5 Public and publicly guaranteed sector 14.7 38.9 99.8 55.7 69.5 142.5 Public sector 14.7 38.9 99.8 55.7 69.5 142.5 of which: General government 14.7 38.9 93.8 55.7 69.5 142.5 Private sector guaranteed by public sector .. .. .. .. .. .. Private sector not guaranteed .. .. .. .. .. ..
Principal repayments (long-term) 35.0 24.4 31.0 31.5 32.6 35.4 Public and publicly guaranteed sector 35.0 24.4 31.0 31.5 32.6 35.4 Public sector 35.0 24.4 31.0 31.5 32.6 35.4 of which: General government 32.0 24.4 31.0 31.5 32.6 35.4 Private sector guaranteed by public sector .. .. .. .. .. .. Private sector not guaranteed .. .. .. .. .. ..
Interest payments (long-term) 19.5 9.7 8.8 11.2 13.2 24.0 Public and publicly guaranteed sector 19.5 9.7 8.8 11.2 13.2 24.0 Public sector 19.5 9.7 8.8 11.2 13.2 24.0 of which: General government 18.5 9.7 8.8 11.2 13.2 24.0 Private sector guaranteed by public sector .. .. .. .. .. .. Private sector not guaranteed .. .. .. .. .. ..
Summary external debt stock by creditor typeLong-term external debt stocks 428.0 286.0 359.7 397.7 424.4 533.0 Public and publicly guaranteed debt from: 428.0 286.0 359.7 397.7 424.4 533.0 Official creditors 389.7 272.2 344.9 381.9 412.0 520.3 Multilateral 261.1 156.2 177.4 208.3 219.4 234.8 of which: World Bank 10.0 21.8 27.6 38.8 39.8 36.4 Bilateral 128.6 116.0 167.6 173.6 192.6 285.6 Private creditors 38.3 13.7 14.7 15.7 12.4 12.7 Bondholders .. .. .. .. .. .. Commercial banks and others 38.3 13.7 14.7 15.7 12.4 12.7 Private nonguaranteed debt from: .. .. .. .. .. .. Bondholders .. .. .. .. .. .. Commercial banks and others .. .. .. .. .. ..Use of IMF credit 75.7 66.9 64.9 68.8 67.2 66.8
Net financial inflowsNet debt inflows Use of IMF credit .. .. .. .. .. .. Long-term -20.3 14.5 68.8 24.1 36.8 107.1 Official creditors -18.9 15.4 69.6 24.7 38.0 107.1 Multilateral -11.5 -3.3 19.4 22.8 18.1 14.4 of which: World Bank -6.9 7.7 5.8 11.2 1.0 -3.4 Bilateral -7.4 18.7 50.2 1.9 20.0 92.7 Private creditors -1.4 -0.9 -0.8 -0.6 -1.2 0.0 Bondholders .. .. .. .. .. .. Banks and others -1.4 -0.9 -0.8 -0.6 -1.2 0.0 Short-term -31.0 -17.6 46.7 128.3 -168.5 6.8Net equity inflows Foreign direct investment 53.1 34.2 2.3 45.4 -14.1 112.1 Portfolio equity -6.6 .. .. .. .. ..
Debt ratiosExternal debt stocks to exports (%) 25.4 18.4 26.7 31.1 25.2 28.8External debt stocks to GNI (%) 15.0 8.9 13.4 15.6 11.9 16.3Debt service to exports (%) 2.7 1.7 2.2 2.2 2.3 2.8Short-term to external debt stocks (%) 3.9 4.0 12.9 28.5 4.6 5.0Multilateral to external debt stocks (%) 49.8 42.5 36.4 31.9 42.6 37.2Reserves to external debt stocks (%) 182.9 149.1 115.7 86.3 85.5 69.8Gross national income (GNI) 3,504.9 4,113.1 3,635.5 4,185.3 4,314.6 3,867.3

71
ETHIOPIA(US$ million, unless otherwise indicated)
2009 2015 2016 2017 2018 2019Summary external debt data by debtor typeTotal external debt stocks 5,360 20,519 23,474 26,233 27,793 28,288 Use of IMF credit 368 397 335 301 242 318 Long-term external debt 4,763 19,573 22,211 25,298 26,802 27,490 Public and publicly guaranteed sector 4,763 19,573 22,211 25,298 26,802 27,490 Public sector 4,763 19,573 22,211 25,298 26,802 27,490 of which: General government 3,252 10,635 12,236 14,343 15,367 16,633 Private sector guaranteed by public sector .. .. .. .. .. .. Private sector not guaranteed .. .. .. .. .. .. Short-term external debt 229 550 927 634 749 480
Disbursements (long-term) 2,148 4,412 3,694 3,520 3,462 2,319 Public and publicly guaranteed sector 2,148 4,412 3,694 3,520 3,462 2,319 Public sector 2,148 4,412 3,694 3,520 3,462 2,319 of which: General government 851 1,375 1,971 1,754 1,974 1,561 Private sector guaranteed by public sector .. .. .. .. .. .. Private sector not guaranteed .. .. .. .. .. ..
Principal repayments (long-term) 58 703 779 997 1,146 1,495 Public and publicly guaranteed sector 58 703 779 997 1,146 1,495 Public sector 58 703 779 997 1,146 1,495 of which: General government 31 95 110 146 169 215 Private sector guaranteed by public sector .. .. .. .. .. .. Private sector not guaranteed .. .. .. .. .. ..
Interest payments (long-term) 37 303 398 433 433 665 Public and publicly guaranteed sector 37 303 398 433 433 665 Public sector 37 303 398 433 433 665 of which: General government 23 158 168 166 201 207 Private sector guaranteed by public sector .. .. .. .. .. .. Private sector not guaranteed .. .. .. .. .. ..
Summary external debt stock by creditor typeLong-term external debt stocks 4,763 19,573 22,211 25,298 26,802 27,490 Public and publicly guaranteed debt from: 4,763 19,573 22,211 25,298 26,802 27,490 Official creditors 3,500 13,268 15,862 18,547 19,616 20,668 Multilateral 2,313 6,775 8,155 10,103 11,063 12,180 of which: World Bank 1,422 4,753 5,746 7,040 8,338 9,354 Bilateral 1,187 6,493 7,707 8,444 8,554 8,488 Private creditors 1,263 6,304 6,349 6,751 7,186 6,821 Bondholders .. 1,000 1,000 1,000 1,000 1,000 Commercial banks and others 1,263 5,304 5,349 5,751 6,186 5,821 Private nonguaranteed debt from: .. .. .. .. .. .. Bondholders .. .. .. .. .. .. Commercial banks and others .. .. .. .. .. ..Use of IMF credit 368 397 335 301 242 318
Net financial inflowsNet debt inflows Use of IMF credit 165 -36 -52 -52 -53 78 Long-term 2,090 3,709 2,915 2,523 2,317 824 Official creditors 1,067 2,360 2,866 2,159 1,860 1,137 Multilateral 728 1,058 1,613 1,500 1,706 1,180 of which: World Bank 549 685 1,177 933 1,494 1,075 Bilateral 339 1,302 1,252 659 154 -43 Private creditors 1,023 1,349 49 364 456 -313 Bondholders .. .. .. .. 0 0 Banks and others 1,023 1,349 49 364 456 -313 Short-term 171 258 378 -293 115 -270Net equity inflows Foreign direct investment 221 2,627 4,143 4,017 3,360 2,516 Portfolio equity 0 .. .. .. .. ..
Debt ratiosExternal debt stocks to exports (%) 156 341 397 394 361 368External debt stocks to GNI (%) 17 32 32 32 33 30Debt service to exports (%) 3 17 21 22 22 29Short-term to external debt stocks (%) 4 3 4 2 3 2Multilateral to external debt stocks (%) 43 33 35 39 40 43Reserves to external debt stocks (%) 33 19 13 12 14 11Gross national income (GNI) 32,396 64,327 74,054 81,285 83,892 95,641

72
FIJI(US$ million, unless otherwise indicated)
2009 2015 2016 2017 2018 2019Summary external debt data by debtor typeTotal external debt stocks 691.4 888.8 939.7 1,007.5 979.5 1,020.0 Use of IMF credit 105.2 93.0 90.2 95.6 93.3 92.8 Long-term external debt 530.1 714.4 752.3 848.3 841.6 874.3 Public and publicly guaranteed sector 319.5 616.9 661.6 716.9 713.6 700.9 Public sector 319.5 616.9 661.6 716.9 713.6 700.9 of which: General government 287.2 580.9 628.7 683.0 681.3 668.7 Private sector guaranteed by public sector .. .. .. .. .. .. Private sector not guaranteed 210.6 97.5 90.6 131.4 128.0 173.3 Short-term external debt 56.1 81.5 97.3 63.6 44.6 53.0
Disbursements (long-term) 107.8 227.9 96.5 137.6 36.8 69.4 Public and publicly guaranteed sector 20.0 227.9 96.5 59.4 36.8 17.1 Public sector 20.0 227.9 96.5 59.4 36.8 17.1 of which: General government 15.0 226.0 95.4 58.5 36.0 17.1 Private sector guaranteed by public sector .. .. .. .. .. .. Private sector not guaranteed 87.8 .. .. 78.2 .. 52.3
Principal repayments (long-term) 25.7 297.4 42.6 58.0 31.7 32.8 Public and publicly guaranteed sector 10.3 265.6 35.8 20.7 28.3 25.7 Public sector 10.3 265.6 35.8 20.7 28.3 25.7 of which: General government 10.3 259.5 31.6 20.7 25.8 25.7 Private sector guaranteed by public sector .. .. .. .. .. .. Private sector not guaranteed 15.3 31.8 6.8 37.4 3.4 7.1
Interest payments (long-term) 19.5 36.0 22.5 24.8 26.5 146.8 Public and publicly guaranteed sector 15.5 35.7 21.3 22.6 24.7 145.5 Public sector 15.5 35.7 21.3 22.6 24.7 145.5 of which: General government 13.5 35.7 21.0 22.6 24.7 145.5 Private sector guaranteed by public sector .. .. .. .. .. .. Private sector not guaranteed 3.9 0.3 1.2 2.3 1.8 1.3
Summary external debt stock by creditor typeLong-term external debt stocks 530.1 714.4 752.3 848.3 841.6 874.3 Public and publicly guaranteed debt from: 319.5 616.9 661.6 716.9 713.6 700.9 Official creditors 169.5 410.1 461.6 516.9 513.6 500.9 Multilateral 102.7 130.1 172.8 224.3 253.4 263.0 of which: World Bank 0.0 .. 50.2 53.6 73.1 76.2 Bilateral 66.8 280.0 288.8 292.6 260.1 238.0 Private creditors 150.0 206.9 200.0 200.0 200.0 200.0 Bondholders 150.0 206.9 200.0 200.0 200.0 200.0 Commercial banks and others .. .. .. .. .. .. Private nonguaranteed debt from: 210.6 97.5 90.6 131.4 128.0 173.3 Bondholders .. .. .. .. .. .. Commercial banks and others 210.6 97.5 90.6 131.4 128.0 173.3Use of IMF credit 105.2 93.0 90.2 95.6 93.3 92.8
Net financial inflowsNet debt inflows Use of IMF credit .. .. .. .. .. .. Long-term 82.1 -69.6 54.0 79.5 5.1 36.7 Official creditors 9.7 5.4 67.6 38.7 8.5 -8.6 Multilateral -1.7 -7.7 42.5 51.4 29.1 9.6 of which: World Bank -1.4 .. 50.2 3.4 19.5 3.1 Bilateral 11.4 13.1 25.1 -12.7 -20.6 -18.2 Private creditors 72.5 -75.0 -13.7 40.8 -3.4 45.3 Bondholders .. -43.2 -6.9 0.0 0.0 0.0 Banks and others 72.5 -31.8 -6.8 40.8 -3.4 45.3 Short-term 39.0 13.6 15.8 -33.6 -19.1 8.4Net equity inflows Foreign direct investment 284.8 208.9 379.2 418.3 434.7 397.4 Portfolio equity -1.1 .. .. .. .. ..
Debt ratiosExternal debt stocks to exports (%) 46.7 37.8 39.5 39.6 35.8 37.7External debt stocks to GNI (%) 24.2 19.9 19.9 20.0 19.0 20.1Debt service to exports (%) 3.1 14.3 2.8 3.3 2.2 6.7Short-term to external debt stocks (%) 8.1 9.2 10.4 6.3 4.5 5.2Multilateral to external debt stocks (%) 14.8 14.6 18.4 22.3 25.9 25.8Reserves to external debt stocks (%) 82.3 103.3 96.6 110.7 96.6 102.1Gross national income (GNI) 2,859.2 4,477.2 4,721.0 5,027.1 5,161.0 5,087.1

73
GABON(US$ million, unless otherwise indicated)
2009 2015 2016 2017 2018 2019Summary external debt data by debtor typeTotal external debt stocks 2,725 5,119 5,336 6,499 6,766 7,193 Use of IMF credit 230 203 197 412 601 722 Long-term external debt 2,392 4,706 4,898 5,880 5,978 6,112 Public and publicly guaranteed sector 2,392 4,706 4,898 5,880 5,978 6,112 Public sector 2,392 4,706 4,898 5,880 5,978 6,112 of which: General government 2,390 4,699 4,884 5,830 5,922 6,054 Private sector guaranteed by public sector .. .. .. .. .. .. Private sector not guaranteed .. .. .. .. .. .. Short-term external debt 104 210 241 207 187 360
Disbursements (long-term) 318 834 433 1,173 718 594 Public and publicly guaranteed sector 318 834 433 1,173 718 594 Public sector 318 834 433 1,173 718 594 of which: General government 318 831 425 1,152 691 589 Private sector guaranteed by public sector .. .. .. .. .. .. Private sector not guaranteed .. .. .. .. .. ..
Principal repayments (long-term) 275 274 172 450 474 387 Public and publicly guaranteed sector 275 274 172 450 474 387 Public sector 275 274 172 450 474 387 of which: General government 274 273 171 449 472 385 Private sector guaranteed by public sector .. .. .. .. .. .. Private sector not guaranteed .. .. .. .. .. ..
Interest payments (long-term) 147 194 195 168 216 252 Public and publicly guaranteed sector 147 194 195 168 216 252 Public sector 147 194 195 168 216 252 of which: General government 147 194 195 167 215 250 Private sector guaranteed by public sector .. .. .. .. .. .. Private sector not guaranteed .. .. .. .. .. ..
Summary external debt stock by creditor typeLong-term external debt stocks 2,392 4,706 4,898 5,880 5,978 6,112 Public and publicly guaranteed debt from: 2,392 4,706 4,898 5,880 5,978 6,112 Official creditors 1,133 1,646 1,672 2,672 3,043 3,397 Multilateral 460 569 563 1,450 1,697 1,920 of which: World Bank 18 46 67 336 369 581 Bilateral 673 1,077 1,108 1,222 1,346 1,477 Private creditors 1,259 3,060 3,226 3,207 2,935 2,715 Bondholders 901 2,218 2,218 2,200 2,186 2,186 Commercial banks and others 358 842 1,008 1,007 749 529 Private nonguaranteed debt from: .. .. .. .. .. .. Bondholders .. .. .. .. .. .. Commercial banks and others .. .. .. .. .. ..Use of IMF credit 230 203 197 412 601 722
Net financial inflowsNet debt inflows Use of IMF credit .. .. .. 198 202 123 Long-term 44 561 262 722 244 207 Official creditors -35 148 66 850 486 400 Multilateral 44 23 8 786 331 257 of which: World Bank -2 17 21 249 64 220 Bilateral -79 124 58 64 155 143 Private creditors 79 413 196 -128 -241 -193 Bondholders .. 500 .. -18 -14 .. Banks and others 79 -87 196 -110 -227 -193 Short-term -7 135 21 -37 -11 178Net equity inflows Foreign direct investment 608 -125 1,244 1,314 1,379 1,553 Portfolio equity 0 4 .. .. .. ..
Debt ratiosExternal debt stocks to exports (%) 40 93 .. .. .. ..External debt stocks to GNI (%) 25 39 41 46 43 46Debt service to exports (%) 6 9 .. .. .. ..Short-term to external debt stocks (%) 4 4 5 3 3 5Multilateral to external debt stocks (%) 17 11 11 22 25 27Reserves to external debt stocks (%) 73 36 15 15 20 ..Gross national income (GNI) 10,693 13,189 12,935 13,986 15,755 15,511

74
GAMBIA, THE(US$ million, unless otherwise indicated)
2009 2015 2016 2017 2018 2019Summary external debt data by debtor typeTotal external debt stocks 528.2 534.7 527.1 668.3 696.3 717.9 Use of IMF credit 75.2 88.4 80.0 93.9 84.1 77.2 Long-term external debt 409.6 434.8 429.4 560.6 594.5 616.6 Public and publicly guaranteed sector 409.6 434.8 429.4 560.6 594.5 616.6 Public sector 409.6 434.8 429.4 560.6 594.5 616.6 of which: General government 394.2 422.4 420.2 554.0 591.2 615.0 Private sector guaranteed by public sector .. .. .. .. .. .. Private sector not guaranteed .. .. .. .. .. .. Short-term external debt 43.3 11.5 17.6 13.7 17.8 24.0
Disbursements (long-term) 32.3 52.4 29.7 147.3 73.1 54.9 Public and publicly guaranteed sector 32.3 52.4 29.7 147.3 73.1 54.9 Public sector 32.3 52.4 29.7 147.3 73.1 54.9 of which: General government 30.9 52.4 29.7 147.3 73.1 54.9 Private sector guaranteed by public sector .. .. .. .. .. .. Private sector not guaranteed .. .. .. .. .. ..
Principal repayments (long-term) 11.9 30.5 30.3 30.6 32.5 31.9 Public and publicly guaranteed sector 11.9 30.5 30.3 30.6 32.5 31.9 Public sector 11.9 30.5 30.3 30.6 32.5 31.9 of which: General government 10.7 27.1 27.2 27.4 29.3 30.4 Private sector guaranteed by public sector .. .. .. .. .. .. Private sector not guaranteed .. .. .. .. .. ..
Interest payments (long-term) 7.1 5.2 6.0 6.5 6.7 8.6 Public and publicly guaranteed sector 7.1 5.2 6.0 6.5 6.7 8.6 Public sector 7.1 5.2 6.0 6.5 6.7 8.6 of which: General government 6.6 4.8 5.9 6.3 6.6 8.6 Private sector guaranteed by public sector .. .. .. .. .. .. Private sector not guaranteed .. .. .. .. .. ..
Summary external debt stock by creditor typeLong-term external debt stocks 409.6 434.8 429.4 560.6 594.5 616.6 Public and publicly guaranteed debt from: 409.6 434.8 429.4 560.6 594.5 616.6 Official creditors 406.2 428.6 425.1 557.7 593.5 616.6 Multilateral 290.7 310.6 303.7 406.5 436.2 451.1 of which: World Bank 64.3 55.0 57.2 105.1 115.8 117.7 Bilateral 115.5 118.1 121.4 151.2 157.3 165.6 Private creditors 3.4 6.2 4.3 2.9 0.9 0.0 Bondholders .. .. .. .. .. .. Commercial banks and others 3.4 6.2 4.3 2.9 0.9 0.0 Private nonguaranteed debt from: .. .. .. .. .. .. Bondholders .. .. .. .. .. .. Commercial banks and others .. .. .. .. .. ..Use of IMF credit 75.2 88.4 80.0 93.9 84.1 77.2
Net financial inflowsNet debt inflows Use of IMF credit 15.8 5.5 -5.9 8.9 -7.8 -6.3 Long-term 20.4 21.9 -0.6 116.7 40.6 22.9 Official creditors 19.7 23.7 1.2 118.6 42.5 23.8 Multilateral 20.7 11.0 -2.5 89.6 36.1 15.7 of which: World Bank 2.0 -0.2 4.0 43.9 13.3 2.5 Bilateral -1.0 12.7 3.7 29.0 6.5 8.2 Private creditors 0.8 -1.8 -1.8 -1.8 -1.9 -0.9 Bondholders .. .. .. .. .. .. Banks and others 0.8 -1.8 -1.8 -1.8 -1.9 -0.9 Short-term 27.0 -1.0 7.9 -3.9 3.7 7.5Net equity inflows Foreign direct investment 39.4 7.9 7.9 12.3 33.0 32.3 Portfolio equity .. .. .. .. .. ..
Debt ratiosExternal debt stocks to exports (%) 185.2 201.0 214.7 254.5 199.6 202.1External debt stocks to GNI (%) 37.1 40.4 36.5 45.5 43.6 41.4Debt service to exports (%) 6.8 15.5 17.3 16.9 13.6 13.4Short-term to external debt stocks (%) 8.2 2.1 3.3 2.1 2.6 3.3Multilateral to external debt stocks (%) 55.0 58.1 57.6 60.8 62.6 62.8Reserves to external debt stocks (%) 42.4 20.8 16.6 25.4 27.5 ..Gross national income (GNI) 1,422.1 1,322.3 1,442.5 1,469.9 1,595.5 1,733.8

75
GEORGIA(US$ million, unless otherwise indicated)
2009 2015 2016 2017 2018 2019Summary external debt data by debtor typeTotal external debt stocks 8,673 14,875 16,320 16,424 17,326 17,312 Use of IMF credit 1,012 330 307 397 416 448 Long-term external debt 6,736 12,501 13,659 13,584 14,593 14,588 Public and publicly guaranteed sector 3,529 5,721 6,224 6,615 6,749 6,993 Public sector 3,529 5,721 6,224 6,615 6,749 6,993 of which: General government 2,656 4,233 4,443 5,032 5,257 5,535 Private sector guaranteed by public sector .. .. .. .. .. .. Private sector not guaranteed 3,207 6,781 7,435 6,969 7,844 7,595 Short-term external debt 925 2,043 2,354 2,443 2,318 2,276
Disbursements (long-term) 1,147 2,545 2,780 2,003 2,468 2,369 Public and publicly guaranteed sector 678 733 839 536 567 616 Public sector 678 733 839 536 567 616 of which: General government 427 464 424 524 555 605 Private sector guaranteed by public sector .. .. .. .. .. .. Private sector not guaranteed 469 1,812 1,941 1,467 1,900 1,753
Principal repayments (long-term) 474 1,387 1,634 1,974 1,681 1,669 Public and publicly guaranteed sector 140 435 256 434 300 324 Public sector 140 435 256 434 300 324 of which: General government 71 118 132 165 227 280 Private sector guaranteed by public sector .. .. .. .. .. .. Private sector not guaranteed 334 952 1,379 1,540 1,381 1,345
Interest payments (long-term) 251 661 905 526 609 576 Public and publicly guaranteed sector 77 166 153 175 167 185 Public sector 77 166 153 175 167 185 of which: General government 69 79 87 99 111 122 Private sector guaranteed by public sector .. .. .. .. .. .. Private sector not guaranteed 174 495 752 351 442 391
Summary external debt stock by creditor typeLong-term external debt stocks 6,736 12,501 13,659 13,584 14,593 14,588 Public and publicly guaranteed debt from: 3,529 5,721 6,224 6,615 6,749 6,993 Official creditors 2,153 3,707 3,882 4,416 4,580 4,880 Multilateral 1,535 2,962 3,154 3,664 3,794 3,934 of which: World Bank 1,253 1,849 1,830 2,026 1,960 1,879 Bilateral 617 745 728 752 786 946 Private creditors 1,377 2,014 2,341 2,199 2,169 2,113 Bondholders 500 1,250 1,500 1,250 1,250 1,250 Commercial banks and others 877 764 841 949 919 863 Private nonguaranteed debt from: 3,207 6,781 7,435 6,969 7,844 7,595 Bondholders .. 900 1,054 1,152 1,660 1,875 Commercial banks and others 3,207 5,881 6,381 5,817 6,184 5,720Use of IMF credit 1,012 330 307 397 416 448
Net financial inflowsNet debt inflows Use of IMF credit 313 -73 -14 70 28 35 Long-term 673 1,158 1,146 29 787 700 Official creditors 357 335 253 315 259 344 Multilateral 333 330 265 337 212 181 of which: World Bank 255 133 19 125 -31 -58 Bilateral 24 5 -12 -22 48 163 Private creditors 316 824 892 -287 528 356 Bondholders 0 -100 404 -454 236 709 Banks and others 316 924 488 167 291 -353 Short-term -112 248 230 181 -262 -19Net equity inflows Foreign direct investment 567 1,707 2,117 1,708 1,241 1,106 Portfolio equity 12 5 -4 -2 4 -6
Debt ratiosExternal debt stocks to exports (%) 236 214 230 189 170 159External debt stocks to GNI (%) 81 102 113 106 102 102Debt service to exports (%) 21 31 37 30 24 22Short-term to external debt stocks (%) 11 14 14 15 13 13Multilateral to external debt stocks (%) 18 20 19 22 22 23Reserves to external debt stocks (%) 24 17 17 19 19 20Gross national income (GNI) 10,723 14,615 14,440 15,447 16,915 17,039

76
GHANA(US$ million, unless otherwise indicated)
2009 2015 2016 2017 2018 2019Summary external debt data by debtor typeTotal external debt stocks 6,603 20,111 21,147 22,321 23,326 26,953 Use of IMF credit 826 1,242 1,366 1,465 1,508 1,576 Long-term external debt 4,266 15,565 16,993 17,533 18,185 20,739 Public and publicly guaranteed sector 4,266 15,311 16,739 17,280 17,932 20,486 Public sector 4,266 15,311 16,739 17,280 17,932 20,486 of which: General government 3,926 14,288 15,720 16,181 16,837 19,419 Private sector guaranteed by public sector .. .. .. .. .. .. Private sector not guaranteed 0 253 253 253 253 253 Short-term external debt 1,511 3,304 2,789 3,323 3,634 4,638
Disbursements (long-term) 1,005 2,852 2,510 1,166 2,662 3,630 Public and publicly guaranteed sector 1,005 2,852 2,510 1,166 2,662 3,630 Public sector 1,005 2,852 2,510 1,166 2,662 3,630 of which: General government 796 2,705 2,473 1,141 2,626 3,630 Private sector guaranteed by public sector .. .. .. .. .. .. Private sector not guaranteed .. .. .. .. .. ..
Principal repayments (long-term) 145 553 875 1,100 1,809 1,017 Public and publicly guaranteed sector 145 553 875 1,100 1,809 1,017 Public sector 145 553 875 1,100 1,809 1,017 of which: General government 127 540 862 1,089 1,796 997 Private sector guaranteed by public sector .. .. .. .. .. .. Private sector not guaranteed .. .. .. .. .. ..
Interest payments (long-term) 75 336 554 745 675 688 Public and publicly guaranteed sector 75 330 548 739 669 682 Public sector 75 330 548 739 669 682 of which: General government 67 322 539 731 660 674 Private sector guaranteed by public sector .. .. .. .. .. .. Private sector not guaranteed .. 6 6 6 6 6
Summary external debt stock by creditor typeLong-term external debt stocks 4,266 15,565 16,993 17,533 18,185 20,739 Public and publicly guaranteed debt from: 4,266 15,311 16,739 17,280 17,932 20,486 Official creditors 3,320 8,686 8,676 9,178 8,866 8,701 Multilateral 2,331 4,579 4,728 5,383 5,375 5,482 of which: World Bank 1,581 3,285 3,415 3,945 3,926 3,989 Bilateral 989 4,106 3,947 3,795 3,491 3,219 Private creditors 946 6,626 8,064 8,102 9,066 11,785 Bondholders .. 3,000 3,750 3,750 5,048 8,048 Commercial banks and others 946 3,626 4,314 4,352 4,018 3,737 Private nonguaranteed debt from: 0 253 253 253 253 253 Bondholders 0 253 253 253 253 253 Commercial banks and others .. .. .. .. .. ..Use of IMF credit 826 1,242 1,366 1,465 1,508 1,576
Net financial inflowsNet debt inflows Use of IMF credit 104 172 166 18 78 76 Long-term 860 2,299 1,636 66 853 2,613 Official creditors 671 810 162 142 -153 -121 Multilateral 403 596 280 399 107 133 of which: World Bank 240 474 235 323 75 88 Bilateral 268 214 -117 -256 -260 -254 Private creditors 189 1,489 1,473 -76 1,006 2,733 Bondholders .. 1,000 750 .. 1,298 3,000 Banks and others 189 489 723 -76 -292 -267 Short-term 374 230 -503 409 290 1,005Net equity inflows Foreign direct investment 1,940 3,192 3,485 3,255 2,989 2,319 Portfolio equity 535 .. .. .. .. ..
Debt ratiosExternal debt stocks to exports (%) 85 119 119 108 101 103External debt stocks to GNI (%) 26 42 39 39 36 41Debt service to exports (%) 3 6 9 10 12 7Short-term to external debt stocks (%) 23 16 13 15 16 17Multilateral to external debt stocks (%) 35 23 22 24 23 20Reserves to external debt stocks (%) 51 27 26 30 25 26Gross national income (GNI) 25,884 47,921 53,962 57,432 64,270 65,527

77
GRENADA(US$ million, unless otherwise indicated)
2009 2015 2016 2017 2018 2019Summary external debt data by debtor typeTotal external debt stocks 556.6 601.2 602.4 543.3 549.9 550.2 Use of IMF credit 40.5 44.8 43.9 44.5 38.6 35.6 Long-term external debt 477.8 537.4 531.7 476.8 494.5 500.8 Public and publicly guaranteed sector 477.8 537.4 531.7 476.8 494.5 500.8 Public sector 477.8 537.4 531.7 476.8 494.5 500.8 of which: General government 474.1 536.3 530.9 476.5 494.5 500.8 Private sector guaranteed by public sector .. .. .. .. .. .. Private sector not guaranteed .. .. .. .. .. .. Short-term external debt 38.3 19.0 26.8 22.0 16.7 13.8
Disbursements (long-term) 25.7 54.1 23.6 14.3 51.9 40.0 Public and publicly guaranteed sector 25.7 54.1 23.6 14.3 51.9 40.0 Public sector 25.7 54.1 23.6 14.3 51.9 40.0 of which: General government 25.3 54.1 23.6 14.3 51.9 40.0 Private sector guaranteed by public sector .. .. .. .. .. .. Private sector not guaranteed .. .. .. .. .. ..
Principal repayments (long-term) 9.3 16.4 24.7 30.5 31.7 32.6 Public and publicly guaranteed sector 9.3 16.4 24.7 30.5 31.7 32.6 Public sector 9.3 16.4 24.7 30.5 31.7 32.6 of which: General government 9.0 16.0 24.3 30.1 31.3 32.6 Private sector guaranteed by public sector .. .. .. .. .. .. Private sector not guaranteed .. .. .. .. .. ..
Interest payments (long-term) 10.7 5.9 18.4 20.6 16.3 16.5 Public and publicly guaranteed sector 10.7 5.9 18.4 20.6 16.3 16.5 Public sector 10.7 5.9 18.4 20.6 16.3 16.5 of which: General government 10.6 5.9 18.4 20.6 16.3 16.5 Private sector guaranteed by public sector .. .. .. .. .. .. Private sector not guaranteed .. .. .. .. .. ..
Summary external debt stock by creditor typeLong-term external debt stocks 477.8 537.4 531.7 476.8 494.5 500.8 Public and publicly guaranteed debt from: 477.8 537.4 531.7 476.8 494.5 500.8 Official creditors 274.9 350.0 355.9 356.0 383.9 399.7 Multilateral 183.1 244.3 251.0 256.0 278.7 273.6 of which: World Bank 50.2 89.8 89.5 102.0 131.1 131.4 Bilateral 91.8 105.6 104.9 100.0 105.2 126.0 Private creditors 202.8 187.4 175.7 120.8 110.6 101.1 Bondholders 193.2 184.8 175.4 117.5 108.5 99.4 Commercial banks and others 9.6 2.6 0.3 3.3 2.1 1.7 Private nonguaranteed debt from: .. .. .. .. .. .. Bondholders .. .. .. .. .. .. Commercial banks and others .. .. .. .. .. ..Use of IMF credit 40.5 44.8 43.9 44.5 38.6 35.6
Net financial inflowsNet debt inflows Use of IMF credit 9.7 1.1 0.5 -2.0 -4.9 -2.8 Long-term 16.4 37.8 -1.0 -16.2 20.2 7.4 Official creditors 16.4 38.8 8.4 -6.4 30.3 16.8 Multilateral 12.7 37.8 9.2 -0.4 24.8 -4.0 of which: World Bank 1.8 18.1 2.1 7.3 31.3 1.2 Bilateral 3.7 1.0 -0.8 -6.1 5.5 20.8 Private creditors 0.0 -1.1 -9.4 -9.8 -10.2 -9.4 Bondholders .. .. -9.4 -9.0 -9.0 -9.0 Banks and others 0.0 -1.1 .. -0.8 -1.2 -0.4 Short-term -28.0 -9.0 5.9 -5.3 -5.8 -3.3Net equity inflows Foreign direct investment 82.8 156.8 91.6 138.7 143.4 131.0 Portfolio equity .. 0.0 0.0 0.0 0.0 ..
Debt ratiosExternal debt stocks to exports (%) 284.9 114.8 112.4 92.2 83.1 ..External debt stocks to GNI (%) 78.6 68.1 62.5 53.2 52.0 49.5Debt service to exports (%) 11.7 5.2 9.0 9.5 8.0 ..Short-term to external debt stocks (%) 6.9 3.2 4.4 4.1 3.0 2.5Multilateral to external debt stocks (%) 32.9 40.6 41.7 47.1 50.7 49.7Reserves to external debt stocks (%) 23.2 32.9 34.5 36.6 42.5 43.0Gross national income (GNI) 708.2 882.8 964.6 1,021.2 1,057.5 1,111.6

78
GUATEMALA(US$ million, unless otherwise indicated)
2009 2015 2016 2017 2018 2019Summary external debt data by debtor typeTotal external debt stocks 14,824 20,378 21,480 23,945 23,408 26,574 Use of IMF credit 315 278 270 286 279 278 Long-term external debt 13,283 19,256 20,289 22,616 22,430 25,589 Public and publicly guaranteed sector 4,926 7,544 8,148 8,366 8,428 9,326 Public sector 4,926 7,544 8,148 8,366 8,428 9,326 of which: General government 4,413 7,237 7,878 8,134 8,234 9,170 Private sector guaranteed by public sector .. .. .. .. .. .. Private sector not guaranteed 8,358 11,711 12,142 14,250 14,002 16,263 Short-term external debt 1,226 844 920 1,042 698 707
Disbursements (long-term) 942 2,423 3,212 5,527 3,001 6,381 Public and publicly guaranteed sector 807 906 953 662 406 1,312 Public sector 807 906 953 662 406 1,312 of which: General government 767 906 953 662 406 1,312 Private sector guaranteed by public sector .. .. .. .. .. .. Private sector not guaranteed 135 1,516 2,260 4,866 2,594 5,069
Principal repayments (long-term) 1,086 1,424 2,116 3,225 3,182 3,202 Public and publicly guaranteed sector 269 350 352 457 342 395 Public sector 269 350 352 457 342 395 of which: General government 257 312 314 419 305 357 Private sector guaranteed by public sector .. .. .. .. .. .. Private sector not guaranteed 817 1,074 1,765 2,768 2,839 2,807
Interest payments (long-term) 657 676 953 950 752 574 Public and publicly guaranteed sector 258 288 354 376 267 408 Public sector 258 288 354 376 267 408 of which: General government 227 271 338 362 255 397 Private sector guaranteed by public sector .. .. .. .. .. .. Private sector not guaranteed 399 388 600 574 485 166
Summary external debt stock by creditor typeLong-term external debt stocks 13,283 19,256 20,289 22,616 22,430 25,589 Public and publicly guaranteed debt from: 4,926 7,544 8,148 8,366 8,428 9,326 Official creditors 3,968 5,783 5,684 5,406 5,470 5,171 Multilateral 3,612 5,353 5,197 4,911 4,977 4,686 of which: World Bank 1,112 1,765 1,679 1,555 1,718 1,641 Bilateral 356 430 486 496 493 485 Private creditors 957 1,762 2,464 2,960 2,958 4,155 Bondholders 955 1,730 2,430 2,930 2,930 4,130 Commercial banks and others 2 32 34 30 28 25 Private nonguaranteed debt from: 8,358 11,711 12,142 14,250 14,002 16,263 Bondholders 5 1,150 1,500 2,330 2,330 2,330 Commercial banks and others 8,353 10,561 10,642 11,920 11,672 13,933Use of IMF credit 315 278 270 286 279 278
Net financial inflowsNet debt inflows Use of IMF credit .. .. .. .. .. .. Long-term -144 998 1,096 2,302 -181 3,179 Official creditors 537 548 -101 -290 65 -281 Multilateral 548 508 -154 -289 68 -289 of which: World Bank 306 269 -86 -124 163 -78 Bilateral -11 39 53 -1 -2 8 Private creditors -682 451 1,197 2,593 -246 3,460 Bondholders -50 -5 1,050 1,330 .. 1,200 Banks and others -632 456 147 1,263 -246 2,260 Short-term -925 -107 76 122 -344 9Net equity inflows Foreign direct investment 348 1,486 782 880 1,050 944 Portfolio equity 0 0 0 0 0 0
Debt ratiosExternal debt stocks to exports (%) 168 158 164 171 164 182External debt stocks to GNI (%) 40 34 33 34 33 35Debt service to exports (%) 20 16 24 30 28 26Short-term to external debt stocks (%) 8 4 4 4 3 3Multilateral to external debt stocks (%) 24 26 24 21 21 18Reserves to external debt stocks (%) 33 37 41 48 53 54Gross national income (GNI) 36,772 60,700 64,628 70,111 71,598 75,435

79
GUINEA(US$ million, unless otherwise indicated)
2009 2015 2016 2017 2018 2019Summary external debt data by debtor typeTotal external debt stocks 3,502 2,151 2,198 2,382 2,578 2,931 Use of IMF credit 220 340 379 426 464 481 Long-term external debt 3,246 1,686 1,723 1,832 1,957 2,240 Public and publicly guaranteed sector 3,246 1,686 1,723 1,832 1,957 2,240 Public sector 3,246 1,686 1,723 1,832 1,957 2,240 of which: General government 2,876 1,565 1,603 1,707 1,845 2,135 Private sector guaranteed by public sector .. .. .. .. .. .. Private sector not guaranteed .. .. .. .. .. .. Short-term external debt 37 124 96 124 158 210
Disbursements (long-term) 63 188 124 121 225 354 Public and publicly guaranteed sector 63 188 124 121 225 354 Public sector 63 188 124 121 225 354 of which: General government 37 159 115 121 224 352 Private sector guaranteed by public sector .. .. .. .. .. .. Private sector not guaranteed .. .. .. .. .. ..
Principal repayments (long-term) 98 65 59 70 72 62 Public and publicly guaranteed sector 98 65 59 70 72 62 Public sector 98 65 59 70 72 62 of which: General government 89 58 51 61 62 55 Private sector guaranteed by public sector .. .. .. .. .. .. Private sector not guaranteed .. .. .. .. .. ..
Interest payments (long-term) 32 14 23 24 30 31 Public and publicly guaranteed sector 32 14 23 24 30 31 Public sector 32 14 23 24 30 31 of which: General government 21 11 20 20 26 28 Private sector guaranteed by public sector .. .. .. .. .. .. Private sector not guaranteed .. .. .. .. .. ..
Summary external debt stock by creditor typeLong-term external debt stocks 3,246 1,686 1,723 1,832 1,957 2,240 Public and publicly guaranteed debt from: 3,246 1,686 1,723 1,832 1,957 2,240 Official creditors 3,090 1,632 1,680 1,798 1,935 2,177 Multilateral 1,897 603 618 677 822 1,018 of which: World Bank 1,269 186 222 252 344 471 Bilateral 1,193 1,029 1,063 1,121 1,113 1,159 Private creditors 156 54 43 34 22 63 Bondholders .. .. .. .. .. .. Commercial banks and others 156 54 43 34 22 63 Private nonguaranteed debt from: .. .. .. .. .. .. Bondholders .. .. .. .. .. .. Commercial banks and others .. .. .. .. .. ..Use of IMF credit 220 340 379 426 464 481
Net financial inflowsNet debt inflows Use of IMF credit -13 33 51 24 49 20 Long-term -36 124 65 51 153 292 Official creditors -22 135 76 62 165 251 Multilateral -40 -13 29 27 160 201 of which: World Bank -27 -2 43 17 98 129 Bilateral 18 148 47 35 5 50 Private creditors -14 -11 -11 -11 -12 41 Bondholders .. .. .. .. .. .. Banks and others -14 -11 -11 -11 -12 41 Short-term -104 39 -28 28 34 52Net equity inflows Foreign direct investment 91 9 3 40 -28 13 Portfolio equity .. -2 0 1 0 0
Debt ratiosExternal debt stocks to exports (%) 306 113 88 51 62 71External debt stocks to GNI (%) 53 25 26 23 22 23Debt service to exports (%) 13 6 3 2 3 3Short-term to external debt stocks (%) 1 6 4 5 6 7Multilateral to external debt stocks (%) 54 28 28 28 32 35Reserves to external debt stocks (%) 12 27 36 39 44 42Gross national income (GNI) 6,549 8,651 8,501 10,286 11,521 12,819

80
GUINEA-BISSAU(US$ million, unless otherwise indicated)
2009 2015 2016 2017 2018 2019Summary external debt data by debtor typeTotal external debt stocks 1,164.0 355.7 336.3 436.9 543.1 634.8 Use of IMF credit 31.3 37.7 42.5 51.6 52.6 50.3 Long-term external debt 978.5 264.9 261.2 351.7 448.2 525.3 Public and publicly guaranteed sector 978.5 264.9 261.2 351.7 424.2 507.0 Public sector 978.5 264.9 261.2 351.7 424.2 507.0 of which: General government 968.3 264.9 261.2 351.7 424.2 507.0 Private sector guaranteed by public sector .. .. .. .. .. .. Private sector not guaranteed .. 0.0 0.0 0.0 24.0 18.4 Short-term external debt 154.3 53.0 32.6 33.6 42.3 59.2
Disbursements (long-term) 16.2 34.9 4.6 88.7 129.8 90.0 Public and publicly guaranteed sector 16.2 34.9 4.6 88.7 105.8 90.0 Public sector 16.2 34.9 4.6 88.7 105.8 90.0 of which: General government 16.2 34.9 4.6 88.7 105.8 90.0 Private sector guaranteed by public sector .. .. .. .. .. .. Private sector not guaranteed .. .. 0.0 .. 24.0 ..
Principal repayments (long-term) 5.7 4.2 4.7 6.6 5.4 5.3 Public and publicly guaranteed sector 5.7 4.2 4.7 6.6 5.4 5.3 Public sector 5.7 4.2 4.7 6.6 5.4 5.3 of which: General government 5.3 4.2 4.7 6.6 5.4 5.3 Private sector guaranteed by public sector .. .. .. .. .. .. Private sector not guaranteed .. 0.0 .. .. .. ..
Interest payments (long-term) 4.1 2.0 1.9 3.3 6.5 8.5 Public and publicly guaranteed sector 4.1 2.0 1.9 3.3 5.1 7.1 Public sector 4.1 2.0 1.9 3.3 5.1 7.1 of which: General government 4.0 2.0 1.9 3.3 5.1 7.1 Private sector guaranteed by public sector .. .. .. .. .. .. Private sector not guaranteed .. .. .. .. 1.4 1.4
Summary external debt stock by creditor typeLong-term external debt stocks 978.5 264.9 261.2 351.7 448.2 525.3 Public and publicly guaranteed debt from: 978.5 264.9 261.2 351.7 424.2 507.0 Official creditors 978.5 236.5 233.3 283.1 327.4 380.8 Multilateral 521.2 115.7 114.7 162.5 203.5 258.9 of which: World Bank 303.8 53.0 54.1 67.0 111.1 126.1 Bilateral 457.3 120.8 118.7 120.6 124.0 121.9 Private creditors .. 28.4 27.9 68.5 96.7 126.2 Bondholders .. 28.4 27.9 68.5 96.7 126.2 Commercial banks and others .. .. .. .. .. .. Private nonguaranteed debt from: .. 0.0 0.0 0.0 24.0 18.4 Bondholders .. .. .. .. .. .. Commercial banks and others .. 0.0 0.0 0.0 24.0 18.4Use of IMF credit 31.3 37.7 42.5 51.6 52.6 50.3
Net financial inflowsNet debt inflows Use of IMF credit 1.2 4.0 6.1 6.4 2.2 -2.0 Long-term 10.5 30.6 -0.1 82.1 124.4 84.7 Official creditors 10.5 22.9 0.4 41.5 72.2 55.2 Multilateral 1.3 24.8 2.3 36.5 68.6 57.3 of which: World Bank 0.0 2.2 2.8 9.4 46.1 15.7 Bilateral 9.3 -1.9 -1.9 4.9 3.5 -2.1 Private creditors .. 7.7 -0.5 40.6 52.2 29.5 Bondholders .. 7.8 -0.5 40.6 28.2 29.5 Banks and others .. 0.0 0.0 .. 24.0 .. Short-term 5.0 20.7 -20.4 1.0 8.7 16.9Net equity inflows Foreign direct investment 18.9 18.6 14.2 15.7 16.7 30.6 Portfolio equity -0.2 .. .. .. .. ..
Debt ratiosExternal debt stocks to exports (%) 712.4 103.9 154.4 103.9 124.6 ..External debt stocks to GNI (%) 142.5 33.1 27.8 32.4 37.3 44.2Debt service to exports (%) 7.1 1.9 3.5 2.8 3.3 ..Short-term to external debt stocks (%) 13.3 14.9 9.7 7.7 7.8 9.3Multilateral to external debt stocks (%) 44.8 32.5 34.1 37.2 37.5 40.8Reserves to external debt stocks (%) 14.5 93.4 .. .. .. ..Gross national income (GNI) 816.6 1,073.4 1,207.9 1,349.6 1,456.1 1,437.3

81
GUYANA(US$ million, unless otherwise indicated)
2009 2015 2016 2017 2018 2019Summary external debt data by debtor typeTotal external debt stocks 1,427.9 1,636.9 1,643.9 1,582.9 1,608.0 1,597.4 Use of IMF credit 194.6 124.5 117.1 124.0 121.1 120.4 Long-term external debt 781.3 1,201.3 1,283.6 1,342.6 1,361.8 1,357.4 Public and publicly guaranteed sector 779.6 1,031.3 1,049.0 1,135.0 1,204.8 1,251.1 Public sector 779.6 1,031.3 1,049.0 1,135.0 1,204.8 1,251.1 of which: General government 710.1 995.1 1,013.2 1,099.3 1,169.5 1,216.1 Private sector guaranteed by public sector .. .. .. .. .. .. Private sector not guaranteed 1.7 170.0 234.5 207.7 157.0 106.3 Short-term external debt 452.0 311.1 243.2 116.2 125.1 119.6
Disbursements (long-term) 104.6 73.9 140.9 109.4 137.6 104.8 Public and publicly guaranteed sector 104.6 73.9 60.9 109.4 137.6 104.8 Public sector 104.6 73.9 60.9 109.4 137.6 104.8 of which: General government 104.6 73.9 60.9 109.4 137.6 104.8 Private sector guaranteed by public sector .. .. .. .. .. .. Private sector not guaranteed .. .. 80.0 .. .. ..
Principal repayments (long-term) 8.5 43.7 47.7 65.6 105.5 105.0 Public and publicly guaranteed sector 8.2 28.7 32.2 38.7 54.8 54.3 Public sector 8.2 28.7 32.2 38.7 54.8 54.3 of which: General government 7.9 28.4 31.9 38.4 54.5 54.0 Private sector guaranteed by public sector .. .. .. .. .. .. Private sector not guaranteed 0.3 15.0 15.5 26.9 50.7 50.7
Interest payments (long-term) 10.6 16.9 28.2 31.6 33.5 32.6 Public and publicly guaranteed sector 10.4 16.9 17.5 19.1 22.1 23.2 Public sector 10.4 16.9 17.5 19.1 22.1 23.2 of which: General government 10.3 16.8 17.4 19.0 22.0 23.1 Private sector guaranteed by public sector .. .. .. .. .. .. Private sector not guaranteed 0.2 .. 10.7 12.5 11.3 9.4
Summary external debt stock by creditor typeLong-term external debt stocks 781.3 1,201.3 1,283.6 1,342.6 1,361.8 1,357.4 Public and publicly guaranteed debt from: 779.6 1,031.3 1,049.0 1,135.0 1,204.8 1,251.1 Official creditors 763.1 1,014.9 1,032.8 1,101.4 1,172.0 1,219.1 Multilateral 479.0 688.4 693.8 725.5 787.9 815.3 of which: World Bank 9.7 20.4 25.0 35.6 75.5 83.0 Bilateral 284.1 326.6 339.0 375.9 384.1 403.8 Private creditors 16.5 16.4 16.2 33.6 32.8 32.1 Bondholders 0.0 0.0 0.0 0.0 0.0 0.0 Commercial banks and others 16.5 16.3 16.2 33.5 32.8 32.0 Private nonguaranteed debt from: 1.7 170.0 234.5 207.7 157.0 106.3 Bondholders .. .. .. .. .. .. Commercial banks and others 1.7 170.0 234.5 207.7 157.0 106.3Use of IMF credit 194.6 124.5 117.1 124.0 121.1 120.4
Net financial inflowsNet debt inflows Use of IMF credit 0.0 -9.1 -3.9 .. .. .. Long-term 96.1 30.3 93.3 43.8 32.1 -0.2 Official creditors 96.4 45.3 28.8 53.4 83.5 51.3 Multilateral 63.5 26.1 6.9 26.3 64.4 28.0 of which: World Bank -0.1 6.9 5.4 8.7 41.1 7.9 Bilateral 32.9 19.1 21.9 27.0 19.1 23.2 Private creditors -0.3 -15.0 64.5 -9.6 -51.4 -51.4 Bondholders .. .. .. .. .. 0.0 Banks and others -0.3 -15.0 64.5 -9.6 -51.4 -51.4 Short-term 215.0 -608.2 -80.3 -121.7 5.7 -6.8Net equity inflows Foreign direct investment 31.1 113.4 137.1 274.2 956.6 1,713.3 Portfolio equity .. 0.0 0.0 0.0 .. ..
Debt ratiosExternal debt stocks to exports (%) 146.0 119.8 95.4 93.1 98.2 88.0External debt stocks to GNI (%) 68.7 50.8 47.5 45.6 42.5 38.1Debt service to exports (%) 2.1 5.3 4.8 5.7 8.5 7.6Short-term to external debt stocks (%) 31.7 19.0 14.8 7.3 7.8 7.5Multilateral to external debt stocks (%) 33.5 42.1 42.2 45.8 49.0 51.0Reserves to external debt stocks (%) 44.2 32.5 35.3 35.7 32.2 35.9Gross national income (GNI) 2,078.1 3,221.9 3,458.0 3,472.5 3,779.7 4,192.1

82
HAITI(US$ million, unless otherwise indicated)
2009 2015 2016 2017 2018 2019Summary external debt data by debtor typeTotal external debt stocks 1,448 2,096 2,168 2,170 2,214 2,214 Use of IMF credit 291 178 216 213 201 185 Long-term external debt 1,158 1,915 1,951 1,955 2,013 2,012 Public and publicly guaranteed sector 1,158 1,914 1,947 1,954 2,013 2,012 Public sector 1,158 1,914 1,947 1,954 2,013 2,012 of which: General government 1,110 1,877 1,913 1,923 1,988 1,987 Private sector guaranteed by public sector .. .. .. .. .. .. Private sector not guaranteed .. 1 4 1 0 0 Short-term external debt 0 4 1 2 0 16
Disbursements (long-term) 212 173 106 16 40 4 Public and publicly guaranteed sector 212 173 102 16 40 4 Public sector 212 173 102 16 40 4 of which: General government 212 173 102 16 40 3 Private sector guaranteed by public sector .. .. .. .. .. .. Private sector not guaranteed .. .. 4 .. .. ..
Principal repayments (long-term) 26 27 68 9 8 8 Public and publicly guaranteed sector 26 27 67 6 7 7 Public sector 26 27 67 6 7 7 of which: General government 21 25 64 3 4 4 Private sector guaranteed by public sector .. .. .. .. .. .. Private sector not guaranteed .. 0 0 4 0 0
Interest payments (long-term) 15 8 19 5 3 3 Public and publicly guaranteed sector 15 8 19 5 3 3 Public sector 15 8 19 5 3 3 of which: General government 13 8 18 4 3 2 Private sector guaranteed by public sector .. .. .. .. .. .. Private sector not guaranteed .. 0 0 0 0 0
Summary external debt stock by creditor typeLong-term external debt stocks 1,158 1,915 1,951 1,955 2,013 2,012 Public and publicly guaranteed debt from: 1,158 1,914 1,947 1,954 2,013 2,012 Official creditors 1,107 1,868 1,901 1,909 1,970 1,968 Multilateral 520 81 89 101 99 96 of which: World Bank 39 .. .. .. .. .. Bilateral 588 1,787 1,812 1,808 1,871 1,872 Private creditors 50 45 45 45 43 44 Bondholders .. .. .. .. .. .. Commercial banks and others 50 45 45 45 43 44 Private nonguaranteed debt from: .. 1 4 1 0 0 Bondholders .. .. .. .. .. .. Commercial banks and others .. 1 4 1 0 0Use of IMF credit 291 178 216 213 201 185
Net financial inflowsNet debt inflows Use of IMF credit 57 10 39 -6 -10 -11 Long-term 185 146 38 7 32 -3 Official creditors 185 146 35 11 35 -1 Multilateral 76 8 10 15 -2 1 of which: World Bank -11 .. .. .. .. .. Bilateral 109 138 25 -4 37 -2 Private creditors .. 0 4 -4 -3 -3 Bondholders .. .. .. .. .. .. Banks and others .. 0 4 -4 -3 -3 Short-term 0 0 0 0 0 0Net equity inflows Foreign direct investment 55 106 105 375 105 75 Portfolio equity 0 .. .. .. .. ..
Debt ratiosExternal debt stocks to exports (%) 136 116 129 136 120 134External debt stocks to GNI (%) 22 24 27 26 23 26Debt service to exports (%) 4 2 5 1 1 1Short-term to external debt stocks (%) 0 0 0 0 0 1Multilateral to external debt stocks (%) 36 4 4 5 4 4Reserves to external debt stocks (%) 73 91 97 108 104 ..Gross national income (GNI) 6,597 8,760 8,014 8,463 9,712 8,446
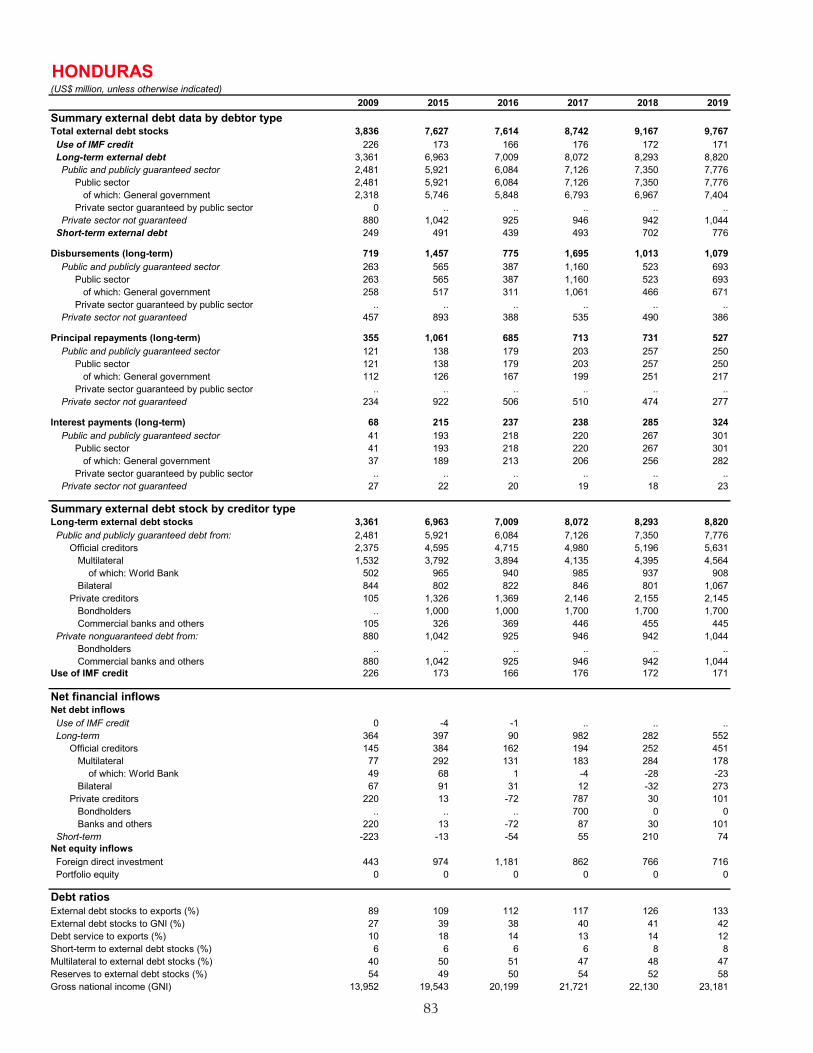
83
HONDURAS(US$ million, unless otherwise indicated)
2009 2015 2016 2017 2018 2019Summary external debt data by debtor typeTotal external debt stocks 3,836 7,627 7,614 8,742 9,167 9,767 Use of IMF credit 226 173 166 176 172 171 Long-term external debt 3,361 6,963 7,009 8,072 8,293 8,820 Public and publicly guaranteed sector 2,481 5,921 6,084 7,126 7,350 7,776 Public sector 2,481 5,921 6,084 7,126 7,350 7,776 of which: General government 2,318 5,746 5,848 6,793 6,967 7,404 Private sector guaranteed by public sector 0 .. .. .. .. .. Private sector not guaranteed 880 1,042 925 946 942 1,044 Short-term external debt 249 491 439 493 702 776
Disbursements (long-term) 719 1,457 775 1,695 1,013 1,079 Public and publicly guaranteed sector 263 565 387 1,160 523 693 Public sector 263 565 387 1,160 523 693 of which: General government 258 517 311 1,061 466 671 Private sector guaranteed by public sector .. .. .. .. .. .. Private sector not guaranteed 457 893 388 535 490 386
Principal repayments (long-term) 355 1,061 685 713 731 527 Public and publicly guaranteed sector 121 138 179 203 257 250 Public sector 121 138 179 203 257 250 of which: General government 112 126 167 199 251 217 Private sector guaranteed by public sector .. .. .. .. .. .. Private sector not guaranteed 234 922 506 510 474 277
Interest payments (long-term) 68 215 237 238 285 324 Public and publicly guaranteed sector 41 193 218 220 267 301 Public sector 41 193 218 220 267 301 of which: General government 37 189 213 206 256 282 Private sector guaranteed by public sector .. .. .. .. .. .. Private sector not guaranteed 27 22 20 19 18 23
Summary external debt stock by creditor typeLong-term external debt stocks 3,361 6,963 7,009 8,072 8,293 8,820 Public and publicly guaranteed debt from: 2,481 5,921 6,084 7,126 7,350 7,776 Official creditors 2,375 4,595 4,715 4,980 5,196 5,631 Multilateral 1,532 3,792 3,894 4,135 4,395 4,564 of which: World Bank 502 965 940 985 937 908 Bilateral 844 802 822 846 801 1,067 Private creditors 105 1,326 1,369 2,146 2,155 2,145 Bondholders .. 1,000 1,000 1,700 1,700 1,700 Commercial banks and others 105 326 369 446 455 445 Private nonguaranteed debt from: 880 1,042 925 946 942 1,044 Bondholders .. .. .. .. .. .. Commercial banks and others 880 1,042 925 946 942 1,044Use of IMF credit 226 173 166 176 172 171
Net financial inflowsNet debt inflows Use of IMF credit 0 -4 -1 .. .. .. Long-term 364 397 90 982 282 552 Official creditors 145 384 162 194 252 451 Multilateral 77 292 131 183 284 178 of which: World Bank 49 68 1 -4 -28 -23 Bilateral 67 91 31 12 -32 273 Private creditors 220 13 -72 787 30 101 Bondholders .. .. .. 700 0 0 Banks and others 220 13 -72 87 30 101 Short-term -223 -13 -54 55 210 74Net equity inflows Foreign direct investment 443 974 1,181 862 766 716 Portfolio equity 0 0 0 0 0 0
Debt ratiosExternal debt stocks to exports (%) 89 109 112 117 126 133External debt stocks to GNI (%) 27 39 38 40 41 42Debt service to exports (%) 10 18 14 13 14 12Short-term to external debt stocks (%) 6 6 6 6 8 8Multilateral to external debt stocks (%) 40 50 51 47 48 47Reserves to external debt stocks (%) 54 49 50 54 52 58Gross national income (GNI) 13,952 19,543 20,199 21,721 22,130 23,181

84
INDIA(US$ million, unless otherwise indicated)
2009 2015 2016 2017 2018 2019Summary external debt data by debtor typeTotal external debt stocks 256,312 478,826 455,502 511,475 521,034 560,035 Use of IMF credit 6,237 5,513 5,348 5,666 5,533 5,501 Long-term external debt 203,473 391,750 366,221 408,200 411,577 447,754 Public and publicly guaranteed sector 85,293 162,305 152,973 182,916 180,399 191,797 Public sector 85,225 162,305 152,973 182,916 180,399 191,797 of which: General government 67,070 116,713 111,062 141,987 134,213 140,060 Private sector guaranteed by public sector 68 .. .. .. .. .. Private sector not guaranteed 118,180 229,445 213,248 225,284 231,179 255,957 Short-term external debt 46,603 81,563 83,933 97,609 103,924 106,780
Disbursements (long-term) 26,646 66,337 41,942 78,143 52,134 71,863 Public and publicly guaranteed sector 10,396 23,113 11,570 39,422 18,992 24,616 Public sector 10,396 23,113 11,570 39,422 18,992 24,616 of which: General government 6,320 12,562 6,194 33,036 7,866 11,596 Private sector guaranteed by public sector 0 .. .. .. .. .. Private sector not guaranteed 16,250 43,224 30,372 38,721 33,141 47,247
Principal repayments (long-term) 10,990 38,773 65,971 38,667 46,229 34,949 Public and publicly guaranteed sector 5,336 11,774 20,472 11,982 21,016 13,287 Public sector 5,311 11,774 20,472 11,982 21,016 13,287 of which: General government 2,391 3,746 11,409 4,189 15,244 5,821 Private sector guaranteed by public sector 25 .. .. .. .. .. Private sector not guaranteed 5,654 26,998 45,499 26,684 25,213 21,662
Interest payments (long-term) 4,942 9,814 9,540 10,348 13,975 12,888 Public and publicly guaranteed sector 1,322 1,898 2,105 2,153 2,615 3,283 Public sector 1,319 1,898 2,105 2,153 2,615 3,283 of which: General government 818 623 770 954 1,217 1,496 Private sector guaranteed by public sector 3 .. .. .. .. .. Private sector not guaranteed 3,620 7,916 7,435 8,195 11,361 9,605
Summary external debt stock by creditor typeLong-term external debt stocks 203,473 391,750 366,221 408,200 411,577 447,754 Public and publicly guaranteed debt from: 85,293 162,305 152,973 182,916 180,399 191,797 Official creditors 65,914 71,691 73,229 78,046 81,005 84,359 Multilateral 42,327 50,462 50,789 52,976 54,165 56,404 of which: World Bank 34,432 36,509 36,348 37,234 36,464 36,809 Bilateral 23,587 21,229 22,440 25,070 26,840 27,955 Private creditors 19,379 90,615 79,744 104,870 99,394 107,438 Bondholders 9,521 59,512 53,246 81,997 73,809 81,351 Commercial banks and others 9,858 31,103 26,499 22,873 25,585 26,087 Private nonguaranteed debt from: 118,180 229,445 213,248 225,284 231,179 255,957 Bondholders 15,326 7,783 10,040 14,645 13,962 19,199 Commercial banks and others 102,854 221,661 203,208 210,639 217,216 236,757Use of IMF credit 6,237 5,513 5,348 5,666 5,533 5,501
Net financial inflowsNet debt inflows Use of IMF credit .. .. .. .. .. .. Long-term 15,656 27,564 -24,029 39,476 5,905 36,914 Official creditors 3,034 1,434 1,978 2,452 3,422 3,290 Multilateral 2,686 843 1,014 885 1,747 2,381 of which: World Bank 1,418 260 506 -369 -243 465 Bilateral 348 591 965 1,566 1,675 910 Private creditors 12,622 26,130 -26,008 37,025 2,482 33,624 Bondholders 1,972 10,705 -3,796 33,310 -8,417 12,939 Banks and others 10,650 15,424 -22,211 3,715 10,899 20,685 Short-term 2,782 -4,012 2,370 13,676 6,315 2,856Net equity inflows Foreign direct investment 34,111 39,663 41,987 37,098 39,234 43,136 Portfolio equity 24,689 1,933 2,337 5,928 -4,361 13,769
Debt ratiosExternal debt stocks to exports (%) 93 108 102 101 93 98External debt stocks to GNI (%) 19 23 20 19 19 20Debt service to exports (%) 6 11 17 10 11 9Short-term to external debt stocks (%) 18 17 18 19 20 19Multilateral to external debt stocks (%) 17 11 11 10 10 10Reserves to external debt stocks (%) 103 70 75 76 72 77Gross national income (GNI) 1,333,877 2,079,182 2,247,940 2,624,082 2,684,230 2,843,902

85
INDONESIA(US$ million, unless otherwise indicated)
2009 2015 2016 2017 2018 2019Summary external debt data by debtor typeTotal external debt stocks 179,405 307,749 318,942 353,564 379,589 402,084 Use of IMF credit 3,105 2,744 2,662 2,820 2,754 2,739 Long-term external debt 152,250 266,574 275,595 304,013 328,875 354,547 Public and publicly guaranteed sector 97,457 159,571 177,073 194,953 215,072 233,505 Public sector 97,457 159,571 177,073 194,953 215,072 233,505 of which: General government 90,511 135,948 154,762 175,600 183,262 199,054 Private sector guaranteed by public sector .. .. .. .. .. .. Private sector not guaranteed 54,793 107,003 98,522 109,059 113,802 121,041 Short-term external debt 24,050 38,431 40,685 46,731 47,960 44,799
Disbursements (long-term) 34,913 67,974 68,083 78,616 72,086 94,779 Public and publicly guaranteed sector 16,217 27,261 26,669 27,535 31,060 31,656 Public sector 16,217 27,261 26,669 27,535 31,060 31,656 of which: General government 12,757 20,160 23,903 24,690 15,822 25,950 Private sector guaranteed by public sector .. .. .. .. .. .. Private sector not guaranteed 18,695 40,713 41,414 51,081 41,026 63,122
Principal repayments (long-term) 20,431 43,131 53,835 46,884 42,905 68,404 Public and publicly guaranteed sector 7,063 9,026 10,029 11,765 10,614 13,246 Public sector 7,063 9,026 10,029 11,765 10,614 13,246 of which: General government 6,747 5,568 5,951 5,961 7,858 10,190 Private sector guaranteed by public sector .. .. .. .. .. .. Private sector not guaranteed 13,368 34,105 43,806 35,119 32,291 55,157
Interest payments (long-term) 4,301 16,356 9,730 10,595 10,703 12,046 Public and publicly guaranteed sector 2,802 5,201 5,959 6,579 6,767 7,867 Public sector 2,802 5,201 5,959 6,579 6,767 7,867 of which: General government 2,582 4,235 4,906 5,520 5,873 6,281 Private sector guaranteed by public sector .. .. .. .. .. .. Private sector not guaranteed 1,499 11,155 3,771 4,015 3,936 4,179
Summary external debt stock by creditor typeLong-term external debt stocks 152,250 266,574 275,595 304,013 328,875 354,547 Public and publicly guaranteed debt from: 97,457 159,571 177,073 194,953 215,072 233,505 Official creditors 62,933 50,863 51,549 51,666 53,072 52,254 Multilateral 21,052 25,202 26,720 27,499 29,118 30,420 of which: World Bank 10,111 16,044 17,224 17,941 18,507 19,109 Bilateral 41,880 25,662 24,829 24,167 23,955 21,834 Private creditors 34,525 108,708 125,524 143,287 162,000 181,251 Bondholders 25,833 96,484 114,376 135,396 151,001 173,224 Commercial banks and others 8,691 12,224 11,149 7,891 10,999 8,027 Private nonguaranteed debt from: 54,793 107,003 98,522 109,059 113,802 121,041 Bondholders 7,856 14,279 13,306 14,383 15,038 16,515 Commercial banks and others 46,937 92,724 85,216 94,677 98,764 104,526Use of IMF credit 3,105 2,744 2,662 2,820 2,754 2,739
Net financial inflowsNet debt inflows Use of IMF credit .. .. .. .. .. .. Long-term 14,481 24,844 14,248 31,732 29,182 26,375 Official creditors 33 726 -472 -905 1,401 -938 Multilateral 1,111 2,614 1,576 659 1,663 1,309 of which: World Bank 1,121 2,060 1,221 645 594 617 Bilateral -1,078 -1,888 -2,048 -1,564 -262 -2,247 Private creditors 14,449 24,118 14,720 32,637 27,780 27,313 Bondholders 8,600 15,320 17,144 21,257 16,496 23,767 Banks and others 5,848 8,798 -2,424 11,380 11,284 3,546 Short-term 3,561 -7,529 2,254 6,046 1,229 -3,161Net equity inflows Foreign direct investment 4,982 18,822 4,684 18,839 19,993 24,739 Portfolio equity 787 -1,547 1,319 -2,538 -3,668 -397
Debt ratiosExternal debt stocks to exports (%) 141 177 186 177 172 194External debt stocks to GNI (%) 34 37 35 36 37 37Debt service to exports (%) 20 35 37 29 25 39Short-term to external debt stocks (%) 13 12 13 13 13 11Multilateral to external debt stocks (%) 12 8 8 8 8 8Reserves to external debt stocks (%) 35 34 36 36 31 31Gross national income (GNI) 520,695 832,299 902,045 983,438 1,012,284 1,085,709

86
IRAN, ISLAMIC REPUBLIC OF(US$ million, unless otherwise indicated)
2009 2015 2016 2017 2018 2019Summary external debt data by debtor typeTotal external debt stocks 18,610.0 6,453.3 6,058.4 6,819.1 5,773.7 4,833.7 Use of IMF credit 2,235.6 1,976.1 1,917.1 2,030.9 1,983.4 1,972.0 Long-term external debt 7,587.4 2,457.8 826.8 589.3 1,636.8 1,263.1 Public and publicly guaranteed sector 7,587.4 2,457.8 826.8 589.3 437.2 348.4 Public sector 7,577.3 2,457.8 826.8 589.3 437.2 348.4 of which: General government 956.3 462.0 378.1 280.3 206.1 141.0 Private sector guaranteed by public sector 10.0 .. .. .. .. .. Private sector not guaranteed 0.0 0.0 0.0 0.0 1,199.7 914.7 Short-term external debt 8,787.0 2,019.4 3,314.5 4,198.9 2,153.5 1,598.6
Disbursements (long-term) 398.0 7.3 36.6 123.0 0.0 7.6 Public and publicly guaranteed sector 398.0 7.3 36.6 123.0 0.0 7.6 Public sector 388.3 7.3 36.6 123.0 0.0 7.6 of which: General government 158.8 0.0 0.0 0.0 0.0 .. Private sector guaranteed by public sector 9.7 .. .. .. .. .. Private sector not guaranteed .. .. .. .. .. ..
Principal repayments (long-term) 2,027.3 650.0 1,933.7 387.2 137.7 256.0 Public and publicly guaranteed sector 2,027.3 650.0 1,933.7 387.2 137.7 93.4 Public sector 2,024.4 650.0 1,933.7 387.2 137.7 93.4 of which: General government 99.6 90.9 98.9 99.2 74.5 65.1 Private sector guaranteed by public sector 3.0 .. .. .. .. .. Private sector not guaranteed .. .. .. .. .. 162.5
Interest payments (long-term) 271.5 40.1 87.6 22.4 18.1 32.6 Public and publicly guaranteed sector 271.5 40.1 87.6 22.4 18.1 14.9 Public sector 271.3 40.1 87.6 22.4 18.1 14.9 of which: General government 19.9 5.0 6.5 7.4 5.8 6.8 Private sector guaranteed by public sector 0.1 .. .. .. .. .. Private sector not guaranteed .. .. .. .. .. 17.7
Summary external debt stock by creditor typeLong-term external debt stocks 7,587.4 2,457.8 826.8 589.3 1,636.8 1,263.1 Public and publicly guaranteed debt from: 7,587.4 2,457.8 826.8 589.3 437.2 348.4 Official creditors 2,313.7 738.4 592.7 519.7 413.3 324.9 Multilateral 855.0 477.8 406.8 342.5 272.2 198.8 of which: World Bank 835.8 438.0 354.7 271.1 206.1 141.0 Bilateral 1,458.7 260.6 185.9 177.2 141.2 126.1 Private creditors 5,273.6 1,719.4 234.2 69.5 23.8 23.5 Bondholders .. .. .. .. .. .. Commercial banks and others 5,273.6 1,719.4 234.2 69.5 23.8 23.5 Private nonguaranteed debt from: 0.0 0.0 0.0 0.0 1,199.7 914.7 Bondholders .. .. .. .. .. .. Commercial banks and others 0.0 0.0 0.0 0.0 1,199.7 914.7Use of IMF credit 2,235.6 1,976.1 1,917.1 2,030.9 1,983.4 1,972.0
Net financial inflowsNet debt inflows Use of IMF credit .. .. .. .. .. .. Long-term -1,629.4 -642.7 -1,897.1 -264.1 -137.7 -248.4 Official creditors -169.3 -239.6 -161.6 -87.7 -93.1 -85.8 Multilateral 93.2 -76.0 -71.6 -72.2 -67.1 -72.1 of which: World Bank 74.7 -82.5 -83.3 -83.6 -65.1 -65.1 Bilateral -262.5 -163.6 -90.0 -15.5 -26.0 -13.7 Private creditors -1,460.1 -403.1 -1,735.4 -176.4 -44.7 -162.5 Bondholders .. .. .. .. .. .. Banks and others -1,460.1 -403.1 -1,735.4 -176.4 -44.7 -162.5 Short-term 2,188.0 1,587.7 1,292.1 886.0 -2,046.5 -612.0Net equity inflows Foreign direct investment 2,983.4 2,050.0 3,372.0 5,019.0 2,373.0 1,508.0 Portfolio equity .. .. .. .. .. ..
Debt ratiosExternal debt stocks to exports (%) 16.6 6.3 6.3 7.0 5.5 6.7External debt stocks to GNI (%) 4.5 1.7 1.4 1.5 .. ..Debt service to exports (%) 2.1 0.7 2.2 0.5 0.2 0.5Short-term to external debt stocks (%) 47.2 31.3 54.7 61.6 37.3 33.1Multilateral to external debt stocks (%) 4.6 7.4 6.7 5.0 4.7 4.1Reserves to external debt stocks (%) .. .. .. .. .. ..Gross national income (GNI) 416,274.6 385,924.9 419,284.3 446,174.0 .. ..
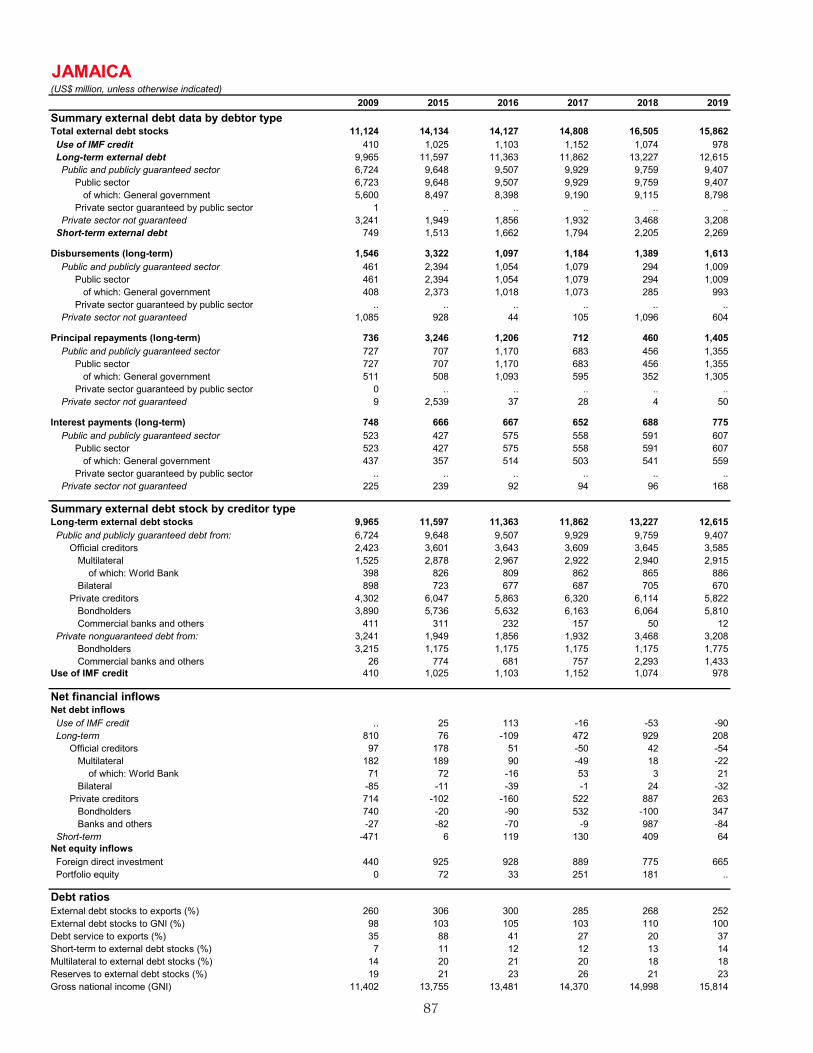
87
JAMAICA(US$ million, unless otherwise indicated)
2009 2015 2016 2017 2018 2019Summary external debt data by debtor typeTotal external debt stocks 11,124 14,134 14,127 14,808 16,505 15,862 Use of IMF credit 410 1,025 1,103 1,152 1,074 978 Long-term external debt 9,965 11,597 11,363 11,862 13,227 12,615 Public and publicly guaranteed sector 6,724 9,648 9,507 9,929 9,759 9,407 Public sector 6,723 9,648 9,507 9,929 9,759 9,407 of which: General government 5,600 8,497 8,398 9,190 9,115 8,798 Private sector guaranteed by public sector 1 .. .. .. .. .. Private sector not guaranteed 3,241 1,949 1,856 1,932 3,468 3,208 Short-term external debt 749 1,513 1,662 1,794 2,205 2,269
Disbursements (long-term) 1,546 3,322 1,097 1,184 1,389 1,613 Public and publicly guaranteed sector 461 2,394 1,054 1,079 294 1,009 Public sector 461 2,394 1,054 1,079 294 1,009 of which: General government 408 2,373 1,018 1,073 285 993 Private sector guaranteed by public sector .. .. .. .. .. .. Private sector not guaranteed 1,085 928 44 105 1,096 604
Principal repayments (long-term) 736 3,246 1,206 712 460 1,405 Public and publicly guaranteed sector 727 707 1,170 683 456 1,355 Public sector 727 707 1,170 683 456 1,355 of which: General government 511 508 1,093 595 352 1,305 Private sector guaranteed by public sector 0 .. .. .. .. .. Private sector not guaranteed 9 2,539 37 28 4 50
Interest payments (long-term) 748 666 667 652 688 775 Public and publicly guaranteed sector 523 427 575 558 591 607 Public sector 523 427 575 558 591 607 of which: General government 437 357 514 503 541 559 Private sector guaranteed by public sector .. .. .. .. .. .. Private sector not guaranteed 225 239 92 94 96 168
Summary external debt stock by creditor typeLong-term external debt stocks 9,965 11,597 11,363 11,862 13,227 12,615 Public and publicly guaranteed debt from: 6,724 9,648 9,507 9,929 9,759 9,407 Official creditors 2,423 3,601 3,643 3,609 3,645 3,585 Multilateral 1,525 2,878 2,967 2,922 2,940 2,915 of which: World Bank 398 826 809 862 865 886 Bilateral 898 723 677 687 705 670 Private creditors 4,302 6,047 5,863 6,320 6,114 5,822 Bondholders 3,890 5,736 5,632 6,163 6,064 5,810 Commercial banks and others 411 311 232 157 50 12 Private nonguaranteed debt from: 3,241 1,949 1,856 1,932 3,468 3,208 Bondholders 3,215 1,175 1,175 1,175 1,175 1,775 Commercial banks and others 26 774 681 757 2,293 1,433Use of IMF credit 410 1,025 1,103 1,152 1,074 978
Net financial inflowsNet debt inflows Use of IMF credit .. 25 113 -16 -53 -90 Long-term 810 76 -109 472 929 208 Official creditors 97 178 51 -50 42 -54 Multilateral 182 189 90 -49 18 -22 of which: World Bank 71 72 -16 53 3 21 Bilateral -85 -11 -39 -1 24 -32 Private creditors 714 -102 -160 522 887 263 Bondholders 740 -20 -90 532 -100 347 Banks and others -27 -82 -70 -9 987 -84 Short-term -471 6 119 130 409 64Net equity inflows Foreign direct investment 440 925 928 889 775 665 Portfolio equity 0 72 33 251 181 ..
Debt ratiosExternal debt stocks to exports (%) 260 306 300 285 268 252External debt stocks to GNI (%) 98 103 105 103 110 100Debt service to exports (%) 35 88 41 27 20 37Short-term to external debt stocks (%) 7 11 12 12 13 14Multilateral to external debt stocks (%) 14 20 21 20 18 18Reserves to external debt stocks (%) 19 21 23 26 21 23Gross national income (GNI) 11,402 13,755 13,481 14,370 14,998 15,814

88
JORDAN(US$ million, unless otherwise indicated)
2009 2015 2016 2017 2018 2019Summary external debt data by debtor typeTotal external debt stocks 14,444 25,792 27,292 30,233 32,157 33,683 Use of IMF credit 266 2,070 1,820 1,500 981 729 Long-term external debt 5,660 13,415 15,003 17,800 19,665 20,702 Public and publicly guaranteed sector 5,461 11,048 12,689 15,340 16,595 17,088 Public sector 5,323 10,963 12,612 15,270 16,561 17,058 of which: General government 5,156 10,350 12,021 14,660 15,965 16,389 Private sector guaranteed by public sector 139 85 76 69 34 30 Private sector not guaranteed 198 2,367 2,314 2,460 3,071 3,614 Short-term external debt 8,518 10,307 10,470 10,933 11,511 12,252
Disbursements (long-term) 787 3,267 3,502 3,241 2,817 2,841 Public and publicly guaranteed sector 762 2,975 3,242 2,994 2,049 2,066 Public sector 762 2,975 3,242 2,994 2,049 2,066 of which: General government 709 2,964 3,233 2,949 1,920 1,957 Private sector guaranteed by public sector 0 0 0 0 0 0 Private sector not guaranteed 25 292 259 247 769 775
Principal repayments (long-term) 425 1,602 1,653 663 762 1,791 Public and publicly guaranteed sector 405 1,538 1,578 565 604 1,560 Public sector 401 1,530 1,570 557 596 1,556 of which: General government 386 1,496 1,544 520 555 1,520 Private sector guaranteed by public sector 4 8 8 8 8 4 Private sector not guaranteed 20 64 75 98 158 231
Interest payments (long-term) 155 312 326 443 606 739 Public and publicly guaranteed sector 147 283 285 389 506 585 Public sector 141 279 281 386 503 584 of which: General government 134 259 260 366 483 561 Private sector guaranteed by public sector 6 4 4 3 3 1 Private sector not guaranteed 8 29 42 55 99 153
Summary external debt stock by creditor typeLong-term external debt stocks 5,660 13,415 15,003 17,800 19,665 20,702 Public and publicly guaranteed debt from: 5,461 11,048 12,689 15,340 16,595 17,088 Official creditors 5,154 5,481 6,096 6,745 7,329 8,449 Multilateral 2,361 2,881 3,290 3,449 3,822 4,786 of which: World Bank 1,109 1,550 1,857 1,876 2,252 2,985 Bilateral 2,792 2,600 2,806 3,296 3,507 3,663 Private creditors 308 5,567 6,593 8,595 9,266 8,638 Bondholders 145 5,458 6,444 8,429 9,115 8,500 Commercial banks and others 163 109 149 166 152 138 Private nonguaranteed debt from: 198 2,367 2,314 2,460 3,071 3,614 Bondholders .. .. .. .. .. .. Commercial banks and others 198 2,367 2,314 2,460 3,071 3,614Use of IMF credit 266 2,070 1,820 1,500 981 729
Net financial inflowsNet debt inflows Use of IMF credit -16 552 -195 -416 -493 -246 Long-term 362 1,665 1,848 2,578 2,056 1,050 Official creditors 360 206 636 438 770 1,133 Multilateral 427 6 428 101 397 971 of which: World Bank 237 155 308 19 376 733 Bilateral -67 200 209 337 373 162 Private creditors 2 1,459 1,212 2,140 1,286 -83 Bondholders .. 1,236 986 1,986 686 -615 Banks and others 2 224 227 155 600 531 Short-term -78 -581 163 463 578 742Net equity inflows Foreign direct investment 2,413 1,600 1,553 2,030 950 825 Portfolio equity -30 15 334 -476 41 -31
Debt ratiosExternal debt stocks to exports (%) 120 174 190 199 200 192External debt stocks to GNI (%) 59 69 70 75 77 78Debt service to exports (%) 6 14 17 12 14 19Short-term to external debt stocks (%) 59 40 38 36 36 36Multilateral to external debt stocks (%) 16 11 12 11 12 14Reserves to external debt stocks (%) 81 59 51 .. .. ..Gross national income (GNI) 24,529 37,611 38,892 40,503 42,032 43,429

89
KAZAKHSTAN(US$ million, unless otherwise indicated)
2009 2015 2016 2017 2018 2019Summary external debt data by debtor typeTotal external debt stocks 109,741 153,180 163,488 158,949 156,979 156,263 Use of IMF credit 539 476 462 489 478 475 Long-term external debt 102,217 146,443 156,294 150,781 148,135 146,800 Public and publicly guaranteed sector 2,487 20,114 21,425 21,295 24,181 24,716 Public sector 2,487 20,114 21,425 21,295 24,181 24,716 of which: General government 2,196 13,001 14,071 13,806 14,652 15,220 Private sector guaranteed by public sector .. .. .. .. .. .. Private sector not guaranteed 99,731 126,329 134,869 129,486 123,954 122,084 Short-term external debt 6,985 6,260 6,732 7,678 8,366 8,989
Disbursements (long-term) 30,471 34,595 30,505 31,525 33,912 31,801 Public and publicly guaranteed sector 717 5,375 1,712 892 3,504 1,975 Public sector 717 5,375 1,712 892 3,504 1,975 of which: General government 689 5,375 1,454 243 1,447 1,581 Private sector guaranteed by public sector .. .. .. .. .. .. Private sector not guaranteed 29,754 29,220 28,793 30,632 30,408 29,826
Principal repayments (long-term) 20,033 31,267 17,415 24,529 29,807 29,334 Public and publicly guaranteed sector 131 326 418 1,042 581 1,433 Public sector 131 326 418 1,042 581 1,433 of which: General government 90 313 401 528 565 1,003 Private sector guaranteed by public sector .. .. .. .. .. .. Private sector not guaranteed 19,902 30,941 16,997 23,487 29,226 27,901
Interest payments (long-term) 5,366 3,468 2,668 3,185 3,518 3,177 Public and publicly guaranteed sector 58 526 801 859 902 1,079 Public sector 58 526 801 859 902 1,079 of which: General government 47 166 434 489 525 586 Private sector guaranteed by public sector .. .. .. .. .. .. Private sector not guaranteed 5,307 2,942 1,866 2,325 2,617 2,098
Summary external debt stock by creditor typeLong-term external debt stocks 102,217 146,443 156,294 150,781 148,135 146,800 Public and publicly guaranteed debt from: 2,487 20,114 21,425 21,295 24,181 24,716 Official creditors 2,486 6,679 7,990 8,361 8,372 7,634 Multilateral 1,349 6,094 7,175 6,925 6,638 6,010 of which: World Bank 547 3,261 4,313 4,185 3,977 3,802 Bilateral 1,137 585 815 1,435 1,734 1,624 Private creditors 1 13,435 13,435 12,935 15,810 17,082 Bondholders .. 13,435 13,435 12,935 15,810 17,082 Commercial banks and others 1 .. .. .. .. .. Private nonguaranteed debt from: 99,731 126,329 134,869 129,486 123,954 122,084 Bondholders 22,097 6,683 6,273 9,272 7,908 6,415 Commercial banks and others 77,634 119,647 128,596 120,213 116,046 115,669Use of IMF credit 539 476 462 489 478 475
Net financial inflowsNet debt inflows Use of IMF credit .. .. .. .. .. .. Long-term 10,437 3,328 13,090 6,995 4,105 2,467 Official creditors 587 1,049 1,294 350 9 -746 Multilateral 600 1,093 1,082 -250 -281 -629 of which: World Bank 84 -168 1,053 -128 -208 -175 Bilateral -13 -44 212 600 290 -117 Private creditors 9,851 2,280 11,796 6,645 4,096 3,213 Bondholders -2,108 -2,998 -482 1,499 2,797 -101 Banks and others 11,958 5,277 12,278 5,146 1,299 3,314 Short-term -2,502 -3,453 300 929 661 617Net equity inflows Foreign direct investment 4,183 1,979 9,042 5,748 2,765 6,831 Portfolio equity 38 6 -27 22 -1,520 479
Debt ratiosExternal debt stocks to exports (%) 214 288 373 283 225 229External debt stocks to GNI (%) 107 89 132 107 100 99Debt service to exports (%) 50 65 46 50 48 48Short-term to external debt stocks (%) 6 4 4 5 5 6Multilateral to external debt stocks (%) 1 4 4 4 4 4Reserves to external debt stocks (%) 19 13 12 11 11 6Gross national income (GNI) 102,891 172,771 123,828 148,657 157,279 157,872

90
KENYA(US$ million, unless otherwise indicated)
2009 2015 2016 2017 2018 2019Summary external debt data by debtor typeTotal external debt stocks 8,559 19,777 21,061 26,198 30,688 34,217 Use of IMF credit 858 1,205 1,103 1,047 879 720 Long-term external debt 6,741 15,874 17,824 22,494 27,263 30,886 Public and publicly guaranteed sector 6,741 15,139 17,150 21,646 26,242 30,069 Public sector 6,741 15,139 17,150 21,646 26,242 30,069 of which: General government 6,337 14,744 16,653 21,085 25,483 29,264 Private sector guaranteed by public sector .. .. .. .. .. .. Private sector not guaranteed .. 735 673 849 1,021 817 Short-term external debt 961 2,698 2,134 2,657 2,546 2,611
Disbursements (long-term) 538 3,149 2,798 4,463 6,629 6,723 Public and publicly guaranteed sector 538 2,609 2,663 4,429 6,255 6,713 Public sector 538 2,609 2,663 4,429 6,255 6,713 of which: General government 515 2,574 2,548 4,341 6,024 6,638 Private sector guaranteed by public sector .. .. .. .. .. .. Private sector not guaranteed .. 540 135 34 374 10
Principal repayments (long-term) 259 436 533 713 1,566 3,010 Public and publicly guaranteed sector 259 344 336 572 1,370 2,800 Public sector 259 344 336 572 1,370 2,800 of which: General government 228 326 315 525 1,331 2,763 Private sector guaranteed by public sector .. .. .. .. .. .. Private sector not guaranteed .. 91 196 141 196 210
Interest payments (long-term) 85 364 479 657 976 1,222 Public and publicly guaranteed sector 85 350 438 606 921 1,162 Public sector 85 350 438 606 921 1,162 of which: General government 78 346 435 603 918 1,157 Private sector guaranteed by public sector .. .. .. .. .. .. Private sector not guaranteed .. 14 42 51 55 61
Summary external debt stock by creditor typeLong-term external debt stocks 6,741 15,874 17,824 22,494 27,263 30,886 Public and publicly guaranteed debt from: 6,741 15,139 17,150 21,646 26,242 30,069 Official creditors 6,407 11,376 13,289 16,779 19,609 22,968 Multilateral 3,946 6,370 6,981 8,778 10,116 12,716 of which: World Bank 3,156 4,382 4,568 5,303 5,802 7,125 Bilateral 2,461 5,006 6,308 8,001 9,493 10,252 Private creditors 334 3,763 3,861 4,867 6,634 7,101 Bondholders .. 2,750 2,750 2,750 4,750 6,100 Commercial banks and others 334 1,013 1,111 2,117 1,884 1,001 Private nonguaranteed debt from: .. 735 673 849 1,021 817 Bondholders .. .. .. .. .. .. Commercial banks and others .. 735 673 849 1,021 817Use of IMF credit 858 1,205 1,103 1,047 879 720
Net financial inflowsNet debt inflows Use of IMF credit 191 -66 -68 -119 -146 -154 Long-term 278 2,714 2,266 3,750 5,063 3,712 Official creditors 273 1,505 2,176 2,895 3,090 3,432 Multilateral 183 615 813 1,421 1,510 2,641 of which: World Bank 83 365 334 455 631 1,359 Bilateral 90 891 1,363 1,474 1,580 791 Private creditors 5 1,208 90 855 1,973 280 Bondholders .. .. .. .. 2,000 1,350 Banks and others 5 1,208 90 855 -27 -1,070 Short-term 4 696 -593 457 -132 139Net equity inflows Foreign direct investment 32 90 432 793 627 901 Portfolio equity 3 11 57 -126 -293 14
Debt ratiosExternal debt stocks to exports (%) 113 185 210 247 261 292External debt stocks to GNI (%) 23 31 31 34 36 37Debt service to exports (%) 5 8 11 15 24 38Short-term to external debt stocks (%) 11 14 10 10 8 8Multilateral to external debt stocks (%) 46 32 33 34 33 37Reserves to external debt stocks (%) 45 38 36 28 27 27Gross national income (GNI) 36,977 63,195 68,178 77,456 86,329 93,578

91
KOSOVO(US$ million, unless otherwise indicated)
2009 2015 2016 2017 2018 2019Summary external debt data by debtor typeTotal external debt stocks 1,725.7 2,158.5 2,124.8 2,504.2 2,320.7 2,428.2 Use of IMF credit 86.8 215.8 194.6 271.7 260.4 224.9 Long-term external debt 817.8 1,263.3 1,309.2 1,396.6 1,260.3 1,357.2 Public and publicly guaranteed sector 358.5 265.1 274.2 313.4 299.6 319.7 Public sector 358.5 265.1 274.2 313.4 297.3 319.7 of which: General government 358.5 248.0 239.8 263.2 249.8 267.4 Private sector guaranteed by public sector .. 0.0 0.0 0.0 2.3 0.0 Private sector not guaranteed 459.3 998.2 1,035.0 1,083.2 960.7 1,037.5 Short-term external debt 821.1 679.3 621.0 836.0 800.0 846.0
Disbursements (long-term) 90.1 111.3 193.1 196.1 220.2 282.9 Public and publicly guaranteed sector .. 33.3 36.5 24.7 20.3 43.6 Public sector .. 33.3 36.5 24.7 18.0 43.6 of which: General government .. 24.9 14.0 9.5 12.8 38.9 Private sector guaranteed by public sector .. .. .. .. 2.4 .. Private sector not guaranteed 90.1 78.0 156.6 171.4 199.9 239.4
Principal repayments (long-term) 269.0 79.0 107.5 97.5 208.6 170.9 Public and publicly guaranteed sector 207.7 13.9 18.7 19.8 21.6 23.4 Public sector 207.7 13.9 18.7 19.8 21.6 23.4 of which: General government 207.7 12.4 14.9 15.1 16.1 17.2 Private sector guaranteed by public sector .. .. .. .. .. .. Private sector not guaranteed 61.2 65.2 88.8 77.6 187.0 147.5
Interest payments (long-term) 44.1 62.1 55.8 49.8 55.3 47.4 Public and publicly guaranteed sector 22.5 10.0 10.6 10.6 10.8 10.4 Public sector 22.5 10.0 10.6 10.6 10.8 10.4 of which: General government 22.5 9.3 9.6 9.2 9.2 8.6 Private sector guaranteed by public sector .. .. .. .. .. .. Private sector not guaranteed 21.5 52.2 45.2 39.2 44.5 37.0
Summary external debt stock by creditor typeLong-term external debt stocks 817.8 1,263.3 1,309.2 1,396.6 1,260.3 1,357.2 Public and publicly guaranteed debt from: 358.5 265.1 274.2 313.4 299.6 319.7 Official creditors 358.5 261.9 267.3 304.9 291.5 303.7 Multilateral 358.5 228.5 217.1 239.2 235.3 253.6 of which: World Bank 358.5 228.5 217.1 239.1 225.0 220.1 Bilateral .. 33.3 50.2 65.7 56.3 50.1 Private creditors .. 3.2 6.8 8.4 8.1 16.0 Bondholders .. .. .. .. .. .. Commercial banks and others .. 3.2 6.8 8.4 8.1 16.0 Private nonguaranteed debt from: 459.3 998.2 1,035.0 1,083.2 960.7 1,037.5 Bondholders .. .. .. .. .. .. Commercial banks and others 459.3 998.2 1,035.0 1,083.2 960.7 1,037.5Use of IMF credit 86.8 215.8 194.6 271.7 260.4 224.9
Net financial inflowsNet debt inflows Use of IMF credit .. 21.1 -15.3 63.8 -5.0 -34.0 Long-term -178.8 32.3 85.6 98.6 11.7 112.0 Official creditors -207.7 18.4 13.9 4.2 -1.2 12.1 Multilateral -207.7 -5.1 -5.0 -3.9 5.4 17.2 of which: World Bank -207.7 -5.1 -5.0 -4.0 -5.0 -1.4 Bilateral .. 23.5 18.8 8.1 -6.7 -5.1 Private creditors 28.9 13.9 71.7 94.4 12.9 99.9 Bondholders .. .. .. .. .. .. Banks and others 28.9 13.9 71.7 94.4 12.9 99.9 Short-term 626.9 -100.8 -58.3 215.0 -36.0 46.0Net equity inflows Foreign direct investment 371.0 253.3 202.2 262.1 309.3 281.3 Portfolio equity 0.0 0.0 0.0 0.0 0.0 0.0
Debt ratiosExternal debt stocks to exports (%) 140.6 130.0 116.0 111.3 89.6 92.5External debt stocks to GNI (%) 30.1 33.0 31.2 33.9 28.7 30.0Debt service to exports (%) 25.5 9.7 12.0 8.7 10.5 9.8Short-term to external debt stocks (%) 47.6 31.5 29.2 33.4 34.5 34.8Multilateral to external debt stocks (%) 20.8 10.6 10.2 9.6 10.1 10.4Reserves to external debt stocks (%) 48.1 35.7 30.0 32.7 38.0 39.8Gross national income (GNI) 5,738.0 6,545.8 6,801.0 7,393.0 8,076.8 8,092.8

92
KYRGYZ REPUBLIC(US$ million, unless otherwise indicated)
2009 2015 2016 2017 2018 2019Summary external debt data by debtor typeTotal external debt stocks 4,119 7,720 7,975 8,131 8,171 8,339 Use of IMF credit 300 306 302 321 285 258 Long-term external debt 3,395 7,063 7,312 7,454 7,429 7,562 Public and publicly guaranteed sector 2,319 3,431 3,609 3,892 3,660 3,720 Public sector 2,319 3,431 3,609 3,892 3,660 3,720 of which: General government 2,319 3,431 3,609 3,892 3,660 3,720 Private sector guaranteed by public sector .. .. .. .. .. .. Private sector not guaranteed 1,076 3,632 3,702 3,562 3,769 3,843 Short-term external debt 424 352 362 356 457 519
Disbursements (long-term) 635 780 901 529 687 580 Public and publicly guaranteed sector 378 316 343 286 150 190 Public sector 378 316 343 286 150 190 of which: General government 378 316 343 286 150 190 Private sector guaranteed by public sector .. .. .. .. .. .. Private sector not guaranteed 257 464 558 243 537 390
Principal repayments (long-term) 200 320 574 465 432 438 Public and publicly guaranteed sector 38 73 86 82 102 122 Public sector 38 73 86 82 102 122 of which: General government 36 73 86 82 102 122 Private sector guaranteed by public sector .. .. .. .. .. .. Private sector not guaranteed 162 247 488 383 331 316
Interest payments (long-term) 37 71 75 83 84 87 Public and publicly guaranteed sector 19 44 47 51 54 56 Public sector 19 44 47 51 54 56 of which: General government 19 44 47 51 54 56 Private sector guaranteed by public sector .. .. .. .. .. .. Private sector not guaranteed 18 27 28 32 30 31
Summary external debt stock by creditor typeLong-term external debt stocks 3,395 7,063 7,312 7,454 7,429 7,562 Public and publicly guaranteed debt from: 2,319 3,431 3,609 3,892 3,660 3,720 Official creditors 2,319 3,431 3,609 3,892 3,660 3,720 Multilateral 1,309 1,356 1,352 1,452 1,450 1,464 of which: World Bank 656 652 631 667 660 657 Bilateral 1,010 2,075 2,257 2,440 2,211 2,256 Private creditors .. .. .. .. .. .. Bondholders .. .. .. .. .. .. Commercial banks and others .. .. .. .. .. .. Private nonguaranteed debt from: 1,076 3,632 3,702 3,562 3,769 3,843 Bondholders .. .. .. .. 0 0 Commercial banks and others 1,076 3,632 3,702 3,562 3,768 3,842Use of IMF credit 300 306 302 321 285 258
Net financial inflowsNet debt inflows Use of IMF credit 0 11 6 1 -29 -26 Long-term 435 460 327 64 254 142 Official creditors 340 242 257 204 48 68 Multilateral 8 41 31 19 32 23 of which: World Bank -4 9 -2 -1 8 1 Bilateral 332 201 226 185 16 45 Private creditors 96 218 71 -141 206 74 Bondholders .. .. .. .. .. 0 Banks and others 96 218 71 -141 206 74 Short-term 37 40 10 -6 101 61Net equity inflows Foreign direct investment 178 890 446 -17 86 332 Portfolio equity 1 0 -1 0 0 0
Debt ratiosExternal debt stocks to exports (%) 175 315 328 312 294 267External debt stocks to GNI (%) 91 120 124 111 102 106Debt service to exports (%) 11 17 28 22 20 18Short-term to external debt stocks (%) 10 5 5 4 6 6Multilateral to external debt stocks (%) 32 18 17 18 18 18Reserves to external debt stocks (%) 36 21 23 23 21 21Gross national income (GNI) 4,509 6,417 6,455 7,331 8,020 7,837

93
LAO PEOPLE'S DEMOCRATIC REPUBLIC(US$ million, unless otherwise indicated)
2009 2015 2016 2017 2018 2019Summary external debt data by debtor typeTotal external debt stocks 6,383 11,642 13,535 14,696 15,377 16,686 Use of IMF credit 95 70 68 72 70 70 Long-term external debt 6,084 10,873 12,745 13,879 14,903 16,031 Public and publicly guaranteed sector 3,460 6,689 7,313 8,419 9,315 10,314 Public sector 3,460 6,689 7,313 8,419 9,315 10,314 of which: General government 3,237 6,489 7,117 8,252 9,151 10,155 Private sector guaranteed by public sector .. 0 0 0 0 0 Private sector not guaranteed 2,625 4,183 5,433 5,461 5,588 5,717 Short-term external debt 204 699 722 745 404 585
Disbursements (long-term) 738 2,517 2,308 1,332 1,650 1,331 Public and publicly guaranteed sector 292 1,384 968 1,156 1,402 1,208 Public sector 292 1,384 968 1,156 1,402 1,208 of which: General government 286 1,384 968 1,156 1,377 1,208 Private sector guaranteed by public sector .. .. .. .. .. .. Private sector not guaranteed 447 1,133 1,340 176 248 124
Principal repayments (long-term) 150 238 326 446 536 276 Public and publicly guaranteed sector 61 145 236 298 416 274 Public sector 61 145 236 298 416 274 of which: General government 57 140 231 269 389 269 Private sector guaranteed by public sector .. .. .. .. .. .. Private sector not guaranteed 89 92 91 148 120 2
Interest payments (long-term) 72 176 223 281 328 244 Public and publicly guaranteed sector 29 104 138 176 222 211 Public sector 29 104 138 176 222 211 of which: General government 28 103 138 176 222 211 Private sector guaranteed by public sector .. .. .. .. .. .. Private sector not guaranteed 43 72 85 105 106 33
Summary external debt stock by creditor typeLong-term external debt stocks 6,084 10,873 12,745 13,879 14,903 16,031 Public and publicly guaranteed debt from: 3,460 6,689 7,313 8,419 9,315 10,314 Official creditors 3,378 5,703 6,050 6,696 7,428 8,380 Multilateral 2,032 1,546 1,478 1,600 1,577 1,701 of which: World Bank 680 511 493 582 588 659 Bilateral 1,347 4,157 4,572 5,097 5,851 6,679 Private creditors 81 987 1,263 1,722 1,887 1,934 Bondholders .. 838 1,082 1,484 1,596 1,671 Commercial banks and others 81 148 181 238 291 263 Private nonguaranteed debt from: 2,625 4,183 5,433 5,461 5,588 5,717 Bondholders .. 246 558 510 560 691 Commercial banks and others 2,625 3,937 4,874 4,951 5,028 5,026Use of IMF credit 95 70 68 72 70 70
Net financial inflowsNet debt inflows Use of IMF credit -6 .. .. .. .. .. Long-term 589 2,280 1,982 886 1,113 1,055 Official creditors 231 627 451 461 819 959 Multilateral 17 -44 -25 36 13 133 of which: World Bank -10 -21 -4 60 19 74 Bilateral 214 671 475 425 806 827 Private creditors 358 1,652 1,531 425 294 96 Bondholders .. 538 560 309 158 124 Banks and others 358 1,114 971 116 137 -28 Short-term 55 -125 23 23 -341 181Net equity inflows Foreign direct investment 319 1,078 935 1,693 1,320 557 Portfolio equity 0 0 -5 -34 2 ..
Debt ratiosExternal debt stocks to exports (%) 428 252 260 254 242 237External debt stocks to GNI (%) 113 85 89 92 90 94Debt service to exports (%) 15 9 11 13 14 7Short-term to external debt stocks (%) 3 6 5 5 3 4Multilateral to external debt stocks (%) 32 13 11 11 10 10Reserves to external debt stocks (%) 11 9 7 7 6 6Gross national income (GNI) 5,668 13,750 15,126 15,964 17,116 17,746

94
LEBANON(US$ million, unless otherwise indicated)
2009 2015 2016 2017 2018 2019Summary external debt data by debtor typeTotal external debt stocks 46,144 68,226 69,515 74,169 79,706 73,985 Use of IMF credit 422 268 260 275 269 267 Long-term external debt 42,723 59,579 61,401 65,130 73,890 68,755 Public and publicly guaranteed sector 20,764 26,729 27,708 29,991 33,077 33,325 Public sector 20,764 26,729 27,708 29,991 33,077 33,325 of which: General government 20,764 26,729 27,708 29,991 33,077 33,325 Private sector guaranteed by public sector .. .. .. .. .. .. Private sector not guaranteed 21,959 32,849 33,693 35,140 40,813 35,430 Short-term external debt 2,999 8,379 7,854 8,764 5,547 4,963
Disbursements (long-term) 10,325 14,037 13,374 16,061 20,797 8,647 Public and publicly guaranteed sector 3,150 3,962 3,651 5,152 5,716 3,173 Public sector 3,150 3,962 3,651 5,152 5,716 3,173 of which: General government 3,150 3,962 3,651 5,152 5,716 3,173 Private sector guaranteed by public sector .. .. .. .. .. .. Private sector not guaranteed 7,176 10,075 9,724 10,909 15,080 5,474
Principal repayments (long-term) 8,401 10,451 11,308 12,493 11,995 13,774 Public and publicly guaranteed sector 3,107 2,287 2,627 3,031 2,588 2,917 Public sector 3,107 2,287 2,627 3,031 2,588 2,917 of which: General government 3,107 2,287 2,627 3,031 2,588 2,917 Private sector guaranteed by public sector .. .. .. .. .. .. Private sector not guaranteed 5,294 8,165 8,680 9,462 9,407 10,858
Interest payments (long-term) 2,651 3,480 3,689 3,779 4,275 4,600 Public and publicly guaranteed sector 1,432 1,623 1,718 1,760 2,150 2,142 Public sector 1,432 1,623 1,718 1,760 2,150 2,142 of which: General government 1,432 1,623 1,718 1,760 2,150 2,142 Private sector guaranteed by public sector .. .. .. .. .. .. Private sector not guaranteed 1,220 1,856 1,971 2,018 2,125 2,458
Summary external debt stock by creditor typeLong-term external debt stocks 42,723 59,579 61,401 65,130 73,890 68,755 Public and publicly guaranteed debt from: 20,764 26,729 27,708 29,991 33,077 33,325 Official creditors 2,472 1,835 1,765 2,030 1,949 1,881 Multilateral 1,399 991 1,039 1,337 1,375 1,379 of which: World Bank 318 189 254 441 510 536 Bilateral 1,073 844 726 692 574 502 Private creditors 18,292 24,895 25,944 27,961 31,128 31,444 Bondholders 17,704 24,628 25,727 27,768 30,964 31,314 Commercial banks and others 588 266 217 193 164 130 Private nonguaranteed debt from: 21,959 32,849 33,693 35,140 40,813 35,430 Bondholders 670 700 500 300 600 600 Commercial banks and others 21,289 32,149 33,193 34,840 40,213 34,830Use of IMF credit 422 268 260 275 269 267
Net financial inflowsNet debt inflows Use of IMF credit .. .. .. .. .. .. Long-term 1,924 3,586 2,067 3,568 8,802 -5,128 Official creditors -103 -122 -43 177 -50 -61 Multilateral -1 -30 63 264 54 7 of which: World Bank -50 13 67 186 70 26 Bilateral -102 -92 -106 -86 -105 -68 Private creditors 2,027 3,708 2,110 3,390 8,852 -5,066 Bondholders 388 1,846 1,114 1,776 3,504 350 Banks and others 1,639 1,862 996 1,614 5,348 -5,416 Short-term -78 373 -525 909 -3,217 -584Net equity inflows Foreign direct investment 4,804 2,158 2,568 2,519 2,650 2,220 Portfolio equity 929 -1,002 -135 -294 -266 344
Debt ratiosExternal debt stocks to exports (%) 199 312 326 336 363 352External debt stocks to GNI (%) 131 138 138 140 146 139Debt service to exports (%) 48 64 71 75 75 88Short-term to external debt stocks (%) 6 12 11 12 7 7Multilateral to external debt stocks (%) 3 1 1 2 2 2Reserves to external debt stocks (%) 63 57 62 59 51 52Gross national income (GNI) 35,174 49,403 50,390 52,931 54,647 53,147

95
LESOTHO(US$ million, unless otherwise indicated)
2009 2015 2016 2017 2018 2019Summary external debt data by debtor typeTotal external debt stocks 766.5 921.4 921.5 936.0 904.6 938.8 Use of IMF credit 75.7 114.6 108.3 108.1 93.8 79.3 Long-term external debt 687.8 773.8 774.8 827.5 810.3 859.1 Public and publicly guaranteed sector 687.8 773.8 774.8 827.5 810.3 859.1 Public sector 687.8 773.8 774.8 827.5 810.3 859.1 of which: General government 676.6 773.4 774.1 826.4 808.0 854.5 Private sector guaranteed by public sector .. .. .. .. .. .. Private sector not guaranteed .. .. .. .. .. .. Short-term external debt 3.0 33.1 38.4 0.4 0.5 0.4
Disbursements (long-term) 40.8 70.6 59.6 38.9 43.7 73.6 Public and publicly guaranteed sector 40.8 70.6 59.6 38.9 43.7 73.6 Public sector 40.8 70.6 59.6 38.9 43.7 73.6 of which: General government 40.8 70.4 59.3 38.5 42.5 71.2 Private sector guaranteed by public sector .. .. .. .. .. .. Private sector not guaranteed .. .. .. .. .. ..
Principal repayments (long-term) 24.6 31.3 40.2 33.2 42.0 41.5 Public and publicly guaranteed sector 24.6 31.3 40.2 33.2 42.0 41.5 Public sector 24.6 31.3 40.2 33.2 42.0 41.5 of which: General government 23.4 27.0 40.1 33.2 42.0 41.5 Private sector guaranteed by public sector .. .. .. .. .. .. Private sector not guaranteed .. .. .. .. .. ..
Interest payments (long-term) 7.4 20.3 14.2 16.1 16.9 23.8 Public and publicly guaranteed sector 7.4 20.3 14.2 16.1 16.9 23.8 Public sector 7.4 20.3 14.2 16.1 16.9 23.8 of which: General government 6.6 19.7 14.2 16.1 16.9 23.8 Private sector guaranteed by public sector .. .. .. .. .. .. Private sector not guaranteed .. .. .. .. .. ..
Summary external debt stock by creditor typeLong-term external debt stocks 687.8 773.8 774.8 827.5 810.3 859.1 Public and publicly guaranteed debt from: 687.8 773.8 774.8 827.5 810.3 859.1 Official creditors 672.6 770.1 771.5 824.1 807.1 856.2 Multilateral 614.0 655.8 648.5 703.5 697.9 724.5 of which: World Bank 313.2 283.7 284.1 321.4 338.3 362.8 Bilateral 58.6 114.3 123.0 120.6 109.2 131.7 Private creditors 15.2 3.7 3.3 3.5 3.1 2.9 Bondholders .. .. .. .. .. .. Commercial banks and others 15.2 3.7 3.3 3.5 3.1 2.9 Private nonguaranteed debt from: .. .. .. .. .. .. Bondholders .. .. .. .. .. .. Commercial banks and others .. .. .. .. .. ..Use of IMF credit 75.7 114.6 108.3 108.1 93.8 79.3
Net financial inflowsNet debt inflows Use of IMF credit -5.9 -1.1 -3.0 -6.5 -11.9 -14.0 Long-term 16.2 39.3 19.4 5.7 1.6 32.1 Official creditors 17.1 43.9 19.8 5.9 1.8 32.3 Multilateral 4.1 33.9 7.5 12.3 10.6 19.8 of which: World Bank 5.2 2.4 8.7 20.9 24.6 27.7 Bilateral 13.0 10.0 12.3 -6.4 -8.8 12.5 Private creditors -0.9 -4.5 -0.3 -0.2 -0.2 -0.2 Bondholders .. .. .. .. .. .. Banks and others -0.9 -4.5 -0.3 -0.2 -0.2 -0.2 Short-term 1.0 33.0 5.2 -37.9 -0.3 0.3Net equity inflows Foreign direct investment 85.6 52.9 45.7 45.9 50.6 46.5 Portfolio equity 0.0 0.3 0.2 0.2 0.3 0.2
Debt ratiosExternal debt stocks to exports (%) 52.0 64.5 62.5 55.9 48.6 58.7External debt stocks to GNI (%) 33.0 34.6 37.7 34.4 30.9 33.5Debt service to exports (%) 2.6 3.7 3.9 3.3 3.8 5.0Short-term to external debt stocks (%) 0.4 3.6 4.2 0.0 0.1 0.0Multilateral to external debt stocks (%) 80.1 71.2 70.4 75.2 77.2 77.2Reserves to external debt stocks (%) 153.9 108.2 100.4 70.3 80.5 82.5Gross national income (GNI) 2,325.4 2,666.6 2,442.9 2,722.7 2,927.0 2,805.7

96
LIBERIA(US$ million, unless otherwise indicated)
2009 2015 2016 2017 2018 2019Summary external debt data by debtor typeTotal external debt stocks 1,850.3 839.1 952.6 1,122.2 1,228.5 1,357.4 Use of IMF credit 1,085.5 332.1 359.4 401.8 389.5 396.3 Long-term external debt 673.1 507.0 593.2 720.4 839.0 961.1 Public and publicly guaranteed sector 673.1 436.0 528.3 661.6 787.9 917.6 Public sector 673.1 436.0 528.3 659.7 783.8 912.6 of which: General government 660.8 436.0 528.3 659.7 783.8 912.6 Private sector guaranteed by public sector .. .. 0.0 2.0 4.0 5.0 Private sector not guaranteed .. 71.0 64.9 58.8 51.2 43.5 Short-term external debt 91.6 0.0 0.0 0.0 0.0 0.1
Disbursements (long-term) 0.0 166.9 103.7 112.4 155.8 142.6 Public and publicly guaranteed sector 0.0 150.9 103.7 112.4 155.8 142.6 Public sector 0.0 150.9 103.7 110.3 153.4 141.3 of which: General government 0.0 150.9 103.7 110.3 153.4 141.3 Private sector guaranteed by public sector .. .. .. 2.1 2.5 1.3 Private sector not guaranteed .. 16.0 .. .. .. ..
Principal repayments (long-term) 4.3 5.4 7.7 9.3 23.9 16.3 Public and publicly guaranteed sector 4.3 2.4 1.6 3.2 16.2 8.7 Public sector 4.3 2.4 1.6 3.0 16.0 8.5 of which: General government 4.3 2.4 1.6 3.0 16.0 8.5 Private sector guaranteed by public sector .. .. .. 0.2 0.2 0.2 Private sector not guaranteed .. 3.0 6.1 6.1 7.6 7.6
Interest payments (long-term) 11.8 3.8 4.2 5.6 8.4 8.4 Public and publicly guaranteed sector 11.8 2.7 3.0 4.8 7.4 7.0 Public sector 11.8 2.7 3.0 4.7 7.3 6.9 of which: General government 10.8 2.7 3.0 4.7 7.3 6.9 Private sector guaranteed by public sector .. .. .. 0.0 0.1 0.1 Private sector not guaranteed .. 1.1 1.2 0.9 1.0 1.4
Summary external debt stock by creditor typeLong-term external debt stocks 673.1 507.0 593.2 720.4 839.0 961.1 Public and publicly guaranteed debt from: 673.1 436.0 528.3 661.6 787.9 917.6 Official creditors 652.6 436.0 528.3 661.6 787.9 917.6 Multilateral 154.5 321.6 395.6 506.0 590.2 706.4 of which: World Bank 69.0 164.3 231.3 306.4 367.6 454.9 Bilateral 498.1 114.4 132.7 155.6 197.6 211.2 Private creditors 20.5 .. .. .. 0.0 .. Bondholders .. .. .. .. .. .. Commercial banks and others 20.5 .. .. .. 0.0 .. Private nonguaranteed debt from: .. 71.0 64.9 58.8 51.2 43.5 Bondholders .. .. .. .. .. .. Commercial banks and others .. 71.0 64.9 58.8 51.2 43.5Use of IMF credit 1,085.5 332.1 359.4 401.8 389.5 396.3
Net financial inflowsNet debt inflows Use of IMF credit 17.6 19.4 38.5 20.5 -3.0 9.0 Long-term -4.3 161.6 95.9 103.1 132.0 126.3 Official creditors -4.3 148.6 102.0 109.2 139.6 133.9 Multilateral -4.3 148.5 83.6 87.1 95.3 119.4 of which: World Bank -3.3 67.2 74.3 59.6 69.3 89.4 Bilateral .. 0.1 18.4 22.1 44.3 14.6 Private creditors .. 13.0 -6.1 -6.1 -7.6 -7.6 Bondholders .. .. .. .. .. .. Banks and others .. 13.0 -6.1 -6.1 -7.6 -7.6 Short-term 0.0 0.0 0.0 0.0 0.0 0.0Net equity inflows Foreign direct investment 2.9 53.1 141.7 188.4 59.1 100.7 Portfolio equity 0.0 0.0 0.0 0.0 .. ..
Debt ratiosExternal debt stocks to exports (%) 391.9 161.0 240.0 249.5 219.8 235.6External debt stocks to GNI (%) 114.0 29.0 31.8 37.6 43.5 50.0Debt service to exports (%) 5.8 8.7 3.0 3.4 6.3 7.1Short-term to external debt stocks (%) 5.0 0.0 0.0 0.0 0.0 0.0Multilateral to external debt stocks (%) 8.4 38.3 41.5 45.1 48.0 52.0Reserves to external debt stocks (%) 20.1 68.5 62.5 53.5 45.6 25.7Gross national income (GNI) 1,623.4 2,897.0 2,996.8 2,982.6 2,827.0 2,717.6

97
MADAGASCAR(US$ million, unless otherwise indicated)
2009 2015 2016 2017 2018 2019Summary external debt data by debtor typeTotal external debt stocks 2,847 3,007 2,976 3,382 3,730 4,065 Use of IMF credit 284 281 301 440 465 545 Long-term external debt 1,914 2,522 2,470 2,765 2,994 3,239 Public and publicly guaranteed sector 1,895 2,509 2,465 2,735 2,902 3,120 Public sector 1,893 2,509 2,465 2,735 2,902 3,120 of which: General government 1,870 2,422 2,387 2,670 2,826 2,990 Private sector guaranteed by public sector 2 .. .. .. .. .. Private sector not guaranteed 19 13 5 30 92 119 Short-term external debt 649 204 204 177 271 281
Disbursements (long-term) 124 323 133 272 363 328 Public and publicly guaranteed sector 124 323 133 246 297 302 Public sector 124 323 133 246 297 302 of which: General government 121 251 133 246 285 247 Private sector guaranteed by public sector 0 .. .. .. .. .. Private sector not guaranteed .. .. .. 26 66 26
Principal repayments (long-term) 29 96 84 93 72 67 Public and publicly guaranteed sector 27 95 76 92 72 67 Public sector 26 95 76 92 72 67 of which: General government 18 85 68 77 71 67 Private sector guaranteed by public sector 1 .. .. .. .. .. Private sector not guaranteed 1 1 8 1 .. ..
Interest payments (long-term) 15 26 20 23 30 32 Public and publicly guaranteed sector 15 25 20 23 29 30 Public sector 15 25 20 23 29 30 of which: General government 14 25 20 22 29 29 Private sector guaranteed by public sector 0 .. .. .. .. .. Private sector not guaranteed 0 0 0 0 1 2
Summary external debt stock by creditor typeLong-term external debt stocks 1,914 2,522 2,470 2,765 2,994 3,239 Public and publicly guaranteed debt from: 1,895 2,509 2,465 2,735 2,902 3,120 Official creditors 1,887 2,422 2,387 2,609 2,738 2,966 Multilateral 1,486 1,973 2,015 2,254 2,349 2,491 of which: World Bank 1,105 1,412 1,433 1,595 1,648 1,686 Bilateral 401 450 372 355 390 475 Private creditors 8 86 78 127 164 154 Bondholders .. .. .. .. .. .. Commercial banks and others 8 86 78 127 164 154 Private nonguaranteed debt from: 19 13 5 30 92 119 Bondholders .. .. .. .. .. .. Commercial banks and others 19 13 5 30 92 119Use of IMF credit 284 281 301 440 465 545
Net financial inflowsNet debt inflows Use of IMF credit 0 26 29 118 36 83 Long-term 96 227 49 178 291 261 Official creditors 97 166 65 110 185 244 Multilateral 55 133 94 133 145 156 of which: World Bank 30 106 65 77 93 48 Bilateral 42 33 -30 -23 40 88 Private creditors -1 61 -15 68 106 17 Bondholders .. .. .. .. .. .. Banks and others -1 61 -15 68 106 17 Short-term 35 -74 26 -26 94 11Net equity inflows Foreign direct investment 72 20 31 30 36 227 Portfolio equity 0 0 0 0 0 ..
Debt ratiosExternal debt stocks to exports (%) 146 96 88 82 85 90External debt stocks to GNI (%) 30 27 26 26 28 30Debt service to exports (%) 3 4 4 3 3 3Short-term to external debt stocks (%) 23 7 7 5 7 7Multilateral to external debt stocks (%) 52 66 68 67 63 61Reserves to external debt stocks (%) 34 28 40 47 47 42Gross national income (GNI) 9,503 10,949 11,432 12,817 13,454 13,629

98
MALAWI(US$ million, unless otherwise indicated)
2009 2015 2016 2017 2018 2019Summary external debt data by debtor typeTotal external debt stocks 1,144.4 1,721.2 1,847.0 2,162.4 2,265.8 2,433.9 Use of IMF credit 230.9 254.7 295.9 318.9 314.1 339.5 Long-term external debt 846.5 1,453.9 1,507.0 1,789.8 1,926.2 2,026.1 Public and publicly guaranteed sector 846.5 1,453.9 1,507.0 1,789.8 1,926.2 2,026.1 Public sector 846.5 1,453.9 1,507.0 1,789.8 1,926.2 2,026.1 of which: General government 839.6 1,438.2 1,492.9 1,774.7 1,913.0 2,014.6 Private sector guaranteed by public sector .. .. .. .. .. .. Private sector not guaranteed .. .. .. .. .. .. Short-term external debt 67.0 12.7 44.0 53.7 25.4 68.3
Disbursements (long-term) 107.3 175.3 134.6 240.0 223.2 176.3 Public and publicly guaranteed sector 107.3 175.3 134.6 240.0 223.2 176.3 Public sector 107.3 175.3 134.6 240.0 223.2 176.3 of which: General government 107.1 175.3 134.6 240.0 223.2 176.3 Private sector guaranteed by public sector .. .. .. .. .. .. Private sector not guaranteed .. .. .. .. .. ..
Principal repayments (long-term) 22.4 30.3 32.8 32.7 42.6 65.6 Public and publicly guaranteed sector 22.4 30.3 32.8 32.7 42.6 65.6 Public sector 22.4 30.3 32.8 32.7 42.6 65.6 of which: General government 20.1 28.4 31.7 31.8 41.4 64.1 Private sector guaranteed by public sector .. .. .. .. .. .. Private sector not guaranteed .. .. .. .. .. ..
Interest payments (long-term) 14.8 15.6 17.0 15.6 12.1 17.1 Public and publicly guaranteed sector 14.8 15.6 17.0 15.6 12.1 17.1 Public sector 14.8 15.6 17.0 15.6 12.1 17.1 of which: General government 14.5 15.3 16.7 15.6 12.1 17.1 Private sector guaranteed by public sector .. .. .. .. .. .. Private sector not guaranteed .. .. .. .. .. ..
Summary external debt stock by creditor typeLong-term external debt stocks 846.5 1,453.9 1,507.0 1,789.8 1,926.2 2,026.1 Public and publicly guaranteed debt from: 846.5 1,453.9 1,507.0 1,789.8 1,926.2 2,026.1 Official creditors 840.7 1,453.9 1,507.0 1,789.8 1,926.2 2,026.1 Multilateral 547.0 1,013.0 1,087.9 1,369.4 1,487.0 1,600.2 of which: World Bank 212.8 588.2 642.2 862.2 916.7 969.3 Bilateral 293.7 440.9 419.1 420.4 439.2 425.9 Private creditors 5.8 0.0 .. .. .. .. Bondholders .. .. .. .. .. .. Commercial banks and others 5.8 0.0 .. .. .. .. Private nonguaranteed debt from: .. .. .. .. .. .. Bondholders .. .. .. .. .. .. Commercial banks and others .. .. .. .. .. ..Use of IMF credit 230.9 254.7 295.9 318.9 314.1 339.5
Net financial inflowsNet debt inflows Use of IMF credit 0.0 -6.1 50.5 5.3 2.7 27.2 Long-term 84.9 145.0 101.8 207.4 180.5 110.8 Official creditors 84.9 147.0 101.8 207.3 180.5 110.8 Multilateral 46.3 126.4 107.6 221.1 150.3 120.0 of which: World Bank 24.2 111.6 75.8 180.3 78.4 57.8 Bilateral 38.6 20.6 -5.8 -13.7 30.2 -9.3 Private creditors .. -1.9 .. .. .. .. Bondholders .. .. .. .. .. .. Banks and others .. -1.9 .. .. .. .. Short-term -17.0 -8.3 31.3 5.0 -26.0 42.9Net equity inflows Foreign direct investment 69.2 172.5 25.1 81.2 91.3 88.8 Portfolio equity -0.3 0.5 0.4 0.5 .. ..
Debt ratiosExternal debt stocks to exports (%) 84.9 135.2 156.0 203.9 200.6 207.1External debt stocks to GNI (%) 18.7 28.0 34.1 35.2 33.6 32.5Debt service to exports (%) 2.9 5.5 6.4 6.7 7.5 8.7Short-term to external debt stocks (%) 5.9 0.7 2.4 2.5 1.1 2.8Multilateral to external debt stocks (%) 47.8 58.9 58.9 63.3 65.6 65.7Reserves to external debt stocks (%) 13.1 39.4 32.9 35.6 33.5 33.9Gross national income (GNI) 6,132.2 6,153.4 5,409.9 6,149.8 6,752.5 7,485.1

99
MALDIVES(US$ million, unless otherwise indicated)
2009 2015 2016 2017 2018 2019Summary external debt data by debtor typeTotal external debt stocks 1,383.5 1,006.2 1,222.0 1,515.7 2,339.7 2,679.2 Use of IMF credit 20.9 13.1 12.1 12.3 11.4 10.8 Long-term external debt 758.5 836.0 1,080.0 1,392.1 2,089.9 2,331.9 Public and publicly guaranteed sector 542.7 685.3 911.8 1,234.1 2,003.9 2,228.2 Public sector 527.7 685.3 911.8 1,234.1 1,949.6 2,121.4 of which: General government 515.3 653.8 760.5 1,078.3 1,321.0 1,432.6 Private sector guaranteed by public sector 15.0 .. 0.0 0.0 54.3 106.8 Private sector not guaranteed 215.8 150.7 168.2 158.1 86.0 103.7 Short-term external debt 604.0 157.2 129.8 111.3 238.4 336.5
Disbursements (long-term) 156.8 48.4 387.7 420.1 1,124.0 612.7 Public and publicly guaranteed sector 112.0 48.4 330.4 388.1 1,124.0 562.1 Public sector 112.0 48.4 330.4 388.1 1,069.7 509.6 of which: General government 111.5 41.5 198.9 349.8 330.2 179.1 Private sector guaranteed by public sector .. .. .. .. 54.3 52.5 Private sector not guaranteed 44.8 .. 57.3 32.0 .. 50.7
Principal repayments (long-term) 64.7 120.1 122.9 144.6 373.9 364.1 Public and publicly guaranteed sector 44.4 81.4 83.1 102.4 333.9 331.1 Public sector 41.4 81.4 83.1 102.4 333.9 331.1 of which: General government 37.0 64.7 71.6 68.5 67.3 60.7 Private sector guaranteed by public sector 3.0 .. .. .. 0.0 0.0 Private sector not guaranteed 20.3 38.7 39.7 42.2 40.1 33.0
Interest payments (long-term) 16.4 14.6 17.4 19.1 58.0 83.6 Public and publicly guaranteed sector 12.1 13.5 14.5 15.0 54.6 80.4 Public sector 11.3 13.5 14.5 15.0 53.8 75.4 of which: General government 10.8 11.8 12.3 11.6 31.5 40.0 Private sector guaranteed by public sector 0.8 .. .. .. 0.8 5.0 Private sector not guaranteed 4.2 1.1 2.9 4.1 3.5 3.3
Summary external debt stock by creditor typeLong-term external debt stocks 758.5 836.0 1,080.0 1,392.1 2,089.9 2,331.9 Public and publicly guaranteed debt from: 542.7 685.3 911.8 1,234.1 2,003.9 2,228.2 Official creditors 461.3 625.1 866.2 934.4 1,294.1 1,446.1 Multilateral 279.7 268.9 252.6 275.9 339.7 383.8 of which: World Bank 84.2 92.6 87.5 90.1 85.4 92.2 Bilateral 181.7 356.2 613.5 658.6 954.4 1,062.4 Private creditors 81.4 60.2 45.7 299.6 709.8 782.0 Bondholders .. .. .. 250.0 350.0 350.0 Commercial banks and others 81.4 60.2 45.7 49.6 359.8 432.0 Private nonguaranteed debt from: 215.8 150.7 168.2 158.1 86.0 103.7 Bondholders .. .. .. .. .. .. Commercial banks and others 215.8 150.7 168.2 158.1 86.0 103.7Use of IMF credit 20.9 13.1 12.1 12.3 11.4 10.8
Net financial inflowsNet debt inflows Use of IMF credit 4.7 -1.1 -0.6 -0.6 -0.6 -0.6 Long-term 92.1 -71.7 264.8 275.5 750.0 248.6 Official creditors 85.9 -37.8 261.0 34.9 379.2 158.4 Multilateral 2.3 -9.0 -8.8 7.5 69.9 45.5 of which: World Bank 4.4 -1.9 -2.5 -2.5 -2.7 7.2 Bilateral 83.5 -28.8 269.9 27.4 309.2 112.9 Private creditors 6.2 -34.0 3.8 240.6 370.9 90.2 Bondholders .. .. .. 250.0 100.0 .. Banks and others 6.2 -34.0 3.8 -9.4 270.9 90.2 Short-term 140.0 12.0 -26.3 -17.6 126.0 96.7Net equity inflows Foreign direct investment 158.0 298.0 456.6 457.8 575.7 891.1 Portfolio equity -14.5 1.9 -0.7 -0.8 31.8 0.0
Debt ratiosExternal debt stocks to exports (%) 80.5 31.9 38.7 45.5 64.9 71.2External debt stocks to GNI (%) 66.2 26.6 30.4 34.8 48.4 51.5Debt service to exports (%) 5.7 4.4 4.6 5.0 12.3 12.2Short-term to external debt stocks (%) 43.7 15.6 10.6 7.3 10.2 12.6Multilateral to external debt stocks (%) 20.2 26.7 20.7 18.2 14.5 14.3Reserves to external debt stocks (%) 19.9 57.2 39.1 39.5 30.9 28.5Gross national income (GNI) 2,090.0 3,777.0 4,026.2 4,361.0 4,835.3 5,199.4

100
MALI(US$ million, unless otherwise indicated)
2009 2015 2016 2017 2018 2019Summary external debt data by debtor typeTotal external debt stocks 2,210 3,692 3,789 4,294 4,675 5,192 Use of IMF credit 184 256 288 334 441 447 Long-term external debt 2,002 3,354 3,420 3,866 4,123 4,636 Public and publicly guaranteed sector 2,002 3,354 3,420 3,866 4,123 4,636 Public sector 2,002 3,354 3,420 3,866 4,123 4,636 of which: General government 1,997 3,352 3,419 3,865 4,121 4,634 Private sector guaranteed by public sector .. .. .. .. .. .. Private sector not guaranteed .. .. .. .. .. .. Short-term external debt 25 82 80 94 111 110
Disbursements (long-term) 494 453 244 299 520 712 Public and publicly guaranteed sector 494 453 244 299 520 712 Public sector 494 453 244 299 520 712 of which: General government 494 453 244 299 520 712 Private sector guaranteed by public sector .. .. .. .. .. .. Private sector not guaranteed .. .. .. .. .. ..
Principal repayments (long-term) 46 65 72 91 147 152 Public and publicly guaranteed sector 46 65 72 91 147 152 Public sector 46 65 72 91 147 152 of which: General government 45 65 71 91 147 152 Private sector guaranteed by public sector .. .. .. .. .. .. Private sector not guaranteed .. .. .. .. .. ..
Interest payments (long-term) 22 33 35 35 42 51 Public and publicly guaranteed sector 22 33 35 35 42 51 Public sector 22 33 35 35 42 51 of which: General government 22 33 35 35 42 51 Private sector guaranteed by public sector .. .. .. .. .. .. Private sector not guaranteed .. .. .. .. .. ..
Summary external debt stock by creditor typeLong-term external debt stocks 2,002 3,354 3,420 3,866 4,123 4,636 Public and publicly guaranteed debt from: 2,002 3,354 3,420 3,866 4,123 4,636 Official creditors 1,995 3,353 3,420 3,866 4,122 4,635 Multilateral 1,565 2,490 2,505 2,910 3,124 3,537 of which: World Bank 698 1,349 1,364 1,574 1,682 1,970 Bilateral 430 863 915 956 999 1,098 Private creditors 7 1 0 0 0 0 Bondholders .. .. .. .. .. .. Commercial banks and others 7 1 0 0 0 0 Private nonguaranteed debt from: .. .. .. .. .. .. Bondholders .. .. .. .. .. .. Commercial banks and others .. .. .. .. .. ..Use of IMF credit 184 256 288 334 441 447
Net financial inflowsNet debt inflows Use of IMF credit 3 3 41 28 116 9 Long-term 448 389 173 208 373 560 Official creditors 446 389 173 208 373 560 Multilateral 352 236 87 210 302 444 of which: World Bank 159 172 57 123 149 298 Bilateral 94 153 86 -2 71 116 Private creditors 1 -1 0 0 0 0 Bondholders .. .. .. .. .. .. Banks and others 1 -1 0 0 0 0 Short-term 24 23 -3 12 19 10Net equity inflows Foreign direct investment 645 92 237 365 358 494 Portfolio equity -3 4 5 2 -1 ..
Debt ratiosExternal debt stocks to exports (%) 100 114 112 122 107 ..External debt stocks to GNI (%) 23 29 28 29 28 30Debt service to exports (%) 3 3 4 4 5 ..Short-term to external debt stocks (%) 1 2 2 2 2 2Multilateral to external debt stocks (%) 71 67 66 68 67 68Reserves to external debt stocks (%) 73 17 .. .. .. ..Gross national income (GNI) 9,725 12,809 13,645 14,875 16,716 17,055

101
MAURITANIA(US$ million, unless otherwise indicated)
2009 2015 2016 2017 2018 2019Summary external debt data by debtor typeTotal external debt stocks 3,142 4,993 5,080 5,241 5,226 5,370 Use of IMF credit 113 196 180 200 221 244 Long-term external debt 1,989 3,712 3,865 4,002 3,952 4,043 Public and publicly guaranteed sector 1,989 3,712 3,865 4,002 3,952 4,043 Public sector 1,989 3,712 3,865 4,002 3,952 4,043 of which: General government 1,733 2,779 3,011 3,214 3,238 3,383 Private sector guaranteed by public sector .. .. .. .. .. .. Private sector not guaranteed .. .. .. .. .. .. Short-term external debt 1,040 1,086 1,035 1,040 1,052 1,083
Disbursements (long-term) 410 681 390 250 270 367 Public and publicly guaranteed sector 410 681 390 250 270 367 Public sector 410 681 390 250 270 367 of which: General government 398 381 390 248 270 345 Private sector guaranteed by public sector .. .. .. .. .. .. Private sector not guaranteed .. .. .. .. .. ..
Principal repayments (long-term) 54 140 173 224 270 266 Public and publicly guaranteed sector 54 140 173 224 270 266 Public sector 54 140 173 224 270 266 of which: General government 30 62 96 149 198 190 Private sector guaranteed by public sector .. .. .. .. .. .. Private sector not guaranteed .. .. .. .. .. ..
Interest payments (long-term) 23 95 75 80 92 88 Public and publicly guaranteed sector 23 95 75 80 92 88 Public sector 23 95 75 80 92 88 of which: General government 16 41 42 50 62 60 Private sector guaranteed by public sector .. .. .. .. .. .. Private sector not guaranteed .. .. .. .. .. ..
Summary external debt stock by creditor typeLong-term external debt stocks 1,989 3,712 3,865 4,002 3,952 4,043 Public and publicly guaranteed debt from: 1,989 3,712 3,865 4,002 3,952 4,043 Official creditors 1,977 3,712 3,865 4,002 3,952 4,043 Multilateral 1,232 2,093 2,239 2,358 2,284 2,379 of which: World Bank 282 369 366 390 382 388 Bilateral 745 1,618 1,627 1,644 1,668 1,664 Private creditors 12 .. .. .. .. .. Bondholders .. .. .. .. .. .. Commercial banks and others 12 .. .. .. .. .. Private nonguaranteed debt from: .. .. .. .. .. .. Bondholders .. .. .. .. .. .. Commercial banks and others .. .. .. .. .. ..Use of IMF credit 113 196 180 200 221 244
Net financial inflowsNet debt inflows Use of IMF credit 0 -4 -10 9 26 24 Long-term 356 541 217 27 0 101 Official creditors 357 541 217 27 0 101 Multilateral 180 135 181 48 -45 99 of which: World Bank 38 6 9 2 2 8 Bilateral 178 406 36 -21 45 2 Private creditors -1 .. .. .. .. .. Bondholders .. .. .. .. .. .. Banks and others -1 .. .. .. .. .. Short-term -108 63 -50 4 13 30Net equity inflows Foreign direct investment -3 502 271 588 773 885 Portfolio equity .. 0 .. .. .. ..
Debt ratiosExternal debt stocks to exports (%) 191 292 294 257 235 198External debt stocks to GNI (%) 66 83 81 79 75 72Debt service to exports (%) 5 14 15 16 17 14Short-term to external debt stocks (%) 33 22 20 20 20 20Multilateral to external debt stocks (%) 39 42 44 45 44 44Reserves to external debt stocks (%) 7 16 16 16 18 19Gross national income (GNI) 4,777 5,987 6,282 6,662 7,011 7,503

102
MEXICO(US$ million, unless otherwise indicated)
2009 2015 2016 2017 2018 2019Summary external debt data by debtor typeTotal external debt stocks 193,343 426,914 421,904 441,577 453,158 469,729 Use of IMF credit 4,470 3,951 3,833 4,060 3,965 3,943 Long-term external debt 163,318 352,708 364,975 385,083 388,045 403,093 Public and publicly guaranteed sector 118,878 259,358 266,772 286,640 295,157 303,817 Public sector 118,878 259,358 266,772 286,440 294,957 303,617 of which: General government 67,110 180,944 176,253 185,818 191,327 201,787 Private sector guaranteed by public sector 0 .. 0 200 200 200 Private sector not guaranteed 44,440 93,349 98,203 98,443 92,888 99,276 Short-term external debt 25,555 70,255 53,096 52,433 61,147 62,693
Disbursements (long-term) 37,074 49,799 60,842 59,298 37,523 55,065 Public and publicly guaranteed sector 26,995 27,849 40,967 34,933 25,468 37,407 Public sector 26,995 27,849 40,967 34,733 25,468 37,407 of which: General government 17,117 9,705 12,806 13,424 8,417 18,303 Private sector guaranteed by public sector .. .. .. 200 0 0 Private sector not guaranteed 10,079 21,950 19,875 24,365 12,054 17,658
Principal repayments (long-term) 22,318 31,761 59,133 38,066 32,422 36,290 Public and publicly guaranteed sector 11,873 11,709 28,386 17,516 14,910 25,037 Public sector 11,872 11,709 28,386 17,516 14,910 25,037 of which: General government 3,827 6,479 12,933 4,769 1,498 4,386 Private sector guaranteed by public sector 1 .. 0 0 0 0 Private sector not guaranteed 10,446 20,052 30,747 20,550 17,512 11,253
Interest payments (long-term) 8,792 18,790 17,302 24,910 22,875 22,626 Public and publicly guaranteed sector 6,019 14,475 12,297 18,563 15,728 16,955 Public sector 6,019 14,475 12,297 18,561 15,721 16,948 of which: General government 3,648 11,533 8,886 14,347 10,923 11,964 Private sector guaranteed by public sector .. .. 0 2 6 7 Private sector not guaranteed 2,773 4,315 5,005 6,347 7,148 5,671
Summary external debt stock by creditor typeLong-term external debt stocks 163,318 352,708 364,975 385,083 388,045 403,093 Public and publicly guaranteed debt from: 118,878 259,358 266,772 286,640 295,157 303,817 Official creditors 20,121 31,553 31,139 32,723 32,605 33,509 Multilateral 17,104 28,077 27,927 29,304 29,794 31,022 of which: World Bank 10,143 14,748 14,656 14,887 14,611 14,942 Bilateral 3,016 3,476 3,212 3,419 2,810 2,487 Private creditors 98,757 227,806 235,633 253,918 262,552 270,308 Bondholders 78,522 195,362 208,310 225,580 237,164 247,179 Commercial banks and others 20,236 32,443 27,322 28,338 25,388 23,129 Private nonguaranteed debt from: 44,440 93,349 98,203 98,443 92,888 99,276 Bondholders 21,444 77,863 78,753 80,120 74,589 77,355 Commercial banks and others 22,996 15,486 19,450 18,323 18,299 21,921Use of IMF credit 4,470 3,951 3,833 4,060 3,965 3,943
Net financial inflowsNet debt inflows Use of IMF credit .. .. .. .. .. .. Long-term 14,756 18,038 1,709 21,232 5,101 18,775 Official creditors 6,921 291 -1 1,344 -276 820 Multilateral 6,311 674 231 1,297 269 1,118 of which: World Bank 4,213 15 27 178 -278 298 Bilateral 610 -383 -233 46 -544 -298 Private creditors 7,835 17,747 1,711 19,889 5,376 17,955 Bondholders 12,716 16,806 15,654 20,062 7,974 16,370 Banks and others -4,881 940 -13,944 -173 -2,597 1,585 Short-term 1,377 -21,672 -17,159 -663 8,714 1,546Net equity inflows Foreign direct investment 16,377 25,271 21,561 23,862 25,654 30,814 Portfolio equity 4,155 3,601 9,477 10,320 2,421 -10
Debt ratiosExternal debt stocks to exports (%) 77 104 104 99 92 93External debt stocks to GNI (%) 22 37 40 39 38 38Debt service to exports (%) 13 13 19 15 12 12Short-term to external debt stocks (%) 13 16 13 12 13 13Multilateral to external debt stocks (%) 9 7 7 7 7 7Reserves to external debt stocks (%) 52 41 41 39 38 38Gross national income (GNI) 884,929 1,141,656 1,049,496 1,128,748 1,189,362 1,221,112

103
MOLDOVA(US$ million, unless otherwise indicated)
2009 2015 2016 2017 2018 2019Summary external debt data by debtor typeTotal external debt stocks 3,715 6,107 6,235 6,988 7,451 7,536 Use of IMF credit 338 628 574 562 496 458 Long-term external debt 2,011 4,255 4,313 4,756 4,925 5,074 Public and publicly guaranteed sector 809 1,072 1,212 1,442 1,450 1,464 Public sector 809 1,072 1,212 1,442 1,450 1,464 of which: General government 780 1,066 1,209 1,437 1,442 1,450 Private sector guaranteed by public sector .. .. .. .. .. .. Private sector not guaranteed 1,203 3,183 3,101 3,315 3,476 3,610 Short-term external debt 1,366 1,224 1,348 1,670 2,030 2,005
Disbursements (long-term) 284 312 381 596 551 549 Public and publicly guaranteed sector 54 139 207 183 138 130 Public sector 54 139 207 183 138 130 of which: General government 41 139 207 180 134 122 Private sector guaranteed by public sector .. .. .. .. .. .. Private sector not guaranteed 230 173 174 413 413 419
Principal repayments (long-term) 303 312 265 249 375 427 Public and publicly guaranteed sector 55 41 37 50 89 101 Public sector 55 41 37 50 89 101 of which: General government 52 35 34 48 88 100 Private sector guaranteed by public sector .. .. .. .. .. .. Private sector not guaranteed 248 271 229 200 286 325
Interest payments (long-term) 54 43 61 55 67 63 Public and publicly guaranteed sector 22 15 15 20 22 23 Public sector 22 15 15 20 22 23 of which: General government 20 14 15 20 22 22 Private sector guaranteed by public sector .. .. .. .. .. .. Private sector not guaranteed 32 28 45 35 44 40
Summary external debt stock by creditor typeLong-term external debt stocks 2,011 4,255 4,313 4,756 4,925 5,074 Public and publicly guaranteed debt from: 809 1,072 1,212 1,442 1,450 1,464 Official creditors 780 1,050 1,189 1,417 1,425 1,440 Multilateral 524 876 960 1,086 1,152 1,226 of which: World Bank 443 570 634 696 712 716 Bilateral 256 173 229 331 273 214 Private creditors 29 22 23 25 25 24 Bondholders 0 .. .. .. .. .. Commercial banks and others 29 22 23 25 25 24 Private nonguaranteed debt from: 1,203 3,183 3,101 3,315 3,476 3,610 Bondholders .. .. .. .. .. .. Commercial banks and others 1,203 3,183 3,101 3,315 3,476 3,610Use of IMF credit 338 628 574 562 496 458
Net financial inflowsNet debt inflows Use of IMF credit -15 -41 -37 -44 -54 -35 Long-term -19 1 116 347 175 122 Official creditors -4 101 169 134 48 29 Multilateral 16 79 111 51 100 85 of which: World Bank 0 29 81 28 31 8 Bilateral -20 23 58 83 -52 -57 Private creditors -15 -101 -53 213 127 94 Bondholders -6 .. .. .. .. .. Banks and others -9 -101 -53 213 127 94 Short-term -8 -272 130 342 357 -18Net equity inflows Foreign direct investment 150 167 135 66 186 503 Portfolio equity 2 4 0 0 -1 0
Debt ratiosExternal debt stocks to exports (%) 162 185 185 175 167 161External debt stocks to GNI (%) 64 75 73 68 62 ..Debt service to exports (%) 17 13 13 11 13 13Short-term to external debt stocks (%) 37 20 22 24 27 27Multilateral to external debt stocks (%) 14 14 15 16 15 16Reserves to external debt stocks (%) 40 29 35 40 40 41Gross national income (GNI) 5,762 8,195 8,517 10,227 12,015 ..

104
MONGOLIA(US$ million, unless otherwise indicated)
2009 2015 2016 2017 2018 2019Summary external debt data by debtor typeTotal external debt stocks 2,988 21,940 24,597 27,946 29,684 31,445 Use of IMF credit 258 68 66 189 287 285 Long-term external debt 2,481 19,437 21,943 24,595 26,299 28,200 Public and publicly guaranteed sector 1,819 3,993 5,122 7,494 7,902 8,150 Public sector 1,819 3,993 5,122 7,494 7,902 8,150 of which: General government 1,726 3,986 5,116 7,488 7,896 8,144 Private sector guaranteed by public sector .. .. .. .. .. .. Private sector not guaranteed 662 15,444 16,821 17,101 18,398 20,050 Short-term external debt 248 2,435 2,589 3,163 3,098 2,960
Disbursements (long-term) 520 2,066 5,103 4,325 8,323 12,639 Public and publicly guaranteed sector 212 258 1,187 2,327 1,058 410 Public sector 212 258 1,187 2,327 1,058 410 of which: General government 212 258 1,187 2,327 1,058 410 Private sector guaranteed by public sector .. .. .. .. .. .. Private sector not guaranteed 308 1,808 3,916 1,997 7,265 12,229
Principal repayments (long-term) 70 1,323 938 2,788 6,614 11,130 Public and publicly guaranteed sector 62 61 84 68 630 164 Public sector 62 61 84 68 630 164 of which: General government 61 61 83 68 629 164 Private sector guaranteed by public sector .. .. .. .. .. .. Private sector not guaranteed 8 1,262 855 2,720 5,984 10,966
Interest payments (long-term) 41 464 471 826 1,036 503 Public and publicly guaranteed sector 26 95 112 217 244 307 Public sector 26 95 112 217 244 307 of which: General government 19 95 112 217 244 307 Private sector guaranteed by public sector .. .. .. .. .. .. Private sector not guaranteed 15 369 358 609 793 196
Summary external debt stock by creditor typeLong-term external debt stocks 2,481 19,437 21,943 24,595 26,299 28,200 Public and publicly guaranteed debt from: 1,819 3,993 5,122 7,494 7,902 8,150 Official creditors 1,735 2,475 2,843 3,797 4,230 4,539 Multilateral 1,069 1,152 1,205 1,644 1,876 2,096 of which: World Bank 392 434 423 579 570 579 Bilateral 666 1,323 1,637 2,153 2,354 2,444 Private creditors 84 1,518 2,280 3,697 3,672 3,611 Bondholders 75 1,500 2,000 3,400 3,400 3,400 Commercial banks and others 9 18 280 297 272 211 Private nonguaranteed debt from: 662 15,444 16,821 17,101 18,398 20,050 Bondholders .. 1,119 1,495 1,317 1,865 2,228 Commercial banks and others 662 14,325 15,326 15,783 16,533 17,822Use of IMF credit 258 68 66 189 287 285
Net financial inflowsNet debt inflows Use of IMF credit 159 -3 .. 116 104 0 Long-term 450 743 4,165 1,536 1,709 1,509 Official creditors 153 186 340 848 451 305 Multilateral 96 106 85 377 261 228 of which: World Bank 51 4 2 130 5 13 Bilateral 57 80 255 471 190 78 Private creditors 297 557 3,825 688 1,258 1,203 Bondholders .. 200 500 1,232 525 440 Banks and others 297 357 3,325 -544 733 763 Short-term 179 61 154 574 -64 -138Net equity inflows Foreign direct investment 488 95 -399 828 799 1,231 Portfolio equity 4 0 4 -10 -7 7
Debt ratiosExternal debt stocks to exports (%) 129 422 434 406 374 357External debt stocks to GNI (%) 68 203 240 285 252 256Debt service to exports (%) 5 35 26 54 98 133Short-term to external debt stocks (%) 8 11 11 11 10 9Multilateral to external debt stocks (%) 36 5 5 6 6 7Reserves to external debt stocks (%) 43 6 5 10 9 10Gross national income (GNI) 4,388 10,786 10,265 9,817 11,765 12,291

105
MONTENEGRO(US$ million, unless otherwise indicated)
2009 2015 2016 2017 2018 2019Summary external debt data by debtor typeTotal external debt stocks 2,357 6,226 6,261 7,190 7,972 8,199 Use of IMF credit 40 36 35 37 36 36 Long-term external debt 1,109 5,955 6,083 7,008 7,729 7,953 Public and publicly guaranteed sector 1,094 2,556 2,428 2,978 3,443 3,726 Public sector 1,094 2,493 2,380 2,935 3,417 3,717 of which: General government 842 2,188 2,088 2,644 3,163 3,479 Private sector guaranteed by public sector 0 63 49 44 26 9 Private sector not guaranteed 15 3,399 3,655 4,029 4,286 4,227 Short-term external debt 1,207 235 143 146 207 210
Disbursements (long-term) 248 1,051 1,391 1,608 1,969 797 Public and publicly guaranteed sector 242 805 414 456 1,175 788 Public sector 242 805 414 456 1,175 788 of which: General government 224 796 384 438 1,156 765 Private sector guaranteed by public sector .. .. .. .. .. .. Private sector not guaranteed 7 246 977 1,152 794 8
Principal repayments (long-term) 25 1,125 1,094 993 1,449 510 Public and publicly guaranteed sector 23 388 375 197 591 444 Public sector 23 373 362 186 575 428 of which: General government 17 341 327 142 527 392 Private sector guaranteed by public sector .. 15 13 11 17 16 Private sector not guaranteed 2 737 718 795 858 65
Interest payments (long-term) 28 150 172 218 265 226 Public and publicly guaranteed sector 28 88 88 96 102 105 Public sector 28 85 86 94 101 105 of which: General government 20 77 79 87 95 100 Private sector guaranteed by public sector .. 2 2 2 1 0 Private sector not guaranteed 0 63 84 122 163 121
Summary external debt stock by creditor typeLong-term external debt stocks 1,109 5,955 6,083 7,008 7,729 7,953 Public and publicly guaranteed debt from: 1,094 2,556 2,428 2,978 3,443 3,726 Official creditors 873 1,127 1,091 1,323 1,459 1,551 Multilateral 592 633 600 634 589 556 of which: World Bank 336 311 287 297 271 243 Bilateral 281 493 490 689 871 995 Private creditors 221 1,429 1,337 1,655 1,984 2,175 Bondholders .. 1,043 1,138 1,295 1,394 1,740 Commercial banks and others 221 386 199 360 589 435 Private nonguaranteed debt from: 15 3,399 3,655 4,029 4,286 4,227 Bondholders .. .. .. .. .. .. Commercial banks and others 15 3,399 3,655 4,029 4,286 4,227Use of IMF credit 40 36 35 37 36 36
Net financial inflowsNet debt inflows Use of IMF credit .. .. .. .. .. .. Long-term 224 -73 298 615 520 287 Official creditors 37 145 -10 133 167 116 Multilateral 26 -32 -14 -44 -22 -12 of which: World Bank -5 -15 -17 -26 -18 -12 Bilateral 11 177 3 177 190 128 Private creditors 186 -218 308 483 352 171 Bondholders .. 344 135 0 163 370 Banks and others 186 -563 173 483 189 -200 Short-term 605 -45 -92 2 61 3Net equity inflows Foreign direct investment 1,360 465 91 386 342 277 Portfolio equity -5 10 17 14 0 3
Debt ratiosExternal debt stocks to exports (%) 142 313 303 308 295 297External debt stocks to GNI (%) 57 150 142 145 143 149Debt service to exports (%) 4 64 61 52 64 27Short-term to external debt stocks (%) 51 4 2 2 3 3Multilateral to external debt stocks (%) 25 10 10 9 7 7Reserves to external debt stocks (%) 24 11 13 14 15 19Gross national income (GNI) 4,166 4,144 4,414 4,958 5,571 5,514

106
MOROCCO(US$ million, unless otherwise indicated)
2009 2015 2016 2017 2018 2019Summary external debt data by debtor typeTotal external debt stocks 24,725 44,391 47,626 51,150 50,314 54,968 Use of IMF credit 880 778 755 800 781 776 Long-term external debt 21,635 36,746 37,949 42,823 42,088 45,501 Public and publicly guaranteed sector 19,281 31,131 31,460 34,712 33,387 36,466 Public sector 19,275 31,131 31,460 34,712 33,387 36,466 of which: General government 11,506 18,981 19,594 21,644 20,677 23,579 Private sector guaranteed by public sector 6 .. .. .. .. .. Private sector not guaranteed 2,354 5,615 6,489 8,111 8,700 9,036 Short-term external debt 2,210 6,867 8,923 7,527 7,446 8,690
Disbursements (long-term) 4,563 7,190 4,633 4,477 3,134 6,691 Public and publicly guaranteed sector 3,480 4,840 3,040 2,964 1,672 5,438 Public sector 3,480 4,840 3,040 2,964 1,672 5,438 of which: General government 2,404 2,832 2,119 1,825 882 4,338 Private sector guaranteed by public sector 0 .. .. .. .. .. Private sector not guaranteed 1,083 2,350 1,593 1,513 1,462 1,253
Principal repayments (long-term) 2,709 2,474 2,659 2,797 2,729 2,873 Public and publicly guaranteed sector 1,137 1,670 2,102 2,389 2,047 1,993 Public sector 1,134 1,670 2,102 2,389 2,047 1,993 of which: General government 649 1,035 1,076 1,611 1,197 1,178 Private sector guaranteed by public sector 3 .. .. .. .. .. Private sector not guaranteed 1,572 804 557 408 682 880
Interest payments (long-term) 678 990 1,023 1,017 1,088 1,054 Public and publicly guaranteed sector 613 880 929 929 932 948 Public sector 612 880 929 929 932 948 of which: General government 363 470 512 523 519 558 Private sector guaranteed by public sector 1 .. .. .. .. .. Private sector not guaranteed 66 110 94 88 155 106
Summary external debt stock by creditor typeLong-term external debt stocks 21,635 36,746 37,949 42,823 42,088 45,501 Public and publicly guaranteed debt from: 19,281 31,131 31,460 34,712 33,387 36,466 Official creditors 16,753 20,361 21,013 24,230 23,102 23,650 Multilateral 10,078 13,197 13,589 16,110 15,613 16,639 of which: World Bank 2,601 4,155 4,565 5,560 5,529 6,414 Bilateral 6,675 7,164 7,425 8,119 7,489 7,011 Private creditors 2,528 10,769 10,447 10,483 10,286 12,816 Bondholders .. 6,277 6,208 6,499 6,390 7,590 Commercial banks and others 2,528 4,492 4,238 3,984 3,896 5,226 Private nonguaranteed debt from: 2,354 5,615 6,489 8,111 8,700 9,036 Bondholders .. .. .. .. .. .. Commercial banks and others 2,354 5,615 6,489 8,111 8,700 9,036Use of IMF credit 880 778 755 800 781 776
Net financial inflowsNet debt inflows Use of IMF credit .. .. .. .. .. .. Long-term 1,854 4,716 1,974 1,680 405 3,818 Official creditors 1,882 986 1,089 1,229 -421 825 Multilateral 1,303 699 715 1,166 11 1,237 of which: World Bank -3 529 521 532 146 957 Bilateral 579 287 373 63 -433 -411 Private creditors -27 3,730 885 451 826 2,993 Bondholders .. 1,110 0 0 0 1,239 Banks and others -27 2,620 885 451 826 1,754 Short-term 579 -740 2,055 -1,395 -82 1,244Net equity inflows Foreign direct investment 2,456 2,240 1,626 1,952 2,926 1,391 Portfolio equity -4 .. -26 -33 -184 280
Debt ratiosExternal debt stocks to exports (%) 99 131 136 129 114 123External debt stocks to GNI (%) 27 45 47 48 44 47Debt service to exports (%) 14 11 11 10 9 9Short-term to external debt stocks (%) 9 15 19 15 15 16Multilateral to external debt stocks (%) 41 30 29 31 31 30Reserves to external debt stocks (%) 92 50 51 49 47 46Gross national income (GNI) 91,616 99,245 101,326 107,564 115,442 116,445

107
MOZAMBIQUE(US$ million, unless otherwise indicated)
2009 2015 2016 2017 2018 2019Summary external debt data by debtor typeTotal external debt stocks 6,088 14,446 14,500 16,103 18,932 20,516 Use of IMF credit 342 399 355 343 303 375 Long-term external debt 5,114 13,249 13,569 14,671 17,399 18,493 Public and publicly guaranteed sector 3,400 9,821 10,003 10,794 10,929 10,888 Public sector 3,400 9,821 10,003 10,794 10,929 10,888 of which: General government 3,302 7,867 8,283 9,178 9,433 9,597 Private sector guaranteed by public sector .. .. .. .. .. .. Private sector not guaranteed 1,714 3,428 3,566 3,877 6,470 7,606 Short-term external debt 632 798 576 1,089 1,230 1,647
Disbursements (long-term) 636 985 965 1,070 3,307 1,823 Public and publicly guaranteed sector 532 890 771 733 668 687 Public sector 532 890 771 733 668 687 of which: General government 527 890 771 733 668 687 Private sector guaranteed by public sector .. .. .. .. .. .. Private sector not guaranteed 103 95 194 338 2,639 1,136
Principal repayments (long-term) 348 394 351 328 414 681 Public and publicly guaranteed sector 17 272 294 301 368 681 Public sector 17 272 294 301 368 681 of which: General government 17 163 186 191 250 476 Private sector guaranteed by public sector .. .. .. .. .. .. Private sector not guaranteed 331 122 57 27 47 ..
Interest payments (long-term) 159 205 152 139 167 206 Public and publicly guaranteed sector 25 154 109 119 155 155 Public sector 25 154 109 119 155 155 of which: General government 24 96 105 116 151 137 Private sector guaranteed by public sector .. .. .. .. .. .. Private sector not guaranteed 134 51 43 20 13 51
Summary external debt stock by creditor typeLong-term external debt stocks 5,114 13,249 13,569 14,671 17,399 18,493 Public and publicly guaranteed debt from: 3,400 9,821 10,003 10,794 10,929 10,888 Official creditors 3,373 7,759 8,183 9,051 9,265 9,390 Multilateral 1,967 3,590 3,716 4,073 4,214 4,432 of which: World Bank 1,356 2,461 2,555 2,822 2,904 3,039 Bilateral 1,406 4,168 4,466 4,978 5,051 4,958 Private creditors 27 2,062 1,820 1,743 1,664 1,498 Bondholders .. 850 727 727 727 727 Commercial banks and others 27 1,212 1,094 1,016 937 771 Private nonguaranteed debt from: 1,714 3,428 3,566 3,877 6,470 7,606 Bondholders .. .. .. .. .. .. Commercial banks and others 1,714 3,428 3,566 3,877 6,470 7,606Use of IMF credit 342 399 355 343 303 375
Net financial inflowsNet debt inflows Use of IMF credit 153 87 -33 -32 -32 73 Long-term 288 591 614 743 2,893 1,142 Official creditors 495 725 589 536 368 168 Multilateral 287 346 227 162 232 240 of which: World Bank 197 280 174 113 153 154 Bilateral 209 379 362 374 136 -73 Private creditors -207 -134 26 207 2,525 975 Bondholders .. .. .. .. .. .. Banks and others -207 -134 26 207 2,525 975 Short-term 36 280 -223 445 77 418Net equity inflows Foreign direct investment 242 1,128 805 668 491 382 Portfolio equity 0 0 0 -5 0 0
Debt ratiosExternal debt stocks to exports (%) 209 340 374 290 304 347External debt stocks to GNI (%) 52 92 124 126 131 141Debt service to exports (%) 18 15 14 9 10 16Short-term to external debt stocks (%) 10 6 4 7 6 8Multilateral to external debt stocks (%) 32 25 26 25 22 22Reserves to external debt stocks (%) 34 17 14 20 16 18Gross national income (GNI) 11,623 15,654 11,678 12,825 14,422 14,573

108
MYANMAR(US$ million, unless otherwise indicated)
2009 2015 2016 2017 2018 2019Summary external debt data by debtor typeTotal external debt stocks 9,495 10,293 10,107 10,759 10,685 11,114 Use of IMF credit 385 341 330 350 342 340 Long-term external debt 8,023 9,853 9,685 10,312 10,238 10,709 Public and publicly guaranteed sector 8,023 9,787 9,638 10,284 10,224 10,681 Public sector 7,895 9,787 9,638 10,284 10,224 10,681 of which: General government 1,824 4,560 4,815 5,490 5,938 6,755 Private sector guaranteed by public sector 129 .. .. .. .. .. Private sector not guaranteed .. 66 47 28 14 28 Short-term external debt 1,087 99 91 97 105 66
Disbursements (long-term) 231 689 446 400 757 1,017 Public and publicly guaranteed sector 231 604 446 400 757 953 Public sector 231 604 446 400 757 953 of which: General government 25 151 368 381 696 864 Private sector guaranteed by public sector 0 .. .. .. .. .. Private sector not guaranteed .. 85 .. .. .. 65
Principal repayments (long-term) 82 260 493 430 530 501 Public and publicly guaranteed sector 82 241 475 411 516 450 Public sector 82 241 475 411 516 450 of which: General government 24 78 94 41 84 52 Private sector guaranteed by public sector .. .. .. .. .. .. Private sector not guaranteed .. 19 19 19 14 51
Interest payments (long-term) 29 263 280 226 309 207 Public and publicly guaranteed sector 29 263 279 225 309 197 Public sector 29 263 279 225 309 197 of which: General government 3 98 112 53 150 46 Private sector guaranteed by public sector .. .. .. .. .. .. Private sector not guaranteed .. 0 1 1 .. 10
Summary external debt stock by creditor typeLong-term external debt stocks 8,023 9,853 9,685 10,312 10,238 10,709 Public and publicly guaranteed debt from: 8,023 9,787 9,638 10,284 10,224 10,681 Official creditors 6,878 9,412 9,278 9,931 9,911 10,396 Multilateral 1,372 1,381 1,462 1,788 1,859 2,081 of which: World Bank 777 833 914 1,192 1,266 1,468 Bilateral 5,506 8,030 7,816 8,144 8,053 8,314 Private creditors 1,145 375 360 353 312 285 Bondholders .. .. .. .. .. .. Commercial banks and others 1,145 375 360 353 312 285 Private nonguaranteed debt from: .. 66 47 28 14 28 Bondholders .. .. .. .. .. .. Commercial banks and others .. 66 47 28 14 28Use of IMF credit 385 341 330 350 342 340
Net financial inflowsNet debt inflows Use of IMF credit .. .. .. .. .. .. Long-term 149 429 -47 -30 227 516 Official creditors 151 358 -14 1 281 530 Multilateral 2 47 120 226 207 232 of which: World Bank .. 53 108 214 181 208 Bilateral 149 311 -134 -224 74 298 Private creditors -2 71 -33 -31 -53 -14 Bondholders .. .. .. .. .. .. Banks and others -2 71 -33 -31 -53 -14 Short-term .. .. .. .. .. ..Net equity inflows Foreign direct investment 1,079 4,053 3,319 3,094 1,435 2,522 Portfolio equity .. 0 0 0 0 0
Debt ratiosExternal debt stocks to exports (%) 150 70 72 72 62 59External debt stocks to GNI (%) 26 16 15 16 15 15Debt service to exports (%) 2 4 6 4 5 4Short-term to external debt stocks (%) 11 1 1 1 1 1Multilateral to external debt stocks (%) 14 13 14 17 17 19Reserves to external debt stocks (%) 55 42 46 46 50 49Gross national income (GNI) 36,896 65,776 65,411 66,983 73,469 73,292

109
NEPAL(US$ million, unless otherwise indicated)
2009 2015 2016 2017 2018 2019Summary external debt data by debtor typeTotal external debt stocks 3,777 4,143 4,297 4,963 5,511 6,513 Use of IMF credit 183 194 171 168 156 147 Long-term external debt 3,550 3,600 3,748 4,374 5,103 5,963 Public and publicly guaranteed sector 3,550 3,543 3,665 4,299 4,974 5,845 Public sector 3,550 3,543 3,665 4,299 4,974 5,845 of which: General government 3,534 3,536 3,660 4,294 4,969 5,840 Private sector guaranteed by public sector .. .. .. .. .. .. Private sector not guaranteed .. 57 83 75 129 118 Short-term external debt 44 349 379 421 252 403
Disbursements (long-term) 114 425 431 606 1,017 1,096 Public and publicly guaranteed sector 114 408 397 591 955 1,096 Public sector 114 408 397 591 955 1,096 of which: General government 114 408 397 591 955 1,096 Private sector guaranteed by public sector .. .. .. .. .. .. Private sector not guaranteed .. 17 34 15 63 ..
Principal repayments (long-term) 140 169 177 195 181 205 Public and publicly guaranteed sector 140 165 170 172 174 194 Public sector 140 165 170 172 174 194 of which: General government 138 164 169 172 173 194 Private sector guaranteed by public sector .. .. .. .. .. .. Private sector not guaranteed .. 4 8 23 8 11
Interest payments (long-term) 32 33 37 38 45 57 Public and publicly guaranteed sector 32 32 35 36 41 52 Public sector 32 32 35 36 41 52 of which: General government 32 32 35 36 41 52 Private sector guaranteed by public sector .. .. .. .. .. .. Private sector not guaranteed .. 1 1 2 4 6
Summary external debt stock by creditor typeLong-term external debt stocks 3,550 3,600 3,748 4,374 5,103 5,963 Public and publicly guaranteed debt from: 3,550 3,543 3,665 4,299 4,974 5,845 Official creditors 3,547 3,543 3,665 4,299 4,974 5,845 Multilateral 3,198 3,215 3,318 3,901 4,458 5,080 of which: World Bank 1,483 1,640 1,708 2,022 2,477 2,877 Bilateral 349 328 347 399 516 764 Private creditors 4 0 0 0 0 0 Bondholders .. .. .. .. .. .. Commercial banks and others 4 0 0 0 0 0 Private nonguaranteed debt from: .. 57 83 75 129 118 Bondholders .. .. .. .. .. .. Commercial banks and others .. 57 83 75 129 118Use of IMF credit 183 194 171 168 156 147
Net financial inflowsNet debt inflows Use of IMF credit -2 36 -18 -12 -8 -8 Long-term -25 256 254 411 836 891 Official creditors -25 243 228 419 781 902 Multilateral -14 239 203 386 658 651 of which: World Bank -33 185 120 211 512 415 Bilateral -11 4 25 34 123 251 Private creditors -1 13 26 -8 55 -11 Bondholders .. .. .. .. .. .. Banks and others -1 13 26 -8 55 -11 Short-term -13 17 29 43 -170 151Net equity inflows Foreign direct investment 39 52 106 196 68 186 Portfolio equity .. .. .. .. .. ..
Debt ratiosExternal debt stocks to exports (%) 216 155 167 166 163 188External debt stocks to GNI (%) 29 19 20 19 19 21Debt service to exports (%) 10 8 9 8 7 8Short-term to external debt stocks (%) 1 8 9 8 5 6Multilateral to external debt stocks (%) 85 78 77 79 81 78Reserves to external debt stocks (%) 73 192 198 185 146 129Gross national income (GNI) 13,008 21,755 21,506 25,472 29,390 30,996

110
NICARAGUA(US$ million, unless otherwise indicated)
2009 2015 2016 2017 2018 2019Summary external debt data by debtor typeTotal external debt stocks 5,901 10,514 11,011 11,496 11,652 11,691 Use of IMF credit 346 264 228 219 195 181 Long-term external debt 4,563 8,981 9,376 9,845 10,094 10,345 Public and publicly guaranteed sector 2,514 3,949 4,205 4,696 5,094 5,414 Public sector 2,514 3,949 4,205 4,696 5,094 5,414 of which: General government 1,791 3,125 3,397 3,912 4,137 4,503 Private sector guaranteed by public sector 0 .. .. .. .. .. Private sector not guaranteed 2,049 5,032 5,171 5,149 5,000 4,931 Short-term external debt 993 1,269 1,407 1,432 1,363 1,165
Disbursements (long-term) 845 1,147 988 1,235 1,057 1,022 Public and publicly guaranteed sector 292 385 373 540 572 509 Public sector 292 385 373 540 572 509 of which: General government 286 385 373 540 372 509 Private sector guaranteed by public sector .. .. .. .. .. .. Private sector not guaranteed 553 763 615 695 485 513
Principal repayments (long-term) 335 564 575 849 776 835 Public and publicly guaranteed sector 62 72 89 122 135 177 Public sector 62 72 89 122 135 177 of which: General government 40 58 74 96 110 131 Private sector guaranteed by public sector .. .. .. .. .. .. Private sector not guaranteed 273 492 486 727 640 658
Interest payments (long-term) 121 189 213 262 265 297 Public and publicly guaranteed sector 37 61 74 83 94 119 Public sector 37 61 74 83 94 119 of which: General government 29 57 70 79 89 102 Private sector guaranteed by public sector .. .. .. .. .. .. Private sector not guaranteed 84 128 138 179 172 178
Summary external debt stock by creditor typeLong-term external debt stocks 4,563 8,981 9,376 9,845 10,094 10,345 Public and publicly guaranteed debt from: 2,514 3,949 4,205 4,696 5,094 5,414 Official creditors 2,502 3,944 4,194 4,682 5,070 5,388 Multilateral 1,465 2,841 3,081 3,529 3,914 4,215 of which: World Bank 418 532 531 595 624 692 Bilateral 1,037 1,103 1,113 1,153 1,156 1,173 Private creditors 12 5 11 14 24 26 Bondholders .. .. .. .. .. .. Commercial banks and others 12 5 11 14 24 26 Private nonguaranteed debt from: 2,049 5,032 5,171 5,149 5,000 4,931 Bondholders .. .. .. .. .. .. Commercial banks and others 2,049 5,032 5,171 5,149 5,000 4,931Use of IMF credit 346 264 228 219 195 181
Net financial inflowsNet debt inflows Use of IMF credit 37 -27 -29 -22 -19 -13 Long-term 510 584 413 386 281 187 Official creditors 231 314 278 417 425 330 Multilateral 220 318 261 404 411 306 of which: World Bank 67 32 15 33 44 71 Bilateral 10 -4 17 13 14 24 Private creditors 279 270 135 -31 -144 -143 Bondholders .. .. .. .. .. .. Banks and others 279 270 135 -31 -144 -143 Short-term -173 -243 129 15 -105 -221Net equity inflows Foreign direct investment 434 950 899 772 359 515 Portfolio equity .. .. .. .. .. ..
Debt ratiosExternal debt stocks to exports (%) 207 205 212 200 208 202External debt stocks to GNI (%) 73 85 85 86 91 96Debt service to exports (%) 16 15 16 20 19 20Short-term to external debt stocks (%) 17 12 13 12 12 10Multilateral to external debt stocks (%) 25 27 28 31 34 36Reserves to external debt stocks (%) 27 24 22 24 19 21Gross national income (GNI) 8,042 12,411 12,929 13,422 12,754 12,200
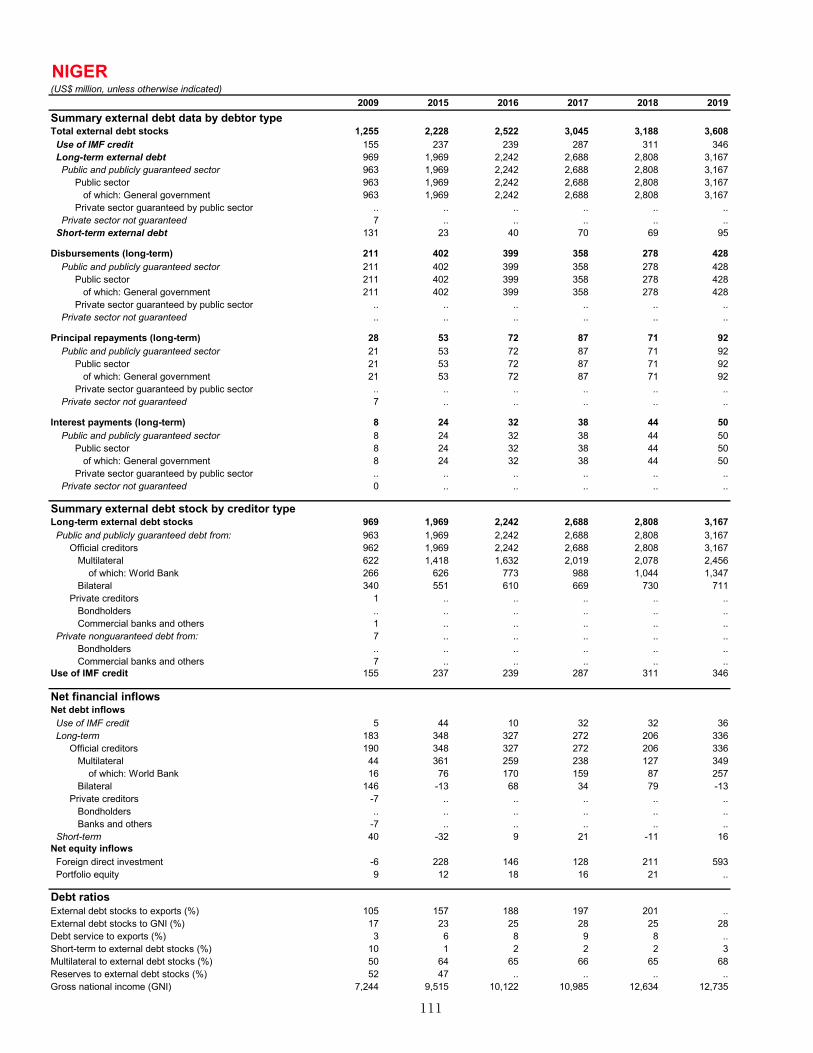
111
NIGER(US$ million, unless otherwise indicated)
2009 2015 2016 2017 2018 2019Summary external debt data by debtor typeTotal external debt stocks 1,255 2,228 2,522 3,045 3,188 3,608 Use of IMF credit 155 237 239 287 311 346 Long-term external debt 969 1,969 2,242 2,688 2,808 3,167 Public and publicly guaranteed sector 963 1,969 2,242 2,688 2,808 3,167 Public sector 963 1,969 2,242 2,688 2,808 3,167 of which: General government 963 1,969 2,242 2,688 2,808 3,167 Private sector guaranteed by public sector .. .. .. .. .. .. Private sector not guaranteed 7 .. .. .. .. .. Short-term external debt 131 23 40 70 69 95
Disbursements (long-term) 211 402 399 358 278 428 Public and publicly guaranteed sector 211 402 399 358 278 428 Public sector 211 402 399 358 278 428 of which: General government 211 402 399 358 278 428 Private sector guaranteed by public sector .. .. .. .. .. .. Private sector not guaranteed .. .. .. .. .. ..
Principal repayments (long-term) 28 53 72 87 71 92 Public and publicly guaranteed sector 21 53 72 87 71 92 Public sector 21 53 72 87 71 92 of which: General government 21 53 72 87 71 92 Private sector guaranteed by public sector .. .. .. .. .. .. Private sector not guaranteed 7 .. .. .. .. ..
Interest payments (long-term) 8 24 32 38 44 50 Public and publicly guaranteed sector 8 24 32 38 44 50 Public sector 8 24 32 38 44 50 of which: General government 8 24 32 38 44 50 Private sector guaranteed by public sector .. .. .. .. .. .. Private sector not guaranteed 0 .. .. .. .. ..
Summary external debt stock by creditor typeLong-term external debt stocks 969 1,969 2,242 2,688 2,808 3,167 Public and publicly guaranteed debt from: 963 1,969 2,242 2,688 2,808 3,167 Official creditors 962 1,969 2,242 2,688 2,808 3,167 Multilateral 622 1,418 1,632 2,019 2,078 2,456 of which: World Bank 266 626 773 988 1,044 1,347 Bilateral 340 551 610 669 730 711 Private creditors 1 .. .. .. .. .. Bondholders .. .. .. .. .. .. Commercial banks and others 1 .. .. .. .. .. Private nonguaranteed debt from: 7 .. .. .. .. .. Bondholders .. .. .. .. .. .. Commercial banks and others 7 .. .. .. .. ..Use of IMF credit 155 237 239 287 311 346
Net financial inflowsNet debt inflows Use of IMF credit 5 44 10 32 32 36 Long-term 183 348 327 272 206 336 Official creditors 190 348 327 272 206 336 Multilateral 44 361 259 238 127 349 of which: World Bank 16 76 170 159 87 257 Bilateral 146 -13 68 34 79 -13 Private creditors -7 .. .. .. .. .. Bondholders .. .. .. .. .. .. Banks and others -7 .. .. .. .. .. Short-term 40 -32 9 21 -11 16Net equity inflows Foreign direct investment -6 228 146 128 211 593 Portfolio equity 9 12 18 16 21 ..
Debt ratiosExternal debt stocks to exports (%) 105 157 188 197 201 ..External debt stocks to GNI (%) 17 23 25 28 25 28Debt service to exports (%) 3 6 8 9 8 ..Short-term to external debt stocks (%) 10 1 2 2 2 3Multilateral to external debt stocks (%) 50 64 65 66 65 68Reserves to external debt stocks (%) 52 47 .. .. .. ..Gross national income (GNI) 7,244 9,515 10,122 10,985 12,634 12,735

112
NIGERIA(US$ million, unless otherwise indicated)
2009 2015 2016 2017 2018 2019Summary external debt data by debtor typeTotal external debt stocks 19,286 32,413 34,396 43,193 50,452 54,832 Use of IMF credit 2,626 2,322 2,252 2,386 2,330 2,317 Long-term external debt 16,659 30,092 32,144 40,807 48,122 52,516 Public and publicly guaranteed sector 4,221 10,677 11,317 18,822 25,232 27,531 Public sector 4,214 10,677 11,317 18,822 25,232 27,531 of which: General government 4,200 10,464 11,059 18,496 24,840 27,131 Private sector guaranteed by public sector 7 .. .. .. .. .. Private sector not guaranteed 12,438 19,415 20,827 21,985 22,890 24,984 Short-term external debt 0 0 0 0 0 0
Disbursements (long-term) 953 5,321 4,216 10,854 11,487 7,735 Public and publicly guaranteed sector 519 1,431 1,134 7,126 7,363 2,660 Public sector 519 1,431 1,134 7,126 7,363 2,660 of which: General government 519 1,288 1,082 7,075 7,289 2,649 Private sector guaranteed by public sector 0 .. .. .. .. .. Private sector not guaranteed 434 3,890 3,082 3,727 4,124 5,075
Principal repayments (long-term) 666 1,125 1,850 2,706 3,955 3,274 Public and publicly guaranteed sector 342 115 180 136 736 293 Public sector 335 115 180 136 736 293 of which: General government 299 115 180 136 736 293 Private sector guaranteed by public sector 7 .. .. .. .. .. Private sector not guaranteed 325 1,010 1,670 2,570 3,219 2,980
Interest payments (long-term) 85 476 640 822 1,411 1,832 Public and publicly guaranteed sector 85 282 175 207 698 1,095 Public sector 84 282 175 207 698 1,095 of which: General government 81 281 173 205 696 1,092 Private sector guaranteed by public sector 1 .. .. .. .. .. Private sector not guaranteed .. 194 465 615 713 737
Summary external debt stock by creditor typeLong-term external debt stocks 16,659 30,092 32,144 40,807 48,122 52,516 Public and publicly guaranteed debt from: 4,221 10,677 11,317 18,822 25,232 27,531 Official creditors 4,135 9,177 9,817 12,522 14,063 16,363 Multilateral 3,521 7,494 7,885 10,110 10,932 12,516 of which: World Bank 2,852 6,226 6,640 7,913 8,557 9,959 Bilateral 614 1,683 1,932 2,412 3,131 3,846 Private creditors 87 1,500 1,500 6,300 11,168 11,168 Bondholders .. 1,500 1,500 6,300 11,168 11,168 Commercial banks and others 87 .. .. .. .. .. Private nonguaranteed debt from: 12,438 19,415 20,827 21,985 22,890 24,984 Bondholders .. 5,275 5,942 6,942 6,017 6,367 Commercial banks and others 12,438 14,140 14,885 15,042 16,873 18,617Use of IMF credit 2,626 2,322 2,252 2,386 2,330 2,317
Net financial inflowsNet debt inflows Use of IMF credit .. .. .. .. .. .. Long-term 287 4,196 2,366 8,148 7,532 4,461 Official creditors 204 1,316 954 2,190 1,759 2,367 Multilateral 305 1,071 706 1,714 1,040 1,655 of which: World Bank 380 726 650 858 851 1,475 Bilateral -102 245 248 476 719 712 Private creditors 83 2,880 1,412 5,958 5,774 2,095 Bondholders .. 800 667 5,800 3,943 350 Banks and others 83 2,080 745 158 1,830 1,745 Short-term 0 0 0 0 0 0Net equity inflows Foreign direct investment 8,536 3,060 4,448 3,501 1,812 3,287 Portfolio equity 487 -477 325 2,924 1,259 -1,548
Debt ratiosExternal debt stocks to exports (%) 33 65 87 82 74 76External debt stocks to GNI (%) 7 7 9 12 13 13Debt service to exports (%) 1 3 6 7 8 7Short-term to external debt stocks (%) 0 0 0 0 0 0Multilateral to external debt stocks (%) 18 23 23 23 22 23Reserves to external debt stocks (%) 232 87 79 92 85 70Gross national income (GNI) 277,317 481,571 395,951 364,253 379,792 433,449

113
NORTH MACEDONIA(US$ million, unless otherwise indicated)
2009 2015 2016 2017 2018 2019Summary external debt data by debtor typeTotal external debt stocks 5,247 6,767 7,513 8,544 8,666 8,986 Use of IMF credit 103 91 88 93 91 91 Long-term external debt 3,731 5,662 6,320 7,133 7,237 7,499 Public and publicly guaranteed sector 1,874 3,109 3,473 3,829 4,061 4,163 Public sector 1,873 3,109 3,473 3,829 4,061 4,163 of which: General government 1,704 2,375 2,655 2,920 3,142 3,152 Private sector guaranteed by public sector 0 .. .. .. .. .. Private sector not guaranteed 1,858 2,553 2,847 3,304 3,176 3,336 Short-term external debt 1,413 1,014 1,105 1,318 1,339 1,396
Disbursements (long-term) 1,012 1,094 1,465 1,020 1,400 821 Public and publicly guaranteed sector 347 583 777 221 794 383 Public sector 347 583 777 221 794 383 of which: General government 319 395 604 110 672 181 Private sector guaranteed by public sector .. .. .. .. .. .. Private sector not guaranteed 665 512 688 798 606 438
Principal repayments (long-term) 375 699 702 645 1,077 513 Public and publicly guaranteed sector 88 327 309 262 406 219 Public sector 87 327 309 262 406 219 of which: General government 72 255 235 177 317 118 Private sector guaranteed by public sector 0 .. .. .. .. .. Private sector not guaranteed 287 373 394 383 671 293
Interest payments (long-term) 93 128 124 177 159 151 Public and publicly guaranteed sector 47 78 86 112 105 115 Public sector 47 78 86 112 105 115 of which: General government 40 67 75 100 92 101 Private sector guaranteed by public sector 0 .. .. .. .. .. Private sector not guaranteed 46 51 38 65 54 36
Summary external debt stock by creditor typeLong-term external debt stocks 3,731 5,662 6,320 7,133 7,237 7,499 Public and publicly guaranteed debt from: 1,874 3,109 3,473 3,829 4,061 4,163 Official creditors 1,321 1,680 1,737 1,921 1,865 2,051 Multilateral 1,081 1,282 1,232 1,336 1,245 1,387 of which: World Bank 653 656 620 658 614 732 Bilateral 240 397 505 585 620 664 Private creditors 552 1,429 1,736 1,907 2,196 2,112 Bondholders 468 838 1,286 1,463 1,864 1,829 Commercial banks and others 84 591 450 444 332 283 Private nonguaranteed debt from: 1,858 2,553 2,847 3,304 3,176 3,336 Bondholders .. .. .. .. .. .. Commercial banks and others 1,858 2,553 2,847 3,304 3,176 3,336Use of IMF credit 103 91 88 93 91 91
Net financial inflowsNet debt inflows Use of IMF credit .. -172 .. .. .. .. Long-term 637 395 763 375 323 309 Official creditors 22 125 99 22 1 206 Multilateral 16 69 -10 -40 -39 161 of which: World Bank 26 -6 -16 -24 -21 125 Bilateral 6 55 109 62 39 46 Private creditors 615 271 664 352 323 102 Bondholders 244 133 498 0 482 0 Banks and others 371 137 166 352 -160 102 Short-term 100 -210 68 230 8 50Net equity inflows Foreign direct investment 57 89 325 246 471 362 Portfolio equity -14 -9 -8 -12 -34 -15
Debt ratiosExternal debt stocks to exports (%) 165 133 134 133 111 113External debt stocks to GNI (%) 56 69 73 79 72 74Debt service to exports (%) 17 21 16 14 17 9Short-term to external debt stocks (%) 27 15 15 15 15 16Multilateral to external debt stocks (%) 21 19 16 16 14 15Reserves to external debt stocks (%) 39 33 33 29 35 37Gross national income (GNI) 9,335 9,747 10,248 10,859 12,097 12,193

114
PAKISTAN(US$ million, unless otherwise indicated)
2009 2015 2016 2017 2018 2019Summary external debt data by debtor typeTotal external debt stocks 56,634 66,691 73,041 86,032 93,532 100,819 Use of IMF credit 9,045 6,359 7,235 7,664 7,276 8,097 Long-term external debt 46,124 53,858 58,686 69,658 78,168 83,195 Public and publicly guaranteed sector 42,859 49,119 52,561 61,068 67,261 71,113 Public sector 42,812 49,089 52,532 61,038 67,235 71,089 of which: General government 42,667 48,274 51,772 60,226 64,929 68,258 Private sector guaranteed by public sector 46 30 29 29 26 24 Private sector not guaranteed 3,265 4,739 6,125 8,591 10,906 12,083 Short-term external debt 1,466 6,474 7,121 8,709 8,088 9,526
Disbursements (long-term) 4,431 5,876 8,148 14,017 12,452 12,683 Public and publicly guaranteed sector 3,750 5,503 6,388 11,189 9,697 10,900 Public sector 3,750 5,503 6,388 11,189 9,697 10,900 of which: General government 3,750 5,197 6,258 10,883 7,938 10,152 Private sector guaranteed by public sector 0 0 0 0 0 0 Private sector not guaranteed 681 373 1,760 2,828 2,755 1,782
Principal repayments (long-term) 2,247 2,565 2,984 4,957 3,309 7,476 Public and publicly guaranteed sector 1,641 2,204 2,609 4,595 2,870 6,870 Public sector 1,640 2,202 2,607 4,594 2,868 6,868 of which: General government 1,591 2,073 2,421 4,339 2,603 6,644 Private sector guaranteed by public sector 2 1 1 1 2 2 Private sector not guaranteed 606 361 375 362 439 606
Interest payments (long-term) 911 1,008 1,222 1,562 2,196 2,627 Public and publicly guaranteed sector 806 942 1,112 1,322 1,762 2,084 Public sector 806 942 1,111 1,322 1,761 2,084 of which: General government 801 916 1,093 1,304 1,711 1,984 Private sector guaranteed by public sector 0 0 0 0 0 0 Private sector not guaranteed 105 66 111 240 434 543
Summary external debt stock by creditor typeLong-term external debt stocks 46,124 53,858 58,686 69,658 78,168 83,195 Public and publicly guaranteed debt from: 42,859 49,119 52,561 61,068 67,261 71,113 Official creditors 40,534 42,842 45,241 50,375 56,410 62,193 Multilateral 23,712 24,766 25,533 27,845 27,880 30,141 of which: World Bank 11,844 13,784 14,049 15,300 15,162 15,305 Bilateral 16,822 18,076 19,708 22,530 28,529 32,053 Private creditors 2,324 6,277 7,320 10,693 10,852 8,920 Bondholders 2,150 5,050 5,550 7,300 7,300 5,300 Commercial banks and others 174 1,227 1,770 3,393 3,552 3,620 Private nonguaranteed debt from: 3,265 4,739 6,125 8,591 10,906 12,083 Bondholders 850 12 12 12 12 12 Commercial banks and others 2,415 4,727 6,113 8,579 10,894 12,071Use of IMF credit 9,045 6,359 7,235 7,664 7,276 8,097
Net financial inflowsNet debt inflows Use of IMF credit 3,016 1,591 1,102 0 -212 862 Long-term 2,184 3,311 5,165 9,059 9,143 5,207 Official creditors 2,658 2,276 2,737 3,220 6,668 5,963 Multilateral 1,600 1,417 1,073 1,173 482 2,418 of which: World Bank 825 1,285 654 491 183 223 Bilateral 1,057 859 1,663 2,047 6,186 3,545 Private creditors -474 1,036 2,428 5,839 2,475 -756 Bondholders -500 500 500 1,750 0 -2,000 Banks and others 26 536 1,928 4,089 2,475 1,244 Short-term 96 987 647 1,588 -621 1,438Net equity inflows Foreign direct investment 2,338 1,623 2,484 2,583 1,479 1,972 Portfolio equity -37 529 -339 -391 -528 22
Debt ratiosExternal debt stocks to exports (%) 247 228 265 285 297 324External debt stocks to GNI (%) 33 23 25 27 28 34Debt service to exports (%) 15 14 16 22 19 35Short-term to external debt stocks (%) 3 10 10 10 9 9Multilateral to external debt stocks (%) 42 37 35 32 30 30Reserves to external debt stocks (%) 20 27 27 18 10 13Gross national income (GNI) 172,564 287,068 295,741 321,203 331,344 296,935

115
PAPUA NEW GUINEA(US$ million, unless otherwise indicated)
2009 2015 2016 2017 2018 2019Summary external debt data by debtor typeTotal external debt stocks 1,769 20,387 19,245 17,221 17,721 18,744 Use of IMF credit 197 174 169 179 175 174 Long-term external debt 1,460 19,902 18,414 16,966 17,082 17,914 Public and publicly guaranteed sector 1,045 1,501 1,919 2,303 3,408 4,313 Public sector 1,045 1,501 1,919 2,303 3,408 4,313 of which: General government 1,040 1,498 1,916 2,300 3,405 4,310 Private sector guaranteed by public sector .. .. .. .. .. .. Private sector not guaranteed 415 18,400 16,494 14,663 13,674 13,601 Short-term external debt 112 311 663 77 464 657
Disbursements (long-term) 516 562 1,538 1,320 3,046 1,344 Public and publicly guaranteed sector 33 242 534 394 1,234 1,044 Public sector 33 242 534 394 1,234 1,044 of which: General government 33 242 534 394 1,234 1,044 Private sector guaranteed by public sector .. .. .. .. .. .. Private sector not guaranteed 483 320 1,004 926 1,812 300
Principal repayments (long-term) 513 519 2,662 2,111 2,030 1,567 Public and publicly guaranteed sector 62 67 76 84 93 281 Public sector 62 67 76 84 93 281 of which: General government 62 66 75 84 93 281 Private sector guaranteed by public sector .. .. .. .. .. .. Private sector not guaranteed 451 452 2,586 2,027 1,937 1,286
Interest payments (long-term) 28 575 651 673 741 772 Public and publicly guaranteed sector 21 21 25 51 88 149 Public sector 21 21 25 51 88 149 of which: General government 21 21 25 51 88 149 Private sector guaranteed by public sector .. .. .. .. .. .. Private sector not guaranteed 7 555 626 622 653 623
Summary external debt stock by creditor typeLong-term external debt stocks 1,460 19,902 18,414 16,966 17,082 17,914 Public and publicly guaranteed debt from: 1,045 1,501 1,919 2,303 3,408 4,313 Official creditors 1,008 1,500 1,703 1,954 2,371 3,160 Multilateral 724 1,087 1,168 1,278 1,633 1,853 of which: World Bank 231 250 262 277 446 446 Bilateral 285 413 535 676 739 1,307 Private creditors 36 1 216 349 1,037 1,152 Bondholders .. .. .. .. 500 500 Commercial banks and others 36 1 216 349 537 652 Private nonguaranteed debt from: 415 18,400 16,494 14,663 13,674 13,601 Bondholders .. .. .. .. .. .. Commercial banks and others 415 18,400 16,494 14,663 13,674 13,601Use of IMF credit 197 174 169 179 175 174
Net financial inflowsNet debt inflows Use of IMF credit .. .. .. .. .. .. Long-term 3 43 -1,124 -791 1,017 -223 Official creditors -22 176 242 181 452 679 Multilateral -2 103 101 68 373 229 of which: World Bank 2 5 17 4 174 8 Bilateral -20 73 141 114 79 450 Private creditors 25 -133 -1,366 -972 565 -902 Bondholders .. .. .. .. 500 .. Banks and others 25 -133 -1,366 -972 65 -902 Short-term 102 -497 144 -383 235 334Net equity inflows Foreign direct investment 420 214 19 99 168 334 Portfolio equity 0 -1 -1 0 0 ..
Debt ratiosExternal debt stocks to exports (%) 38 237 231 168 167 159External debt stocks to GNI (%) 16 96 94 77 78 77Debt service to exports (%) 12 13 40 27 26 20Short-term to external debt stocks (%) 6 2 3 0 3 4Multilateral to external debt stocks (%) 41 5 6 7 9 10Reserves to external debt stocks (%) 145 8 8 10 12 12Gross national income (GNI) 10,764 21,328 20,529 22,294 22,795 24,426

116
PARAGUAY(US$ million, unless otherwise indicated)
2009 2015 2016 2017 2018 2019Summary external debt data by debtor typeTotal external debt stocks 13,941 16,125 16,228 15,929 15,799 16,388 Use of IMF credit 149 132 128 136 132 132 Long-term external debt 9,731 11,218 11,503 11,173 11,026 11,543 Public and publicly guaranteed sector 2,269 4,024 4,828 5,609 6,402 7,183 Public sector 2,269 4,024 4,825 5,605 6,383 7,148 of which: General government 2,025 3,883 4,662 5,421 6,196 6,978 Private sector guaranteed by public sector .. 0 4 4 19 35 Private sector not guaranteed 7,462 7,194 6,675 5,564 4,625 4,360 Short-term external debt 4,061 4,775 4,596 4,620 4,640 4,713
Disbursements (long-term) 1,572 1,471 1,217 996 1,535 1,453 Public and publicly guaranteed sector 249 496 1,041 978 1,003 994 Public sector 249 496 1,037 978 988 978 of which: General government 249 468 1,002 945 969 973 Private sector guaranteed by public sector .. 0 4 0 15 16 Private sector not guaranteed 1,323 975 176 18 533 459
Principal repayments (long-term) 310 1,592 914 1,338 1,680 1,507 Public and publicly guaranteed sector 264 183 234 209 208 207 Public sector 264 183 234 209 208 207 of which: General government 231 166 218 194 193 187 Private sector guaranteed by public sector .. 0 0 0 0 0 Private sector not guaranteed 46 1,409 681 1,129 1,472 1,300
Interest payments (long-term) 122 312 371 356 553 404 Public and publicly guaranteed sector 97 135 178 211 254 330 Public sector 97 135 178 211 254 329 of which: General government 88 131 174 206 249 323 Private sector guaranteed by public sector .. 0 0 0 0 1 Private sector not guaranteed 25 177 194 145 299 74
Summary external debt stock by creditor typeLong-term external debt stocks 9,731 11,218 11,503 11,173 11,026 11,543 Public and publicly guaranteed debt from: 2,269 4,024 4,828 5,609 6,402 7,183 Official creditors 1,987 2,140 2,384 2,690 2,979 3,273 Multilateral 1,362 1,869 2,167 2,501 2,790 3,062 of which: World Bank 296 431 544 605 636 619 Bilateral 625 272 217 189 189 211 Private creditors 282 1,883 2,445 2,919 3,423 3,910 Bondholders .. 1,780 2,380 2,880 3,410 3,910 Commercial banks and others 282 103 65 39 13 0 Private nonguaranteed debt from: 7,462 7,194 6,675 5,564 4,625 4,360 Bondholders .. 800 800 600 600 600 Commercial banks and others 7,462 6,394 5,875 4,964 4,025 3,760Use of IMF credit 149 132 128 136 132 132
Net financial inflowsNet debt inflows Use of IMF credit .. .. .. .. .. .. Long-term 1,262 -121 303 -342 -145 -54 Official creditors 27 45 246 295 290 300 Multilateral 40 90 306 330 293 280 of which: World Bank 67 51 113 62 31 -11 Bilateral -13 -44 -60 -35 -2 20 Private creditors 1,235 -167 57 -637 -435 -354 Bondholders .. 280 600 300 530 500 Banks and others 1,235 -447 -543 -937 -965 -854 Short-term -7 -39 -178 24 20 72Net equity inflows Foreign direct investment 129 451 355 337 376 381 Portfolio equity .. .. .. .. .. ..
Debt ratiosExternal debt stocks to exports (%) 166 136 127 112 109 122External debt stocks to GNI (%) 66 46 47 42 40 45Debt service to exports (%) 6 17 11 12 16 15Short-term to external debt stocks (%) 29 30 28 29 29 29Multilateral to external debt stocks (%) 10 12 13 16 18 19Reserves to external debt stocks (%) 28 35 41 47 47 45Gross national income (GNI) 21,281 34,808 34,608 37,802 39,024 36,747

117
PERU(US$ million, unless otherwise indicated)
2009 2015 2016 2017 2018 2019Summary external debt data by debtor typeTotal external debt stocks 37,390 67,186 69,613 67,604 66,769 64,204 Use of IMF credit 956 845 820 869 848 843 Long-term external debt 31,649 59,266 61,028 58,040 55,923 54,820 Public and publicly guaranteed sector 20,788 19,411 19,733 18,978 18,145 18,606 Public sector 20,225 19,411 19,733 18,978 18,145 18,606 of which: General government 20,212 19,405 19,728 16,823 15,990 16,451 Private sector guaranteed by public sector 563 .. .. .. .. .. Private sector not guaranteed 10,862 39,855 41,295 39,062 37,778 36,214 Short-term external debt 4,784 7,075 7,765 8,695 9,998 8,541
Disbursements (long-term) 4,772 10,451 7,982 5,371 3,513 3,291 Public and publicly guaranteed sector 3,232 4,866 1,978 2,631 569 1,866 Public sector 3,232 4,866 1,978 2,631 569 1,866 of which: General government 3,232 4,866 1,978 481 569 1,866 Private sector guaranteed by public sector 0 .. .. .. .. .. Private sector not guaranteed 1,539 5,585 6,004 2,740 2,945 1,425
Principal repayments (long-term) 2,221 3,220 5,545 8,718 4,583 4,345 Public and publicly guaranteed sector 1,833 907 980 3,746 1,263 1,356 Public sector 1,723 907 980 3,746 1,263 1,356 of which: General government 1,719 906 979 3,745 1,263 1,356 Private sector guaranteed by public sector 109 .. .. .. .. .. Private sector not guaranteed 389 2,313 4,565 4,973 3,320 2,989
Interest payments (long-term) 1,976 2,204 2,090 2,151 2,328 2,103 Public and publicly guaranteed sector 1,084 811 876 969 982 979 Public sector 1,047 811 876 969 982 979 of which: General government 1,046 811 876 914 872 870 Private sector guaranteed by public sector 37 .. .. .. .. .. Private sector not guaranteed 892 1,393 1,214 1,182 1,346 1,124
Summary external debt stock by creditor typeLong-term external debt stocks 31,649 59,266 61,028 58,040 55,923 54,820 Public and publicly guaranteed debt from: 20,788 19,411 19,733 18,978 18,145 18,606 Official creditors 11,843 7,913 8,130 4,919 4,447 4,916 Multilateral 8,395 6,411 6,729 3,867 3,426 3,843 of which: World Bank 2,846 2,714 2,610 1,093 1,145 1,564 Bilateral 3,448 1,502 1,401 1,053 1,021 1,074 Private creditors 8,945 11,498 11,604 14,059 13,698 13,690 Bondholders 8,911 11,496 11,604 14,059 13,698 13,690 Commercial banks and others 34 1 0 0 .. .. Private nonguaranteed debt from: 10,862 39,855 41,295 39,062 37,778 36,214 Bondholders 4,428 15,250 13,875 16,340 15,510 16,285 Commercial banks and others 6,434 24,606 27,420 22,723 22,268 19,929Use of IMF credit 956 845 820 869 848 843
Net financial inflowsNet debt inflows Use of IMF credit .. .. .. .. .. .. Long-term 2,550 7,231 2,437 -3,347 -1,070 -1,053 Official creditors -591 716 190 -3,265 -448 474 Multilateral 386 802 315 -2,822 -431 419 of which: World Bank 134 877 -104 -1,516 51 423 Bilateral -978 -86 -125 -442 -16 55 Private creditors 3,142 6,514 2,247 -83 -622 -1,527 Bondholders 2,828 4,723 -566 4,615 -1,077 812 Banks and others 314 1,792 2,813 -4,698 455 -2,339 Short-term -615 97 690 930 1,304 -1,457Net equity inflows Foreign direct investment 7,213 7,043 6,179 7,571 6,257 8,892 Portfolio equity 47 -60 -307 -172 -442 ..
Debt ratiosExternal debt stocks to exports (%) 118 162 157 125 115 111External debt stocks to GNI (%) 33 37 38 34 32 30Debt service to exports (%) 13 13 18 21 12 11Short-term to external debt stocks (%) 13 11 11 13 15 13Multilateral to external debt stocks (%) 22 10 10 6 5 6Reserves to external debt stocks (%) 86 90 87 92 88 103Gross national income (GNI) 113,308 183,306 183,939 201,299 211,136 216,266

118
PHILIPPINES(US$ million, unless otherwise indicated)
2009 2015 2016 2017 2018 2019Summary external debt data by debtor typeTotal external debt stocks 55,984 76,266 74,739 73,414 78,997 83,661 Use of IMF credit 1,314 1,161 1,127 1,193 1,165 1,159 Long-term external debt 50,668 60,005 59,086 57,946 61,764 65,294 Public and publicly guaranteed sector 42,196 38,860 35,757 36,500 38,344 41,679 Public sector 42,125 38,785 35,719 36,464 38,311 41,649 of which: General government 33,162 33,364 30,695 31,703 33,769 37,002 Private sector guaranteed by public sector 71 75 37 35 33 30 Private sector not guaranteed 8,472 21,145 23,330 21,447 23,420 23,615 Short-term external debt 4,002 15,099 14,526 14,275 16,068 17,208
Disbursements (long-term) 8,767 12,243 5,878 6,808 9,856 10,411 Public and publicly guaranteed sector 8,125 6,529 3,321 3,472 4,980 6,990 Public sector 8,125 6,529 3,321 3,472 4,980 6,990 of which: General government 5,527 6,303 2,973 3,420 4,922 6,153 Private sector guaranteed by public sector 0 0 0 0 0 0 Private sector not guaranteed 642 5,714 2,557 3,336 4,876 3,421
Principal repayments (long-term) 5,675 7,411 7,811 8,245 6,236 7,366 Public and publicly guaranteed sector 3,841 3,151 4,079 3,026 2,381 4,106 Public sector 3,838 3,144 4,041 3,023 2,378 4,103 of which: General government 2,296 2,615 3,290 2,829 2,200 2,708 Private sector guaranteed by public sector 4 8 39 3 3 3 Private sector not guaranteed 1,833 4,259 3,732 5,219 3,855 3,259
Interest payments (long-term) 3,266 3,161 3,174 2,952 2,553 3,079 Public and publicly guaranteed sector 2,841 2,431 2,430 2,236 2,290 2,309 Public sector 2,839 2,429 2,428 2,236 2,289 2,308 of which: General government 2,341 2,061 2,076 1,931 2,001 2,092 Private sector guaranteed by public sector 2 2 2 1 1 1 Private sector not guaranteed 425 729 744 716 264 771
Summary external debt stock by creditor typeLong-term external debt stocks 50,668 60,005 59,086 57,946 61,764 65,294 Public and publicly guaranteed debt from: 42,196 38,860 35,757 36,500 38,344 41,679 Official creditors 22,052 18,286 18,573 19,074 20,034 21,475 Multilateral 8,449 10,166 10,487 11,015 12,051 13,169 of which: World Bank 2,669 4,661 4,672 5,132 5,842 6,456 Bilateral 13,603 8,120 8,086 8,059 7,982 8,306 Private creditors 20,144 20,574 17,184 17,426 18,310 20,204 Bondholders 18,901 19,989 16,460 16,713 17,632 19,077 Commercial banks and others 1,243 585 724 713 679 1,127 Private nonguaranteed debt from: 8,472 21,145 23,330 21,447 23,420 23,615 Bondholders 956 5,362 5,262 4,012 5,187 6,091 Commercial banks and others 7,516 15,783 18,067 17,434 18,233 17,524Use of IMF credit 1,314 1,161 1,127 1,193 1,165 1,159
Net financial inflowsNet debt inflows Use of IMF credit .. .. .. .. .. .. Long-term 3,092 4,833 -1,934 -1,437 3,621 3,045 Official creditors 627 880 -31 121 873 1,388 Multilateral 1,052 1,199 321 481 1,037 1,149 of which: World Bank -40 700 10 443 709 615 Bilateral -425 -319 -352 -361 -164 239 Private creditors 2,465 3,953 -1,903 -1,557 2,747 1,657 Bondholders 3,527 2,057 -962 -879 2,932 1,948 Banks and others -1,063 1,895 -941 -678 -184 -291 Short-term -2,998 -1,149 -573 -252 1,793 1,140Net equity inflows Foreign direct investment 1,886 2,563 3,302 4,261 3,242 2,495 Portfolio equity 308 -743 131 496 -1,031 1,764
Debt ratiosExternal debt stocks to exports (%) 113 93 90 76 77 78External debt stocks to GNI (%) 28 22 21 20 21 20Debt service to exports (%) 18 13 13 12 9 10Short-term to external debt stocks (%) 7 20 19 19 20 21Multilateral to external debt stocks (%) 15 13 14 15 15 16Reserves to external debt stocks (%) 69 97 98 100 90 95Gross national income (GNI) 196,472 341,467 354,013 364,719 383,817 414,269

119
RUSSIAN FEDERATION(US$ million, unless otherwise indicated)
2009 2015 2016 2017 2018 2019Summary external debt data by debtor typeTotal external debt stocks 406,431 467,699 533,204 518,191 453,808 490,726 Use of IMF credit 8,892 7,860 7,625 8,077 7,888 7,843 Long-term external debt 344,443 417,740 480,479 459,079 397,620 425,183 Public and publicly guaranteed sector 145,865 194,185 189,423 220,079 177,150 194,171 Public sector 145,865 194,185 189,423 220,079 177,150 194,171 of which: General government 30,964 30,807 39,035 55,179 43,550 69,611 Private sector guaranteed by public sector .. .. .. .. .. .. Private sector not guaranteed 198,578 223,555 291,056 239,000 220,470 231,012 Short-term external debt 53,096 42,100 45,100 51,035 48,300 57,700
Disbursements (long-term) 45,374 12,163 89,772 83,355 29,285 81,078 Public and publicly guaranteed sector 21,229 5,579 20,007 50,928 10,406 48,137 Public sector 21,229 5,579 20,007 50,928 10,406 48,137 of which: General government 4,956 81 9,925 17,045 5,205 27,815 Private sector guaranteed by public sector .. .. .. .. .. .. Private sector not guaranteed 24,145 6,584 69,765 32,427 18,878 32,941
Principal repayments (long-term) 74,281 81,730 51,103 61,790 90,537 76,535 Public and publicly guaranteed sector 19,318 40,610 24,728 20,552 53,040 31,105 Public sector 19,318 40,610 24,728 20,552 53,040 31,105 of which: General government 2,552 10,378 1,660 1,051 16,741 1,711 Private sector guaranteed by public sector .. .. .. .. .. .. Private sector not guaranteed 54,963 41,120 26,374 41,238 37,497 45,430
Interest payments (long-term) 16,293 19,036 20,121 19,008 19,049 17,258 Public and publicly guaranteed sector 2,357 3,548 5,643 6,554 8,928 7,306 Public sector 2,357 3,548 5,643 6,554 8,928 7,306 of which: General government 789 2,349 1,249 1,657 2,761 1,922 Private sector guaranteed by public sector .. .. .. .. .. .. Private sector not guaranteed 13,936 15,489 14,478 12,455 10,121 9,953
Summary external debt stock by creditor typeLong-term external debt stocks 344,443 417,740 480,479 459,079 397,620 425,183 Public and publicly guaranteed debt from: 145,865 194,185 189,423 220,079 177,150 194,171 Official creditors 7,333 2,472 2,135 1,149 950 761 Multilateral 3,724 873 733 589 460 341 of which: World Bank 3,211 731 646 551 428 315 Bilateral 3,609 1,599 1,402 559 489 420 Private creditors 138,532 191,714 187,289 218,930 176,200 193,410 Bondholders 21,689 30,567 40,124 62,020 53,534 82,629 Commercial banks and others 116,843 161,147 147,165 156,910 122,666 110,781 Private nonguaranteed debt from: 198,578 223,555 291,056 239,000 220,470 231,012 Bondholders 2,286 11,639 18,156 16,879 19,890 27,126 Commercial banks and others 196,292 211,915 272,900 222,121 200,580 203,885Use of IMF credit 8,892 7,860 7,625 8,077 7,888 7,843
Net financial inflowsNet debt inflows Use of IMF credit .. .. .. .. .. .. Long-term -28,907 -69,567 38,669 21,565 -61,252 4,543 Official creditors -1,075 -388 -336 -986 -199 -187 Multilateral -764 -198 -139 -144 -129 -117 of which: World Bank -635 -145 -85 -95 -123 -111 Bilateral -311 -189 -197 -842 -70 -70 Private creditors -27,832 -69,179 39,005 22,551 -61,053 4,730 Bondholders -9,324 -9,155 16,109 20,326 -5,159 36,345 Banks and others -18,508 -60,025 22,895 2,225 -55,894 -31,615 Short-term -20,883 -19,600 3,000 5,935 -2,735 9,400Net equity inflows Foreign direct investment 23,161 10,719 35,715 26,601 9,913 28,847 Portfolio equity 3,763 -5,538 -1,788 -7,940 -4,164 -4,320
Debt ratiosExternal debt stocks to exports (%) 108 109 143 113 81 91External debt stocks to GNI (%) 34 35 43 34 28 30Debt service to exports (%) 24 23 19 18 20 18Short-term to external debt stocks (%) 13 9 8 10 11 12Multilateral to external debt stocks (%) 1 0 0 0 0 0Reserves to external debt stocks (%) 103 68 60 69 84 90Gross national income (GNI) 1,182,905 1,325,731 1,241,289 1,532,144 1,627,790 1,646,524

120
RWANDA(US$ million, unless otherwise indicated)
2009 2015 2016 2017 2018 2019Summary external debt data by debtor typeTotal external debt stocks 1,101.4 3,452.0 4,318.7 4,833.4 5,422.6 6,211.4 Use of IMF credit 135.7 111.6 203.3 290.7 307.9 305.6 Long-term external debt 955.5 3,329.1 3,888.8 4,474.5 5,010.1 5,677.3 Public and publicly guaranteed sector 715.5 2,057.3 2,353.3 2,829.1 3,240.6 3,907.9 Public sector 715.5 2,057.3 2,353.3 2,829.1 3,240.6 3,907.9 of which: General government 714.6 2,056.6 2,352.6 2,828.4 3,239.9 3,907.2 Private sector guaranteed by public sector .. .. .. .. .. .. Private sector not guaranteed 240.0 1,271.7 1,535.5 1,645.4 1,769.5 1,769.4 Short-term external debt 10.1 11.3 226.6 68.2 104.7 228.5
Disbursements (long-term) 96.8 659.4 774.9 713.5 847.1 714.5 Public and publicly guaranteed sector 72.8 375.7 368.1 407.2 492.0 714.5 Public sector 72.8 375.7 368.1 407.2 492.0 714.5 of which: General government 72.8 375.7 368.1 407.2 492.0 714.5 Private sector guaranteed by public sector .. .. .. .. .. .. Private sector not guaranteed 24.0 283.8 406.8 306.3 355.1 ..
Principal repayments (long-term) 29.3 125.7 148.2 155.4 155.5 31.5 Public and publicly guaranteed sector 5.3 17.4 23.0 27.7 29.2 31.5 Public sector 5.3 17.4 23.0 27.7 29.2 31.5 of which: General government 5.3 17.4 22.9 27.6 29.2 31.5 Private sector guaranteed by public sector .. .. .. .. .. .. Private sector not guaranteed 24.0 108.4 125.2 127.8 126.3 0.1
Interest payments (long-term) 9.7 56.1 68.8 83.3 101.2 133.2 Public and publicly guaranteed sector 5.7 39.2 41.8 45.7 51.1 55.7 Public sector 5.7 39.2 41.8 45.7 51.1 55.7 of which: General government 5.7 39.2 41.8 45.7 51.1 55.7 Private sector guaranteed by public sector .. .. .. .. .. .. Private sector not guaranteed 4.0 16.9 27.0 37.6 50.2 77.5
Summary external debt stock by creditor typeLong-term external debt stocks 955.5 3,329.1 3,888.8 4,474.5 5,010.1 5,677.3 Public and publicly guaranteed debt from: 715.5 2,057.3 2,353.3 2,829.1 3,240.6 3,907.9 Official creditors 715.5 1,657.3 1,953.3 2,429.1 2,840.6 3,443.8 Multilateral 615.3 1,362.8 1,645.5 2,076.6 2,458.6 2,957.6 of which: World Bank 254.2 861.9 1,048.5 1,403.5 1,610.5 1,897.3 Bilateral 100.3 294.6 307.8 352.5 382.1 486.2 Private creditors .. 400.0 400.0 400.0 400.0 464.1 Bondholders .. 400.0 400.0 400.0 400.0 421.0 Commercial banks and others .. .. .. .. .. 43.1 Private nonguaranteed debt from: 240.0 1,271.7 1,535.5 1,645.4 1,769.5 1,769.4 Bondholders .. .. .. .. .. .. Commercial banks and others 240.0 1,271.7 1,535.5 1,645.4 1,769.5 1,769.4Use of IMF credit 135.7 111.6 203.3 290.7 307.9 305.6
Net financial inflowsNet debt inflows Use of IMF credit 3.6 -2.6 98.2 73.4 24.4 -0.5 Long-term 67.5 533.7 626.8 558.1 691.6 683.0 Official creditors 67.5 358.3 345.1 379.6 462.8 618.9 Multilateral 53.6 309.0 322.8 345.1 424.6 511.3 of which: World Bank 10.5 284.5 216.6 287.8 241.2 295.0 Bilateral 14.0 49.3 22.4 34.5 38.2 107.6 Private creditors 0.0 175.4 281.6 178.5 228.8 64.0 Bondholders .. .. .. .. 0.0 21.0 Banks and others 0.0 175.4 281.6 178.5 228.8 43.0 Short-term 4.0 -13.7 215.3 -158.4 36.5 123.8Net equity inflows Foreign direct investment 118.7 88.3 171.0 176.4 185.9 420.2 Portfolio equity .. 2.5 3.0 0.3 5.8 ..
Debt ratiosExternal debt stocks to exports (%) 182.9 232.9 279.8 241.6 263.1 270.0External debt stocks to GNI (%) 19.5 41.2 50.7 54.0 58.2 63.4Debt service to exports (%) 6.6 12.5 14.4 12.1 12.6 7.4Short-term to external debt stocks (%) 0.9 0.3 5.2 1.4 1.9 3.7Multilateral to external debt stocks (%) 55.9 39.5 38.1 43.0 45.3 47.6Reserves to external debt stocks (%) 91.7 26.6 23.5 24.4 25.0 23.6Gross national income (GNI) 5,657.3 8,381.9 8,523.0 8,944.5 9,315.4 9,798.0

121
SAMOA(US$ million, unless otherwise indicated)
2009 2015 2016 2017 2018 2019Summary external debt data by debtor typeTotal external debt stocks 252.9 437.4 417.5 443.1 427.5 408.6 Use of IMF credit 26.5 29.8 27.4 27.4 24.3 21.0 Long-term external debt 226.4 407.6 390.1 415.7 403.2 387.6 Public and publicly guaranteed sector 226.4 407.6 390.1 415.7 403.2 387.6 Public sector 226.4 407.6 390.1 415.7 403.2 387.6 of which: General government 224.5 407.0 389.7 415.5 403.1 387.6 Private sector guaranteed by public sector .. .. .. .. .. .. Private sector not guaranteed .. .. .. .. .. .. Short-term external debt 0.0 0.0 0.0 0.0 0.0 0.0
Disbursements (long-term) 25.2 23.3 14.3 21.0 22.0 9.3 Public and publicly guaranteed sector 25.2 23.3 14.3 21.0 22.0 9.3 Public sector 25.2 23.3 14.3 21.0 22.0 9.3 of which: General government 25.2 23.3 14.3 21.0 22.0 9.3 Private sector guaranteed by public sector .. .. .. .. .. .. Private sector not guaranteed .. .. .. .. .. ..
Principal repayments (long-term) 6.0 13.7 15.6 18.3 21.9 21.3 Public and publicly guaranteed sector 6.0 13.7 15.6 18.3 21.9 21.3 Public sector 6.0 13.7 15.6 18.3 21.9 21.3 of which: General government 5.8 13.6 15.4 18.1 21.7 21.3 Private sector guaranteed by public sector .. .. .. .. .. .. Private sector not guaranteed .. .. .. .. .. ..
Interest payments (long-term) 2.5 5.6 5.8 5.7 6.1 5.6 Public and publicly guaranteed sector 2.5 5.6 5.8 5.7 6.1 5.6 Public sector 2.5 5.6 5.8 5.7 6.1 5.6 of which: General government 2.5 5.6 5.7 5.7 6.1 5.6 Private sector guaranteed by public sector .. .. .. .. .. .. Private sector not guaranteed .. .. .. .. .. ..
Summary external debt stock by creditor typeLong-term external debt stocks 226.4 407.6 390.1 415.7 403.2 387.6 Public and publicly guaranteed debt from: 226.4 407.6 390.1 415.7 403.2 387.6 Official creditors 226.4 407.6 390.1 415.7 403.2 387.6 Multilateral 180.1 214.0 203.7 215.0 208.1 205.8 of which: World Bank 79.9 96.1 92.8 103.4 104.9 110.3 Bilateral 46.3 193.6 186.4 200.7 195.1 181.8 Private creditors .. .. .. .. .. .. Bondholders .. .. .. .. .. .. Commercial banks and others .. .. .. .. .. .. Private nonguaranteed debt from: .. .. .. .. .. .. Bondholders .. .. .. .. .. .. Commercial banks and others .. .. .. .. .. ..Use of IMF credit 26.5 29.8 27.4 27.4 24.3 21.0
Net financial inflowsNet debt inflows Use of IMF credit 8.9 -1.6 -1.6 -1.6 -2.5 -3.2 Long-term 19.2 9.5 -1.3 2.8 0.1 -12.0 Official creditors 19.2 9.5 -1.3 2.8 0.1 -12.0 Multilateral 2.6 1.6 -4.3 -0.1 -2.0 -1.2 of which: World Bank 0.4 4.5 -0.6 5.2 4.0 6.0 Bilateral 16.6 7.9 3.0 2.9 2.1 -10.9 Private creditors .. .. .. .. .. .. Bondholders .. .. .. .. .. .. Banks and others .. .. .. .. .. .. Short-term 0.0 0.0 0.0 0.0 0.0 0.0Net equity inflows Foreign direct investment 9.9 26.9 2.5 9.2 16.7 2.8 Portfolio equity .. -0.1 0.0 0.0 0.0 ..
Debt ratiosExternal debt stocks to exports (%) 139.4 182.6 162.7 155.8 137.4 122.1External debt stocks to GNI (%) 45.6 56.6 53.5 55.0 54.1 50.2Debt service to exports (%) 4.7 8.8 9.0 9.0 9.8 9.1Short-term to external debt stocks (%) 0.0 0.0 0.0 0.0 0.0 0.0Multilateral to external debt stocks (%) 71.2 48.9 48.8 48.5 48.7 50.4Reserves to external debt stocks (%) 57.1 28.0 23.8 29.6 39.8 45.3Gross national income (GNI) 554.5 772.3 780.8 805.3 790.5 813.4

122
SÃO TOMÉ AND PRÍNCIPE(US$ million, unless otherwise indicated)
2009 2015 2016 2017 2018 2019Summary external debt data by debtor typeTotal external debt stocks 157.0 241.7 248.3 269.5 252.6 251.6 Use of IMF credit 15.6 14.2 14.7 16.8 16.8 18.8 Long-term external debt 125.0 219.2 224.5 245.5 226.3 225.2 Public and publicly guaranteed sector 125.0 219.2 224.5 245.5 226.3 225.2 Public sector 120.0 215.0 220.3 241.2 222.1 220.6 of which: General government 120.0 215.0 220.3 241.2 222.1 220.6 Private sector guaranteed by public sector 5.0 4.2 4.2 4.2 4.2 4.6 Private sector not guaranteed .. .. .. .. .. .. Short-term external debt 16.4 8.3 9.1 7.2 9.6 7.6
Disbursements (long-term) 18.8 25.1 9.6 12.2 5.6 4.4 Public and publicly guaranteed sector 18.8 25.1 9.6 12.2 5.6 4.4 Public sector 13.8 25.1 9.6 12.2 5.6 4.4 of which: General government 13.8 25.1 9.6 12.2 5.6 4.4 Private sector guaranteed by public sector 5.0 .. .. .. .. .. Private sector not guaranteed .. .. .. .. .. ..
Principal repayments (long-term) 1.7 0.8 0.7 2.1 2.7 4.8 Public and publicly guaranteed sector 1.7 0.8 0.7 2.1 2.7 4.8 Public sector 1.7 0.8 0.7 2.1 2.7 4.8 of which: General government 1.7 0.8 0.7 2.1 2.7 4.8 Private sector guaranteed by public sector .. .. .. .. .. .. Private sector not guaranteed .. .. .. .. .. ..
Interest payments (long-term) 0.3 1.0 1.1 1.1 1.3 3.4 Public and publicly guaranteed sector 0.3 1.0 1.1 1.1 1.3 3.4 Public sector 0.3 1.0 1.1 1.1 1.3 3.4 of which: General government 0.3 1.0 1.1 1.1 1.3 3.4 Private sector guaranteed by public sector .. .. .. .. .. .. Private sector not guaranteed .. .. .. .. .. ..
Summary external debt stock by creditor typeLong-term external debt stocks 125.0 219.2 224.5 245.5 226.3 225.2 Public and publicly guaranteed debt from: 125.0 219.2 224.5 245.5 226.3 225.2 Official creditors 125.0 219.2 224.5 245.5 226.3 225.2 Multilateral 36.7 37.9 40.1 44.9 46.9 46.2 of which: World Bank 14.4 12.2 11.6 12.0 11.5 11.1 Bilateral 88.3 181.3 184.4 200.6 179.4 179.0 Private creditors .. .. .. .. .. .. Bondholders .. .. .. .. .. .. Commercial banks and others .. .. .. .. .. .. Private nonguaranteed debt from: .. .. .. .. .. .. Bondholders .. .. .. .. .. .. Commercial banks and others .. .. .. .. .. ..Use of IMF credit 15.6 14.2 14.7 16.8 16.8 18.8
Net financial inflowsNet debt inflows Use of IMF credit 0.6 -0.1 1.0 1.2 0.4 2.2 Long-term 17.1 24.4 8.8 10.1 2.9 -0.4 Official creditors 17.1 24.4 8.8 10.1 2.9 -0.4 Multilateral 2.4 1.4 2.9 2.9 2.9 -0.4 of which: World Bank 1.0 -0.3 -0.3 -0.3 -0.3 -0.3 Bilateral 14.7 23.0 5.9 7.2 .. 0.0 Private creditors .. .. .. .. .. .. Bondholders .. .. .. .. .. .. Banks and others .. .. .. .. .. .. Short-term 1.0 -3.0 0.9 -2.1 2.4 0.1Net equity inflows Foreign direct investment 15.5 24.8 23.3 32.9 22.7 24.7 Portfolio equity 0.0 0.0 -0.1 0.1 0.0 7.7
Debt ratiosExternal debt stocks to exports (%) 738.6 249.4 241.4 284.3 257.1 328.9External debt stocks to GNI (%) 83.7 76.2 71.2 72.1 59.5 59.2Debt service to exports (%) 9.9 2.9 2.6 4.1 4.7 11.6Short-term to external debt stocks (%) 10.5 3.4 3.6 2.7 3.8 3.0Multilateral to external debt stocks (%) 23.4 15.7 16.2 16.7 18.6 18.3Reserves to external debt stocks (%) 42.5 30.1 25.5 21.9 17.3 18.7Gross national income (GNI) 187.5 317.2 348.5 373.9 424.8 424.8

123
SENEGAL(US$ million, unless otherwise indicated)
2009 2015 2016 2017 2018 2019Summary external debt data by debtor typeTotal external debt stocks 3,721 5,905 6,690 8,899 11,892 13,583 Use of IMF credit 409 344 299 283 242 219 Long-term external debt 3,312 5,561 6,390 8,616 11,650 13,365 Public and publicly guaranteed sector 2,954 5,332 6,151 8,367 11,208 12,845 Public sector 2,954 5,332 6,151 8,367 11,208 12,845 of which: General government 2,948 5,332 6,151 8,367 11,208 12,845 Private sector guaranteed by public sector .. .. .. .. .. .. Private sector not guaranteed 357 229 239 250 442 520 Short-term external debt 0 0 0 0 0 0
Disbursements (long-term) 837 643 1,229 2,083 4,030 2,365 Public and publicly guaranteed sector 628 595 1,096 1,919 3,634 2,288 Public sector 628 595 1,096 1,919 3,634 2,288 of which: General government 628 595 1,096 1,919 3,634 2,288 Private sector guaranteed by public sector .. .. .. .. .. .. Private sector not guaranteed 208 49 133 165 396 78
Principal repayments (long-term) 146 193 207 327 483 547 Public and publicly guaranteed sector 97 101 121 147 316 547 Public sector 97 101 121 147 316 547 of which: General government 96 101 121 147 316 547 Private sector guaranteed by public sector .. .. .. .. .. .. Private sector not guaranteed 49 92 86 180 167 ..
Interest payments (long-term) 50 150 155 298 304 374 Public and publicly guaranteed sector 41 138 145 292 292 359 Public sector 41 138 145 292 292 359 of which: General government 41 138 145 292 292 359 Private sector guaranteed by public sector .. .. .. .. .. .. Private sector not guaranteed 9 12 10 6 11 16
Summary external debt stock by creditor typeLong-term external debt stocks 3,312 5,561 6,390 8,616 11,650 13,365 Public and publicly guaranteed debt from: 2,954 5,332 6,151 8,367 11,208 12,845 Official creditors 2,752 4,272 5,107 6,120 6,674 7,645 Multilateral 1,806 2,779 3,056 3,620 3,719 4,746 of which: World Bank 927 1,598 1,670 1,999 2,070 2,657 Bilateral 946 1,493 2,051 2,501 2,955 2,899 Private creditors 202 1,060 1,044 2,246 4,534 5,200 Bondholders 200 886 874 2,025 4,151 4,122 Commercial banks and others 2 174 170 221 383 1,078 Private nonguaranteed debt from: 357 229 239 250 442 520 Bondholders .. .. .. .. .. .. Commercial banks and others 357 229 239 250 442 520Use of IMF credit 409 344 299 283 242 219
Net financial inflowsNet debt inflows Use of IMF credit 100 -34 -36 -34 -34 -22 Long-term 691 450 1,022 1,756 3,547 1,818 Official creditors 334 493 972 646 959 1,041 Multilateral 206 189 368 314 208 1,070 of which: World Bank 134 162 124 224 123 604 Bilateral 128 305 605 332 751 -30 Private creditors 357 -43 49 1,110 2,588 777 Bondholders 200 .. .. 1,100 2,181 0 Banks and others 157 -43 49 10 407 777 Short-term -197 0 0 0 0 0Net equity inflows Foreign direct investment 245 259 272 368 439 983 Portfolio equity -2 20 25 13 15 ..
Debt ratiosExternal debt stocks to exports (%) 113 137 152 181 208 ..External debt stocks to GNI (%) 23 34 36 44 53 59Debt service to exports (%) 6 9 9 13 14 ..Short-term to external debt stocks (%) 0 0 0 0 0 0Multilateral to external debt stocks (%) 49 47 46 41 31 35Reserves to external debt stocks (%) 57 34 .. .. .. ..Gross national income (GNI) 16,078 17,383 18,542 20,409 22,635 22,963

124
SERBIA(US$ million, unless otherwise indicated)
2009 2015 2016 2017 2018 2019Summary external debt data by debtor typeTotal external debt stocks 33,809 31,301 29,533 34,279 34,223 35,896 Use of IMF credit 2,299 633 598 634 619 615 Long-term external debt 27,910 29,780 27,811 32,120 31,553 32,669 Public and publicly guaranteed sector 8,835 16,276 16,215 16,422 15,088 15,343 Public sector 8,833 16,137 16,084 16,308 15,088 15,343 of which: General government 7,133 14,823 14,879 15,140 14,183 14,467 Private sector guaranteed by public sector 2 139 131 114 0 .. Private sector not guaranteed 19,076 13,505 11,595 15,698 16,465 17,326 Short-term external debt 3,600 888 1,124 1,526 2,051 2,611
Disbursements (long-term) 4,529 3,112 3,698 7,339 4,709 8,694 Public and publicly guaranteed sector 966 1,378 1,207 1,439 1,502 3,125 Public sector 966 1,378 1,207 1,439 1,502 3,125 of which: General government 824 1,182 934 1,294 1,394 2,992 Private sector guaranteed by public sector 0 0 .. .. .. .. Private sector not guaranteed 3,562 1,734 2,492 5,899 3,207 5,569
Principal repayments (long-term) 3,613 2,980 5,016 4,086 4,813 6,385 Public and publicly guaranteed sector 158 827 1,030 2,195 2,501 2,743 Public sector 157 819 1,027 2,162 2,389 2,743 of which: General government 116 588 678 1,862 2,056 2,594 Private sector guaranteed by public sector 1 8 3 34 112 .. Private sector not guaranteed 3,454 2,153 3,986 1,891 2,312 3,643
Interest payments (long-term) 916 1,117 917 869 908 912 Public and publicly guaranteed sector 348 594 588 576 546 515 Public sector 348 586 582 571 542 515 of which: General government 288 532 536 542 522 502 Private sector guaranteed by public sector 0 8 6 5 4 .. Private sector not guaranteed 568 523 330 292 361 396
Summary external debt stock by creditor typeLong-term external debt stocks 27,910 29,780 27,811 32,120 31,553 32,669 Public and publicly guaranteed debt from: 8,835 16,276 16,215 16,422 15,088 15,343 Official creditors 7,499 10,188 10,355 11,708 11,565 11,770 Multilateral 4,404 5,373 5,313 6,246 5,861 5,743 of which: World Bank 2,459 2,515 2,384 2,939 2,799 2,708 Bilateral 3,095 4,815 5,042 5,462 5,704 6,027 Private creditors 1,336 6,087 5,860 4,714 3,523 3,573 Bondholders .. 5,250 5,250 4,500 3,500 3,552 Commercial banks and others 1,336 837 610 214 23 22 Private nonguaranteed debt from: 19,076 13,505 11,595 15,698 16,465 17,326 Bondholders 165 1,041 1,206 2,825 2,752 3,336 Commercial banks and others 18,911 12,464 10,389 12,872 13,713 13,990Use of IMF credit 2,299 633 598 634 619 615
Net financial inflowsNet debt inflows Use of IMF credit 1,575 -162 -16 .. .. .. Long-term 916 132 -1,318 3,252 -105 2,308 Official creditors 673 656 391 421 191 337 Multilateral 329 453 114 206 -117 -9 of which: World Bank 72 274 -56 226 -17 -38 Bilateral 344 204 277 216 308 346 Private creditors 243 -524 -1,709 2,831 -295 1,971 Bondholders .. 162 166 775 -1,000 656 Banks and others 243 -686 -1,874 2,056 705 1,315 Short-term -95 217 378 300 624 529Net equity inflows Foreign direct investment 1,592 2,107 1,521 1,657 3,515 3,415 Portfolio equity 23 -90 -14 -7 -28 -64
Debt ratiosExternal debt stocks to exports (%) 284 172 148 152 134 134External debt stocks to GNI (%) 76 83 77 83 71 74Debt service to exports (%) 39 23 30 22 22 27Short-term to external debt stocks (%) 11 3 4 4 6 7Multilateral to external debt stocks (%) 13 17 18 18 17 16Reserves to external debt stocks (%) 44 34 34 32 35 38Gross national income (GNI) 44,463 37,789 38,393 41,227 48,021 48,636

125
SIERRA LEONE(US$ million, unless otherwise indicated)
2009 2015 2016 2017 2018 2019Summary external debt data by debtor typeTotal external debt stocks 856.9 1,553.5 1,612.5 1,734.6 1,735.5 1,808.1 Use of IMF credit 229.2 391.0 443.9 509.5 501.1 502.9 Long-term external debt 604.7 948.6 967.6 1,030.0 1,045.9 1,118.7 Public and publicly guaranteed sector 604.7 948.6 967.6 1,030.0 1,045.9 1,118.7 Public sector 604.7 948.6 967.6 1,030.0 1,045.9 1,118.7 of which: General government 604.7 948.6 967.6 1,030.0 1,045.9 1,118.7 Private sector guaranteed by public sector .. .. .. .. .. .. Private sector not guaranteed .. .. .. .. .. .. Short-term external debt 23.0 213.9 201.0 195.1 188.5 186.5
Disbursements (long-term) 62.2 79.6 53.4 72.3 57.3 106.7 Public and publicly guaranteed sector 62.2 79.6 53.4 72.3 57.3 106.7 Public sector 62.2 79.6 53.4 72.3 57.3 106.7 of which: General government 62.2 79.6 53.4 72.3 57.3 106.7 Private sector guaranteed by public sector .. .. .. .. .. .. Private sector not guaranteed .. .. .. .. .. ..
Principal repayments (long-term) 3.3 13.9 19.7 24.4 28.3 30.8 Public and publicly guaranteed sector 3.3 13.9 19.7 24.4 28.3 30.8 Public sector 3.3 13.9 19.7 24.4 28.3 30.8 of which: General government 3.3 13.9 19.7 24.4 28.3 30.8 Private sector guaranteed by public sector .. .. .. .. .. .. Private sector not guaranteed .. .. .. .. .. ..
Interest payments (long-term) 3.7 7.6 12.3 12.9 5.4 9.5 Public and publicly guaranteed sector 3.7 7.6 12.3 12.9 5.4 9.5 Public sector 3.7 7.6 12.3 12.9 5.4 9.5 of which: General government 3.7 7.6 12.3 12.9 5.4 9.5 Private sector guaranteed by public sector .. .. .. .. .. .. Private sector not guaranteed .. .. .. .. .. ..
Summary external debt stock by creditor typeLong-term external debt stocks 604.7 948.6 967.6 1,030.0 1,045.9 1,118.7 Public and publicly guaranteed debt from: 604.7 948.6 967.6 1,030.0 1,045.9 1,118.7 Official creditors 393.6 755.2 774.2 836.6 852.4 925.3 Multilateral 322.2 590.9 601.6 671.6 683.2 757.2 of which: World Bank 124.3 225.7 224.3 275.7 284.3 348.0 Bilateral 71.3 164.3 172.5 165.0 169.2 168.0 Private creditors 211.1 193.4 193.4 193.4 193.4 193.4 Bondholders .. .. .. .. .. .. Commercial banks and others 211.1 193.4 193.4 193.4 193.4 193.4 Private nonguaranteed debt from: .. .. .. .. .. .. Bondholders .. .. .. .. .. .. Commercial banks and others .. .. .. .. .. ..Use of IMF credit 229.2 391.0 443.9 509.5 501.1 502.9
Net financial inflowsNet debt inflows Use of IMF credit 18.8 102.0 66.8 38.1 3.6 4.7 Long-term 58.8 65.7 33.7 47.9 29.0 75.9 Official creditors 58.8 65.7 33.7 47.9 29.0 75.9 Multilateral 49.0 50.2 21.8 45.6 22.3 76.5 of which: World Bank 15.1 5.3 5.6 37.2 15.7 65.2 Bilateral 9.9 15.5 11.9 2.4 6.7 -0.6 Private creditors .. .. .. .. .. .. Bondholders .. .. .. .. .. .. Banks and others .. .. .. .. .. .. Short-term 14.0 0.7 -12.9 -5.9 -6.6 -2.0Net equity inflows Foreign direct investment 84.6 231.9 121.5 176.2 189.3 367.7 Portfolio equity 5.6 .. .. .. .. ..
Debt ratiosExternal debt stocks to exports (%) 225.7 197.2 171.8 225.0 225.9 ..External debt stocks to GNI (%) 32.2 37.3 49.2 47.8 45.7 49.3Debt service to exports (%) 2.1 6.6 4.0 7.6 7.7 ..Short-term to external debt stocks (%) 2.7 13.8 12.5 11.2 10.9 10.3Multilateral to external debt stocks (%) 37.6 38.0 37.3 38.7 39.4 41.9Reserves to external debt stocks (%) 47.3 37.3 30.8 31.7 29.0 29.5Gross national income (GNI) 2,665.0 4,162.1 3,277.0 3,629.6 3,798.5 3,668.4

126
SOLOMON ISLANDS(US$ million, unless otherwise indicated)
2009 2015 2016 2017 2018 2019Summary external debt data by debtor typeTotal external debt stocks 172.4 207.5 263.8 376.7 323.5 350.5 Use of IMF credit 15.5 27.7 23.6 21.0 17.1 15.0 Long-term external debt 154.4 158.0 205.6 327.8 263.4 299.3 Public and publicly guaranteed sector 132.9 81.2 86.7 96.5 96.0 98.1 Public sector 132.9 81.2 86.7 96.5 96.0 98.1 of which: General government 132.9 81.2 86.7 96.5 96.0 98.1 Private sector guaranteed by public sector .. .. .. .. .. .. Private sector not guaranteed 21.5 76.8 118.9 231.3 167.4 201.3 Short-term external debt 2.5 21.7 34.7 27.9 43.0 36.2
Disbursements (long-term) 13.7 32.6 38.4 177.0 36.8 18.0 Public and publicly guaranteed sector 0.0 0.0 13.1 11.1 6.1 7.6 Public sector 0.0 0.0 13.1 11.1 6.1 7.6 of which: General government 0.0 0.0 13.1 11.1 6.1 7.6 Private sector guaranteed by public sector .. .. .. .. .. .. Private sector not guaranteed 13.7 32.5 25.2 165.9 30.7 10.4
Principal repayments (long-term) 7.6 8.5 13.2 17.1 29.5 9.8 Public and publicly guaranteed sector 6.5 5.3 6.5 5.2 4.8 5.1 Public sector 6.5 5.3 6.5 5.2 4.8 5.1 of which: General government 6.5 5.3 6.5 5.2 4.8 5.1 Private sector guaranteed by public sector .. .. .. .. .. .. Private sector not guaranteed 1.1 3.2 6.7 11.9 24.7 4.7
Interest payments (long-term) 2.4 2.2 5.1 4.0 6.0 3.2 Public and publicly guaranteed sector 1.8 1.1 1.1 1.1 1.1 1.1 Public sector 1.8 1.1 1.1 1.1 1.1 1.1 of which: General government 1.8 1.1 1.1 1.1 1.1 1.1 Private sector guaranteed by public sector .. .. .. .. .. .. Private sector not guaranteed 0.5 1.1 4.0 3.0 4.9 2.1
Summary external debt stock by creditor typeLong-term external debt stocks 154.4 158.0 205.6 327.8 263.4 299.3 Public and publicly guaranteed debt from: 132.9 81.2 86.7 96.5 96.0 98.1 Official creditors 132.7 81.2 86.7 96.5 96.0 98.1 Multilateral 111.5 69.3 75.9 86.8 87.5 90.7 of which: World Bank 43.7 31.2 33.6 36.1 36.6 38.5 Bilateral 21.2 11.9 10.8 9.7 8.5 7.4 Private creditors 0.2 .. .. .. .. .. Bondholders .. .. .. .. .. .. Commercial banks and others 0.2 .. .. .. .. .. Private nonguaranteed debt from: 21.5 76.8 118.9 231.3 167.4 201.3 Bondholders .. .. .. .. .. .. Commercial banks and others 21.5 76.8 118.9 231.3 167.4 201.3Use of IMF credit 15.5 27.7 23.6 21.0 17.1 15.0
Net financial inflowsNet debt inflows Use of IMF credit .. -2.7 -3.4 -3.8 -3.5 -2.0 Long-term 6.1 24.0 25.1 159.9 7.3 8.1 Official creditors -6.3 -5.3 6.6 6.0 1.3 2.5 Multilateral -4.6 -4.2 7.7 7.1 2.4 3.6 of which: World Bank -1.1 -1.5 3.5 0.5 1.4 2.2 Bilateral -1.6 -1.1 -1.1 -1.1 -1.1 -1.1 Private creditors 12.4 29.3 18.5 154.0 6.0 5.7 Bondholders .. .. .. .. .. .. Banks and others 12.4 29.3 18.5 154.0 6.0 5.7 Short-term 1.0 6.8 13.0 -6.8 15.2 -6.9Net equity inflows Foreign direct investment 35.0 6.9 28.6 31.4 32.4 35.1 Portfolio equity .. .. .. 0.0 0.0 0.0
Debt ratiosExternal debt stocks to exports (%) 72.7 35.9 44.2 59.3 44.7 54.9External debt stocks to GNI (%) 39.8 18.5 22.7 30.2 24.2 25.8Debt service to exports (%) 4.2 2.4 3.8 4.0 5.6 2.6Short-term to external debt stocks (%) 1.5 10.5 13.2 7.4 13.3 10.3Multilateral to external debt stocks (%) 64.6 33.4 28.8 23.1 27.0 25.9Reserves to external debt stocks (%) 84.7 238.2 184.4 144.2 181.2 152.7Gross national income (GNI) 432.9 1,121.1 1,164.6 1,246.5 1,334.8 1,356.1

127
SOMALIA(US$ million, unless otherwise indicated)
2009 2015 2016 2017 2018 2019Summary external debt data by debtor typeTotal external debt stocks 2,935 2,762 2,737 2,825 5,563 5,616 Use of IMF credit 248 219 212 225 220 219 Long-term external debt 1,876 1,751 1,736 1,779 2,085 2,082 Public and publicly guaranteed sector 1,876 1,751 1,736 1,779 2,085 2,082 Public sector 1,876 1,751 1,736 1,779 2,085 2,082 of which: General government 1,852 1,728 1,713 1,756 2,060 2,058 Private sector guaranteed by public sector .. .. .. .. .. .. Private sector not guaranteed .. .. .. .. .. .. Short-term external debt 811 793 788 821 3,259 3,315
Disbursements (long-term) 0 0 0 0 0 0 Public and publicly guaranteed sector 0 0 0 0 0 0 Public sector 0 0 0 0 0 0 of which: General government 0 0 0 0 0 0 Private sector guaranteed by public sector .. .. .. .. .. .. Private sector not guaranteed .. .. .. .. .. ..
Principal repayments (long-term) 0 0 0 0 0 0 Public and publicly guaranteed sector 0 0 0 0 0 0 Public sector 0 0 0 0 0 0 of which: General government 0 0 0 0 0 0 Private sector guaranteed by public sector .. .. .. .. .. .. Private sector not guaranteed .. .. .. .. .. ..
Interest payments (long-term) 0 0 0 0 0 0 Public and publicly guaranteed sector 0 0 0 0 0 0 Public sector 0 0 0 0 0 0 of which: General government 0 0 0 0 0 0 Private sector guaranteed by public sector .. .. .. .. .. .. Private sector not guaranteed .. .. .. .. .. ..
Summary external debt stock by creditor typeLong-term external debt stocks 1,876 1,751 1,736 1,779 2,085 2,082 Public and publicly guaranteed debt from: 1,876 1,751 1,736 1,779 2,085 2,082 Official creditors 1,842 1,719 1,705 1,747 2,038 2,037 Multilateral 780 710 698 725 716 714 of which: World Bank 448 412 404 420 413 411 Bilateral 1,062 1,009 1,006 1,022 1,322 1,322 Private creditors 35 31 31 32 46 46 Bondholders .. .. .. .. .. .. Commercial banks and others 35 31 31 32 46 46 Private nonguaranteed debt from: .. .. .. .. .. .. Bondholders .. .. .. .. .. .. Commercial banks and others .. .. .. .. .. ..Use of IMF credit 248 219 212 225 220 219
Net financial inflowsNet debt inflows Use of IMF credit .. .. .. .. .. .. Long-term 0 0 0 0 0 0 Official creditors 0 0 0 0 0 0 Multilateral 0 0 0 0 0 0 of which: World Bank 0 0 0 0 0 .. Bilateral 0 0 0 0 0 0 Private creditors 0 0 0 0 .. .. Bondholders .. .. .. .. .. .. Banks and others 0 0 0 0 .. .. Short-term 0 0 0 0 0 0Net equity inflows Foreign direct investment 108 303 330 369 408 447 Portfolio equity .. .. .. .. .. ..
Debt ratiosExternal debt stocks to exports (%) .. .. 250 267 478 477External debt stocks to GNI (%) .. .. .. .. .. ..Debt service to exports (%) .. .. 0 0 0 0Short-term to external debt stocks (%) 28 29 29 29 59 59Multilateral to external debt stocks (%) 27 26 26 26 13 13Reserves to external debt stocks (%) .. .. .. .. .. ..Gross national income (GNI) .. .. .. .. .. ..

128
SOUTH AFRICA(US$ million, unless otherwise indicated)
2009 2015 2016 2017 2018 2019Summary external debt data by debtor typeTotal external debt stocks 79,903 124,354 142,259 177,583 172,995 188,102 Use of IMF credit 2,799 2,474 2,400 2,543 2,483 2,469 Long-term external debt 55,818 92,805 110,068 138,411 133,758 151,214 Public and publicly guaranteed sector 23,201 44,065 58,413 78,678 71,647 86,307 Public sector 22,695 43,824 58,140 78,375 71,387 86,003 of which: General government 19,003 41,136 54,666 71,646 63,701 78,266 Private sector guaranteed by public sector 506 240 273 303 260 304 Private sector not guaranteed 32,617 48,740 51,655 59,732 62,111 64,907 Short-term external debt 21,286 29,075 29,791 36,630 36,754 34,419
Disbursements (long-term) 4,379 14,509 17,410 30,812 21,536 15,415 Public and publicly guaranteed sector 2,209 1,830 10,422 15,873 6,198 12,584 Public sector 2,209 1,830 10,422 15,873 6,198 12,584 of which: General government 2,209 1,193 9,897 12,750 4,484 11,336 Private sector guaranteed by public sector .. .. .. .. .. .. Private sector not guaranteed 2,170 12,679 6,988 14,939 15,338 2,831
Principal repayments (long-term) 2,773 15,372 8,043 8,627 21,945 10,312 Public and publicly guaranteed sector 2,065 12,906 1,978 1,750 10,437 764 Public sector 2,065 12,906 1,978 1,750 10,437 760 of which: General government 433 12,847 1,919 1,610 10,265 590 Private sector guaranteed by public sector .. .. .. .. .. 4 Private sector not guaranteed 708 2,465 6,065 6,877 11,509 9,548
Interest payments (long-term) 1,766 5,323 5,376 5,252 6,230 5,601 Public and publicly guaranteed sector 1,114 2,661 2,696 2,752 3,752 3,405 Public sector 1,064 2,628 2,667 2,720 3,720 3,376 of which: General government 965 2,424 2,446 2,452 3,400 2,877 Private sector guaranteed by public sector 50 33 28 31 32 30 Private sector not guaranteed 652 2,661 2,680 2,500 2,478 2,196
Summary external debt stock by creditor typeLong-term external debt stocks 55,818 92,805 110,068 138,411 133,758 151,214 Public and publicly guaranteed debt from: 23,201 44,065 58,413 78,678 71,647 86,307 Official creditors 227 3,783 4,602 7,999 8,298 7,783 Multilateral 227 3,495 4,175 5,466 4,794 4,631 of which: World Bank 21 1,785 2,343 2,686 2,277 2,239 Bilateral 0 288 426 2,534 3,504 3,153 Private creditors 22,974 40,282 53,811 70,679 63,349 78,523 Bondholders 17,097 28,807 40,271 55,713 46,626 55,075 Commercial banks and others 5,876 11,474 13,540 14,966 16,723 23,448 Private nonguaranteed debt from: 32,617 48,740 51,655 59,732 62,111 64,907 Bondholders 8,485 10,309 9,878 10,116 11,187 11,634 Commercial banks and others 24,132 38,431 41,776 49,616 50,923 53,273Use of IMF credit 2,799 2,474 2,400 2,543 2,483 2,469
Net financial inflowsNet debt inflows Use of IMF credit .. .. .. .. .. .. Long-term 1,606 -863 9,368 22,186 -410 5,103 Official creditors -6 617 463 2,986 980 999 Multilateral -6 340 370 930 -69 -214 of which: World Bank -5 357 324 230 -46 -90 Bilateral .. 277 92 2,055 1,048 1,214 Private creditors 1,611 -1,480 8,905 19,200 -1,389 4,104 Bondholders 1,809 -10,295 5,477 10,044 -5,928 6,732 Banks and others -198 8,815 3,428 9,156 4,538 -2,628 Short-term -4,176 1,033 716 6,839 124 -2,335Net equity inflows Foreign direct investment 4,957 -596 364 -266 1,378 1,486 Portfolio equity 9,364 8,499 1,640 7,588 2,946 -4,289
Debt ratiosExternal debt stocks to exports (%) 91 120 147 162 147 167External debt stocks to GNI (%) 28 40 49 52 49 55Debt service to exports (%) 6 21 15 13 25 15Short-term to external debt stocks (%) 27 23 21 21 21 18Multilateral to external debt stocks (%) 0 3 3 3 3 2Reserves to external debt stocks (%) 44 33 30 26 27 26Gross national income (GNI) 289,309 309,749 288,167 339,071 356,649 341,523

129
SRI LANKA(US$ million, unless otherwise indicated)
2009 2015 2016 2017 2018 2019Summary external debt data by debtor typeTotal external debt stocks 19,504 43,925 46,661 50,766 52,909 56,095 Use of IMF credit 1,341 1,240 1,086 1,329 1,545 1,864 Long-term external debt 14,609 35,098 38,163 41,426 43,184 45,790 Public and publicly guaranteed sector 13,643 27,453 30,114 32,624 34,345 36,964 Public sector 13,643 27,453 30,114 32,624 34,345 36,964 of which: General government 13,548 24,820 27,441 30,847 33,776 36,633 Private sector guaranteed by public sector .. .. .. .. .. .. Private sector not guaranteed 967 7,645 8,049 8,802 8,839 8,826 Short-term external debt 3,554 7,588 7,413 8,011 8,181 8,442
Disbursements (long-term) 2,214 4,507 4,606 5,338 7,245 7,059 Public and publicly guaranteed sector 1,827 3,757 3,986 4,357 5,087 6,223 Public sector 1,827 3,757 3,986 4,357 5,087 6,223 of which: General government 1,826 3,677 3,806 4,247 5,006 6,172 Private sector guaranteed by public sector .. .. .. .. .. .. Private sector not guaranteed 387 750 620 981 2,158 836
Principal repayments (long-term) 978 2,115 1,702 2,713 5,523 4,431 Public and publicly guaranteed sector 824 1,718 1,186 2,486 3,190 3,582 Public sector 824 1,718 1,186 2,486 3,190 3,582 of which: General government 816 1,421 1,048 1,477 1,902 3,294 Private sector guaranteed by public sector .. .. .. .. .. .. Private sector not guaranteed 154 397 516 227 2,333 849
Interest payments (long-term) 325 778 990 1,030 1,546 1,542 Public and publicly guaranteed sector 285 730 924 970 1,247 1,383 Public sector 285 730 924 970 1,247 1,383 of which: General government 285 644 786 852 1,153 1,365 Private sector guaranteed by public sector .. .. .. .. .. .. Private sector not guaranteed 40 48 65 59 300 159
Summary external debt stock by creditor typeLong-term external debt stocks 14,609 35,098 38,163 41,426 43,184 45,790 Public and publicly guaranteed debt from: 13,643 27,453 30,114 32,624 34,345 36,964 Official creditors 11,740 17,111 17,604 18,817 18,942 19,373 Multilateral 5,880 6,901 7,186 7,853 8,050 8,231 of which: World Bank 2,487 2,784 2,970 3,244 3,210 3,226 Bilateral 5,860 10,209 10,418 10,964 10,892 11,142 Private creditors 1,903 10,342 12,511 13,807 15,403 17,590 Bondholders 1,000 8,650 10,150 11,150 12,400 15,050 Commercial banks and others 903 1,692 2,361 2,657 3,003 2,540 Private nonguaranteed debt from: 967 7,645 8,049 8,802 8,839 8,826 Bondholders 0 305 362 362 262 175 Commercial banks and others 967 7,340 7,687 8,440 8,577 8,651Use of IMF credit 1,341 1,240 1,086 1,329 1,545 1,864
Net financial inflowsNet debt inflows Use of IMF credit 541 -506 -122 174 252 327 Long-term 1,236 2,392 2,904 2,625 1,723 2,628 Official creditors 614 555 623 644 279 445 Multilateral 267 273 452 340 333 216 of which: World Bank 91 60 270 118 34 33 Bilateral 348 282 171 304 -54 229 Private creditors 622 1,837 2,281 1,980 1,444 2,183 Bondholders 400 1,517 1,558 1,000 1,150 2,563 Banks and others 222 320 723 980 294 -380 Short-term 828 314 -234 490 166 251Net equity inflows Foreign direct investment 173 439 710 532 463 384 Portfolio equity -382 -60 24 359 -4 -15
Debt ratiosExternal debt stocks to exports (%) 214 257 266 264 258 285External debt stocks to GNI (%) 47 56 58 60 62 69Debt service to exports (%) 16 21 19 22 36 32Short-term to external debt stocks (%) 18 17 16 16 15 15Multilateral to external debt stocks (%) 30 16 15 15 15 15Reserves to external debt stocks (%) 24 15 11 14 12 12Gross national income (GNI) 41,581 78,582 80,205 85,114 86,028 81,591

130
ST. LUCIA(US$ million, unless otherwise indicated)
2009 2015 2016 2017 2018 2019Summary external debt data by debtor typeTotal external debt stocks 433.1 530.2 542.2 622.1 615.8 639.0 Use of IMF credit 33.6 33.4 29.8 28.5 24.8 21.7 Long-term external debt 314.9 420.0 430.9 489.8 499.8 542.3 Public and publicly guaranteed sector 314.9 420.0 430.9 489.8 499.8 542.3 Public sector 298.5 399.8 410.9 467.5 475.8 508.7 of which: General government 289.0 396.7 408.4 462.0 469.8 496.5 Private sector guaranteed by public sector 16.4 20.2 20.0 22.3 24.0 33.5 Private sector not guaranteed .. .. .. .. .. .. Short-term external debt 84.6 76.8 81.5 103.8 91.1 75.0
Disbursements (long-term) 25.8 21.4 7.3 13.5 6.5 35.9 Public and publicly guaranteed sector 25.8 21.4 7.3 13.5 6.5 35.9 Public sector 24.3 21.4 7.3 13.5 6.5 35.9 of which: General government 24.3 21.3 7.3 10.0 5.6 29.1 Private sector guaranteed by public sector 1.5 0.0 0.0 0.0 0.0 0.0 Private sector not guaranteed .. .. .. .. .. ..
Principal repayments (long-term) 27.8 46.7 23.8 18.0 17.8 18.5 Public and publicly guaranteed sector 27.8 46.7 23.8 18.0 17.8 18.5 Public sector 25.9 44.5 21.7 16.6 16.5 17.2 of which: General government 23.5 43.9 21.1 16.0 16.0 16.7 Private sector guaranteed by public sector 1.9 2.2 2.1 1.4 1.3 1.3 Private sector not guaranteed .. .. .. .. .. ..
Interest payments (long-term) 13.4 18.9 19.9 23.5 25.0 26.2 Public and publicly guaranteed sector 13.4 18.9 19.9 23.5 25.0 26.2 Public sector 12.8 18.1 19.1 22.7 24.1 25.2 of which: General government 12.4 18.0 19.0 22.5 23.9 25.0 Private sector guaranteed by public sector 0.7 0.8 0.8 0.8 0.9 1.0 Private sector not guaranteed .. .. .. .. .. ..
Summary external debt stock by creditor typeLong-term external debt stocks 314.9 420.0 430.9 489.8 499.8 542.3 Public and publicly guaranteed debt from: 314.9 420.0 430.9 489.8 499.8 542.3 Official creditors 239.8 259.8 248.0 253.2 242.9 270.7 Multilateral 215.7 219.7 211.0 218.4 211.5 222.8 of which: World Bank 69.2 81.3 79.5 85.6 85.6 86.6 Bilateral 24.1 40.2 37.0 34.7 31.3 48.0 Private creditors 75.1 160.2 182.9 236.6 256.9 271.5 Bondholders 75.1 160.2 182.9 236.6 256.9 271.5 Commercial banks and others .. .. .. .. .. .. Private nonguaranteed debt from: .. .. .. .. .. .. Bondholders .. .. .. .. .. .. Commercial banks and others .. .. .. .. .. ..Use of IMF credit 33.6 33.4 29.8 28.5 24.8 21.7
Net financial inflowsNet debt inflows Use of IMF credit 10.6 -3.0 -2.7 -3.0 -3.0 -3.0 Long-term -2.0 -25.3 -16.5 -4.4 -11.3 17.4 Official creditors 6.5 0.9 -11.1 -3.8 -11.1 17.6 Multilateral 9.9 -6.3 -8.1 -0.8 -7.9 0.9 of which: World Bank 1.5 0.0 0.4 1.7 2.0 1.4 Bilateral -3.4 7.2 -3.0 -3.0 -3.2 16.7 Private creditors -8.5 -26.1 -5.4 -0.6 -0.2 -0.2 Bondholders -8.5 -26.1 -5.4 -0.6 -0.2 -0.2 Banks and others .. .. .. .. .. .. Short-term -432.0 -40.9 4.8 22.3 -12.7 -16.1Net equity inflows Foreign direct investment 72.6 142.7 149.1 49.0 44.7 30.6 Portfolio equity .. 0.6 0.5 0.5 3.3 ..
Debt ratiosExternal debt stocks to exports (%) 77.3 50.9 55.5 55.7 49.1 ..External debt stocks to GNI (%) 31.9 32.1 31.0 32.9 31.7 32.0Debt service to exports (%) 7.6 6.7 4.9 4.2 3.9 ..Short-term to external debt stocks (%) 19.5 14.5 15.0 16.7 14.8 11.7Multilateral to external debt stocks (%) 49.8 41.4 38.9 35.1 34.4 34.9Reserves to external debt stocks (%) 40.4 59.9 56.4 51.7 46.4 40.8Gross national income (GNI) 1,356.3 1,653.7 1,750.1 1,891.3 1,942.0 1,997.2

131
ST. VINCENT AND THE GRENADINES(US$ million, unless otherwise indicated)
2009 2015 2016 2017 2018 2019Summary external debt data by debtor typeTotal external debt stocks 246.0 343.9 333.5 337.1 326.3 356.6 Use of IMF credit 18.3 24.9 22.9 21.9 18.0 15.4 Long-term external debt 227.3 318.9 306.5 314.9 308.3 341.2 Public and publicly guaranteed sector 227.3 318.9 306.5 314.9 308.3 341.2 Public sector 227.3 318.9 306.5 314.9 308.3 341.2 of which: General government 207.9 310.2 299.3 308.3 301.9 335.7 Private sector guaranteed by public sector .. .. .. .. .. .. Private sector not guaranteed .. .. .. .. .. .. Short-term external debt 0.5 0.1 4.1 0.3 0.0 0.0
Disbursements (long-term) 20.2 28.9 13.3 31.0 23.3 59.0 Public and publicly guaranteed sector 20.2 28.9 13.3 31.0 23.3 59.0 Public sector 20.2 28.9 13.3 31.0 23.3 59.0 of which: General government 17.9 28.8 12.7 29.7 20.9 57.5 Private sector guaranteed by public sector .. .. .. .. .. .. Private sector not guaranteed .. .. .. .. .. ..
Principal repayments (long-term) 24.9 24.8 24.6 24.7 29.0 25.9 Public and publicly guaranteed sector 24.9 24.8 24.6 24.7 29.0 25.9 Public sector 24.9 24.8 24.6 24.7 29.0 25.9 of which: General government 22.8 22.9 22.7 22.7 26.5 23.6 Private sector guaranteed by public sector .. .. .. .. .. .. Private sector not guaranteed .. .. .. .. .. ..
Interest payments (long-term) 11.2 7.7 6.0 6.2 7.1 8.2 Public and publicly guaranteed sector 11.2 7.7 6.0 6.2 7.1 8.2 Public sector 11.2 7.7 6.0 6.2 7.1 8.2 of which: General government 10.1 7.2 5.7 6.0 6.7 8.0 Private sector guaranteed by public sector .. .. .. .. .. .. Private sector not guaranteed .. .. .. .. .. ..
Summary external debt stock by creditor typeLong-term external debt stocks 227.3 318.9 306.5 314.9 308.3 341.2 Public and publicly guaranteed debt from: 227.3 318.9 306.5 314.9 308.3 341.2 Official creditors 167.4 308.2 299.2 300.6 297.9 333.3 Multilateral 145.1 265.7 258.6 252.1 244.1 276.2 of which: World Bank 23.7 32.0 31.5 32.7 31.8 69.1 Bilateral 22.4 42.5 40.6 48.5 53.8 57.2 Private creditors 59.8 10.7 7.3 14.3 10.5 7.9 Bondholders .. .. .. 10.4 9.1 7.9 Commercial banks and others 59.8 10.7 7.3 3.9 1.3 0.0 Private nonguaranteed debt from: .. .. .. .. .. .. Bondholders .. .. .. .. .. .. Commercial banks and others .. .. .. .. .. ..Use of IMF credit 18.3 24.9 22.9 21.9 18.0 15.4
Net financial inflowsNet debt inflows Use of IMF credit 5.8 -1.0 -1.3 -2.3 -3.5 -2.5 Long-term -4.6 4.1 -11.3 6.3 -5.7 33.1 Official creditors 6.1 10.5 -8.0 -0.7 -1.9 35.7 Multilateral 9.3 2.8 -6.1 -8.3 -7.2 32.3 of which: World Bank 1.3 0.2 0.5 -0.5 -0.2 37.5 Bilateral -3.2 7.7 -1.8 7.7 5.3 3.4 Private creditors -10.7 -6.4 -3.4 7.0 -3.8 -2.6 Bondholders .. .. .. 10.4 -1.2 -1.2 Banks and others -10.7 -6.4 -3.4 -3.4 -2.6 -1.3 Short-term 0.0 0.0 0.0 0.0 0.0 0.0Net equity inflows Foreign direct investment 60.2 114.4 95.8 143.8 100.3 113.1 Portfolio equity .. -0.4 -0.8 -0.1 -0.1 ..
Debt ratiosExternal debt stocks to exports (%) 119.4 118.7 109.5 112.0 101.0 ..External debt stocks to GNI (%) 37.2 46.7 43.4 42.9 40.6 43.6Debt service to exports (%) 17.6 11.6 10.5 11.1 12.3 ..Short-term to external debt stocks (%) 0.2 0.0 1.2 0.1 0.0 0.0Multilateral to external debt stocks (%) 59.0 77.3 77.5 74.8 74.8 77.4Reserves to external debt stocks (%) 35.7 48.3 57.6 54.0 52.0 54.2Gross national income (GNI) 661.9 737.2 769.2 786.5 803.1 818.8

132
SUDAN(US$ million, unless otherwise indicated)
2009 2015 2016 2017 2018 2019Summary external debt data by debtor typeTotal external debt stocks 21,113 21,401 21,092 21,701 21,529 22,264 Use of IMF credit 682 557 531 555 542 528 Long-term external debt 13,752 15,772 15,506 15,806 15,579 16,309 Public and publicly guaranteed sector 13,752 15,772 15,506 15,806 15,579 16,309 Public sector 13,752 15,772 15,506 15,806 15,579 16,309 of which: General government 13,719 15,752 15,485 15,785 15,558 16,289 Private sector guaranteed by public sector .. .. .. .. .. .. Private sector not guaranteed .. .. .. .. .. .. Short-term external debt 6,679 5,072 5,055 5,340 5,408 5,427
Disbursements (long-term) 972 541 134 89 62 853 Public and publicly guaranteed sector 972 541 134 89 62 853 Public sector 972 541 134 89 62 853 of which: General government 959 541 134 89 62 853 Private sector guaranteed by public sector .. .. .. .. .. .. Private sector not guaranteed .. .. .. .. .. ..
Principal repayments (long-term) 366 414 224 139 159 139 Public and publicly guaranteed sector 366 414 224 139 159 139 Public sector 366 414 224 139 159 139 of which: General government 366 414 224 139 159 139 Private sector guaranteed by public sector .. .. .. .. .. .. Private sector not guaranteed .. .. .. .. .. ..
Interest payments (long-term) 113 100 59 86 50 39 Public and publicly guaranteed sector 113 100 59 86 50 39 Public sector 113 100 59 86 50 39 of which: General government 113 100 59 86 50 39 Private sector guaranteed by public sector .. .. .. .. .. .. Private sector not guaranteed .. .. .. .. .. ..
Summary external debt stock by creditor typeLong-term external debt stocks 13,752 15,772 15,506 15,806 15,579 16,309 Public and publicly guaranteed debt from: 13,752 15,772 15,506 15,806 15,579 16,309 Official creditors 11,287 11,190 10,969 11,190 10,982 11,679 Multilateral 3,365 3,351 3,338 3,455 3,411 3,672 of which: World Bank 1,306 1,203 1,180 1,225 1,206 1,201 Bilateral 7,922 7,839 7,631 7,734 7,571 8,007 Private creditors 2,465 4,583 4,537 4,616 4,597 4,630 Bondholders .. .. .. .. .. .. Commercial banks and others 2,465 4,583 4,537 4,616 4,597 4,630 Private nonguaranteed debt from: .. .. .. .. .. .. Bondholders .. .. .. .. .. .. Commercial banks and others .. .. .. .. .. ..Use of IMF credit 682 557 531 555 542 528
Net financial inflowsNet debt inflows Use of IMF credit -11 -8 -10 -7 .. -11 Long-term 605 127 -90 -50 -96 714 Official creditors 605 127 -90 -50 -96 714 Multilateral 51 -21 39 2 1 268 of which: World Bank 0 0 0 0 0 .. Bilateral 554 147 -128 -52 -98 445 Private creditors .. .. .. 0 0 0 Bondholders .. .. .. .. .. .. Banks and others .. .. .. 0 0 0 Short-term -332 -43 -21 60 51 -78Net equity inflows Foreign direct investment -846 1,728 1,064 1,065 1,136 825 Portfolio equity 0 .. .. .. .. ..
Debt ratiosExternal debt stocks to exports (%) 245 436 455 369 420 560External debt stocks to GNI (%) 46 29 41 50 89 122Debt service to exports (%) 6 11 6 4 4 5Short-term to external debt stocks (%) 32 24 24 25 25 24Multilateral to external debt stocks (%) 16 16 16 16 16 16Reserves to external debt stocks (%) 5 1 1 1 .. ..Gross national income (GNI) 45,862 73,131 50,906 43,728 24,193 18,286

133
SYRIAN ARAB REPUBLIC(US$ million, unless otherwise indicated)
2009 2015 2016 2017 2018 2019Summary external debt data by debtor typeTotal external debt stocks 5,689 4,419 4,368 4,604 4,584 4,590 Use of IMF credit 438 387 375 398 388 386 Long-term external debt 4,491 3,528 3,497 3,654 3,647 3,635 Public and publicly guaranteed sector 4,491 3,528 3,497 3,654 3,647 3,635 Public sector 4,491 3,528 3,497 3,654 3,647 3,635 of which: General government 3,861 3,035 3,013 3,144 3,150 3,142 Private sector guaranteed by public sector .. .. .. .. .. .. Private sector not guaranteed .. .. .. .. .. .. Short-term external debt 760 504 495 553 548 569
Disbursements (long-term) 281 0 0 0 60 0 Public and publicly guaranteed sector 281 0 0 0 60 0 Public sector 281 0 0 0 60 0 of which: General government 255 0 0 0 60 0 Private sector guaranteed by public sector .. .. .. .. .. .. Private sector not guaranteed .. .. .. .. .. ..
Principal repayments (long-term) 499 0 0 0 19 1 Public and publicly guaranteed sector 499 0 0 0 19 1 Public sector 499 0 0 0 19 1 of which: General government 446 0 0 0 17 .. Private sector guaranteed by public sector .. .. .. .. .. .. Private sector not guaranteed .. .. .. .. .. ..
Interest payments (long-term) 119 0 0 0 1 0 Public and publicly guaranteed sector 119 0 0 0 1 0 Public sector 119 0 0 0 1 0 of which: General government 99 0 0 0 1 .. Private sector guaranteed by public sector .. .. .. .. .. .. Private sector not guaranteed .. .. .. .. .. ..
Summary external debt stock by creditor typeLong-term external debt stocks 4,491 3,528 3,497 3,654 3,647 3,635 Public and publicly guaranteed debt from: 4,491 3,528 3,497 3,654 3,647 3,635 Official creditors 4,464 3,510 3,479 3,635 3,630 3,619 Multilateral 1,660 1,434 1,403 1,512 1,472 1,459 of which: World Bank 16 14 14 14 14 14 Bilateral 2,803 2,076 2,076 2,123 2,158 2,160 Private creditors 27 18 18 19 17 16 Bondholders .. .. .. .. .. .. Commercial banks and others 27 18 18 19 17 16 Private nonguaranteed debt from: .. .. .. .. .. .. Bondholders .. .. .. .. .. .. Commercial banks and others .. .. .. .. .. ..Use of IMF credit 438 387 375 398 388 386
Net financial inflowsNet debt inflows Use of IMF credit .. .. .. .. .. .. Long-term -219 0 0 0 41 -1 Official creditors -216 0 0 0 43 0 Multilateral 106 0 0 0 1 0 of which: World Bank -1 0 0 0 0 .. Bilateral -322 0 0 0 41 0 Private creditors -2 0 0 0 -2 -1 Bondholders .. .. .. .. .. .. Banks and others -2 0 0 0 -2 -1 Short-term 114 -46 -25 0 1 -1Net equity inflows Foreign direct investment 2,570 .. .. .. .. .. Portfolio equity 0 .. .. .. .. ..
Debt ratiosExternal debt stocks to exports (%) 35 .. .. .. .. ..External debt stocks to GNI (%) .. .. .. .. .. ..Debt service to exports (%) 4 .. .. .. .. ..Short-term to external debt stocks (%) 13 11 11 12 12 12Multilateral to external debt stocks (%) 29 32 32 33 32 32Reserves to external debt stocks (%) 306 .. .. .. .. ..Gross national income (GNI) .. .. .. .. .. ..

134
TAJIKISTAN(US$ million, unless otherwise indicated)
2009 2015 2016 2017 2018 2019Summary external debt data by debtor typeTotal external debt stocks 2,666 5,144 5,181 6,029 5,975 6,631 Use of IMF credit 170 244 217 204 170 144 Long-term external debt 2,422 3,940 4,150 5,079 4,923 5,128 Public and publicly guaranteed sector 1,606 2,093 2,169 2,825 2,848 2,830 Public sector 1,606 2,093 2,169 2,825 2,848 2,830 of which: General government 1,592 2,089 2,164 2,821 2,842 2,824 Private sector guaranteed by public sector .. .. .. .. .. .. Private sector not guaranteed 816 1,847 1,981 2,254 2,076 2,298 Short-term external debt 74 961 814 745 881 1,359
Disbursements (long-term) 514 645 730 979 538 260 Public and publicly guaranteed sector 207 252 225 708 184 122 Public sector 207 252 225 708 184 122 of which: General government 204 251 223 708 182 121 Private sector guaranteed by public sector .. .. .. .. .. .. Private sector not guaranteed 307 392 505 271 354 139
Principal repayments (long-term) 409 197 487 603 401 383 Public and publicly guaranteed sector 35 96 113 112 128 129 Public sector 35 96 113 112 128 129 of which: General government 33 95 111 112 127 129 Private sector guaranteed by public sector .. .. .. .. .. .. Private sector not guaranteed 374 101 374 490 273 254
Interest payments (long-term) 41 89 108 60 120 108 Public and publicly guaranteed sector 24 30 35 38 72 75 Public sector 24 30 35 38 72 75 of which: General government 24 30 35 37 72 75 Private sector guaranteed by public sector .. .. .. .. .. .. Private sector not guaranteed 17 59 73 23 48 33
Summary external debt stock by creditor typeLong-term external debt stocks 2,422 3,940 4,150 5,079 4,923 5,128 Public and publicly guaranteed debt from: 1,606 2,093 2,169 2,825 2,848 2,830 Official creditors 1,599 2,070 2,147 2,301 2,325 2,308 Multilateral 827 909 881 969 1,015 1,038 of which: World Bank 373 316 305 326 333 342 Bilateral 772 1,161 1,267 1,332 1,309 1,269 Private creditors 7 22 21 524 523 522 Bondholders .. .. .. 500 500 500 Commercial banks and others 7 22 21 24 23 22 Private nonguaranteed debt from: 816 1,847 1,981 2,254 2,076 2,298 Bondholders .. .. .. .. .. .. Commercial banks and others 816 1,847 1,981 2,254 2,076 2,298Use of IMF credit 170 244 217 204 170 144
Net financial inflowsNet debt inflows Use of IMF credit 25 -11 -20 -25 -30 -25 Long-term 104 448 243 376 137 -123 Official creditors 168 154 112 96 56 -7 Multilateral 84 10 -6 46 65 27 of which: World Bank 5 -7 -1 3 15 10 Bilateral 84 144 119 49 -9 -35 Private creditors -63 294 130 281 81 -115 Bondholders .. .. .. 500 0 0 Banks and others -63 294 130 -219 81 -115 Short-term -16 -204 -147 -69 136 478Net equity inflows Foreign direct investment 41 201 108 68 142 104 Portfolio equity 0 0 0 0 0 -73
Debt ratiosExternal debt stocks to exports (%) 160 201 230 223 225 230External debt stocks to GNI (%) 45 55 64 72 68 70Debt service to exports (%) 28 12 28 26 22 19Short-term to external debt stocks (%) 3 19 16 12 15 20Multilateral to external debt stocks (%) 31 18 17 16 17 16Reserves to external debt stocks (%) 7 1 2 11 6 8Gross national income (GNI) 5,953 9,381 8,117 8,373 8,749 9,447

135
TANZANIA(US$ million, unless otherwise indicated)
2009 2015 2016 2017 2018 2019Summary external debt data by debtor typeTotal external debt stocks 7,685 15,412 16,360 18,272 18,481 19,598 Use of IMF credit 628 592 515 459 364 301 Long-term external debt 5,656 12,961 13,809 15,765 16,317 17,484 Public and publicly guaranteed sector 4,640 10,765 11,135 12,670 12,854 14,115 Public sector 4,640 10,765 11,135 12,670 12,854 14,115 of which: General government 4,571 10,731 11,102 12,614 12,777 14,017 Private sector guaranteed by public sector 0 .. .. .. .. .. Private sector not guaranteed 1,016 2,197 2,674 3,095 3,463 3,369 Short-term external debt 1,402 1,859 2,037 2,049 1,800 1,814
Disbursements (long-term) 1,065 1,586 1,366 2,156 1,533 2,391 Public and publicly guaranteed sector 919 1,170 890 1,638 1,065 2,025 Public sector 919 1,170 890 1,638 1,065 2,025 of which: General government 889 1,170 890 1,616 1,044 2,004 Private sector guaranteed by public sector 0 .. .. .. .. .. Private sector not guaranteed 146 416 476 519 468 365
Principal repayments (long-term) 106 172 426 422 768 1,176 Public and publicly guaranteed sector 27 93 288 324 668 716 Public sector 27 93 288 324 668 716 of which: General government 20 93 288 324 668 716 Private sector guaranteed by public sector 0 .. .. .. .. .. Private sector not guaranteed 79 78 138 98 100 460
Interest payments (long-term) 45 111 183 182 217 200 Public and publicly guaranteed sector 27 101 167 167 202 185 Public sector 27 101 167 167 202 185 of which: General government 24 101 167 167 202 185 Private sector guaranteed by public sector 0 .. .. .. .. .. Private sector not guaranteed 18 10 16 15 16 15
Summary external debt stock by creditor typeLong-term external debt stocks 5,656 12,961 13,809 15,765 16,317 17,484 Public and publicly guaranteed debt from: 4,640 10,765 11,135 12,670 12,854 14,115 Official creditors 4,520 9,469 10,023 11,246 11,857 12,560 Multilateral 3,573 7,490 7,795 8,930 9,432 10,121 of which: World Bank 2,598 5,399 5,621 6,467 6,815 7,341 Bilateral 947 1,979 2,228 2,316 2,425 2,439 Private creditors 119 1,295 1,111 1,424 997 1,555 Bondholders .. .. .. .. .. .. Commercial banks and others 119 1,295 1,111 1,424 997 1,555 Private nonguaranteed debt from: 1,016 2,197 2,674 3,095 3,463 3,369 Bondholders .. .. .. .. .. .. Commercial banks and others 1,016 2,197 2,674 3,095 3,463 3,369Use of IMF credit 628 592 515 459 364 301
Net financial inflowsNet debt inflows Use of IMF credit 307 -61 -62 -84 -85 -61 Long-term 959 1,414 939 1,734 765 1,215 Official creditors 875 1,114 781 1,017 818 748 Multilateral 871 832 514 747 697 735 of which: World Bank 608 581 398 519 517 568 Bilateral 4 282 267 271 122 14 Private creditors 84 301 159 717 -54 466 Bondholders .. .. .. .. .. .. Banks and others 84 301 159 717 -54 466 Short-term -15 -211 193 -17 -237 17Net equity inflows Foreign direct investment 664 347 631 856 822 1,112 Portfolio equity 3 4 4 1 4 ..
Debt ratiosExternal debt stocks to exports (%) 145 174 189 215 216 199External debt stocks to GNI (%) 27 33 34 35 33 32Debt service to exports (%) 3 4 8 8 13 15Short-term to external debt stocks (%) 18 12 12 11 10 9Multilateral to external debt stocks (%) 46 49 48 49 51 52Reserves to external debt stocks (%) 45 26 27 32 27 ..Gross national income (GNI) 28,784 46,478 48,664 52,107 56,211 61,578

136
THAILAND(US$ million, unless otherwise indicated)
2009 2015 2016 2017 2018 2019Summary external debt data by debtor typeTotal external debt stocks 80,824 132,209 139,244 161,654 172,498 180,230 Use of IMF credit 1,521 1,345 1,304 1,382 1,349 1,342 Long-term external debt 46,019 78,289 83,477 91,551 107,763 118,939 Public and publicly guaranteed sector 10,668 22,420 23,192 29,544 35,901 39,497 Public sector 10,668 22,420 23,192 29,544 35,901 39,497 of which: General government 5,567 19,415 20,363 26,552 32,831 36,480 Private sector guaranteed by public sector .. .. .. .. .. .. Private sector not guaranteed 35,351 55,869 60,285 62,007 71,862 79,442 Short-term external debt 33,284 52,576 54,462 68,721 63,385 59,949
Disbursements (long-term) 12,989 13,723 16,799 21,092 40,537 27,924 Public and publicly guaranteed sector 1,716 184 1,133 6,600 7,189 3,876 Public sector 1,716 184 1,133 6,600 7,189 3,876 of which: General government 1,578 143 1,113 6,324 6,886 3,874 Private sector guaranteed by public sector .. .. .. .. .. .. Private sector not guaranteed 11,273 13,539 15,666 14,492 33,348 24,049
Principal repayments (long-term) 11,313 17,304 12,332 13,452 16,891 24,660 Public and publicly guaranteed sector 830 1,154 482 396 913 673 Public sector 830 1,154 482 396 913 673 of which: General government 370 769 196 194 645 251 Private sector guaranteed by public sector .. .. .. .. .. .. Private sector not guaranteed 10,483 16,149 11,850 13,056 15,979 23,986
Interest payments (long-term) 1,086 786 1,531 819 1,163 1,606 Public and publicly guaranteed sector 201 235 309 390 695 1,025 Public sector 201 235 309 390 695 1,025 of which: General government 79 176 250 340 638 951 Private sector guaranteed by public sector .. .. .. .. .. .. Private sector not guaranteed 885 551 1,221 429 467 581
Summary external debt stock by creditor typeLong-term external debt stocks 46,019 78,289 83,477 91,551 107,763 118,939 Public and publicly guaranteed debt from: 10,668 22,420 23,192 29,544 35,901 39,497 Official creditors 6,509 5,392 5,483 5,592 5,094 4,711 Multilateral 208 1,344 1,304 1,261 1,313 1,191 of which: World Bank 133 1,039 1,032 1,025 1,018 927 Bilateral 6,301 4,048 4,179 4,331 3,781 3,521 Private creditors 4,158 17,028 17,709 23,952 30,807 34,786 Bondholders 3,074 17,000 17,685 23,929 30,783 34,762 Commercial banks and others 1,085 28 24 23 23 23 Private nonguaranteed debt from: 35,351 55,869 60,285 62,007 71,862 79,442 Bondholders 5,125 8,888 9,188 10,043 12,723 13,193 Commercial banks and others 30,226 46,981 51,097 51,964 59,139 66,249Use of IMF credit 1,521 1,345 1,304 1,382 1,349 1,342
Net financial inflowsNet debt inflows Use of IMF credit .. .. .. .. .. .. Long-term 1,676 -3,581 4,467 7,640 23,646 3,265 Official creditors -393 -160 -31 -39 -579 -442 Multilateral -56 -20 -40 -43 52 -122 of which: World Bank 6 -7 -7 -7 -7 -90 Bilateral -337 -140 9 4 -630 -319 Private creditors 2,069 -3,421 4,498 7,679 24,224 3,707 Bondholders 827 -1,956 985 7,099 9,538 4,114 Banks and others 1,242 -1,465 3,513 580 14,686 -407 Short-term 12,825 -3,472 1,886 14,259 -5,337 -3,436Net equity inflows Foreign direct investment 7,136 9,874 4,327 9,059 13,333 6,826 Portfolio equity 9,548 -8,969 -786 598 -7,101 56
Debt ratiosExternal debt stocks to exports (%) 43 48 49 52 51 53External debt stocks to GNI (%) 30 35 35 37 36 34Debt service to exports (%) 7 7 5 5 6 8Short-term to external debt stocks (%) 41 40 39 43 37 33Multilateral to external debt stocks (%) 0 1 1 1 1 1Reserves to external debt stocks (%) 168 114 119 121 116 120Gross national income (GNI) 271,839 380,595 394,013 435,851 482,006 523,598

137
TIMOR-LESTE(US$ million, unless otherwise indicated)
2009 2015 2016 2017 2018 2019Summary external debt data by debtor typeTotal external debt stocks .. 116.7 80.9 124.5 158.1 203.4 Use of IMF credit .. 10.7 10.4 11.0 10.7 10.7 Long-term external debt .. 45.7 70.5 110.5 144.7 191.2 Public and publicly guaranteed sector .. 45.7 70.5 110.5 144.7 191.2 Public sector .. 45.7 70.5 110.5 144.7 191.2 of which: General government .. 45.7 70.5 110.5 144.7 191.2 Private sector guaranteed by public sector .. .. .. .. .. .. Private sector not guaranteed .. .. .. .. .. .. Short-term external debt .. 60.3 0.0 3.0 2.6 1.5
Disbursements (long-term) .. 24.0 25.1 35.7 40.0 49.7 Public and publicly guaranteed sector .. 24.0 25.1 35.7 40.0 49.7 Public sector .. 24.0 25.1 35.7 40.0 49.7 of which: General government .. 24.0 25.1 35.7 40.0 49.7 Private sector guaranteed by public sector .. .. .. .. .. .. Private sector not guaranteed .. .. .. .. .. ..
Principal repayments (long-term) .. 0.0 0.0 0.3 0.7 3.3 Public and publicly guaranteed sector .. 0.0 0.0 0.3 0.7 3.3 Public sector .. 0.0 0.0 0.3 0.7 3.3 of which: General government .. 0.0 0.0 0.3 0.7 3.3 Private sector guaranteed by public sector .. .. .. .. .. .. Private sector not guaranteed .. .. .. .. .. ..
Interest payments (long-term) .. 0.3 0.8 1.5 2.5 3.8 Public and publicly guaranteed sector .. 0.3 0.8 1.5 2.5 3.8 Public sector .. 0.3 0.8 1.5 2.5 3.8 of which: General government .. 0.3 0.8 1.5 2.5 3.8 Private sector guaranteed by public sector .. .. .. .. .. .. Private sector not guaranteed .. .. .. .. .. ..
Summary external debt stock by creditor typeLong-term external debt stocks .. 45.7 70.5 110.5 144.7 191.2 Public and publicly guaranteed debt from: .. 45.7 70.5 110.5 144.7 191.2 Official creditors .. 45.7 70.5 110.5 144.7 191.2 Multilateral .. 43.4 68.1 101.4 131.5 166.3 of which: World Bank .. 10.0 15.6 27.0 33.5 43.2 Bilateral .. 2.3 2.4 9.1 13.2 24.9 Private creditors .. .. .. .. .. .. Bondholders .. .. .. .. .. .. Commercial banks and others .. .. .. .. .. .. Private nonguaranteed debt from: .. .. .. .. .. .. Bondholders .. .. .. .. .. .. Commercial banks and others .. .. .. .. .. ..Use of IMF credit .. 10.7 10.4 11.0 10.7 10.7
Net financial inflowsNet debt inflows Use of IMF credit .. .. .. .. .. .. Long-term .. 24.0 25.1 35.5 39.3 46.4 Official creditors .. 24.0 25.1 35.5 39.3 46.4 Multilateral .. 24.0 25.1 28.7 35.4 34.9 of which: World Bank .. 7.1 5.6 11.4 7.5 9.7 Bilateral .. .. .. 6.7 3.9 11.5 Private creditors .. .. .. .. .. .. Bondholders .. .. .. .. .. .. Banks and others .. .. .. .. .. .. Short-term .. -11.0 -60.3 3.0 -0.4 -1.1Net equity inflows Foreign direct investment 49.9 43.0 5.5 6.7 47.9 74.6 Portfolio equity 0.0 .. .. 0.0 0.0 0.0
Debt ratiosExternal debt stocks to exports (%) .. 8.3 12.3 14.2 15.7 15.5External debt stocks to GNI (%) .. 4.2 3.6 5.5 7.0 8.4Debt service to exports (%) .. 0.1 0.1 0.2 0.3 0.5Short-term to external debt stocks (%) 0.0 51.7 0.0 2.4 1.6 0.7Multilateral to external debt stocks (%) 0.0 37.2 84.2 81.4 83.2 81.8Reserves to external debt stocks (%) .. 375.0 347.3 437.2 426.4 322.6Gross national income (GNI) 2,523.5 2,794.8 2,236.0 2,282.4 2,248.6 2,432.0

138
TOGO(US$ million, unless otherwise indicated)
2009 2015 2016 2017 2018 2019Summary external debt data by debtor typeTotal external debt stocks 1,727.2 1,109.3 1,230.0 1,685.6 1,739.5 1,993.3 Use of IMF credit 201.2 200.6 171.3 226.0 266.0 318.9 Long-term external debt 1,479.0 844.8 1,000.0 1,191.1 1,194.6 1,349.6 Public and publicly guaranteed sector 1,479.0 844.8 1,000.0 1,191.1 1,194.6 1,349.6 Public sector 1,479.0 844.8 1,000.0 1,191.1 1,194.6 1,349.6 of which: General government 1,453.9 840.0 995.9 1,187.1 1,190.9 1,346.2 Private sector guaranteed by public sector .. .. .. .. .. .. Private sector not guaranteed .. .. .. .. .. .. Short-term external debt 47.0 63.9 58.7 268.5 278.8 324.8
Disbursements (long-term) 34.6 188.6 222.8 167.3 113.9 260.6 Public and publicly guaranteed sector 34.6 188.6 222.8 167.3 113.9 260.6 Public sector 34.6 188.6 222.8 167.3 113.9 260.6 of which: General government 34.6 188.6 222.8 167.3 113.9 260.6 Private sector guaranteed by public sector .. .. .. .. .. .. Private sector not guaranteed .. .. .. .. .. ..
Principal repayments (long-term) 39.5 24.8 42.2 40.6 74.0 65.4 Public and publicly guaranteed sector 39.5 24.8 42.2 40.6 74.0 65.4 Public sector 39.5 24.8 42.2 40.6 74.0 65.4 of which: General government 38.9 24.5 41.6 40.3 73.8 65.1 Private sector guaranteed by public sector .. .. .. .. .. .. Private sector not guaranteed .. .. .. .. .. ..
Interest payments (long-term) 13.1 19.4 23.5 19.9 26.6 25.2 Public and publicly guaranteed sector 13.1 19.4 23.5 19.9 26.6 25.2 Public sector 13.1 19.4 23.5 19.9 26.6 25.2 of which: General government 12.9 19.3 23.5 19.8 26.6 25.2 Private sector guaranteed by public sector .. .. .. .. .. .. Private sector not guaranteed .. .. .. .. .. ..
Summary external debt stock by creditor typeLong-term external debt stocks 1,479.0 844.8 1,000.0 1,191.1 1,194.6 1,349.6 Public and publicly guaranteed debt from: 1,479.0 844.8 1,000.0 1,191.1 1,194.6 1,349.6 Official creditors 1,479.0 813.8 980.4 1,180.0 1,190.9 1,233.2 Multilateral 829.3 352.0 425.5 538.9 555.5 625.4 of which: World Bank 586.1 30.8 38.7 50.5 66.0 165.3 Bilateral 649.7 461.8 554.9 641.1 635.4 607.8 Private creditors .. 31.0 19.5 11.1 3.6 116.4 Bondholders .. .. .. .. .. .. Commercial banks and others .. 31.0 19.5 11.1 3.6 116.4 Private nonguaranteed debt from: .. .. .. .. .. .. Bondholders .. .. .. .. .. .. Commercial banks and others .. .. .. .. .. ..Use of IMF credit 201.2 200.6 171.3 226.0 266.0 318.9
Net financial inflowsNet debt inflows Use of IMF credit 41.3 -16.2 -24.1 43.3 46.1 54.3 Long-term -4.9 163.8 180.7 126.7 39.9 195.2 Official creditors -4.9 162.2 191.6 137.2 47.2 82.7 Multilateral -27.1 60.8 84.2 69.1 35.8 96.8 of which: World Bank -21.8 4.2 9.2 9.1 17.3 99.6 Bilateral 22.2 101.4 107.5 68.1 11.4 -14.1 Private creditors .. 1.6 -11.0 -10.4 -7.2 112.5 Bondholders .. .. .. .. .. .. Banks and others .. 1.6 -11.0 -10.4 -7.2 112.5 Short-term -67.0 -25.5 -4.9 210.2 10.4 45.9Net equity inflows Foreign direct investment 32.8 88.0 28.5 -87.0 -87.8 133.3 Portfolio equity 2.1 -0.2 -3.3 -89.2 -183.5 ..
Debt ratiosExternal debt stocks to exports (%) 136.0 59.7 66.3 90.9 89.0 ..External debt stocks to GNI (%) 51.6 25.7 27.1 34.9 32.4 36.4Debt service to exports (%) 4.2 3.3 4.9 5.0 6.8 ..Short-term to external debt stocks (%) 2.7 5.8 4.8 15.9 16.0 16.3Multilateral to external debt stocks (%) 48.0 31.7 34.6 32.0 31.9 31.4Reserves to external debt stocks (%) 40.7 51.7 .. .. .. ..Gross national income (GNI) 3,346.7 4,321.5 4,530.6 4,824.9 5,375.8 5,480.7

139
TONGA(US$ million, unless otherwise indicated)
2009 2015 2016 2017 2018 2019Summary external debt data by debtor typeTotal external debt stocks 114.9 184.3 174.4 193.1 186.8 186.5 Use of IMF credit 10.3 9.1 8.8 9.4 9.2 9.1 Long-term external debt 104.6 175.2 165.6 183.7 177.7 177.4 Public and publicly guaranteed sector 104.6 175.2 165.6 183.7 177.7 177.4 Public sector 104.6 175.2 165.6 183.7 177.7 177.4 of which: General government 104.6 175.2 165.6 183.7 177.7 177.4 Private sector guaranteed by public sector .. .. .. .. .. .. Private sector not guaranteed .. .. .. .. .. .. Short-term external debt 0.0 0.0 0.0 0.0 0.0 0.0
Disbursements (long-term) 17.4 2.2 7.1 10.1 7.3 4.9 Public and publicly guaranteed sector 17.4 2.2 7.1 10.1 7.3 4.9 Public sector 17.4 2.2 7.1 10.1 7.3 4.9 of which: General government 17.4 2.2 7.1 10.1 7.3 4.9 Private sector guaranteed by public sector .. .. .. .. .. .. Private sector not guaranteed .. .. .. .. .. ..
Principal repayments (long-term) 2.4 3.6 3.5 2.8 6.2 2.7 Public and publicly guaranteed sector 2.4 3.6 3.5 2.8 6.2 2.7 Public sector 2.4 3.6 3.5 2.8 6.2 2.7 of which: General government 2.3 3.6 3.5 2.8 6.2 2.7 Private sector guaranteed by public sector .. .. .. .. .. .. Private sector not guaranteed .. .. .. .. .. ..
Interest payments (long-term) 1.4 2.9 2.7 2.7 4.1 2.7 Public and publicly guaranteed sector 1.4 2.9 2.7 2.7 4.1 2.7 Public sector 1.4 2.9 2.7 2.7 4.1 2.7 of which: General government 1.4 2.9 2.7 2.7 4.1 2.7 Private sector guaranteed by public sector .. .. .. .. .. .. Private sector not guaranteed .. .. .. .. .. ..
Summary external debt stock by creditor typeLong-term external debt stocks 104.6 175.2 165.6 183.7 177.7 177.4 Public and publicly guaranteed debt from: 104.6 175.2 165.6 183.7 177.7 177.4 Official creditors 103.7 175.2 165.6 183.7 177.7 177.4 Multilateral 72.9 58.1 60.4 71.4 74.1 75.8 of which: World Bank 23.2 26.5 29.1 37.2 39.1 42.9 Bilateral 30.8 117.1 105.2 112.3 103.6 101.6 Private creditors 0.9 0.0 .. .. .. .. Bondholders .. .. .. .. .. .. Commercial banks and others 0.9 0.0 .. .. .. .. Private nonguaranteed debt from: .. .. .. .. .. .. Bondholders .. .. .. .. .. .. Commercial banks and others .. .. .. .. .. ..Use of IMF credit 10.3 9.1 8.8 9.4 9.2 9.1
Net financial inflowsNet debt inflows Use of IMF credit .. .. .. .. .. .. Long-term 14.9 -1.4 3.6 7.3 1.2 2.2 Official creditors 14.2 -1.3 3.6 7.3 1.2 2.2 Multilateral 0.1 -0.6 4.2 7.3 4.4 2.2 of which: World Bank 1.5 1.7 3.5 6.2 2.8 4.1 Bilateral 14.1 -0.7 -0.6 .. -3.2 .. Private creditors 0.8 -0.1 .. .. .. .. Bondholders .. .. .. .. .. .. Banks and others 0.8 -0.1 .. .. .. .. Short-term .. 0.0 0.0 0.0 0.0 0.0Net equity inflows Foreign direct investment 0.0 7.0 6.8 -2.6 14.2 1.4 Portfolio equity .. 0.0 0.0 0.0 0.0 0.0
Debt ratiosExternal debt stocks to exports (%) 213.1 208.5 142.8 138.3 120.9 112.0External debt stocks to GNI (%) 35.0 41.9 43.2 44.2 40.9 ..Debt service to exports (%) 7.2 7.3 5.1 4.0 6.6 3.3Short-term to external debt stocks (%) 0.0 0.0 0.0 0.0 0.0 0.0Multilateral to external debt stocks (%) 63.5 31.5 34.6 37.0 39.6 40.6Reserves to external debt stocks (%) 83.3 84.7 101.2 102.8 121.6 123.0Gross national income (GNI) 328.0 440.0 403.6 436.9 457.2 ..

140
TUNISIA(US$ million, unless otherwise indicated)
2009 2015 2016 2017 2018 2019Summary external debt data by debtor typeTotal external debt stocks 22,818 27,741 28,893 34,022 35,116 37,764 Use of IMF credit 428 1,768 1,987 2,105 2,280 2,132 Long-term external debt 17,555 19,398 20,212 24,458 24,743 26,415 Public and publicly guaranteed sector 14,948 18,216 18,719 22,386 22,606 23,857 Public sector 14,714 17,933 18,451 22,088 22,362 23,655 of which: General government 11,808 13,864 14,577 15,417 15,899 16,863 Private sector guaranteed by public sector 234 283 268 298 245 203 Private sector not guaranteed 2,607 1,182 1,493 2,072 2,136 2,558 Short-term external debt 4,835 6,575 6,694 7,458 8,093 9,217
Disbursements (long-term) 1,565 3,349 1,949 3,909 2,182 3,719 Public and publicly guaranteed sector 1,388 3,349 1,949 3,909 2,182 3,297 Public sector 1,345 3,346 1,916 3,862 2,182 3,297 of which: General government 904 2,524 1,515 1,128 1,745 2,251 Private sector guaranteed by public sector 43 3 33 47 .. .. Private sector not guaranteed 177 .. .. .. .. 422
Principal repayments (long-term) 1,364 1,470 1,291 1,926 1,409 1,828 Public and publicly guaranteed sector 1,247 1,138 1,189 1,784 1,263 1,828 Public sector 1,231 1,091 1,149 1,732 1,222 1,791 of which: General government 967 643 653 1,278 795 1,153 Private sector guaranteed by public sector 16 47 40 52 42 37 Private sector not guaranteed 117 332 102 142 146 ..
Interest payments (long-term) 702 444 559 588 684 665 Public and publicly guaranteed sector 600 444 463 455 547 571 Public sector 593 437 457 450 543 567 of which: General government 483 328 356 334 353 393 Private sector guaranteed by public sector 7 7 6 5 4 4 Private sector not guaranteed 102 .. 96 133 137 94
Summary external debt stock by creditor typeLong-term external debt stocks 17,555 19,398 20,212 24,458 24,743 26,415 Public and publicly guaranteed debt from: 14,948 18,216 18,719 22,386 22,606 23,857 Official creditors 10,049 12,655 12,717 14,844 14,635 15,931 Multilateral 6,673 9,214 9,305 11,104 11,025 11,398 of which: World Bank 1,405 2,482 2,447 3,275 3,515 3,489 Bilateral 3,376 3,441 3,412 3,740 3,610 4,533 Private creditors 4,899 5,561 6,002 7,542 7,971 7,926 Bondholders 3,776 4,729 5,268 6,705 7,239 7,278 Commercial banks and others 1,123 832 734 837 732 648 Private nonguaranteed debt from: 2,607 1,182 1,493 2,072 2,136 2,558 Bondholders .. .. .. .. .. .. Commercial banks and others 2,607 1,182 1,493 2,072 2,136 2,558Use of IMF credit 428 1,768 1,987 2,105 2,280 2,132
Net financial inflowsNet debt inflows Use of IMF credit .. 301 282 0 228 -135 Long-term 201 1,879 658 1,983 773 1,891 Official creditors 476 986 343 849 407 1,495 Multilateral 439 928 325 814 447 545 of which: World Bank 30 520 20 581 486 31 Bilateral 37 59 19 35 -40 949 Private creditors -275 893 314 1,134 367 396 Bondholders -313 1,000 500 1,260 591 49 Banks and others 38 -107 -186 -126 -224 347 Short-term 505 -271 119 764 635 1,124Net equity inflows Foreign direct investment 1,529 971 631 815 998 817 Portfolio equity -89 153 -57 -64 -41 13
Debt ratiosExternal debt stocks to exports (%) 113 155 166 188 176 191External debt stocks to GNI (%) 55 66 71 88 91 101Debt service to exports (%) 11 11 12 17 14 16Short-term to external debt stocks (%) 21 24 23 22 23 24Multilateral to external debt stocks (%) 29 33 32 33 31 30Reserves to external debt stocks (%) 48 26 20 17 15 20Gross national income (GNI) 41,370 41,813 40,575 38,539 38,421 37,391

141
TURKEY(US$ million, unless otherwise indicated)
2009 2015 2016 2017 2018 2019Summary external debt data by debtor typeTotal external debt stocks 278,830 399,949 409,421 456,562 445,973 440,783 Use of IMF credit 9,638 1,485 1,440 1,526 1,490 1,481 Long-term external debt 220,215 293,333 306,738 335,174 327,989 316,199 Public and publicly guaranteed sector 87,185 103,283 107,727 117,843 121,211 124,923 Public sector 87,009 102,876 107,375 117,497 120,925 124,679 of which: General government 69,826 82,798 84,350 92,236 93,203 99,590 Private sector guaranteed by public sector 176 407 352 346 286 244 Private sector not guaranteed 133,030 190,050 199,011 217,331 206,778 191,277 Short-term external debt 48,977 105,131 101,243 119,863 116,494 123,102
Disbursements (long-term) 39,668 37,297 81,760 88,318 68,568 58,895 Public and publicly guaranteed sector 9,822 9,067 14,324 17,579 15,844 17,226 Public sector 9,812 9,067 14,324 17,579 15,844 17,226 of which: General government 8,605 4,751 7,142 12,046 9,467 13,423 Private sector guaranteed by public sector 10 .. .. 0 0 0 Private sector not guaranteed 29,846 28,230 67,436 70,739 52,725 41,669
Principal repayments (long-term) 49,661 41,978 61,603 69,197 67,974 69,202 Public and publicly guaranteed sector 6,474 6,532 8,437 11,339 10,822 12,899 Public sector 6,474 6,503 8,393 11,288 10,777 12,862 of which: General government 5,365 5,675 5,010 7,595 7,387 6,614 Private sector guaranteed by public sector .. 29 45 51 45 37 Private sector not guaranteed 43,188 35,446 53,166 57,858 57,152 56,303
Interest payments (long-term) 10,589 10,194 10,934 12,098 11,509 12,558 Public and publicly guaranteed sector 4,954 4,396 4,499 4,875 4,876 5,492 Public sector 4,949 4,392 4,495 4,871 4,872 5,488 of which: General government 4,173 3,963 4,001 4,284 4,290 4,579 Private sector guaranteed by public sector 5 4 4 4 4 4 Private sector not guaranteed 5,635 5,798 6,435 7,223 6,632 7,066
Summary external debt stock by creditor typeLong-term external debt stocks 220,215 293,333 306,738 335,174 327,989 316,199 Public and publicly guaranteed debt from: 87,185 103,283 107,727 117,843 121,211 124,923 Official creditors 23,315 30,714 30,880 34,596 34,503 34,252 Multilateral 16,801 25,144 25,593 28,505 28,269 26,845 of which: World Bank 9,816 11,731 10,860 12,039 11,685 11,362 Bilateral 6,513 5,570 5,287 6,091 6,233 7,407 Private creditors 63,870 72,569 76,848 83,247 86,709 90,670 Bondholders 42,432 64,243 67,141 74,436 77,326 82,205 Commercial banks and others 21,439 8,326 9,706 8,811 9,383 8,466 Private nonguaranteed debt from: 133,030 190,050 199,011 217,331 206,778 191,277 Bondholders 6,606 29,666 34,475 41,602 38,894 38,383 Commercial banks and others 126,424 160,384 164,536 175,729 167,884 152,893Use of IMF credit 9,638 1,485 1,440 1,526 1,490 1,481
Net financial inflowsNet debt inflows Use of IMF credit -706 .. .. .. .. .. Long-term -9,993 -4,681 20,157 19,121 594 -10,307 Official creditors 3,006 904 765 925 941 148 Multilateral 2,671 995 1,080 461 745 -1,024 of which: World Bank 1,613 -265 -644 185 5 -172 Bilateral 336 -91 -314 464 196 1,172 Private creditors -12,999 -5,585 19,391 18,196 -347 -10,455 Bondholders 1,265 3,017 4,307 9,466 1,753 3,112 Banks and others -14,264 -8,602 15,085 8,730 -2,100 -13,567 Short-term -3,535 -29,944 -3,889 18,620 -3,369 6,608Net equity inflows Foreign direct investment 7,966 15,973 10,796 10,175 12,219 10,221 Portfolio equity 2,827 -2,395 823 2,971 -1,131 406
Debt ratiosExternal debt stocks to exports (%) 184 186 200 201 183 174External debt stocks to GNI (%) 44 47 48 54 59 59Debt service to exports (%) 42 26 37 38 35 34Short-term to external debt stocks (%) 18 26 25 26 26 28Multilateral to external debt stocks (%) 6 6 6 6 6 6Reserves to external debt stocks (%) 25 23 22 18 16 18Gross national income (GNI) 636,983 850,113 854,542 841,585 759,425 741,899

142
TURKMENISTAN(US$ million, unless otherwise indicated)
2009 2015 2016 2017 2018 2019Summary external debt data by debtor typeTotal external debt stocks 674.2 367.0 507.7 783.7 907.3 567.6 Use of IMF credit 109.5 96.7 93.9 99.4 97.1 96.5 Long-term external debt 480.0 269.5 259.9 267.3 503.6 470.3 Public and publicly guaranteed sector 466.1 231.4 231.4 220.6 468.9 427.0 Public sector 466.1 231.4 231.4 220.6 468.9 427.0 of which: General government 67.1 119.7 135.1 127.3 389.4 358.0 Private sector guaranteed by public sector .. .. .. .. .. .. Private sector not guaranteed 13.9 38.1 28.5 46.8 34.6 43.4 Short-term external debt 84.8 0.8 153.9 417.0 306.7 0.8
Disbursements (long-term) 34.3 22.0 29.4 29.4 276.2 20.7 Public and publicly guaranteed sector 21.4 9.8 23.8 0.5 269.6 0.6 Public sector 21.4 9.8 23.8 0.5 269.6 0.6 of which: General government 0.0 6.3 21.3 0.1 269.6 0.6 Private sector guaranteed by public sector .. .. .. .. .. .. Private sector not guaranteed 12.8 12.2 5.6 28.9 6.6 20.1
Principal repayments (long-term) 146.4 49.5 33.9 32.6 39.9 53.0 Public and publicly guaranteed sector 146.4 32.1 17.7 18.0 17.4 41.5 Public sector 146.4 32.1 17.7 18.0 17.4 41.5 of which: General government 15.2 3.7 6.7 8.7 7.8 32.3 Private sector guaranteed by public sector .. .. .. .. .. .. Private sector not guaranteed .. 17.3 16.2 14.5 22.6 11.5
Interest payments (long-term) 17.6 5.5 4.7 5.2 5.5 14.1 Public and publicly guaranteed sector 17.1 4.6 4.3 4.6 4.8 13.3 Public sector 17.1 4.6 4.3 4.6 4.8 13.3 of which: General government 2.0 1.1 1.5 2.1 2.6 11.4 Private sector guaranteed by public sector .. .. .. .. .. .. Private sector not guaranteed 0.4 0.9 0.4 0.7 0.7 0.8
Summary external debt stock by creditor typeLong-term external debt stocks 480.0 269.5 259.9 267.3 503.6 470.3 Public and publicly guaranteed debt from: 466.1 231.4 231.4 220.6 468.9 427.0 Official creditors 450.7 231.4 231.4 220.6 199.3 181.9 Multilateral 17.4 97.9 114.5 107.9 102.0 96.8 of which: World Bank 12.8 3.0 1.0 0.0 .. .. Bilateral 433.4 133.5 116.9 112.7 97.3 85.0 Private creditors 15.4 .. .. .. 269.6 245.1 Bondholders .. .. .. .. .. .. Commercial banks and others 15.4 .. .. .. 269.6 245.1 Private nonguaranteed debt from: 13.9 38.1 28.5 46.8 34.6 43.4 Bondholders .. .. .. .. .. .. Commercial banks and others 13.9 38.1 28.5 46.8 34.6 43.4Use of IMF credit 109.5 96.7 93.9 99.4 97.1 96.5
Net financial inflowsNet debt inflows Use of IMF credit .. .. .. .. .. .. Long-term -112.2 -27.4 -4.5 -3.2 236.3 -32.3 Official creditors -109.6 -22.3 6.0 -17.6 -17.4 -16.3 Multilateral -2.8 4.4 16.6 -6.6 -5.8 -5.2 of which: World Bank -1.3 -1.9 -2.0 -1.0 .. .. Bilateral -106.8 -26.7 -10.6 -10.9 -11.5 -11.1 Private creditors -2.6 -5.1 -10.6 14.4 253.7 -15.9 Bondholders .. .. .. .. .. .. Banks and others -2.6 -5.1 -10.6 14.4 253.7 -15.9 Short-term 41.0 0.0 153.1 263.0 -110.3 -305.9Net equity inflows Foreign direct investment 4,553.0 3,043.0 2,243.2 2,085.9 1,985.1 2,165.9 Portfolio equity .. .. .. .. .. ..
Debt ratiosExternal debt stocks to exports (%) .. .. .. .. .. ..External debt stocks to GNI (%) 3.6 1.1 1.4 2.2 2.3 ..Debt service to exports (%) .. .. .. .. .. ..Short-term to external debt stocks (%) 12.6 0.2 30.3 53.2 33.8 0.1Multilateral to external debt stocks (%) 2.6 26.7 22.6 13.8 11.2 17.1Reserves to external debt stocks (%) .. .. .. .. .. ..Gross national income (GNI) 18,957.5 33,705.6 35,225.9 36,352.3 39,044.2 ..

143
UGANDA(US$ million, unless otherwise indicated)
2009 2015 2016 2017 2018 2019Summary external debt data by debtor typeTotal external debt stocks 2,763 9,571 10,086 11,673 12,315 13,969 Use of IMF credit 281 240 233 246 241 239 Long-term external debt 2,247 8,776 9,352 10,953 11,566 12,778 Public and publicly guaranteed sector 2,247 4,869 5,446 6,890 7,701 8,635 Public sector 2,243 4,865 5,442 6,886 7,697 8,632 of which: General government 2,242 4,865 5,441 6,885 7,697 8,631 Private sector guaranteed by public sector 5 4 4 4 4 3 Private sector not guaranteed .. 3,907 3,906 4,064 3,865 4,142 Short-term external debt 235 554 502 473 509 952
Disbursements (long-term) 494 1,135 936 1,568 1,167 1,408 Public and publicly guaranteed sector 494 881 785 1,259 1,167 1,131 Public sector 491 881 785 1,259 1,167 1,131 of which: General government 491 881 785 1,259 1,167 1,131 Private sector guaranteed by public sector 3 .. .. .. .. .. Private sector not guaranteed .. 254 151 309 .. 277
Principal repayments (long-term) 49 45 779 97 422 166 Public and publicly guaranteed sector 49 45 46 97 223 166 Public sector 49 45 46 97 223 166 of which: General government 49 45 46 97 223 166 Private sector guaranteed by public sector .. 0 0 0 .. 0 Private sector not guaranteed .. .. 733 .. 199 ..
Interest payments (long-term) 18 41 57 80 98 115 Public and publicly guaranteed sector 18 41 55 80 98 115 Public sector 18 41 55 80 98 115 of which: General government 18 41 55 80 98 115 Private sector guaranteed by public sector .. .. .. .. .. .. Private sector not guaranteed .. .. 1 .. .. ..
Summary external debt stock by creditor typeLong-term external debt stocks 2,247 8,776 9,352 10,953 11,566 12,778 Public and publicly guaranteed debt from: 2,247 4,869 5,446 6,890 7,701 8,635 Official creditors 2,247 4,869 5,445 6,881 7,651 8,552 Multilateral 2,017 3,884 4,077 4,867 5,039 5,653 of which: World Bank 1,379 2,510 2,576 2,980 3,095 3,443 Bilateral 230 985 1,368 2,014 2,612 2,899 Private creditors 0 .. 1 8 50 83 Bondholders .. .. .. .. .. .. Commercial banks and others 0 .. 1 8 50 83 Private nonguaranteed debt from: .. 3,907 3,906 4,064 3,865 4,142 Bondholders .. .. .. .. .. .. Commercial banks and others .. 3,907 3,906 4,064 3,865 4,142Use of IMF credit 281 240 233 246 241 239
Net financial inflowsNet debt inflows Use of IMF credit 0 -1 0 .. .. .. Long-term 445 1,090 157 1,471 746 1,242 Official creditors 445 836 738 1,155 900 931 Multilateral 435 398 338 538 285 640 of which: World Bank 363 212 163 245 190 366 Bilateral 10 438 400 617 615 291 Private creditors 0 254 -581 316 -155 311 Bondholders .. .. .. .. .. .. Banks and others 0 254 -581 316 -155 311 Short-term -223 22 -52 -29 36 443Net equity inflows Foreign direct investment 771 552 396 708 710 955 Portfolio equity 131 10 16 15 66 15
Debt ratiosExternal debt stocks to exports (%) 81 201 208 227 217 226External debt stocks to GNI (%) 11 30 35 39 39 42Debt service to exports (%) 2 2 17 4 9 5Short-term to external debt stocks (%) 9 6 5 4 4 7Multilateral to external debt stocks (%) 73 41 40 42 41 40Reserves to external debt stocks (%) 108 30 31 32 27 ..Gross national income (GNI) 24,628 31,636 28,455 30,033 31,846 33,471

144
UKRAINE(US$ million, unless otherwise indicated)
2009 2015 2016 2017 2018 2019Summary external debt data by debtor typeTotal external debt stocks 105,306 117,450 114,998 122,684 121,040 123,843 Use of IMF credit 13,027 12,486 13,075 14,001 12,997 11,328 Long-term external debt 72,406 84,951 81,699 86,423 87,352 90,489 Public and publicly guaranteed sector 19,011 32,426 33,097 36,052 36,156 38,396 Public sector 19,011 32,426 33,097 36,052 36,156 38,396 of which: General government 18,249 30,426 31,042 33,702 35,418 35,510 Private sector guaranteed by public sector .. .. .. .. .. .. Private sector not guaranteed 53,395 52,526 48,602 50,371 51,197 52,093 Short-term external debt 19,873 20,013 20,223 22,259 20,690 22,025
Disbursements (long-term) 22,368 18,690 5,018 8,166 9,453 12,493 Public and publicly guaranteed sector 5,651 15,514 2,749 5,748 4,016 5,331 Public sector 5,651 15,514 2,749 5,748 4,016 5,331 of which: General government 5,603 15,482 2,678 5,437 3,676 3,029 Private sector guaranteed by public sector .. .. .. .. .. .. Private sector not guaranteed 16,717 3,176 2,268 2,418 5,437 7,163
Principal repayments (long-term) 18,226 23,820 8,608 8,507 8,846 8,270 Public and publicly guaranteed sector 2,093 13,580 1,898 3,456 3,603 2,995 Public sector 2,093 13,580 1,898 3,456 3,603 2,995 of which: General government 1,678 13,565 1,882 3,439 1,657 2,846 Private sector guaranteed by public sector .. .. .. .. .. .. Private sector not guaranteed 16,134 10,239 6,710 5,051 5,243 5,275
Interest payments (long-term) 4,263 4,012 3,116 2,975 2,808 3,170 Public and publicly guaranteed sector 773 1,289 1,435 1,502 1,463 1,681 Public sector 773 1,289 1,435 1,502 1,463 1,681 of which: General government 690 1,142 1,286 1,347 1,436 1,650 Private sector guaranteed by public sector .. .. .. .. .. .. Private sector not guaranteed 3,490 2,723 1,681 1,473 1,345 1,488
Summary external debt stock by creditor typeLong-term external debt stocks 72,406 84,951 81,699 86,423 87,352 90,489 Public and publicly guaranteed debt from: 19,011 32,426 33,097 36,052 36,156 38,396 Official creditors 11,355 12,914 12,298 13,817 12,927 12,342 Multilateral 9,805 11,921 10,985 12,225 11,355 10,715 of which: World Bank 3,294 5,585 5,504 5,346 5,284 5,282 Bilateral 1,551 993 1,312 1,592 1,573 1,627 Private creditors 7,655 19,512 20,800 22,235 23,228 26,054 Bondholders 6,107 19,352 20,643 22,067 22,467 24,485 Commercial banks and others 1,548 159 156 167 761 1,569 Private nonguaranteed debt from: 53,395 52,526 48,602 50,371 51,197 52,093 Bondholders 5,114 4,495 3,831 4,419 4,519 4,489 Commercial banks and others 48,281 48,031 44,771 45,952 46,678 47,604Use of IMF credit 13,027 12,486 13,075 14,001 12,997 11,328
Net financial inflowsNet debt inflows Use of IMF credit 6,082 5,260 995 146 -689 -1,593 Long-term 4,142 -5,129 -3,591 -341 606 4,223 Official creditors 5,148 868 -432 869 -610 -490 Multilateral 5,303 721 -763 633 -605 -533 of which: World Bank 275 885 -81 -158 -62 -2 Bilateral -155 147 330 235 -5 43 Private creditors -1,006 -5,998 -3,158 -1,210 1,217 4,713 Bondholders -1,181 -1,812 541 1,589 -275 2,551 Banks and others 175 -4,185 -3,699 -2,799 1,492 2,162 Short-term -1,078 -3,299 -974 1,114 -2,088 1,191Net equity inflows Foreign direct investment 4,456 584 4,076 3,025 4,069 4,909 Portfolio equity 105 177 69 110 -9 49
Debt ratiosExternal debt stocks to exports (%) 186 219 217 194 170 161External debt stocks to GNI (%) 92 128 121 107 90 78Debt service to exports (%) 41 55 23 21 21 18Short-term to external debt stocks (%) 19 17 18 18 17 18Multilateral to external debt stocks (%) 9 10 10 10 9 9Reserves to external debt stocks (%) 24 11 13 14 16 19Gross national income (GNI) 114,673 91,406 94,833 114,769 134,250 158,534

145
UZBEKISTAN(US$ million, unless otherwise indicated)
2009 2015 2016 2017 2018 2019Summary external debt data by debtor typeTotal external debt stocks 7,028 13,955 15,705 16,792 17,541 21,745 Use of IMF credit 412 364 353 374 365 363 Long-term external debt 6,386 12,920 14,752 15,580 16,473 20,171 Public and publicly guaranteed sector 3,269 5,605 6,603 7,545 9,413 11,790 Public sector 3,263 5,605 6,603 7,545 9,413 11,790 of which: General government 2,369 3,899 4,311 5,087 6,768 9,116 Private sector guaranteed by public sector 6 .. .. .. .. .. Private sector not guaranteed 3,117 7,315 8,149 8,035 7,061 8,381 Short-term external debt 229 671 600 838 702 1,211
Disbursements (long-term) 2,612 2,388 2,899 2,102 2,617 5,647 Public and publicly guaranteed sector 475 1,259 1,399 1,121 2,288 2,801 Public sector 475 1,259 1,399 1,121 2,288 2,801 of which: General government 242 868 663 835 1,908 2,579 Private sector guaranteed by public sector 0 .. .. .. .. .. Private sector not guaranteed 2,138 1,130 1,501 981 330 2,846
Principal repayments (long-term) 713 963 1,006 1,436 691 1,951 Public and publicly guaranteed sector 386 286 341 341 383 429 Public sector 384 286 341 341 383 429 of which: General government 141 176 209 178 198 233 Private sector guaranteed by public sector 2 .. .. .. .. .. Private sector not guaranteed 327 677 665 1,095 309 1,521
Interest payments (long-term) 120 281 354 449 285 643 Public and publicly guaranteed sector 82 73 91 118 144 231 Public sector 82 73 91 118 144 231 of which: General government 58 37 49 68 95 169 Private sector guaranteed by public sector 0 .. .. .. .. .. Private sector not guaranteed 38 208 262 331 141 412
Summary external debt stock by creditor typeLong-term external debt stocks 6,386 12,920 14,752 15,580 16,473 20,171 Public and publicly guaranteed debt from: 3,269 5,605 6,603 7,545 9,413 11,790 Official creditors 2,934 5,350 6,334 7,264 9,214 11,559 Multilateral 1,101 3,039 3,367 3,893 5,441 7,049 of which: World Bank 368 599 779 910 1,907 2,723 Bilateral 1,833 2,311 2,967 3,370 3,773 4,510 Private creditors 335 255 269 281 199 231 Bondholders .. .. .. .. .. .. Commercial banks and others 335 255 269 281 199 231 Private nonguaranteed debt from: 3,117 7,315 8,149 8,035 7,061 8,381 Bondholders .. .. .. .. .. 300 Commercial banks and others 3,117 7,315 8,149 8,035 7,061 8,081Use of IMF credit 412 364 353 374 365 363
Net financial inflowsNet debt inflows Use of IMF credit .. .. .. .. .. .. Long-term 1,899 1,426 1,893 666 1,926 3,697 Official creditors 241 884 1,034 804 1,977 2,336 Multilateral 149 629 361 460 1,580 1,616 of which: World Bank 0 120 196 101 1,013 820 Bilateral 92 255 673 343 397 720 Private creditors 1,658 541 859 -138 -51 1,361 Bondholders .. .. .. .. .. 300 Banks and others 1,658 541 859 -138 -51 1,061 Short-term 49 176 -71 238 -136 499Net equity inflows Foreign direct investment 842 1,047 1,129 1,914 639 2,122 Portfolio equity .. 1 2 3 13 29
Debt ratiosExternal debt stocks to exports (%) .. 101 123 112 101 109External debt stocks to GNI (%) 20 17 19 28 34 37Debt service to exports (%) .. 9 11 13 6 13Short-term to external debt stocks (%) 3 5 4 5 4 6Multilateral to external debt stocks (%) 16 22 21 23 31 32Reserves to external debt stocks (%) .. 98 90 84 71 59Gross national income (GNI) 34,586 83,271 82,711 60,371 51,900 58,795

146
VANUATU(US$ million, unless otherwise indicated)
2009 2015 2016 2017 2018 2019Summary external debt data by debtor typeTotal external debt stocks 153.3 256.8 293.4 401.4 402.2 414.8 Use of IMF credit 25.5 46.1 44.7 47.4 43.3 37.2 Long-term external debt 98.8 172.0 210.9 287.6 313.8 335.5 Public and publicly guaranteed sector 98.8 172.0 210.9 287.6 313.8 335.5 Public sector 98.8 172.0 210.9 287.6 313.8 335.5 of which: General government 98.3 171.7 210.7 287.4 313.8 335.5 Private sector guaranteed by public sector .. .. .. .. .. .. Private sector not guaranteed .. .. .. .. .. .. Short-term external debt 29.0 38.7 37.8 66.4 45.1 42.1
Disbursements (long-term) 11.7 84.8 53.2 68.7 46.4 36.0 Public and publicly guaranteed sector 11.7 84.8 53.2 68.7 46.4 36.0 Public sector 11.7 84.8 53.2 68.7 46.4 36.0 of which: General government 11.7 84.8 53.2 68.7 46.4 36.0 Private sector guaranteed by public sector .. .. .. .. .. .. Private sector not guaranteed .. .. .. .. .. ..
Principal repayments (long-term) 3.5 5.0 4.9 5.0 12.0 12.5 Public and publicly guaranteed sector 3.5 5.0 4.9 5.0 12.0 12.5 Public sector 3.5 5.0 4.9 5.0 12.0 12.5 of which: General government 3.5 5.0 4.9 5.0 11.8 12.5 Private sector guaranteed by public sector .. .. .. .. .. .. Private sector not guaranteed .. .. .. .. .. ..
Interest payments (long-term) 1.4 1.3 3.2 3.5 4.2 4.0 Public and publicly guaranteed sector 1.4 1.3 3.2 3.5 4.2 4.0 Public sector 1.4 1.3 3.2 3.5 4.2 4.0 of which: General government 1.4 1.3 3.2 3.5 4.2 4.0 Private sector guaranteed by public sector .. .. .. .. .. .. Private sector not guaranteed .. .. .. .. .. ..
Summary external debt stock by creditor typeLong-term external debt stocks 98.8 172.0 210.9 287.6 313.8 335.5 Public and publicly guaranteed debt from: 98.8 172.0 210.9 287.6 313.8 335.5 Official creditors 98.8 172.0 210.9 287.6 313.8 335.5 Multilateral 68.6 47.7 53.7 76.1 101.8 135.0 of which: World Bank 12.4 9.1 12.2 29.1 54.7 83.0 Bilateral 30.2 124.3 157.2 211.5 212.0 200.5 Private creditors .. .. .. .. .. .. Bondholders .. .. .. .. .. .. Commercial banks and others .. .. .. .. .. .. Private nonguaranteed debt from: .. .. .. .. .. .. Bondholders .. .. .. .. .. .. Commercial banks and others .. .. .. .. .. ..Use of IMF credit 25.5 46.1 44.7 47.4 43.3 37.2
Net financial inflowsNet debt inflows Use of IMF credit .. 23.8 0.0 0.0 -3.0 -5.9 Long-term 8.1 79.8 48.3 63.7 34.4 23.6 Official creditors 8.1 79.8 48.3 63.7 34.4 23.6 Multilateral -3.2 1.4 6.1 19.6 27.1 33.5 of which: World Bank -0.6 0.7 3.4 15.8 26.8 28.7 Bilateral 11.3 78.4 42.1 44.0 7.2 -10.0 Private creditors .. .. .. .. .. .. Bondholders .. .. .. .. .. .. Banks and others .. .. .. .. .. .. Short-term -5.0 -42.1 -0.9 28.6 -21.3 -3.1Net equity inflows Foreign direct investment 23.8 16.8 38.7 34.2 34.0 41.0 Portfolio equity 0.0 .. .. .. .. ..
Debt ratiosExternal debt stocks to exports (%) 46.3 72.7 70.8 90.0 71.5 85.3External debt stocks to GNI (%) 25.9 33.7 36.6 46.2 44.0 44.8Debt service to exports (%) 1.7 2.0 2.1 2.3 3.6 4.8Short-term to external debt stocks (%) 18.9 15.1 12.9 16.6 11.2 10.1Multilateral to external debt stocks (%) 44.7 18.6 18.3 19.0 25.3 32.6Reserves to external debt stocks (%) 96.9 104.8 91.1 98.4 104.6 123.3Gross national income (GNI) 591.5 761.8 802.2 869.2 914.6 926.0

147
VENEZUELA, RB(US$ million, unless otherwise indicated)
2009 2015 2016 2017 2018 2019Summary external debt data by debtor typeTotal external debt stocks 94,353 159,007 163,908 164,633 167,797 168,074 Use of IMF credit 3,987 3,524 3,419 3,622 3,537 3,517 Long-term external debt 69,532 114,385 113,431 113,443 113,402 113,390 Public and publicly guaranteed sector 44,973 67,098 66,145 66,157 66,116 66,104 Public sector 44,973 67,098 66,145 66,157 66,116 66,104 of which: General government 35,185 42,540 41,587 41,599 41,558 41,546 Private sector guaranteed by public sector .. .. .. .. .. .. Private sector not guaranteed 24,559 47,286 47,286 47,286 47,286 47,286 Short-term external debt 20,834 41,098 47,058 47,568 50,858 51,167
Disbursements (long-term) 24,099 20,257 79 18 0 0 Public and publicly guaranteed sector 9,981 1,683 79 18 0 0 Public sector 9,981 1,683 79 18 0 0 of which: General government 6,068 1,683 79 18 0 0 Private sector guaranteed by public sector .. .. .. .. .. .. Private sector not guaranteed 14,119 18,574 .. .. .. ..
Principal repayments (long-term) 7,674 17,560 234 108 7 .. Public and publicly guaranteed sector 1,173 3,711 234 108 7 .. Public sector 1,173 3,711 234 108 7 .. of which: General government 805 2,310 234 108 7 .. Private sector guaranteed by public sector .. .. .. .. .. .. Private sector not guaranteed 6,501 13,849 .. .. .. ..
Interest payments (long-term) 4,511 9,117 77 36 10 .. Public and publicly guaranteed sector 2,927 5,913 77 36 10 .. Public sector 2,927 5,913 77 36 10 .. of which: General government 2,440 3,759 77 36 10 .. Private sector guaranteed by public sector .. .. .. .. .. .. Private sector not guaranteed 1,585 3,204 .. .. .. ..
Summary external debt stock by creditor typeLong-term external debt stocks 69,532 114,385 113,431 113,443 113,402 113,390 Public and publicly guaranteed debt from: 44,973 67,098 66,145 66,157 66,116 66,104 Official creditors 4,221 9,214 8,283 8,200 8,194 8,197 Multilateral 3,296 5,295 5,140 5,050 5,044 5,044 of which: World Bank .. .. .. .. .. .. Bilateral 925 3,918 3,143 3,150 3,151 3,153 Private creditors 40,752 57,885 57,862 57,957 57,921 57,907 Bondholders 38,984 56,828 56,828 56,828 56,828 56,828 Commercial banks and others 1,768 1,057 1,034 1,129 1,094 1,080 Private nonguaranteed debt from: 24,559 47,286 47,286 47,286 47,286 47,286 Bondholders 3,972 2,300 2,300 2,300 2,300 2,300 Commercial banks and others 20,587 44,986 44,986 44,986 44,986 44,986Use of IMF credit 3,987 3,524 3,419 3,622 3,537 3,517
Net financial inflowsNet debt inflows Use of IMF credit .. .. .. .. .. .. Long-term 16,425 2,697 -155 -90 -7 0 Official creditors 586 266 -155 -90 -7 0 Multilateral 396 266 -155 -90 -7 0 of which: World Bank .. .. .. .. .. .. Bilateral 190 0 0 0 0 0 Private creditors 15,839 2,431 0 0 0 0 Bondholders 8,905 -2,595 0 0 0 0 Banks and others 6,934 5,026 0 0 0 0 Short-term 560 10,511 600 -458 3,296 0Net equity inflows Foreign direct investment -1,350 -282 446 -68 886 934 Portfolio equity 118 5 .. .. .. ..
Debt ratiosExternal debt stocks to exports (%) 150 400 560 .. .. ..External debt stocks to GNI (%) 29 .. .. .. .. ..Debt service to exports (%) 20 70 4 .. .. ..Short-term to external debt stocks (%) 22 26 29 29 30 30Multilateral to external debt stocks (%) 3 3 3 3 3 3Reserves to external debt stocks (%) 23 4 2 2 .. ..Gross national income (GNI) 327,123 .. .. .. .. ..

148
VIETNAM(US$ million, unless otherwise indicated)
2009 2015 2016 2017 2018 2019Summary external debt data by debtor typeTotal external debt stocks 32,742 77,832 85,665 104,092 106,861 118,490 Use of IMF credit 578 436 423 448 438 435 Long-term external debt 27,381 65,405 72,521 81,746 86,838 93,658 Public and publicly guaranteed sector 27,381 46,366 48,038 51,792 52,121 52,935 Public sector 27,381 46,148 47,842 51,622 51,976 52,815 of which: General government 24,357 32,055 33,256 36,161 36,745 37,783 Private sector guaranteed by public sector .. 218 196 170 145 120 Private sector not guaranteed .. 19,039 24,484 29,954 34,717 40,723 Short-term external debt 4,783 11,991 12,720 21,898 19,585 24,397
Disbursements (long-term) 4,731 12,952 13,111 18,661 20,335 19,835 Public and publicly guaranteed sector 4,731 4,427 4,457 4,270 3,210 3,564 Public sector 4,731 4,427 4,457 4,270 3,210 3,564 of which: General government 3,762 2,771 2,846 2,748 2,147 2,571 Private sector guaranteed by public sector .. 0 0 0 0 0 Private sector not guaranteed .. 8,525 8,654 14,391 17,126 16,271
Principal repayments (long-term) 917 4,929 5,734 11,249 14,708 13,052 Public and publicly guaranteed sector 917 1,884 2,524 2,328 2,581 2,787 Public sector 917 1,874 2,502 2,303 2,556 2,762 of which: General government 689 1,046 1,514 1,272 1,402 1,601 Private sector guaranteed by public sector .. 10 23 25 25 25 Private sector not guaranteed .. 3,045 3,210 8,920 12,127 10,265
Interest payments (long-term) 477 1,538 1,412 2,059 2,720 2,738 Public and publicly guaranteed sector 477 822 879 940 1,016 1,122 Public sector 477 818 874 935 1,011 1,116 of which: General government 409 471 505 527 574 657 Private sector guaranteed by public sector .. 4 5 5 5 6 Private sector not guaranteed .. 717 532 1,119 1,704 1,616
Summary external debt stock by creditor typeLong-term external debt stocks 27,381 65,405 72,521 81,746 86,838 93,658 Public and publicly guaranteed debt from: 27,381 46,366 48,038 51,792 52,121 52,935 Official creditors 23,815 37,587 40,199 44,619 45,741 47,237 Multilateral 10,604 20,174 21,166 23,285 23,723 24,118 of which: World Bank 6,304 12,638 13,110 14,683 14,968 15,327 Bilateral 13,211 17,414 19,033 21,334 22,018 23,118 Private creditors 3,567 8,778 7,839 7,173 6,380 5,698 Bondholders 1,327 1,877 1,521 1,516 1,511 1,506 Commercial banks and others 2,240 6,902 6,318 5,657 4,869 4,192 Private nonguaranteed debt from: .. 19,039 24,484 29,954 34,717 40,723 Bondholders .. 290 235 235 35 1,014 Commercial banks and others .. 18,749 24,248 29,718 34,682 39,709Use of IMF credit 578 436 423 448 438 435
Net financial inflowsNet debt inflows Use of IMF credit -38 .. .. .. .. .. Long-term 3,813 8,023 7,377 7,413 5,627 6,783 Official creditors 3,387 2,783 2,857 2,692 1,397 1,450 Multilateral 2,231 1,800 1,443 1,146 846 505 of which: World Bank 1,157 1,054 830 885 592 443 Bilateral 1,155 984 1,415 1,547 552 945 Private creditors 427 5,240 4,520 4,720 4,230 5,333 Bondholders -39 -23 -411 -5 -205 974 Banks and others 466 5,263 4,931 4,725 4,435 4,359 Short-term 579 -1,613 729 9,178 -2,313 4,812Net equity inflows Foreign direct investment 6,369 8,260 8,820 8,418 13,977 11,980 Portfolio equity 128 134 .. .. .. ..
Debt ratiosExternal debt stocks to exports (%) 51 45 45 45 41 42External debt stocks to GNI (%) 35 42 44 50 47 49Debt service to exports (%) 2 4 4 6 7 6Short-term to external debt stocks (%) 15 15 15 21 18 21Multilateral to external debt stocks (%) 32 26 25 22 22 20Reserves to external debt stocks (%) 50 36 43 47 52 66Gross national income (GNI) 92,614 183,321 196,687 206,917 228,057 242,274

149
YEMEN, REPUBLIC OF(US$ million, unless otherwise indicated)
2009 2015 2016 2017 2018 2019Summary external debt data by debtor typeTotal external debt stocks 6,799 7,299 7,063 7,193 7,037 7,055 Use of IMF credit 417 522 497 508 469 440 Long-term external debt 5,875 6,477 6,322 6,317 6,205 6,188 Public and publicly guaranteed sector 5,875 6,477 6,322 6,317 6,205 6,188 Public sector 5,875 6,477 6,322 6,317 6,205 6,188 of which: General government 5,875 5,477 5,322 5,317 5,205 5,188 Private sector guaranteed by public sector .. .. .. .. .. .. Private sector not guaranteed .. .. .. .. .. .. Short-term external debt 507 300 243 368 362 427
Disbursements (long-term) 332 60 24 4 19 66 Public and publicly guaranteed sector 332 60 24 4 19 66 Public sector 332 60 24 4 19 66 of which: General government 332 60 24 4 19 66 Private sector guaranteed by public sector .. .. .. .. .. .. Private sector not guaranteed .. .. .. .. .. ..
Principal repayments (long-term) 140 282 98 66 71 72 Public and publicly guaranteed sector 140 282 98 66 71 72 Public sector 140 282 98 66 71 72 of which: General government 140 282 98 66 71 72 Private sector guaranteed by public sector .. .. .. .. .. .. Private sector not guaranteed .. .. .. .. .. ..
Interest payments (long-term) 72 74 31 13 13 12 Public and publicly guaranteed sector 72 74 31 13 13 12 Public sector 72 74 31 13 13 12 of which: General government 72 71 28 13 13 12 Private sector guaranteed by public sector .. .. .. .. .. .. Private sector not guaranteed .. .. .. .. .. ..
Summary external debt stock by creditor typeLong-term external debt stocks 5,875 6,477 6,322 6,317 6,205 6,188 Public and publicly guaranteed debt from: 5,875 6,477 6,322 6,317 6,205 6,188 Official creditors 5,871 6,477 6,322 6,317 6,205 6,188 Multilateral 3,159 3,182 3,039 3,110 3,004 2,987 of which: World Bank 2,187 1,780 1,668 1,695 1,586 1,505 Bilateral 2,712 3,295 3,283 3,207 3,201 3,201 Private creditors 5 .. .. .. .. .. Bondholders .. .. .. .. .. .. Commercial banks and others 5 .. .. .. .. .. Private nonguaranteed debt from: .. .. .. .. .. .. Bondholders .. .. .. .. .. .. Commercial banks and others .. .. .. .. .. ..Use of IMF credit 417 522 497 508 469 440
Net financial inflowsNet debt inflows Use of IMF credit -44 0 -10 -18 -27 -26 Long-term 192 -222 -74 -62 -52 -7 Official creditors 193 -222 -74 -62 -52 -7 Multilateral 128 -166 -72 -62 -51 -7 of which: World Bank 59 -51 -64 -66 -71 -72 Bilateral 65 -56 -2 0 0 0 Private creditors -1 .. .. .. .. .. Bondholders .. .. .. .. .. .. Banks and others -1 .. .. .. .. .. Short-term 109 -23 -109 50 -82 36Net equity inflows Foreign direct investment 129 -15 -561 -270 -282 -371 Portfolio equity 0 0 0 .. .. ..
Debt ratiosExternal debt stocks to exports (%) 94 386 738 .. .. ..External debt stocks to GNI (%) 28 20 25 29 26 ..Debt service to exports (%) 4 19 15 .. .. ..Short-term to external debt stocks (%) 7 4 3 5 5 6Multilateral to external debt stocks (%) 46 44 43 43 43 42Reserves to external debt stocks (%) 102 .. .. .. .. ..Gross national income (GNI) 23,958 35,622 28,085 24,561 27,579 ..

150
ZAMBIA(US$ million, unless otherwise indicated)
2009 2015 2016 2017 2018 2019Summary external debt data by debtor typeTotal external debt stocks 3,646 11,779 15,221 17,381 19,005 27,341 Use of IMF credit 1,080 907 813 794 715 667 Long-term external debt 2,120 10,132 13,646 15,686 17,667 25,839 Public and publicly guaranteed sector 1,100 6,487 7,060 8,785 9,920 11,104 Public sector 1,100 6,487 7,060 8,785 9,920 11,104 of which: General government 1,039 6,462 7,039 8,764 9,903 11,091 Private sector guaranteed by public sector .. 0 0 0 0 0 Private sector not guaranteed 1,020 3,645 6,586 6,902 7,748 14,736 Short-term external debt 446 740 762 901 623 835
Disbursements (long-term) 126 3,106 3,768 2,283 2,718 9,935 Public and publicly guaranteed sector 91 1,909 798 1,752 1,487 1,670 Public sector 91 1,909 798 1,752 1,487 1,670 of which: General government 91 1,909 798 1,752 1,487 1,670 Private sector guaranteed by public sector .. 0 0 0 0 .. Private sector not guaranteed 35 1,197 2,970 531 1,231 8,265
Principal repayments (long-term) 122 215 209 366 666 1,742 Public and publicly guaranteed sector 59 96 146 151 282 464 Public sector 59 96 146 151 282 464 of which: General government 48 93 143 148 278 461 Private sector guaranteed by public sector .. 0 0 0 0 0 Private sector not guaranteed 63 118 63 215 385 1,277
Interest payments (long-term) 36 259 448 386 701 778 Public and publicly guaranteed sector 13 189 326 341 445 444 Public sector 13 189 326 341 445 444 of which: General government 12 189 325 341 444 444 Private sector guaranteed by public sector .. .. .. .. .. .. Private sector not guaranteed 24 69 122 45 256 334
Summary external debt stock by creditor typeLong-term external debt stocks 2,120 10,132 13,646 15,686 17,667 25,839 Public and publicly guaranteed debt from: 1,100 6,487 7,060 8,785 9,920 11,104 Official creditors 1,095 3,222 3,763 4,226 4,701 5,701 Multilateral 871 1,295 1,408 1,620 1,822 2,117 of which: World Bank 407 698 760 894 1,003 1,108 Bilateral 224 1,927 2,356 2,606 2,879 3,584 Private creditors 5 3,265 3,297 4,558 5,219 5,403 Bondholders .. 3,000 3,000 3,000 3,000 3,000 Commercial banks and others 5 265 297 1,558 2,219 2,403 Private nonguaranteed debt from: 1,020 3,645 6,586 6,902 7,748 14,736 Bondholders .. .. .. .. .. .. Commercial banks and others 1,020 3,645 6,586 6,902 7,748 14,736Use of IMF credit 1,080 907 813 794 715 667
Net financial inflowsNet debt inflows Use of IMF credit 244 -61 -69 -66 -61 -44 Long-term 4 2,891 3,558 1,917 2,052 8,193 Official creditors 35 547 621 339 542 1,019 Multilateral 42 136 156 132 239 304 of which: World Bank 33 61 86 86 132 112 Bilateral -8 411 465 207 303 715 Private creditors -31 2,344 2,938 1,578 1,509 7,174 Bondholders .. 1,250 0 0 0 0 Banks and others -31 1,094 2,938 1,578 1,509 7,174 Short-term -202 -79 22 81 -225 196Net equity inflows Foreign direct investment 472 309 267 547 -502 -466 Portfolio equity -13 0 3 -3 -5 1
Debt ratiosExternal debt stocks to exports (%) 74 143 203 190 190 330External debt stocks to GNI (%) 24 57 75 70 71 120Debt service to exports (%) 3 7 10 9 14 31Short-term to external debt stocks (%) 12 6 5 5 3 3Multilateral to external debt stocks (%) 24 11 9 9 10 8Reserves to external debt stocks (%) 52 25 15 12 8 5Gross national income (GNI) 14,910 20,831 20,308 24,723 26,598 22,767

151
ZIMBABWE(US$ million, unless otherwise indicated)
2009 2015 2016 2017 2018 2019Summary external debt data by debtor typeTotal external debt stocks 6,163 9,679 11,496 12,540 12,646 12,270 Use of IMF credit 542 464 455 482 471 468 Long-term external debt 3,974 6,129 7,888 8,323 8,786 8,275 Public and publicly guaranteed sector 3,876 4,207 4,248 4,341 4,308 4,386 Public sector 3,876 4,207 4,248 4,341 4,308 4,386 of which: General government 3,198 3,509 3,629 3,736 3,766 3,856 Private sector guaranteed by public sector .. .. .. .. .. .. Private sector not guaranteed 98 1,922 3,640 3,983 4,478 3,889 Short-term external debt 1,646 3,086 3,153 3,735 3,389 3,527
Disbursements (long-term) 125 1,443 1,132 815 980 972 Public and publicly guaranteed sector 59 502 245 153 280 91 Public sector 59 502 245 153 280 91 of which: General government 13 297 245 153 280 91 Private sector guaranteed by public sector .. .. .. .. .. .. Private sector not guaranteed 66 941 887 662 700 881
Principal repayments (long-term) 66 426 988 384 281 1,214 Public and publicly guaranteed sector 0 116 108 111 76 52 Public sector 0 116 108 111 76 52 of which: General government 0 69 41 61 26 42 Private sector guaranteed by public sector .. .. .. .. .. .. Private sector not guaranteed 66 310 880 273 205 1,163
Interest payments (long-term) 30 202 121 267 254 313 Public and publicly guaranteed sector 14 38 44 27 14 13 Public sector 14 38 44 27 14 13 of which: General government 14 24 23 24 13 13 Private sector guaranteed by public sector .. .. .. .. .. .. Private sector not guaranteed 16 164 78 240 240 301
Summary external debt stock by creditor typeLong-term external debt stocks 3,974 6,129 7,888 8,323 8,786 8,275 Public and publicly guaranteed debt from: 3,876 4,207 4,248 4,341 4,308 4,386 Official creditors 3,409 3,796 3,828 3,899 3,883 3,967 Multilateral 1,646 1,659 1,575 1,434 1,232 1,226 of which: World Bank 985 912 885 907 896 890 Bilateral 1,764 2,137 2,253 2,466 2,651 2,741 Private creditors 467 411 419 441 425 419 Bondholders 0 0 0 0 0 0 Commercial banks and others 467 411 419 441 425 419 Private nonguaranteed debt from: 98 1,922 3,640 3,983 4,478 3,889 Bondholders .. .. .. .. .. .. Commercial banks and others 98 1,922 3,640 3,983 4,478 3,889Use of IMF credit 542 464 455 482 471 468
Net financial inflowsNet debt inflows Use of IMF credit 0 -2 -87 .. .. .. Long-term 59 1,017 144 431 699 -243 Official creditors 58 382 101 53 204 45 Multilateral 0 153 -69 -60 -41 0 of which: World Bank 0 -7 -13 -5 0 -3 Bilateral 58 228 170 113 245 44 Private creditors 0 635 43 378 496 -287 Bondholders 0 0 0 0 .. 0 Banks and others 0 635 43 378 496 -287 Short-term -312 367 30 450 -416 63Net equity inflows Foreign direct investment 105 399 343 247 745 280 Portfolio equity 67 123 -80 -101 .. ..
Debt ratiosExternal debt stocks to exports (%) 308 232 269 254 262 ..External debt stocks to GNI (%) 73 54 61 62 56 62Debt service to exports (%) 6 16 29 14 13 ..Short-term to external debt stocks (%) 27 32 27 30 27 29Multilateral to external debt stocks (%) 27 17 14 11 10 10Reserves to external debt stocks (%) 13 4 4 2 1 1Gross national income (GNI) 8,401 17,981 18,773 20,080 22,707 19,836


153
AppendixAbout the Data


155
International Debt Statistics 2021 focuses on financial flows, trends in external debt, and
other major financial indicators for low- and middle-income countries. This edition of International Debt Statistics (IDS) has been reconfigured to offer a more condensed presenta-tion of the principal indicators. The longer ver-sion of the report will be found in the online tables.
TablesAggregate TablesThe aggregate tables are labeled by region name. Data are shown for all low- and middle-income countries and six regional groups (East Asia and Pacific, Europe and Central Asia, Latin America and the Caribbean, Middle East and North Africa, South Asia, and Sub-Saharan Africa).
Country TablesCountry tables are labeled by country name and ordered alphabetically. Data are shown for 120 low- and middle-income countries that report public and publicly guaranteed external debt to the World Bank’s Debtor Reporting System (DRS). The tables also include key debt ratios and the composition of external debt stocks and flows for each country.
Each table shows a time series with the most recent five years, as well as 2009 as a comparison year. Full time series data are available for all countries in the World Bank’s Open Data web-site (https://datacatalog.worldbank.org/dataset/international-debt-statistics).
StatisticsThe general cutoff date for countries to report data for this publication was end-August 2020. The economic aggregates presented in the tables are prepared for the convenience of users. Although debt ratios can give useful information about developments in a debt-servicing capacity, conclu-sions drawn from them will not be valid unless accompanied by careful economic evaluation.
The macroeconomic data provided are collected from national statistical organizations, which in some cases may be subject to a considerable margin of error. The usual care must be taken in interpreting the ratios, particularly for the most recent years, because figures may be preliminary and subject to revision.
Specific country notes describing the sources of information that are not provided by the coun-try are summarized in the “Data Documentation” section. Unless otherwise specified, data on long-term public and publicly guaranteed external debt for 2019 are based on reports provided by the country.
More detailed information on data sources, methodology, and compilation is provided in the appendix at the back of this book.
Aggregate Measures for Income Groups and RegionsAggregate measures for income groups and regions include the 120 low- and middle-income countries that report public and publicly guaranteed external debt to the World Bank’s DRS, whenever data are available. The aggregate “All low- and middle-income countries” is the sum of data for 120 countries.
User Guide to Tables
I N T E R N A T I O N A L D E B T S T A T I S T I C S 2 0 2 1
156
Classification of CountriesFor operational and analytical purposes, the World Bank’s main criterion for classifying coun-tries is gross national income (GNI) per capita (calculated by the World Bank Atlas method).Every country is classified as low-income, middle-income, or high-income. Low- and middle-income countries are sometimes referred to as develop-ing countries. The term is used for convenience; it is not intended to imply that all countries in the group are experiencing similar development or that other countries have reached a preferred or final stage of development. Because GNI per capita changes over time, the country composition of income groups may change from one edition of International Debt Statistics to the next. Once
the classification is fixed for an edition, based on GNI per capita in the most recent year for which data are available, all historical data presented are based on the same country grouping.
Symbols0 or 0.0 means zero or small enough that the
number would round to zero at the displayed number of decimal places.
.. means that data are not available or that aggre-gates cannot be calculated because of missing data in the years shown.
$ indicates current U.S. dollars unless otherwise specified.

157
The country tables that were previously available in the International Debt Statistics print edition is now available online. Using an automated query process, these reference tables will be updated based
on the revisions to the International Debt Statistics database.Users can access all the online tables, download the PDF version of the publication, and view the
report as an eBook on ISSUU, as well as access the database and download the archived editions of the publication by going to http://data.worldbank.org/products/ids.
How to Access IDS Online Country TablesTo access the IDS online tables, visit http://datatopics.worldbank.org/debt/ids and select from “Country,” “Region,” “Topic,” or “DSSI” options. Click on “Analytical” to view the table with a select number of indicators as reported in the IDS publication, or “Standard” to view the tables with the full list of indica-tors available in the database. To access the DSSI debt service payments due table, select from “DSSI” and click on “Monthly presentation” for monthly projections or “Annual presentation” for yearly projections.
User Guide to IDS Online Tables and Database

I N T E R N A T I O N A L D E B T S T A T I S T I C S 2 0 2 1
158
To access a specific country table directly without going through the above landing page, use the URL http://datatopics.worldbank.org/debt/ids/ and the country code (for example, http:// datatopics . worldbank .org/debt/ids/country/DZA to view the table for Algeria). Similarly, to view the regional table, click on the “Region” tab and select one of the listed regions (for example http://datatopics . worldbank.org/debt/ids /region/SAS to view the table for South Asia).

U s e r G U i d e t o i d s o n l i n e t a b l e s a n d d a t a b a s e
159
2. OTHER NON-DEBT RESOURCE FLOWS
Foreign direct investment (net equity inflows) BX.KLT.DINV.CD.WD
Portfolio equity flows BX.PEF.TOTL.CD.WD
5. MAJOR ECONOMIC AGGREGATES
Gross national income (GNI) NY.GNP.MKTP.CD
Exports of goods, services, and primary income BX.GSR.TOTL.CD
Personal transfers and compensation of employees BX.TRF.PWKR.CD.DT
Imports of goods, services, and primary income BM.GSR.TOTL.CD
Primary income on FDI (payments) BX.KLT.DREM.CD.DT
International reserves FI.RES.TOTL.CD
6. RATIOS
External debt stocks to exports (%) DT.DOD.DECT.EX.ZS
External debt stocks to GNI (%) DT.DOD.DECT.GN.ZS
Debt service to exports (%) DOD.DECT.GN.ZS
Short-term to external debt stocks (%) DT.DOD.DSTC.ZS
Multilateral to external debt stocks (%) DT.DOD.MLAT.ZS
Reserves to external debt stocks (%) FI.RES.TOTL.DT.ZS
Current account balance BN.CAB.XOKA.CD
Reserves to imports (months) FI.RES.TOTL.MO
3. CURRENCY COMPOSITION OF PUBLIC AND PUBLICLY GUARANTEED DEBT (%)
Euro DT.CUR.EURO.ZS
Japanese yen DT.CUR.JYEN.ZS
Pound sterling DT.CUR.UKPS.ZS
Swiss franc DT.CUR.SWFR.ZS
U.S. dollars DT.CUR.USDL.ZS
4. AVERAGE TERMS OF NEW COMMITMENTS
Official creditors
Interest (%) DT.INR.OFFT
Maturity (years) DT.MAT.OFFT
Grace period (years) DT.GPA.OFFT
Private creditors
Interest (%) DT.INR.PRVT
Maturity (years) DT.MAT.PRVT
Grace period (years) DT.GPA.PRVT
1. SUMMARY EXTERNAL DEBT DATA
External debt stocks DT.DOD.DECT.CD External debt flows
Long-term external debt DT.DOD.DLXF.CD Disbursements DT.DIS.DLTF.CD
Public and publicly guaranteed DT.DOD.DPPG.CD Long-term external debt DT.DIS.DLXF.CD
Private nonguaranteed DT.DOD.DPNG.CD IMF purchases DT.DIS.DIMF.CD
Use of IMF credit DT.DOD.DIMF.CD Principal repayments DT.AMT.DLTF.CD
Short-term debt DT.DOD.DSTC.CD Long-term external debt DT.AMT.DLXF.CD
interest arrears on long-term DT.IXA.DPPG.CD IMF repurchases DT.AMT.DIMF.CD
Net flows DT.NFL.DECT.CD
Long-term external debt DT.NFL.DLXF.CD
Memorandum items Short-term external debt DT.NFL.DSTC.CD
Principal arrears on long-term DT.AXA.DPPG.CD Interest payments (INT) DT.INT.DECT.CD
Long-term public sector debt DT.DOD.DPPG.CD Long-term external debt DT.INT.DLXF.CD
Long-term private sector debt DT.DOD.PRVS.CD IMF charges DT.INT.DIMF.CD
Public & publicly guaranteed commitments DT.COM.DPPG.CD Short-term external debt DT.INT.DSTC.CD
IndicatorsThe main indicator codes for each of the indicators online and in the publication are listed below. To view a specific indicator online, go to http://data.worldbank.org/indicator/ and add the indicator code at the end of the url; for example, to view a page for total debt stocks, this line should be in your browser: http://data.worldbank.org/indicator/DT.DOD.DECT.CD.

I N T E R N A T I O N A L D E B T S T A T I S T I C S 2 0 2 1
160
8. DEBT STOCK-FLOW RECONCILATION
Total change in external debt stocks DT.DOD.DECT.CD.CG
Net flows on external debt DT.NFL.DECT.CD
9. DEBT STOCK-FLOW RECONCILATION
Total amount rescheduled DT.DXR.DPPG.CD
Total amount forgiven DT.DFR.DPPG.CD
Debt buyback DT.DSB.DPPG.CD
10. CONTRACTUAL OBLIGATIONS ON OUTSTANDING LONG-TERM EXTERNAL DEBT
Official creditors
Principal DT.AMT.OFFT.CD
Interest DT.INT.OFFT.CD
Private creditors
Principal DT.AMT.PRVT.CD
Interest DT.INT.PRVT.CD
7. LONG-TERM EXTERNAL DEBT
Debt outstanding and disbursed DT.DOD.DLXF.CD Interest payments DT.INT.DLXF.CD
Public and publicly guaranteed DT.DOD.DPPG.CD Public and publicly guaranteed DT.INT.DPPG.CD
Official creditors DT.DOD.OFFT.CD Official creditors DT.INT.OFFT.CD
Multilateral DT.DOD.MLAT.CD Multilateral DT.INT.MLAT.CD
of which: IBRD DT.DOD.MIBR.CD of which: IBRD DT.INT.MIBR.CD
IDA DT.DOD.MIDA.CD IDA DT.INT.MIDA.CD
Bilateral DT.DOD.BLAT.CD Bilateral DT.INT.BLAT.CD
Private creditors DT.DOD.PRVT.CD Private creditors DT.INT.PRVT.CD
of which: Bonds DT.DOD.PBND.CD of which: Bonds DT.INT.PBND.CD
Commercial banks DT.DOD.PCBK.CD Commercial banks DT.INT.PCBK.CD
Private nonguaranteed DT.DOD.DPNG.CD Private nonguaranteed DT.INT.DPNG.CD
of which: Bonds DT.DOD.PNGB.CD of which: Bonds DT.INT.PNGB.CD
Disbursements DT.DIS.DLXF.CD Principal repayments DT.AMT.DLXF.CD
Public and publicly guaranteed DT.DIS.DPPG.CD Public and publicly guaranteed DT.AMT.DPPG.CD
Official creditors DT.DIS.OFFT.CD Official creditors DT.AMT.OFFT.CD
Multilateral DT.DIS.MLAT.CD Multilateral DT.AMT.MLAT.CD
of which: IBRD DT.DIS.MIBR.CD of which: IBRD DT.AMT.MIBR.CD
IDA DT.DIS.MIDA.CD IDA DT.AMT.MIDA.CD
Bilateral DT.DIS.BLAT.CD Bilateral DT.AMT.BLAT.CD
Private creditors DT.DIS.PRVT.CD Private creditors DT.AMT.PRVT.CD
of which: Bonds DT.DIS.PBND.CD of which: Bonds DT.AMT.PBND.CD
Commercial banks DT.DIS.PCBK.CD Commercial banks DT.AMT.PCBK.CD
Private nonguaranteed DT.DIS.DPNG.CD Private nonguaranteed DT.AMT.DPNG.CD
of which: Bonds DT.DIS.PNGB.CD of which: Bonds DT.AMT.PNGB.CD

U s e r G U i d e t o i d s o n l i n e t a b l e s a n d d a t a b a s e
161
How to Access the DatabaseDataBank (http://databank.worldbank.org) is an online web resource that provides simple and quick access to collections of time series data. It has advanced functions for selecting and displaying data, per-forming customized queries, downloading data, and creating charts and maps. Users can create dynamic, custom reports based on their selection of countries, indicators, and years. All these reports can be easily edited, shared, and embedded as widgets on websites or blogs. For more information, see http:// databank .worldbank.org/help.
Actions Click to share the table using either the embed code or the URL
Click to edit and revise the table in DataBank
Click to export all metadata to Excel
Click to export the table to Excel
Click to export the table and corresponding indicator metadata to PDF
Click to print the table and corresponding indicator metadata
Click to access the IDS Online Tables Help file


163
Data Sources and Methodology
Data SourcesDebtor reporting system
The principal sources of information for the tables in International Debt Statistics 2021
are reports to the World Bank through the World Bank’s Debtor Reporting System (DRS) from mem-ber countries that have received either International Bank for Reconstruction and Development (IBRD) loans or International Development Association (IDA) credits. The DRS has its origin in the World Bank’s need to monitor and assess the financial position of its borrowers. Since 1951, borrow-ers have been required to provide statistics on their public external debt and private sector debt that benefit from a public guarantee. Reporting countries submit reports on the annual status, transactions, and terms of the long-term external debt of public agencies and that of private ones guaranteed by a public agency in the debtor coun-try. The DRS maintains these records on a loan-by-loan basis. In 1973, coverage of the DRS was expanded to include private sector nonguaranteed borrowing, but for this category of debt, data are provided by borrowers in aggregate rather than loan by loan.
Data submitted to the DRS are processed in the World Bank External Debt (WBXD) sys-tem, along with additional information received from the African Development Bank, the Asian Development Bank, the Inter-American Development Bank (IDB), the International Monetary Fund (IMF), institutions of the World Bank Group (IBRD and IDA), and the European Bank for Reconstruction and Development (EBRD). The WBXD is an internal system of the World Bank. Among its outputs is the International Debt Statistics (IDS) database, from
which the tables in this publication and online database are produced.
Data on exports and imports (on a balance of payments basis), international reserves, current account balances, foreign direct investment (FDI) on equity, portfolio equity flows, and primary income of FDI are drawn mainly from the IMF, supple-mented by United Nations Conference on Trade and Development (UNCTAD) reports and country data. Balance of payments data are presented according to the sixth edition of the IMF’s Balance of Payments Manual (BPM6). Official aid flows come from data collected and published by the Development Assistance Committee (DAC) of the Organisation for Economic Co-operation and Development (OECD). Short-term external debt data are as reported by debtor countries or are estimates based on the Bank for International Settlements (BIS) quar-terly series of commercial banks’ claims on low- and middle-income countries. For some countries, esti-mates were prepared by pooling creditor and debtor information. Data on the gross national income of most low- and middle-income countries are collected from national statistical organizations or central banks by visiting and resident World Bank missions.
Every effort has been made to ensure the accu-racy and completeness of the external debt statistics. Coverage has been improved through the efforts of the reporting agencies and close collaboration between the Bank and our partners, Commonwealth Secretariat (COMSEC) and UNCTAD, which pro-vide debt recording and reporting systems across the globe, as well as through the work of the World Bank missions, which visit member countries to gather data and to provide technical assistance on debt issues. Nevertheless, quality and coverage vary among debtors and may also vary for the same

I N T E R N A T I O N A L D E B T S T A T I S T I C S 2 0 2 1
164
debtor from year to year. Data on long-term exter-nal debt reported by member countries are checked against, and supplemented by, data from several other sources. Among these sources are the state-ments and reports of several regional development banks, government lending agencies, and official government websites.
MethodologyAggregationsTotal debt stock and other aggregate measures are derived from the summation of loan-level data on stocks and flows after conversion to a common cur-rency. Other tabulations are compiled using terms and conditions reported in the loan-level data, such as currency composition, cancellations, rescheduling of other liabilities into long-term public and publicly guaranteed external debt, and debt buybacks.
Aggregates for regional and income groups are based on the World Bank’s operational classifica-tions, which may differ from common geographic usage or income groups used by other organiza-tions. Country classifications of DRS reporting countries in 2019 are shown in the country groups section. The same classification is used for all his-torical data shown in International Debt Statistics and the online tables and online database.
Currency conversionData on external obligations are normally reported to the World Bank in the currency of repayment and are converted into a common currency (U.S. dollars) using official exchange rates published by the IMF.
Commitments, disbursements, and debt ser-vice payments (flows) are converted to U.S. dollars at the annual average exchange rate for the year. Debt outstanding (disbursed and undisbursed) at the end of a given year (stock) is converted at the exchange rate in effect at the end of the relevant year. Consequently, year-to-year changes in debt outstanding and disbursed may not be equal to net flows (disbursements less principal repayments); similarly, changes in debt outstanding (including undisbursed debt) may not equal commitments less repayments. Discrepancies will be particu-larly significant when exchange rates have moved sharply during the year. Projected debt service is converted to U.S. dollars at rates in effect at the end of December 2019.
Beginning with 1991, all ruble debt owed to the former Soviet Union has been converted at a rate of US$1 = 0.6 ruble, except in cases where a bilateral agreement specifying a different conver-sion rate is in place. Adoption of this methodology does not constitute an endorsement by the World Bank staff of the appropriateness or validity of the exchange rate used. That matter must be resolved bilaterally between the Russian Federation and its debtor countries.
Starting with the 1988–89 edition of World Debt Tables (a predecessor of IDS), all data per-taining to IBRD loans from 1985 onward are recorded at their current market value. Starting with the 1991–92 edition, all data pertaining to Asian Development Bank loans from 1989 onward are recorded at their current market value. Starting with the 1998 edition, all data pertaining to African Development Bank and African Development Fund loans from 1997 onward are recorded at their current market value.
Debt stock and flow reconciliationBecause of currency conversions and the timing of transactions, there may be differences between the change in aggregate stocks from one period to the next and flows during the relevant period; changes in debt outstanding, including undisbursed amounts, will therefore differ from commitments less repayments.
Changes in the stock of debt from one period to the next can be attributed to five factors: the net flow of debt, the net change in interest arrears, the capitalization of interest, a reduction in debt resulting from debt forgiveness or other debt reduction mechanisms, and cross-currency valua-tion effects. Any residual difference in the change in stock not explained by one of those five factors may indicate inconsistencies in the reported data or specific phenomena prevailing in an individual country (for example, an incomplete historical series for all categories of debt). Starting in 1989, the IDS includes the debt stock reconciliation, but not all components are shown in the IDS print edi-tion and online tables.
External debt restructuringStarting in 1985, the WBXD includes information on the restructuring of debt by official creditors in the context of the Paris Club, restructuring

d a t a s o U r c e s a n d M e t h o d o l o G y
165
by commercial creditors, debt swap operations, buybacks, and bond exchanges. It attempts to capture accurately the effect of debt restructuring on both external debt stocks and external debt flows, consistent with the terms on which the restructuring takes place. In the compilation and presentation of external debt data, a distinction is made between cash flows and imputed flows. According to this criterion, restructured service payments and the shift in liabilities from one financial instrument to another as a result of debt restructuring are considered to be imputed flows. Both cash flows and imputed flows are recorded separately in WBXD.
The imputed flows and stock changes associ-ated with debt restructuring are included in the IDS tables and online database to complement the cash-basis transactions recorded in the main body of the data. Such data encompass information on the debt stock and debt flows restructured each year, the amount of principal forgiven (interest forgiven is shown as a memorandum item), and the amount of external debt stock reduced either by forgiveness or by a debt buyback operation. Changes in creditors and debtors that result from debt restructuring are also reflected. For example, when insured commercial credits are rescheduled, the creditor classification shifts from private to official (bilateral), reflecting the assumption of the assets by the official credit insurance agencies in the creditor country. The IDS data will show a reduction in the external debt owed to the original private creditors equal or similar to the amount of debt restructured and a corresponding increase in the debt owed to the new official creditor. Similarly on the debtor side, when a government accepts responsibility for the payment of restruc-tured debt previously owed by a private enterprise, the relevant change in the debtor category will be reflected. Likewise, if short-term external debt is restructured into a long-term obligation, the stock of short-term external debt will decline and the stock of long-term external debt will rise by the amount of short-term debt restructured. In the event of a debt swap of long-term external debt (external debt to equity, external debt for nature, or external debt for development), the face value of the external debt swapped will be recorded as a decline in long-term external debt stock, but no flow transaction (principal repayment) will be recorded.
Projections of future disbursements and debt service paymentsThe WBXD system projects future disbursements and future debt service payments on the assump-tion that every existing loan commitment will be fully used and repaid in full.
Future disbursementsDisbursement projections are made using one of the following methods:
• Specific schedules. Debtor countries are requested to submit a schedule of future dis-bursements, if available, at the time each new loan is first reported.
• Standard schedules. In the absence of specific schedules, the WBXD system projects the future disbursement schedule according to the undisbursed balance of each loan at the end of the most recent reporting period.
These projected schedules are based on profiles derived from the disbursement pattern of compa-rable loans that fully disbursed. Thirty different profiles have been compiled corresponding to each category of creditor and, in the case of official creditors, for concessional and nonconcessional loans. Each profile is derived by applying regres-sion analysis techniques to a body of data on actual disbursements for each fully disbursed loan in the WBXD database. The profiles are periodically updated to take into account the evolving pattern of disbursements observed for fully disbursed loans.
Future principal payments are generated by the WBXD system according to the repayment terms of each loan. Principal repayments (amor-tization) are based on the amount of the loan commitment. If the amortization schedule fol-lows a set pattern (for example, equal semiannual payments), the WBXD system calculates repay-ments automatically using the loan commitment amount, the first and final payment dates, and the frequency of the payments. If future payments are irregular, the WBXD system requires a schedule.
Future interest payments are generated by the WBXD system according to the disbursed and outstanding balance of the loan at the beginning of the period. Using the interest rate specified in the loan contract, the first and final interest payment dates, and the frequency of payments, the WBXD system calculates the stream of future interest

I N T E R N A T I O N A L D E B T S T A T I S T I C S 2 0 2 1
166
payments due. If interest payments are irregular, the WBXD system requires a schedule.
Future debt service payments are the sum of future principal and interest payments due on existing commitments, including the undisbursed portion. They do not include debt service pay-ments that may become due as a result of new loans contracted in subsequent years, nor do they take into account the effect of any change to future debt service obligations resulting from actions such as prepayment or rescheduling or from cancellations that occurred after the most recent year-end data reported to the DRS.
Both projected disbursements and future debt service payments are converted into U.S. dollars using end-December 2019 exchange rates. Likewise, future interest payments on loans with a variable interest rate (for example, loans from commercial banks tied to the London Interbank Offered Rate [LIBOR]) are based on the interest rate prevailing at end-December 2019.
Treatment of arrearsThe DRS collects information on arrears of both principal and interest. Principal in arrears is included in the amount of long-term external debt outstanding and is shown separately. Interest in arrears on long-term external debt and interest in arrears on the use of IMF credit are included as part of short-term external debt outstanding and are shown separately. Clearance of interest in arrears by repayment will be recorded as an inter-est payment in the relevant creditor category of the loan (or loans) on which the arrears were incurred, as a corresponding reduction in the level of short-term debt outstanding, and as a net reduction in interest arrears. Clearance of interest arrears through debt restructuring or forgiveness will be recorded as a reduction in the level of short-term debt outstanding and a net reduction in interest arrears. When interests are rescheduled, they will be capitalized: This change will be recorded as an increase in long-term debt outstanding equal to the amount of interest capitalized and the reduction in short-term debt outstanding noted previously.
External Debt and Its Components
This section describes the compilation of the major components of external debt included
in the IDS tables and database and the relationship between them, as shown in figure A.1. Information about general methods of compiling external debt data is discussed in the previous section titled “Methodology.” For concise definitions, see the glossary.
Total external debtTotal external debt shown in the IDS is the sum of long-term external debt, short-term debt, and IMF credit. It represents the total debt owed to nonresi-dent creditors and is repayable in both foreign and domestic currency.
Short-term debtShort-term debt is defined as external debt with an original maturity of one year or less. The DRS requires debtor countries to report only on their long-term external debt. However, to gain a com-prehensive picture of total external obligations, the World Bank encourages debtor countries to voluntarily provide information on their short-term external obligations.
By its nature, short-term external debt is dif-ficult to monitor: Loan-by-loan registration is normally impractical, and monitoring systems typically rely on information requested periodi-cally by the central bank from the banking sector. The World Bank regards the debtor country as the authoritative source of information on its short-term debt. Unless otherwise specified in the coun-try tables, the data for short-term debt are derived from the data provided by the quarterly external debt statistics database (see QEDS). BIS data on international bank lending is the second source of the short-term debt. These data are reported on the basis of residual maturity, but an estimate of short-term external liabilities by original matu-rity can be derived by deducting from claims due in one year those that, 12 months earlier, had a maturity of between one and two years. However, not all commercial banks report to the BIS in a way that allows the full maturity distribution to be determined, and the BIS data include liabili-ties only to banks within the BIS reporting area. Consequently, the results should be interpreted with caution.
The flow of short-term debt may be derived from the change in claims (stock) data in the BIS quarterly series over consecutive periods, but valu-ation adjustments resulting from exchange rate

D a t a S o u r c e S a n D M e t h o D o l o g y
167
movements will affect the calculations, as will prepayment and refinancing of long-term maturi-ties falling due. When short-term external debt has been rescheduled, lags in reporting and differ-ences in the treatment of the rescheduled external debt by debtors and creditors may result in double counting.
Interest in arrears on long-term external debt and interest in arrears on the use of IMF credit are added to short-term debt and are separately identified.
Use of IMF creditData related to the operations of the IMF are pro-vided by the IMF Treasurer’s Department. They are converted from special drawing rights (SDR) into dollars using end-of-period exchange rates
for stocks and average-over-the-period exchange rates for flows. IMF trust fund operations under the Enhanced Structural Adjustment Facility, Extended Fund Facility, Poverty Reduction and Growth Facility, and Structural Adjustment Facil-ity (Enhanced Structural Adjustment Facility in 1999) are presented together with all of the IMF’s special facilities (buffer stock, supplemental reserve, compensatory and contingency facilities, oil facili-ties, and other facilities). SDR allocations are also included in this category. According to the BPM6, SDR allocations are recorded as the incurrence of a debt liability of the member receiving them (because of a requirement to repay the allocation in certain circumstances, and also because interest accrues). This debt item was introduced for the first time in IDS 2013 with historical data starting in 1999.
Figure A.1. External Debt and Its Components
TotaI external debt(EDT)
Long-term debt(LDOD)
by debtor
Short-term debt
Privatenonguaranteed debt
by creditor
by creditor
Other public sectorGeneral government
Public sectorPrivate sector guaranteed
by public sector
Public and publiclyguaranteed debt
Use of IMF credits
BondholdersCommercial banksand other creditors
Official creditors Private creditors
Bondholders Commercial banks Other creditorsMultilateral Bilateral

I N T E R N A T I O N A L D E B T S T A T I S T I C S 2 0 2 1
168
Long-term debtLong-term debt has an original maturity of more than one year. It comprises the obligations of both public and private debtors. Private nonguaranteed debt comprises the external obligations of private debtors that are not guaranteed for repayment by a public entity in the debtor country.
Public and publicly guaranteed debt com-prises the external obligations of public debtors and has two components: (a) public debt, which is borrowing by the national government or agency, by a political subdivision or agency, or by autono-mous public bodies, and (b) publicly guaranteed debt, which is borrowing by a private agency that is guaranteed for repayment by a public entity.
Private nonguaranteed debtThe DRS reporting requirements were expanded in 1973 to include long-term private nonguar-anteed debt. Data are reported annually on an aggregate basis and include, for the reporting year, the total amount of disbursed and outstanding debt; the amount of disbursements, principal repayments, and interest payments; the principal and interest rescheduled; and the projected prin-cipal and interest payments for future years. The aggregate data are usually reported in U.S. dollars, and no information on the underlying currency composition is given.
DRS reporting countries recognize the importance of monitoring borrowing by their private sector, particularly when it constitutes a significant portion of total external debt, but many countries acknowledge the difficulty of this process. Detailed data are available only when countries have registration requirements for pri-vate nonguaranteed debt in place, most commonly in connection with exchange controls. When for-mal registration of private nonguaranteed debt is not mandatory, compilers must rely on balance of payments data and financial surveys.
The data on private nonguaranteed debt in this publication is as reported or as estimated for coun-tries where this type of external debt is known to be significant. The estimation of private nonguaranteed debt is based on the national data on quarterly exter-nal debt statistics (QEDS) or IMF data. Flows are derived from the change in stock over consecutive periods and are adjusted for the effects of exchange rate movements (assuming the currency composition mirrors that of public and publicly guaranteed debt)
and for any known debt restructuring. Principal repayments are estimated on the basis of the average maturity observed for loans to private sector bor-rowers in countries reporting to the DRS and on the basis of the stock of debt outstanding. Interest pay-ments are estimated on the basis of the stock of debt outstanding and interest rates prevailing in interna-tional capital markets.
Balance of payments data provide a useful guideline in the estimation process: private non-guaranteed external debt may be derived as a residual between net long-term external borrow-ing recorded in the balance of payments and net long-term public and publicly guaranteed external debt reported to the DRS.
Public and publicly guaranteed debtData related to public and publicly guaranteed debt are reported to the DRS on a loan-by-loan basis. The data provide annual information on the dis-bursed and outstanding balance and the undisbursed balance of each loan, the cumulative disbursements, the principal and interest paid and principal and interest restructured in the reporting year, and the stock of any outstanding payment’s arrears of prin-cipal and interest. Detailed information on the terms and conditions of each loan is also reported. Public debt and private debt publicly guaranteed are shown separately in this publication. Public sector debt is disaggregated by government and “other public” and further disaggregated by creditor type.
Official creditorsOfficial creditors include multilateral and bilateral lenders. In general, official creditors provide loans (and, in some cases, provide grants) to public bod-ies, although in some cases they may lend to other entities with a public guarantee.
Multilateral creditors are international financial institutions such as the World Bank, regional devel-opment banks, and other multilateral and intergov-ernmental agencies whose lending is administered on a multilateral basis. Funds administered by an international financial organization on behalf of a single donor government constitute bilateral loans (or grants). For lending by a number of multilateral creditors, the data presented in this publication are taken from the creditors’ records. Such creditors include the African Development Bank, the Asian Development Bank, the IDB, IBRD, and IDA. (IBRD and IDA are institutions of the World Bank.)

d a t a s o U r c e s a n d M e t h o d o l o G y
169
Bilateral creditors are governments and their agencies, including central banks, aid agencies, offi-cial export credit agencies, and autonomous agencies such as the U.S. Department of Agriculture or the Federal Home Loan Bank. Member countries of the OECD Development Assistance Committee (DAC) and some other countries also report information on loans extended bilaterally or officially guaranteed to the Creditor Reporting System of the OECD.
Private creditorsPrivate creditors include commercial banks, bondholders, and other private creditors. This line includes only publicly guaranteed creditors.
Nonguaranteed private creditors are shown separately.
Bonds include publicly issued or privately placed bonds.
Commercial bank loans are loans from pri-vate banks and other private financial institutions.
Credits of other private creditors include credits from manufacturers, exporters, and other suppliers of goods, plus bank credits covered by a guarantee of an export credit agency. This line is included in the online database but is not shown in the published tables. It can be obtained as the dif-ference between (a) credits of total private credi-tors and (b) bonds and commercial bank loans.
Data DocumentationCountry Specific Notes on Debt
Country Country Notes
Afghanistan Short-term debt before 2015 is based on data from the BIS. Data include the effects of Paris Club debt restructuring agreements signed in 2010 and HIPC and MDRI debt relief.
Angola Long-term private nonguaranteed debt data are estimates based on Central Bank data and are not available before 2009. Short-term debt before 2012 is based on data from the BIS.
Argentina Long-term private nonguaranteed debt data before 2008 are World Bank staff estimates. Short-term debt before 2010 is based on data from the BIS.
Azerbaijan Long-term private nonguaranteed debt data are World Bank staff estimates based on the market data. Short-term debt is based on data from the BIS.
Bangladesh Short-term debt before 2012 is based on data from the BIS. Long-term private nonguaranteed debt data from 2007 are World Bank staff estimates based on reports provided by the country and are not available prior to 2007.
Belarus Long-term private nonguaranteed debt data from 2014 are World Bank staff estimates based on reports provided by the country.
Belize Long-term private nonguaranteed debt data from 2008 are based on Central Bank data.
Benin Short-term debt is based on data from the BIS. Data include the effects of Paris Club debt restructuring agreement and HIPC and MDRI debt relief.
Bhutan Short-term debt is based on data from the BIS.
Bosnia and Herzegovina
Long-term private nonguaranteed debt data from 2005 are World Bank staff estimates. Short-term debt is based on data from the BIS.
Botswana Long-term private nonguaranteed debt data are World Bank staff estimates based on the market data. Short-term debt is based on data from the BIS.
Bulgaria Long-term private nonguaranteed debt data from 2008 are World Bank staff estimates based on reports provided by the country. Short-term debt before 2009 is World Bank staff estimates based on Central Bank data. The data may include long-term public and publicly guaranteed debt owed by the state-owned railway.
Burkina Faso Long-term private nonguaranteed debt data are World Bank staff estimates based on reports provided by the country. Data include HIPC and MDRI debt relief.
Burundi Data include the effects of Paris Club debt restructuring agreement and HIPC and MDRI debt relief. Long-term public and publicly guaranteed debt data for 2019 are World Bank staff estimates based on the original terms of the loans.
Cambodia Long-term private nonguaranteed debt data are estimates based on Central Bank data. Data include MDRI debt relief.

I N T E R N A T I O N A L D E B T S T A T I S T I C S 2 0 2 1
170
Country Country Notes
Cameroon Short-term debt is based on data from the BIS. Data include the effects of HIPC and MDRI debt relief.
Central African Republic
Short-term debt is based on data from the BIS. Data include the effects of HIPC and MDRI debt relief.
Chad Short-term debt is based on data from the BIS. Data include the effects of Paris Club debt restructuring agreement and HIPC and MDRI debt relief.
China Long-term public and publicly guaranteed and long-term private nonguaranteed are World Bank staff estimates based on the aggregate reports provided by the country and market data.
Comoros Data include the effects of Paris Club debt restructuring agreements signed in 2010 and 2013 and HIPC debt relief.
Congo, Republic of Short-term debt is based on data from the BIS. Data include the effects of Paris Club debt restructuring agreement and HIPC and MDRI debt relief.
Congo, Democratic Republic of
Short-term debt is based on data from the BIS. Data include the effects of Paris Club debt restructuring agreement and HIPC and MDRI debt relief.
Costa Rica Long-term private nonguaranteed debt data before 2019 are World Bank staff estimates based on reports provided by the country. Short-term debt before 2005 is based on data from the BIS.
Côte d’Ivoire Long-term private nonguaranteed debt data are World Bank staff estimates. Short-term debt is based on data from the BIS. Data include the effects of Paris Club agreement signed in 2011, 2012 and HIPC and MDRI debt relief.
Djibouti Short-term debt before 2017 is based on data from the BIS. Data include the effects of Paris Club debt restructuring agreement signed in 2008.
Dominican Republic Long-term public and publicly guaranteed debt data for 2019 are World Bank staff estimates based on the original terms of the loans. Long-term private nonguaranteed debt data from 2018 are World Bank staff estimates based on country reports. Short-term debt before 2009 and 2014 onward is based on data from the BIS. Data include the effects of Paris Club debt restructuring agreement signed in 2005.
El Salvador Long-term private nonguaranteed debt data from 2005 to 2016 are World Bank staff estimates based on reports provided by the country.
Eritrea Long-term public and publicly guaranteed debt from 2010 are World Bank staff estimates. Short-term debt is based on data from the BIS.
Eswatini Short-term debt is based on data from the BIS.
Ethiopia Short-term debt is based on data from the BIS. Data include the effects of HIPC and MDRI debt relief.
Fiji Short-term debt is based on data from the BIS.
Gabon Long-term public and publicly guaranteed debt data before 2008 are World Bank staff estimates based on reports provided by the country. Short-term debt is based on data from the BIS. Data include the effects of Paris Club debt buyback agreement signed in 2007.
Gambia, The Short-term debt is based on data from the BIS. Data include the effects of HIPC and MDRI debt relief.
Ghana Long-term public and publicly guaranteed debt data for 2019 are World Bank staff estimates based on the original terms of the loans. Short-term debt is based on data from the BIS. Data include the effects of MDRI debt relief.
Grenada Short-term debt is based on data from the BIS.
Guatemala Long-term private nonguaranteed debt data are World Bank staff estimates based on market data. Short-term debt before 2012 is based on data from the BIS.
Guinea Long-term public and publicly guaranteed debt for 2016 are World Bank staff estimates. Short-term debt is based on data from the BIS. Data include the effects of Paris Club debt restructuring agreement signed in 2010, 2012 and HIPC debt relief.
Guinea-Bissau Long-term public and publicly guaranteed debt for 2019 are World Bank staff estimates. Short-term debt before 2019 is based on data from the BIS. Data include the effects of Paris Club debt restructuring agreement and HIPC and MDRI debt relief.
Guyana Long-term private nonguaranteed debt data after 2014 are World Bank staff estimates based on market data. Short-term debt is based on data from the BIS. Principal payment shown from 2012 include rice for oil deal. Data include the effects of HIPC and MDRI debt relief.

D a t a S o u r c e S a n D M e t h o D o l o g y
171
Country Country Notes
Haiti Long-term private nonguaranteed debt data only cover IDB loans. Short-term debt before 2004 is based on data from the BIS. Data include the effects of Paris Club restructuring agreements signed in 2006 and 2009 and HIPC and MDRI debt relief.
Honduras Data include the effects of HIPC and MDRI debt relief.
India External debt data prior to 2003 are revised from fiscal year to calendar year. Long-term public and publicly guaranteed bonds include Foreign Institutional Investor debt (FII) as reported by the Reserve Bank of India.
Indonesia Long-term private nonguaranteed debt data are World Bank staff estimates based on reports provided by the country.
Iran, Islamic Republic of Short-term debt is based on Central Bank data.
Jamaica Short-term debt before 2012 is based on data from the BIS.
Jordan Long-term private nonguaranteed debt data from 2001 are based on reports provided by the country. Short-term debt before 1999 is based on data from the BIS.
Kenya Long-term private nonguaranteed debt data are World Bank staff estimates based on market data. Short-term debt is based on data from the BIS.
Lao People’s Democratic Republic
Long-term public and publicly guaranteed debt data for 2019 are World Bank staff estimates based on the original terms of the loans. Long-term private nonguaranteed debt data are World Bank staff esti-mates. Short-term debt is based on data from the BIS.
Lebanon Long-term private nonguaranteed debt data from 2008 to 2012 are World Bank staff estimates based on the 2013–2017 debt stock. Short-term debt before 2013 is based on data from the BIS.
Lesotho Large interest payment was made during 2007 to a creditor country to settle a long-standing claim. Short-term debt is based on data from the BIS.
Liberia Long-term private nonguaranteed debt data are World Bank staff estimates based on market data. Data include the effects of Paris Club rescheduling agreement signed in 2008 and 2010, and HIPC and MDRI debt relief.
Madagascar Long-term private nonguaranteed debt data from 2017 are World Bank staff estimates based on market data. Short-term debt from 2017 is based on data from the BIS. Data include the effects of HIPC and MDRI debt relief.
Malawi Short-term debt is based on data from the BIS. Data include the effects of Paris Club rescheduling agreement signed in 2006 and HIPC and MDRI debt relief.
Maldives Long-term private nonguaranteed debt data from 2006 are World Bank staff estimates based on reports provided by the country. Short-term debt is based on data from the BIS.
Mali Short-term debt is based on data from the BIS. Data include the effects of HIPC and MDRI debt relief.
Mauritania Short-term debt is based on data from the BIS. Data include the effects of MDRI debt relief.
Mongolia Long-term private nonguaranteed debt data before 2016 are World Bank staff estimates based on reports provided by the country. Short-term debt before 2008 is based on data from the BIS.
Montenegro Long-term private nonguaranteed debt data for 2018 and 2017 are World Bank staff estimates; data prior to 2017 are based on country reports. Short-term debt for 2018 are World Bank staff estimates; data prior to 2018 are based on country reports.
Morocco Short-term debt before 2009 is based on data from the BIS.
Mozambique Long-term public and publicly guaranteed debt data for 2019 are World Bank staff estimates based on the original terms of the loans. Long-term private nonguaranteed debt data before 2019 are World Bank staff estimates based on reports provided by the country. Short-term debt is based on data from the BIS. Data include HIPC and MDRI debt relief.
Myanmar Long-term public and publicly guaranteed before 2018 are World Bank staff estimates based on the original terms of the loans. Long-term private nonguaranteed debt data are World Bank staff estimates based on the market data. Data include HIPC debt relief.
Nepal Long-term private nonguaranteed debt data are World Bank staff estimates based on reports provided by the country.
Nicaragua Short-term debt before 2007 is based on data from the BIS. Data include the effects of HIPC and MDRI debt relief.

I N T E R N A T I O N A L D E B T S T A T I S T I C S 2 0 2 1
172
Country Country Notes
Niger Short-term debt is based on data from the BIS. Data include the effects of HIPC and MDRI debt relief.
Nigeria Long-term private nonguaranteed debt data from 2005 are estimates based on market data.
Pakistan Long-term private nonguaranteed debt data from 2006 to 2015 are World Bank staff estimates based on the reports provided by the country. Short-term debt before 2010 is based on data from the BIS.
Papua New Guinea Short-term debt is based on data from the BIS.
Peru Long-term private nonguaranteed debt data are World Bank staff estimates based on reports provided by the country.
Philippines Long-term private nonguaranteed debt data no longer include unregistered debt and are revised from 2005 based on the reports provided by the country.
Russian Federation Long-term public and publicly guaranteed and long-term private nonguaranteed debt are World Bank staff estimates based on reports provided by the country.
Rwanda Data include the effects of HIPC and MDRI debt relief.
Samoa Short-term debt data are excluded since BIS data include debt liabilities of offshore centers located in the country. BIS short-term debt data for 2017, 2018, and 2019 are $4.2 billion, $4.4 billion, and $4.5 billion, respectively.
São Tomé and Príncipe Short-term debt is based on data from the BIS. Data include HIPC and MDRI debt relief.
Senegal Short-term debt before 2009 is based on data from the BIS.
Serbia Beginning 2006, the data for Serbia exclude Montenegro. Short-term debt before 2014 is World Bank staff estimates based on Central Bank data.
Sierra Leone Short-term debt before 2016 is based on data from the BIS.
Somalia Long-term public and publicly guaranteed before 2018 are World Bank staff estimates based on the original terms of the loans. Beginning in 2018, the data reflect the outstanding debt stock and principal and interest arrears and include late interest/penalties amounts following the reconciliation exercise by the Government of Somalia with respective creditors.
St. Lucia Short-term debt before 2012 is based on data from the BIS.
St. Vincent and the Grenadines
Short-term debt data are excluded since BIS data include debt liabilities of offshore centers located in the country. BIS short-term debt data for 2015, 2016, 2017, 2018, and 2019 are $676 million, $806 million, $787 million, $532 million, and $363 million respectively.
Sudan Long-term public and publicly guaranteed debt data exclude penalty interest. Short-term debt is based on data from the BIS.
Syrian Arab Republic Long-term public and publicly guaranteed debt data are World Bank staff estimates. Short-term debt is based on data from the BIS.
Tajikistan Data include MDRI debt relief.
Tanzania Long-term public and publicly guaranteed debt data include debt liabilities of Zanzibar. Long-term public, publicly guaranteed and private nonguaranteed debt data from 2015 are World Bank staff estimates based on the original terms of the loans. Short-term debt is based on data from the BIS. Data include the effects of HIPC and MDRI debt relief.
Timor-Leste Short-term debt is based on data from the BIS.
Togo Short-term debt is based on data from the BIS. Data include the effects of Paris Club debt restructuring agreement and HIPC and MDRI debt relief.
Tunisia Long-term private nonguaranteed debt data from 2008 are estimates based on reports provided by the country.
Turkey Long-term public and publicly guaranteed debt data include nonresident deposits made under the Dresdner Bank scheme, amounting to $8.2 million at end-2019.
Turkmenistan Long-term public and publicly guaranteed debt from 2010 are World Bank staff estimates. Long-term private nonguaranteed debt data (excluding bonds) only cover European Bank for Reconstruction and Development lending.
Uganda Long-term private nonguaranteed debt data are World Bank staff estimates based on market data. Data include the effects of HIPC and MDRI debt relief.

d a t a s o U r c e s a n d M e t h o d o l o G y
173
Sources of the Macroeconomic Indicators
The macroeconomic data are prepared by The World Bank from a variety of sources.
Data on Personal Transfers and Compensation of Employees are prepared by World Bank staff
based on IMF balance of payments statistics. Data on foreign direct investments and current account balance are prepared by World Bank staff based on IMF balance of payments statistics and UNCTAD publication. Other macroeconomic data are from IMF balance of payments statistics.
Data on exports of goods, services, and primary income are based on countries’ balance of payments statistics for the following countries:
Algeria (2018)Botswana (2019)Comoros, Union of the (2019)Djibouti (2019)Ethiopia (2019)Gambia, The (2019)Ghana (2019)Guyana (2019)
Haiti (2019) Iran, Islamic Rep. of (2001–2019)Jamaica (2019)Jordan (2019)Lao People’s Dem. Rep. (2019)Liberia (2019)Madagascar, Rep of. (2019)Papua New Guinea (2019)
Peru (2019)Rwanda (2019)Samoa (2019)Sudan (2019)Tanzania, United Rep. of (2019)Vanuatu (2019)Zimbabwe (2018)
Data on imports of goods, services, and primary income are based on countries’ balance of payments statistics for the following countries:
Algeria (2018)Botswana (2019)Comoros, Union of the (2019)Djibouti (2019)Ethiopia (2019)Gambia, The (2019)Ghana (2019)Guyana (2019)
Haiti (2019)Iran, Islamic Rep. of (2001–2019)Jamaica (2019)Jordan (2019)Lao People’s Dem. Rep. (2019)Liberia (2019)Madagascar, Rep. of (2019)Papua New Guinea (2019)
Peru (2019)Rwanda (2019)Samoa (2019)Sudan (2019)Tanzania, United Rep. of (2019)Vanuatu (2019)Zimbabwe (2018)
Country Country Notes
Uzbekistan Short-term debt is based on data from the BIS.
Vanuatu Long-term public and publicly guaranteed debt data for 2019 are World Bank staff estimates based on the original terms of the loans. Short-term debt is based on data from the BIS.
Venezuela, República Bolivariana de
Long-term public and publicly guaranteed debt are World Bank staff estimates based on creditors data and estimates on the 2016 debt stocks. Long-term private nonguaranteed debt data and short- term debt are World Bank staff estimates based on country reports.
Vietnam Long-term public and publicly guaranteed debt data for 2019 are World Bank staff estimates based on the original terms of the loans. Short-term debt before 2016 is based on data from the BIS.
Yemen, Republic of Long-term public and publicly guaranteed debt data for 2019 are World Bank staff estimates based on the original terms of the loans. Short-term debt is based on data from the BIS.
Zambia Long-term private nonguaranteed data before 2016 are World Bank staff estimates based on reports provided by the country. Short-term debt is based on data from the BIS. Data include the effects of HIPC and MDRI debt relief.
Zimbabwe Long-term private nonguaranteed debt data in 2017 are World Bank staff estimates based on reports provided by the country. Data from 2001 include late interest fee owed to Paris Club and Commercial Creditors. Short-term debt is based on data from the BIS.

I N T E R N A T I O N A L D E B T S T A T I S T I C S 2 0 2 1
174
Data on current account balance are based on countries’ balance of payments statistics for the following countries:
Algeria (2018)Benin (2019)Botswana (2019)Burkina Faso (2019)Burundi (2019)Comoros, Union of the (2019)Côte d’Ivoire (2019)Djibouti (2019)Dominica (2019)Ethiopia (2019)Gambia, The (2019)Ghana (2019)
Grenada (2019)Guinea-Bissau (2019)Guyana (2019)Haiti (2019)Iran, Islamic Rep. of (2001–2019)Jamaica (2019)Jordan (2019)Lao People’s Dem. Rep. (2019)Liberia (2019)Madagascar, Rep. of (2019)Mali (2019)Niger (2019)
Papua New Guinea (2019)Peru (2019)Rwanda (2019)Samoa (2019)Senegal (2019)St. Lucia (2019)St. Vincent and the Grenadines (2019)Sudan (2019)Tanzania, United Rep. of (2019)Togo (2019)Vanuatu (2019)Zimbabwe (2018)
Data on personal transfers and compensation of employees are based on countries’ balance of payments statistics for the following countries:
Djibouti (2019)Guyana (2019)Jordan (2019)
Lao People’s Dem. Rep. (2019)Peru (2019)Rwanda (2019)
Tanzania (2019)Zimbabwe (2018)
Data on primary income on foreign direct investment are based on countries’ balance of payments statis-tics for the following countries:
Djibouti (2019)Rwanda (2019)
Data on foreign direct investment are based on countries’ balance of payments statistics for the following countries:
Botswana (2019)Jamaica (2012–2019)
Jordan (2019)Liberia (2019)
Peru (2019)
Data on portfolio equity are based on countries’ balance of payments statistics for the following countries:
Botswana (2019) Jordan (2019)

175
Country Groups
Regional GroupsEast Asia and Pacific
Cambodia (A)
China (P)
Fiji (A)
Indonesia (A)
Lao PDR (E)
Mongolia (A)
Myanmar (A)
Papua New Guinea (A)
Philippines (A)
Samoa (A)
Solomon Islands (A)
Thailand (A)
Timon-Leste (A)
Tonga (A)
Vanuatu (E)
Vietnam (E)
Europe and Central Asia
Albania (A)
Armenia (A)
Azerbaijan (A)
Belarus (A)
Bosnia and Herzegovinaa (A)
Bulgaria (A)
Georgia (A)
Kazakhstan (A)
Kosovo (A)
Kyrgyz Republic (A)
Moldova (A)
Montenegro (A)
North Macedonia (A)
Russian Federation (P)
Serbiaa,b (A)
Tajikistan (A)
Turkey (A)
Turkmenistan (E)
Ukraine (A)
Uzbekistan (A)
Latin America and the Caribbean
Argentina (A)
Belize (A)
Bolivia (A)
Brazil (A)
Colombia (A)
Costa Rica (A)
Dominica (A)
Dominican Republic (E)
Ecuador (A)
El Salvador (A)
Grenada (A)
Guatemala (A)
Guyana (A)
Haiti (A)
Honduras (A)
Jamaica (A)
Mexico (A)
Nicaragua (A)
Paraguay (A)
Peru (A)
St. Lucia (A)
St. Vincent and the Grenadines (A)
Venezuela, RB (E)
Middle East and North Africa
Algeria (A)
Djibouti (A)
Egypt, Arab Rep. (A)
Iran, Islamic Rep. (A)
Jordan (A)
Lebanon (A)
Morocco (A)
Syrian Arab Republic (E)
Tunisia (A)
Yemen, Rep. (E)
South Asia
Afghanistan (A)
Bangladesh (A)
Bhutan (A)
India (A)
Maldives (A)
Nepal (A)
Pakistan (A)
Sri Lanka (A)
Sub-Saharan Africa
Angola (A)
Benin (A)
Botswana (A)
Burkina Faso (A)
Burundi (E)
Cabo Verde (A)
Cameroon (A)
Central African Republic (A)
Chad (A)
Comoros (A)
Congo, Dem. Rep. (A)
Congo, Rep. (A)
Côte d’Ivoire (A)
Eritrea (E)
Eswatini (A)
Ethiopia (A)
Gabon (A)
Gambia, The (A)
Ghana (E)
Guinea (A)
Guinea-Bissau (E)
Kenya (A)
Lesotho (A)
Liberia (A)
Madagascar (A)
Malawi (A)
Mali (A)
Mauritania (A)
Mozambique (A)
Niger (A)
Nigeria (A)
Rwanda (A)
São Tomé and Príncipe (A)
Senegal (A)
Sierra Leone (A)
Somalia (A)
South Africa (A)
Sudan (P)
Tanzania (E)
Togo (A)
Uganda (A)
Zambia (A)
Zimbabwe (A)
Note: Letters in parenthesis indicate DRS reporters’ status: (A) as reported, (P) preliminary, and (E) estimated. The status “as reported” indicates that the country was fully current in its reporting under the DRS and that World Bank staff are satisfied that the reported data give an adequate and fair representation of the country’s total public debt. “Preliminary” data are based on reported or collected information, but because of incompleteness or other reasons, an element of staff estimation is included. “Estimated” data indicate that countries are not current in their reporting and that a significant element of staff estimation has been necessary in producing the data tables.a. For Bosnia and Herzegovina, total debt before 1999, excluding IBRD and IMF obligations and short-term debt, is included under Serbia.b. Data prior to 2006 include Montenegro.

I N T E R N A T I O N A L D E B T S T A T I S T I C S 2 0 2 1
176
Income GroupsLow-income countries
Afghanistan
Burkina Faso
Burundi
Central African Republic
Chad
Congo, Dem. Rep.
Eritrea
Ethiopia
Gambia, The
Guinea
Guinea-Bissau
Haiti
Liberia
Madagascar
Malawi
Mali
Mozambique
Niger
Rwanda
Sierra Leone
Somalia
Sudan
Syrian Arab Republic
Tajikistan
Togo
Uganda
Yemen, Rep.
Middle-income countries
Albania
Algeria
Angola
Argentina
Armenia
Azerbaijan
Bangladesh
Belarus
Belize
Benin
Bhutan
Bolivia
Bosnia and Herzegovina
Botswana
Brazil
Bulgaria
Cabo Verde
Cambodia
Cameroon
China
Colombia
Comoros
Congo, Rep.
Costa Rica
Côte d’Ivoire
Djibouti
Dominica
Dominican Republic
Ecuador
Egypt, Arab Rep.
El Salvador
Eswatini
Fiji
Gabon
Georgia
Ghana
Grenada
Guatemala
Guyana
Honduras
India
Indonesia
Iran, Islamic Rep.
Jamaica
Jordan
Kazakhstan
Kenya
Kosovo
Kyrgyz Republic
Lao PDR
Lebanon
Lesotho
Maldives
Mauritania
Mexico
Moldova
Mongolia
Montenegro
Morocco
Myanmar
Nepal
Nicaragua
Nigeria
North Macedonia
Pakistan
Papua New Guinea
Paraguay
Peru
Philippines
Russian Federation
Samoa
São Tomé and Príncipe
Senegal
Serbia
Solomon Islands
South Africa
Sri Lanka
St. Lucia
St. Vincent and the Grenadines
Tanzania
Thailand
Timor-Leste
Tonga
Tunisia
Turkey
Turkmenistan
Ukraine
Uzbekistan
Vanuatu
Venezuela, RB
Vietnam
Zambia
Zimbabwe
Note: Low-income countries are those with a GNI per capita of $1,035 or less in 2019. Middle-income countries are those with a GNI per capita of more than $1,036 but less than $12,535. Italicized countries are IDA-only countries as of July 1, 2020; IDA-only excludes blend and IBRD countries.

177
Glossary
Debtor Reporting System (DRS)Bilateral official creditors are official agencies that make loans on behalf of one government to another government or to public (and, in some cases, private) borrowers in another country.
Bonds are debt instruments issued by public and publicly guaranteed or private debtors with dura-tions of one year or longer. Bonds usually give the holder the unconditional right to fixed money income or contractually determined, variable money income.
Commitments of public and publicly guaranteed debt constitute the total amount of new long-term loans to public sector borrowers or borrowers with a public sector guarantee extended by official and private lenders and for which contracts were signed in the year specified.
Concessional debt conveys information about the borrower’s receipt of aid from official lenders at concessional terms as defined by the World Bank, that is, loans with an original grant element of 35 percent or more. Loans from major regional development banks—African Development Bank, Asian Development Bank, and the Inter-American Development Bank—are classified as concessional according the World Bank classification.
Contractual obligations on outstanding long-term external debt are the anticipated debt service pay-ments on long-term external debt contracted up to December 31 of the reporting year.
Debt buyback is the repurchase by a debtor of its own debt, either at a discount price or at par value. In the event of a buyback of long-term
debt, the face value of the debt bought back will be recorded as a decline in stock outstanding of long-term debt, and the cash amount received by creditors will be recorded as a principal repay-ment. For example, if a country buys back long-term external debt of face value B at a price P, then long-term external debt will decline by B, and principal repayment will increase by P. The difference between the price at which the debt was bought back and the face value is recorded as a debt stock write-off (the related transactions are not separately identified in the International Debt Statistics [IDS] publication but are available in the online database).
Debt forgiveness grants include both debts can-celed by agreement between debtor and creditor and reductions in the net present value of official nonconcessional loans resulting from concessional rescheduling or refinancing. Data are recorded on a disbursement basis and include debt forgiveness from bilateral and multilateral creditors.
Debt outstanding and disbursed is the value at year’s end of long-term external debt owed by public and publicly guaranteed debtors and pri-vate nonguaranteed debtors.
Debt restructurings are revisions to debt service obligations agreed on by creditors and debtors. Such agreements change the amount and timing of future principal and interest payments.
Debt service to exports is the ratio of the sum of principal repayments and interest paid on total long-term debt (public and publicly guaranteed debt and private nonguaranteed debt) to the value of exports of goods and services and receipts of primary income from abroad.

I N T E R N A T I O N A L D E B T S T A T I S T I C S 2 0 2 1
178
Debt stock-flow reconciliation shows the indica-tors that affect the change in debt stocks from one period to the next.
Disbursements are drawings during the year speci-fied on loan commitments contracted by the bor-rower.
Exports of goods, services, and primary income constitute the total value of exports of goods and services, and primary income.
External debt flows are debt-related transactions during the year specified. They include disburse-ments, principal repayments, and interest payments.
External debt stocks comprise public and publicly guaranteed long-term external debt, private non-guaranteed long-term external debt, use of IMF credit, and short-term external debt, including interest arrears on long-term debt.
External debt stocks to exports is the ratio of out-standing external debt to the value of exports of goods and services and receipts of primary income from abroad.
External debt stocks to GNI is the ratio of out-standing external debt to gross national income.
Foreign direct investment refers to direct invest-ment equity flows in the reporting economy. It is the sum of equity capital, reinvestment earnings, and other capital. Direct investment is a category of cross-border investment associated with a resi-dent in one economy having control or a signifi-cant degree of influence on the management of an enterprise that is resident in another economy. Ownership of 10 percent or more of the ordinary shares or voting stock is the criterion for determin-ing the existence of a direct investment relationship.
Government sector debt consists of all external debt obligations of all levels of the departments, branches, agencies, foundations, institutes, non-market and non-profit institutions controlled by the government, and other publicly controlled organizations engaging in non-market activities.
Grace period is the time between the date on which a loan is committed and the date on which the first principal payment is due. The informa-tion presented in International Debt Statistics is the average grace period on all public and publicly guaranteed debt committed during the specified period.
Grants are legally binding commitments that obligate a specific value of funds available for dis-bursement for which there is no payment require-ment. They include debt forgiveness grants and grants from bilateral and multilateral agencies (such as the International Development Association).
Gross national income (GNI) is the sum of value added by all resident producers, plus any product taxes (less subsidies) not included in the valuation of output, plus net receipts of primary income com-pensation of employees and property income from abroad. Yearly average exchange rates are used to convert GNI from local currency to U.S. dollars.
Heavily Indebted Poor Country (HIPC) Initiative is a program of the World Bank and the Interna-tional Monetary Fund (IMF) to provide debt relief to qualifying countries with unsustainable debt burdens.
Imports of goods, services, and primary income constitute the total value of goods and services imported and income payable to nonresidents. Interest arrears on long-term debt are interest pay-ments due but not paid, shown on a cumulative basis.
Interest arrears are due and payable immediately and are therefore regarded as short-term obliga-tions. Thus, an increase in interest arrears on long-term debt will be recorded as an increase in short-term debt. Interest in arrears on the use of IMF credit is also considered to be part of short-term external debt.
Interest payments are the amounts of interest paid in foreign currency, goods, or services in the year specified.
Interest rate is the interest rate applicable to a loan commitment as specified in the loan contract. The information presented in International Debt Statistics is the average interest on all public and publicly guaranteed debt committed during the specified period.
IMF charges are the amounts of interest paid in foreign currency in the year specified for transac-tions with the IMF.
IMF purchases are the total drawings on the general resources account of the IMF during the year specified, excluding drawings in the reserve tranche.

G l o s s a r y
179
IMF repurchases are the amounts of principal (amortization) paid in foreign currency in the year specified for transactions with the IMF.
International reserves constitute the sum of a country’s monetary authority’s holdings of special drawing rights, its reserve position in the IMF, its holdings of foreign exchange, and its holdings of gold (valued at year-end London prices).
Long-term external debt is debt that has an origi-nal or extended maturity of more than one year and that is owed to nonresidents by residents of an economy and is repayable in foreign currency, goods, or services.
Maturity is the date on which the final principal repayment on a loan is due. It is the sum of the grace and repayment periods. The information presented in International Debt Statistics is the average maturity on all public and publicly guar-anteed debt committed during the specified period.
Multilateral Debt Relief Initiative (MDRI) is a program of the World Bank, the IMF, the Inter- American Development Bank, and the African Development Bank that provides additional debt relief to countries that have completed the HIPC process.
Multilateral official creditors are official agencies owned or governed by more than one country that provide loan financing. They include international financial institutions such as the World Bank, regional development banks, and other intergov-ernmental agencies.
Multilateral to external debt stocks is the ratio of the stock of debt owed to multilateral creditors to total external debt.
Net flows on external debt are disbursements on long-term external debt and IMF purchases minus principal repayments on long-term external debt and IMF repurchases. Up to 1984, this calcula-tion included only long-term external debt and IMF flows. Since 1985, the calculation includes the change in stock of short-term debt (excluding interest arrears on long-term external debt).
Official creditors are governments or other bilateral public entities, such as export-import agencies, development agencies, and multilateral financial institutions, such as the World Bank and regional development banks.
Personal transfers and compensation of employees is the sum of personal transfers and compensation of employees. Personal transfers consist of all current transfers in cash or in kind made or received by resident households to or from nonresident households. Personal trans-fers thus include all current transfers between resident and nonresident individuals. Compensa-tion of employees refers to the income of border, seasonal, and other short-term workers who are employed in an economy where they are not resi-dent and of residents employed by nonresident entities.
Portfolio equity is the category of international investment that covers investment in equity securi-ties. Equity securities include shares, stocks, par-ticipation, or similar documents (such as American Depositary Receipts) that usually denote owner-ship of equity.
Present value of debt outstanding is the nominal value of all future debt service obligations on existing debt discounted at prevailing market rates of interest. The interest rates used in this calculation are the Commercial Interest Reference Rates (CIRR) for each relevant currency compiled and published by the Organisation for Economic Co-operation and Development.
Primary income on FDI are payments of direct investment income (debit side), which consist of income on equity (dividends, branch profits, and reinvested earnings) and income on the intercom-pany debt (interest).
Principal arrears on long-term debt are principal repayments due but not paid on long-term exter-nal debt, shown on a cumulative basis.
Principal repayments are the amounts of principal (amortization) paid in foreign currency, goods, or services in the year specified with respect to long-term external debt.
Private creditors are bondholders, commercial banks, and other trade-related lenders.
Private nonguaranteed debt is debt owed by pri-vate sector borrowers to external creditors on loans that do not benefit from a public sector guarantee by the debtor country.
Public and publicly guaranteed debt outstanding and disbursed is the value of debt at year’s end of public

I N T E R N A T I O N A L D E B T S T A T I S T I C S 2 0 2 1
180
sector borrowers, or borrowers with a public sector guarantee, owed to official and private lenders.
Public and publicly guaranteed external debt com-prises public debt (an external obligation of a public debtor, such as the national government or agency, a political subdivision or agency, or an autonomous public body) and publicly guaranteed external debt (an external obligation of a private debtor that is guaranteed for repayment by a public entity).
Public debt is an external obligation of a public debtor, including all levels of government, state-owned enterprises, public corporations, develop-ment banks, and any other autonomous public bodies of government.
Publicly guaranteed debt is an external obligation of a private debtor that is guaranteed for repay-ment by a public entity.
Reserves to external debt stocks is the ratio of international reserves to outstanding external debt.
Reserves to imports (months) is the ratio of inter-national reserves to the value of imports of goods, services, and primary income in the year shown and is expressed in months:
Reserves
Imports/12
Short-term external debt has an original matu-rity of one year or less. Available data permit no distinction among public, publicly guaranteed, and private nonguaranteed short-term external debt.
Short-term to external debt stock ratio is the ratio of short-term external debt to total outstanding external debt.
Special Drawing Rights (SDRs) refer to an interna-tional reserve asset that was created by the IMF in
1969 to supplement its member countries’ official reserves. The value of SDRs is based on a basket of four key international currencies: the U.S. dol-lar, the pound sterling, the Japanese yen, and the euro. In addition to playing a role as a supple-mentary reserve asset, SDRs serve as the unit of account for the IMF and some other international organizations.
Technical cooperation grants include (a) free-standing technical cooperation grants, which are intended to finance the transfer of technical and managerial skills or of technology for the purpose of building up general national capacity without reference to any specific investment projects, and (b) investment-related technical coopera-tion grants, which are aimed at strengthening the capacity to execute specific investment projects.
Total amount forgiven is the total amount of princi-pal and interest due, principal and interest in arrears, and debt stock forgiven in the year specified.
Total amount rescheduled is the total amount of external debt rescheduled, including principal and interest due, principal and interest in arrears, charges, penalties, and debt stock in the year specified.
Total change in external debt stocks is the differ-ence in the external debt stock between two con-secutive years.
Use of IMF credit denotes members’ drawings on the IMF other than amounts drawn against the country’s reserve tranche position. Use of IMF credit includes purchases and drawings under Stand-By, Extended, Structural Adjustment, Enhanced Structural Adjustment, and Systemic Transformation Facility Arrangements as well as trust fund loans. SDR allocations are also included in this category.

ECO-AUDIT
Environmental Benefits Statement
The World Bank Group is committed to reducing its environmental footprint. In support of this commitment, we leverage electronic publishing options and print-on-demand technology, which is located in regional hubs worldwide. Together, these initiatives enable print runs to be lowered and shipping distances decreased, resulting in reduced paper consumption, chemical use, greenhouse gas emissions, and waste.
We follow the recommended standards for paper use set by the Green Press Initiative. The majority of our books are printed on Forest Stewardship Council (FSC)–certified paper, with nearly all containing 50–100 percent recycled content. The recycled fiber in our book paper is either unbleached or bleached using totally chlorine-free (TCF), processed chlorine–free (PCF), or enhanced elemental chlorine–free (EECF) processes.
More information about the Bank’s environmental philosophy can be found at http://www.worldbank.org/corporateresponsibility.

1818 H Street, NW
Washington, DC 20433 USA
Telephone: (202) 477-1234
Website: data.worldbank.org
Email: [email protected]
International Debt Statistics (IDS), a long-
standing annual publication of the World Bank,
features external debt statistics and analysis for
the 120 low- and middle-income countries that
report to the World Bank Debtor Reporting Sys-
tem. IDS 2021 includes (1) an overview analyzing
global trends in debt stocks of and debt flows
to low- and middle-income countries within the
framework of aggregate capital flows (debt and
equity); (2) a feature story on the World Bank
and International Monetary Fund Debt Service
Suspension Initiative in response to the COVID-19
pandemic; (3) tables and charts detailing debtor
and creditor composition of debt stock and flows,
terms of new commitments, and maturity struc-
ture of future debt service payments and debt
burdens, measured in relation to gross national
income and export earnings for each country; (4)
one-page summaries per country, plus global,
regional, and income group aggregates showing
debt stocks and flows, relevant debt indicators,
and metadata for six years (2009 and 2015–19);
and (5) a user guide describing the tables and
content, definitions and rationale for the country
and income groupings used in the report, data
notes, and information about additional resourc-
es and comprehensive data sets available to us-
ers online.
Unique in its coverage of the important trends
and issues fundamental to the financing of low-
and middle-income countries, IDS 2021 is an
indispensable resource for governments, econo-
mists, investors, financial consultants, academ-
ics, bankers, and the entire development com-
munity. For more information on IDS 2021 and
related products, please visit the World Bank’s
Data Catalog at https://datacatalog.worldbank
.org/dataset/international-debt-statistics.
SKU 211610
ISBN: 978-1-4648-1610-9