the petite bourgeoisie: philippine income dynamics towards ... · thesis approval sheet this...
TRANSCRIPT

i
The Petite Bourgeoisie: Philippine Income Dynamics towards the Middle of the Pyramid
An Undergraduate Thesis presented to The Faculty of School of Economics
De La Salle University – Manila
In completion of the requirements for the degree of
Bachelor of Science in Applied Economics
By: JOVERES, Katrina Fatima N.
ONA, Nadia Kristina M. ORTIZ, Patricia G.
SALAYSAY, Larisa Jane L.
Advisers: Dr. Lawrence Dacuycuy
Mr. Dickson Lim Dr. Ruperto Majuca Dr. Marites Tiongco
December 2013

ii
Thesis Approval Sheet
This undergraduate thesis entitled The Petite Bourgeoisie: Philippine
Income Dynamics towards the Middle of the Pyramid, prepared and submitted
by Katrina Fatima N. Joveres, Nadia Kristina M. Ona, Patricia G. Ortiz, and
Larisa Jane L. Salaysay has been examined and is so recommended for acceptance
and approval in partial fulfilment of the course requirements for the degree
Bachelor of Science in Applied Economics.
Panel of Advisors:
_________________________
Dr. Laurence Dacuycuy
Panel Chair
_______________________ __________________________ _________________________
Mr. Dickson Lim
Panelist
Dr. Marites Tiongco
Panelist
Dr. Ruperto Majuca
Panelist
Accepted and approved in partial fulfilment of the degree of Bachelor of
Science in Applied Economics.
_________________ ________________________________
Date Dr. Gerardo, L. Largoza
Chairperson
Economics Department

ii
Table of Contents
Acknowledgements...................................................................................................................................vi Abstract............................................................................................................................. ..............................vii Introduction...................................................................................................................................................1
1.1 Background of the Study...........................................................................................................1 1.1.1 Implications of Income Inequality.........................................................................2
1.1.2 The Middle Class............................................................................................................2 1.1.3 Middle Class Mobility..................................................................................................4 1.1.3.1 Inward Mobility...............................................................................................4 1.1.3.2 Outward Mobility............................................................................................5
1.2 Research Questions........................................................................................................... ..........5 1.3 Objectives........................................................................................................................................6 1.4 Scope, Limitations, and Methodology.................................................................................6 Review of Related Literature................................................................................................................9 2.1 Income Mobility.............................................................................................................. ...........10 2.2 Income Mobility in Other Countries..................................................................................10 2.2.1 Rural China........................................…........................................................................10 2.2.2 Great Britain and the Netherlands......................................................................11 2.2.3 United States.................................................................................................................12 2.3 Identifying the Middle Class.................................................................................................12 2.3.1 Absolute Measure.......................................................................................................13 2.3.2 Relative Measure........................................................................................................13 2.3.3 Characteristics of the Middle Class.....................................................................14 2.4 Influences of the Middle Class on Economic Growth and Development...........15 2.5 Trends of Growth......................................................................................................................16 2.6 Middle Class in the Philippines...........................................................................................17 2.7 The Economic Struggle...........................................................................................................18
2.8 Research Gap................................................................................................ ...............................20 Framework............................................................................................................................. ......................20 3.1 Theoretical Framework.........................................................................................................21 3.1.1 Income Distribution..................................................................................................21 3.1.2 Income Mobility and its Determinants..............................................................22 3.2 Empirical Framework.............................................................................................................25 3.2.1 Multinomial Logit Regression...............................................................................25 3.2.2 Post-estimation procedures...................................................................................26 3.2.3 Model Specification....................................................................................................27 Data and Methodology...........................................................................................................................29 4.1 Selection of Observations......................................................................................................29 4.2 Variables.................................................................................................................... ...................30 4.2.1 Dependent Variable...................................................................................................30 4.2.2 Independent Variables.............................................................................................31

iii
4.3 Methodology.................................................................................................................. ..............36 Results and Analysis............................................................................................................................. ..38 5.1 Descriptive Statistics...............................................................................................................38 5.1.1 Intra-generational Mobility across Income Classes.....................................41 5.1.2 Characteristics of the Middle Class.....................................................................47 5.1.3 Social and Demographic Characteristics of Mobile Households............50 5.1.3.1 Inward Mobility............................................................................................50 5.1.3.2 Outward Mobility.........................................................................................51 5.2 Regression Results and Analysis........................................................................................56 5.2.1 Downward Mobility Factors..................................................................................59 5.2.2 Upward Mobility Factors.........................................................................................63 5.3 Post-estimation Analysis........................................................................................................64 5.3.1 Marginal Effects...........................................................................................................64 5.3.2 Relative Risk Ratio.....................................................................................................66 Conclusions and Policy Recommendation.................................................................................69 Bibliography................................................................................................................................................72 List of Tables Table 4.1: Regions in the Philippines and their Corresponding Values.............................32 Table 4.2: Level of Education Attained by HH Head and its Corresponding Value.......33 Table 4.3: Types of Occupation and their Corresponding Values.........................................34 Table 4.4: Employment Status of Household Head’s Spouse and its Corresponding
Values........................................................................................................................................36 Table 5.1: Transition Matrix.................................................................................................................41 Table 5.2: Regression Results...............................................................................................................58 Table 5.3: Marginal Effects....................................................................................................................65 Table 5.4: Relative Risk Ratio Results...............................................................................................68 List of Figures Figure 5.1: Income Distribution in 2003.........................................................................................38 Figure 5.2: Income Distribution in 2009.........................................................................................39 Figure 5.3: Mobility of Sample Households....................................................................................40 Figure 5.4: Mobility Patterns across Different Regions............................................................43 Figure 5.5: Mobility Patterns across Different Levels of Education....................................44 Figure 5.6 Mobility Patterns based on Household Head’s Sex...............................................45 Figure 5.7 Mobility Patterns across Different Types of Occupation....................................46 Figure 5.8 Mobility Patterns across Employment of Household Head’s Spouse…........47 Figure 5.9 Income distribution of the middle class....................................................................48 Figure 5.10 Region....................................................................................................................................49 Figure 5.11 Educational Attainment.................................................................................................49 Figure 5.12 Inward mobility pattern................................................................................................51
iv
Figure 5.13 Income decile source of inward mobile households.........................................51 Figure 5.14 Income decile destination of mobile household..................................................52 Figure 5.15 Region of inward mobile households.......................................................................52 Figure 5.16 Educational attainment of HH of inward mobile households........................53 Figure 5.17 Outward mobility pattern.............................................................................................54 Figure 5.18 Region of outward mobile households....................................................................55 Figure 5.19 Educational attainment of HH of outward mobile households.....................56

v
ACKNOWLEDGEMENT
This research paper is made possible through the continuous support and
guidance from all those involved, including our professors, family and friends, who
have constantly been there for us and helped us all throughout.
We would want to express our deepest gratitude and appreciation to the
faculty who contributed in helping us make this thesis paper. To our thesis panel,
Dr. Laurence Dacuycuy, Sir Dickson Lim, Dr. Marites Tiongco and Dr. Ruperto
Majuca, and to the other professors, Dr. Inocencio, Ms. Pauline Castillo, Dr. Villamil,
and Dr. Cesar Rufino, who gave their time and effort in guiding us, whom without
their patience and understanding would not make any of this possible.
We would also want to acknowledge the National Statistics Office, for
providing us with the data needed to conduct this study. And a special mention to
Sir Pids, who taught us and guided us in using this most appreciated resource
through his expertise in the office and his knowledge on CS Pro.
And finally, to our parents, family and friends who showed their unfailing
love and support for us and gave us the strength to soldier on. We would also like to
extend a special thank you to Capt. Carlos Y. Ortiz, who has been an inspiration till
the end, through his strength, compassion and love. To all, we are forever grateful.
To God be the glory.

vi
ABSTRACT
The Theory of Social Mobility establishes that individuals move along the social
structure after spending a certain amount of time in one class. It explicitly describes
the phenomena of social mobility; however, it does not attempt to explain the relevant
implications. This study aims to measure the income mobility, as a subset of social
mobility, of the Philippine population towards the middle class and determine its
vulnerability and sustainability as a key driver of economic growth. The data will be
sourced from the Family Income and Expenditure Survey of the National Statistics
Office and will encompass the seventeen regions over a period of 2003 - 2009. Using a
multinomial logit regression along with other statistical estimation procedures, the
factors affecting downward and upward mobility and their impact on the households
are determined. Despite an impressive shift of the sample data along the income
strata, a closer look at the movement of the households reveal that a significant
percentage of households remained in their income decile relative to the entire
population. More alarming results show that in a span of six years, a period
characterized by impressive economic progress, the middle class have shrunk
indicating that it is still not sustainable in terms of nurturing the growth of the
economy of the Philippines.
Keywords: Multinomial Logit Regression, Income Mobility, Middle Class
JEL: J6, D31, I31
1
Chapter 1: INTRODUCTION
1.1. Background of the Study
As reported by the National Statistical Coordination Board or NSCB (2013), the
Philippines was deemed the fastest growing economy among the ASEAN 5. Despite
the global financial crisis in 2008 and 2009, the country still managed to maintain a
positive growth during these difficult times. Even before the crisis occurred, during
the years 2005 to 2007, the Philippines was experiencing accelerating economic
growth, as shown in the NSCB (2013) report. Then, post-crisis, the country
purportedly gained even higher GDP growth rates than most of its ASEAN peers.
However, regardless of the Philippines’ persistently improving standing, it
apparently does not capture other crucial economic factors that the country must also
face. As a matter of fact, statistics show that the country had one of the highest levels
of income inequality during the years 2003 to 2009 as compared to the other ASEAN
nations. This shows that even though the Philippines was pegged as one of the
forerunners in economic growth, the problem on income inequality remains
persistent. A study by the Asian Development Bank (2012) stated that the top 10% of
Filipino families were contributing to more than one third of the country’s total
income. Furthermore, the World Bank (2011) reported that the richest 20% outspent
eight times more than the poorest 20% of the country. These facts say a lot not only
about the economic standing of the country, but also about the reality that the
Filipinos are facing and the implications of these on their social welfare.

2
1.1.1. Implications of Income Inequality
Income inequality in a country may pose detrimental problems to the welfare of
the society, especially in the long run. Large disparities between the rich and poor,
according to a study conducted by the Asian Development Bank (2007), can create
social tension and political instability. These outcomes, in turn, may negatively affect a
country’s growth and development. The greater the wealth disparity in the society,
the more difficult it would be for the country to achieve economic prosperity. The
study continued to highlight the major challenge faced by policy makers in countering
this phenomenon, or any economic event for that matter— to create appropriate
economic or social policies that would address the problem of inequality while not
obstructing other opportunities for the country’s economic growth. Using the Gini
coefficient, the most common measure of income inequality, a country’s wealth
disparity between the rich and poor may be quantified, evaluated and compared in
order to formulate effective and feasible programs.
In light of conquering this overwhelming fact that the Philippines is facing, this
study aims to bridge the gap between this problem and a possible solution concerning
the middle class population.
1.1.2. The Middle Class
For centuries, the middle class has played a special role in economic thought
(Kharas, 2010). As defined by Kharas and Gertz (2010), it is a portion of the social

3
strata that is characterized by the ability to live a comfortable life. The middle class
usually enjoy stable housing, health care, educational opportunities, reasonable
retirement and job security, and discretionary income that can be spent on vacation
and leisure pursuits (Kharas & Gertz, 2010). In achieving and maintaining a good
standard of living, the individuals that comprise this class stimulate consumption and
wealth accumulation, which provide a substantial effect on the economy as key
indicators of growth.
Therefore, it can be said that the middle class population is indispensable to a
country in fuelling growth and prosperity towards sustainable development in the
various sectors of an economy. “The basic income, skills, and values that are
considered to characterize the middle class may enable them to improve not only
their own standards of living, but also that of others as well” (Chun, 2010).
Recent studies have shown the rapid growth of the middle class in developing
Asian countries, such as China and India. It is forecasted that roughly 60% of the total
middle class population will come from Asia by 2030 (Kharas & Gertz, 2010; Chun,
2010). The expansion of a middle class of a developing world would certainly yield
global distribution shifts that would entail greater poverty reduction (Ravallion,
2009). Thus, researchers have been focusing on determining the factors that will
foster the growth of the middle class population. However, one aspect that remains
neglected is the movement of the population along the income strata towards this
particular class.

4
Apart from the growth in number, economists are likewise concerned with the
stability of the aforementioned income stratum. According to Madland (2012), there
are a variety of advantages in having a robust middle class. It encourages businesses
to innovate and make transactions more efficient which would then generate more
investments. “A strong middle class also promotes efficient delivery of government
services, greater political participation, and forward-looking public investments in
education and infrastructure” (Madland, 2012).
1.1.3. Middle Class Mobility
1.1.3.1. Inward Mobility
The researchers define inward mobility as the movement of the households into
the middle class. In other words, this portion of the study quantifies the number of
households that shifted from one income class into the middle class. The change was
observed between the years 2003 and 2009. It was determined that in the year 2009,
there was a total of 4,501 households in deciles 3 to 9 and therefore part of the middle
class. Out of these, 3,656 households were already part of the middle class in 2003.
They experienced immobility with respect to going in and out of the middle class. It
was calculated that 220 moved down to the middle class from the upper class
population (decile 10). It was also inferred that of the 4501 households in the middle
income class of 2009, 625 of them were from the low class and experienced upward
mobility from 2003. In summary, 81.23 percent of the middle income households in

5
2009 were in the same social class in 2003, 13. 89 percent of them came from the
upper class, and 4.89 percent from the low class.
1.1.3.2. Outward Mobility
It is also important in this study to note the tendency of the population to move
out of the middle class. Outward mobility is regarded as the movement of the
households from the middle class to the other social classes. In 2003, there were a
total of 4,505 households that fall in the classification of middle class. Of these, 81.15
percent or 3,656 did not move out, 13.14 percent shifted to the low income class, and
5.70 percent moved out into the upper income class.
To create another dimension to these inferences, it would be relevant to
consider the different factors that would be able to characterize the changes
experienced through the years. These include the region, the household head’s
educational attainment, occupation, sex, spouse employment, and marital status.
1.2. Research Questions
1. How does the Philippine population move along the income strata?
2. What is the degree of mobility of the population towards the middle class?
3. What factors influence the movement of the population towards the middle
class?
6
1.3. Objectives
To determine the movement of the Philippine population along the income
strata
To identify the factors that influence the income mobility of the population
towards the middle class
To formulate policy recommendations that can further improve income
mobility in the Philippines
1.4. Scope, Limitations and Methodology
For an overview of the Philippine population, the study presents descriptive
statistics with respect to the country’s middle income class in order to get a glimpse of
the evident trends occurring. Furthermore, the study will employ the multinomial
logit model to analyze the mobility of the Philippine population towards the middle
class, the implications of such behaviour and the factors behind them. To further
enhance this study, the researchers will perform post-estimation procedures to which
would allow for inferences on their mobility.
The list of variables that will be used are readily available in the Family Income
and Expenditure Survey (FIES) of the National Statistics Office (NSO). The study will
focus on the changes that occurred between the years 2003 to 2009. From a sample
size of approximately 50,000 in the original survey, this was reduced to 6,517 in order

7
to isolate the households that were interviewed in both years identified. All 17
regions of the Philippines are represented by the members of the sample.
Moreover, the study encompasses the only the households included in the panel
data. Hence, all results and interpretations are only that of those households included
in both 2003 and 2009 surveys do not fully represent the entire Philippine
population.
Given that an analysis on income mobility is a difficult endeavor in itself, this
study will not delve into the other aspects of economic or social mobility that could
provide additional inferences regarding the welfare of Filipinos. In addition, the data
subjected to economic procedures is limited to those found in the Family Income and
Expenditure Survey. It is important to note that there are certain variables, such as
those accounting for the role of shocks, which are not captured by the aforementioned
survey; hence, the research group’s analysis is limited to that which is permitted by
the data on hand. Other surveys conducted by the National Statistics Office, such as
the Labor Force Survey (LFS), are not utilized. Also, an in-depth examination of the
lower and upper class will not be provided since this research will be focusing on the
middle class alone.
The chapters discussed in the subsequent sections of this paper will be focusing
on the impact of mobility around the middle class and the implications of such
occurrences. Chapter 2 presents the review of related literature which will discuss
relevant studies that would be a supporting factor to the topics discussed in this

8
paper. Chapter 3 elaborates the framework that will serve as the backbone of the
study. It discusses the different theories and economic statutes that would provide
credible sources of inferences. Chapter 4 presents the data used and explains the
various variables needed. It also provides the methodology developed to create
deeper inferences in the study. Chapter 5 illustrates the results and findings of the
study after employing the stated models and methods. This will be the basis of the
researchers’ inferences on the objectives at hand.

9
Chapter 2: REVIEW OF RELATED LITERATURE
A prevalent belief in the Philippines is that the rich are getting richer and the
poor are getting poorer. With this perception of a very pronounced gap between
income groups, the national government has since placed more weight on policies
which address the income inequality that persists in society. Nowadays, most
government-funded projects are targeted towards the welfare of the poor and
marginalized. Unfortunately, these endeavors merely take into account the income
distribution, without considering the aspect of income mobility. Instead of simply
focusing on the division of the population among the different income classes, policy
makers should ground their programs on the ability of economic agents to move from
one income bracket to another. This is a better indicator of economic growth and
development in society.
This chapter is divided into three parts. First, the concept of income mobility and
related studies in other countries will be discussed. The second part includes the
discussion on the middle class population. In particular, the definitions,
characteristics and the contribution of the middle class to the growth of an economy
will be comprehensively analyzed. Furthermore, trends in the growth of the middle
class are examined. Lastly, the trends and characteristics of the Philippine middle
class will be explained. These discussions will set the direction of the study and will
serve as the basis of the analysis.

10
2.1. Income Mobility
Fields, Hernandez, Rodriguez, and Sanchez-Puerta (2006) define income
mobility as the movement of individuals along the income strata. When mobility is
referred to as positional movement, it captures the changes of an individual’s position
(Fields et al., 2006). It examines the probability of achieving a different socioeconomic
status (Bozeat, Jesuit, Juravle, Irving, Ramos, & Vincze, 2010). Hence, the position or
state being referred to in this study is the deciles of the income distribution.
Moreover, Bozeat et al. (2010) define intra-generational mobility as a movement in
the social strata due to the “stratification or changes in income” that occurs during an
individual’s lifetime. Panel or longitudinal data is utilized to analyse income mobility.
2.2. Income Mobility in Other Countries
2.2.1. Rural China
Using panel data from the China Health and Nutrition Survey, Liu, Nuetah, Shi,
and Xin (2010) determine contributing factors of income mobility. Based on a
multivariate regression analysis, “households with low initial income level, high share
of wage income, high educational level of household members, high number of
non-agricultural employed household members, and younger heads are more
mobile” (Liu, et al., 2010,). Furthermore, the multinomial logit model reveals that
change in the share of non-agricultural employed persons, change in the share of
wage income, and change in the average years of education of household members are

11
determinants of income mobility. These factors also contribute to the inequality
among income groups in the sample. Liu, et al. conclude that government policies
should strengthen non-agricultural employment and education to improve income
mobility in rural China.
2.2.2. Great Britain and the Netherlands
Meanwhile, De Vos and Zaidi (2002) use a multinomial logistic regression model
to analyze the income mobility of the elderly in Great Britain and the Netherlands. The
authors select the multinomial logistic regression model since the dependent variable
of their study is discrete and comprise of more than two categories. Based on the
results, long-range downward and upward mobility in Great Britain is higher than in
the Netherlands. The regression analysis shows that demographic attributes, events
and changes in living arrangement status, employment status affect income mobility
in a multivariate context (De Vos & Zaidi, 2002). Private pensions are associated with
downward mobility due to the pension arrangements, such as basic pension
entitlements and occupational pensions in provision for survivors, present in both
countries. However, De Vos and Zaidi (2002) note that the variables in the
multinomial regression model do not entirely explain the disparity in income
mobility.

12
2.2.3. United States
Acs (2011) examine the mobility of middle class households in the United States.
Family backgrounds and personal characteristics influence the vulnerability of the
household to undergo downward mobility. The marital status, education attainment,
test scores and use of drug are key indicators to the downward movement of a
middle-class child along the economic ladder as an adult. Moreover, the mobility of
men are also affected by their race – White, Black or Hispanic. According to Acs
(2011), the downward mobility from the middle class is in contrast to the American
dream that the children will be better off than their parents in terms of economic
status.
2.3. Identifying the Middle Class
The middle class population is subject to multiple definitions and interpretations
based on the goal, focus and assumptions employed in a particular research. Truly, its
meaning has changed in both time and space. In the field of economics, contemporary
studies have applied various methods in capturing the size and characteristics of the
middle class through different economic factors. These methods can be classified as
either absolute or relative in measurement (Birdsall, 2010).

13
2.3.1. Absolute Measure
Using the absolute definition, the middle class population consists of individuals
who have daily per capita expenditures or purchasing power parity above the global
quantitative threshold. The amount considered as the threshold that distinguishes the
middle class from the other components of the social strata is dependent on which
institution’s measurement will be adopted. Researchers also consider the type of
analysis that will be made as a significant factor in determining the criteria used.
For instance, Chun (2010) considers the middle class as a percentage of the
population with daily per capita expenditures of $2 to $20 (2005 Purchasing Power
Parity in United States dollars). On the other hand, Kharas and Gertz (2010) define
“the global middle class as households with daily expenditures between $10 and $100
per person in purchasing power parity terms”.
2.3.2. Relative Measure
The relative measure refers to the method in which the entire population is
ranked according to the amount of income and divided into groups. Birdsall (2010)
identifies the middle class as “people at or below the 95th percentile of income
distribution in their country”. Meanwhile, Solimano (2009) uses the relative-income
definition to distinguish that middle class came from the 3rd to the 9th decile of the
income distribution. Those that are between the 3rd and the 6th decile are the lower-
middle class while those in the 6th to 9th decile are part of the upper-middle class. In

14
this study, the relative-income definition of Solimano (2009) served as the
measurement of the households in the middle class.
2.3.3. Characteristics of the Middle Class
Several studies have attempted to create a picture of an individual classified as
part of the middle income population by identifying common behavioral patterns and
attributes among the members. In particular, Banerjee and Duflo (2008) identify the
patterns of consumption of the middle class situated in urban and rural areas. Their
study shows that the share of food expenditure on income decreases as daily per
capita expenditure increases. On the other hand, health care and education
expenditures increases as daily per capita expenditure increases, denoting that
middle class households give much importance to health and education. The study
also includes the source of the middle class population’s income. For both urban and
rural households, there is less probability that the household will be actively involved
in agricultural business. These households usually involve themselves in
entrepreneurial activities to generate additional income. Since these households have
more stable jobs, they don’t find the need to invest so much on their entrepreneurial
activities. Banerjee and Duflo (2008) also suggest that the lack of access to capital may
also be a reason as to why these households don’t expand their businesses.

15
Ravallion (2009) explains that the overall distribution effect of an expanding
middle class is driven by “between-country” effect rather than within. However, the
middle class is vulnerable to aggregate economic contractions.
2.4. Influences of the Middle Class on Economic Growth and Development
The behavior of the emerging middle class influences the growth of the
economy. Specifically, the population contributes to certain economic factors such as
human capital and infrastructure, factor inputs and social capital. Chun, Hasan and
Ulubasoglu (2011) examine the contribution of the middle class population to
consumption growth and development. The results of the study show that the middle
class population contributes indirectly primarily through factor inputs, particularly
human capital. Although a higher percentage of middle class individuals may result in
higher savings, there is no significant relationship between savings and economic
growth. In general, the findings of the study conducted by Chun et al. (2011) provide
strong evidence that policies targeting the welfare of the middle class population may
be a possible strategy in poverty reduction. Moreover, Josten (2005) emphasize the
importance of a large middle class to economic development. The middle class, as an
active part of society, shows high social integration; thus, it constitutes a higher
contribution to the country’s social capital. The author also highlights that a shrinking
middle class will lessen the country’s social capital. These various social interactions

16
and informal relationships are important determinants of economic growth and
development.
2.5. Trends of Growth
To illustrate the increasing importance of the middle class in the economic
outlook of a nation, its growth throughout the previous years must be shown to have
been on an increasing trend. With this, Chun (2010) distinguishes the countries that
have progressed significantly and have become idle in fostering the growth of the
middle class from 1980 to 2008 based on household survey data from PovcalNet.
Using simple summary statistics and distributions, her study reveals that Armenia,
People’s Republic of China, Viet Nam, Indonesia and Pakistan have achieved the
greatest percentage increase in middle class during the covered period. Meanwhile,
India and the Philippines have lagged behind their counterparts in increasing the
percentage of the population living within $2 to $20 of per capita expenditures. This is
attributed to the lack of progress in poverty reduction. Nevertheless, the economic
power of the middle class has generally increased from 1990 to 2005 (Birdsall, 2010).
Aside from the trend in previous years, it is important to identify the potential
size and contribution to economic growth of the middle class in the future through
econometric forecasting. This can become a basis for policy-making so that
governments can take advantage of the positive relationship established between
economic growth and middle class population growth. With this in mind, Kharas and

17
Gertz (2010) forecasted that about two thirds of the population could become middle
class. Along with the increase in the number of middle class is the decrease in the
population of the poor, implying a significant improvement in different countries,
most especially in Asia (Kharas & Gertz, 2010). The results of the study show that in
2030 about 60% of the total middle class could come from Asia, and there would be a
major drop in the number of middle class in US and Europe. Ultimately, the middle
class population will also be comprised of 4.9 billion people by 2030.
2.6. Middle Class in the Philippines
Addawe, Querubim, and Virola (2007) identified households with annual income
ranging from P251,283 to P2,045,280 as part of the middle class. On the other hand,
the non-income based definition of the middle class shows household “ownership of
house and lot, housing unit with strong roof material, refrigerator and radio” (Addawe
et al., 2007). For a deeper analysis, Addawe, Balamban, Encarnacion, Viernes and
Virola (2013) merge the data from the Family Income and Expenditure Survey with
the Labor Force Survey. Results show that most of the middle class families live in the
National Capital Region, Region IV-A, Region III, and Cordillera Autonomous Region.
Region II, Region VIII, and Region XI had the fastest growing rate of middle income
families. For the years 2003, 2006, 2009, 10-12% of the middle class population are in
the rural area while 35% of the middle income class in the urban area. Moreover, the

18
regression analysis of the study shows a 2% decrease in the population share of the
middle class between 2000 and 2003.
The percentage of the middle class families with an Overseas Filipino Worker
has increased from 46.6% in 2003 to 55% in 2009. Meanwhile, 66.1% of the middle
class belongs to the working age population as of 2009. Addawe, et al. (2013) stress
that generation of statistics regarding the middle class and institutionalize data on the
Philippines Statistical System.
2.7 The Economic Struggle
Easterly (2001) explores social polarization due to class and ethnic divisions. He
defines the middle class consensus as “a high share of income for the middle class and
a low degree of ethnic divisions.” The absence of a middle class consensus creates
societies with economic/political/ethnic elite that underinvest in human and
infrastructure capital. In Latin America, Engerman and Sokoloff (1997) establish the
relationship of tropical factor endowments to high inequality and “parasitic politically
powerful elites”. It led to low levels of growth and public good due to the reluctance of
the elite to invest in mass education “for fear they would be displaced from power”
(Easterly, 2001). The middle class consensus also affects the democracy in a country
through democratic voting that favours mass education than oligarchic elite.
Easterly (2001) concludes that middle class consensus yields to higher levels of
income and growth due to the accumulation on human capital and infrastructure,

19
more stable politics, efficient, effective national economic policies and a more modern
and urbanized country. More importantly, the results of the study show that elite-
dominated societies tend to amass less human and infrastructure capital which leads
to inequality.
Although the Philippines is becoming an Asian tiger economy, Cielito Habito,
former economic planning minister, believes that the control of oligarchy in the
nation’s resources will hamper inclusive growth (Agence France-Press, 2013).
Additionally, known wealthy families continue to dictate major industries due to
government regulations which allow “near monopolies and protections for key
players.” Philippine politics is also known for personal connections that promote the
“path to riches for the few.” (Agence France- Press, 2013)
In the United States, economics segregation plays a vital role in economic
mobility. According to Jacobs (2013), there is a strong correlation between the size of
the middle class in a given region and the residential segregation by income. “Poor
kids who grow up in regions with high levels of residential segregation by income are
less likely to be upwardly mobile than those who grow up in economically-integrated
communities (Jacobs, 2013).” Furthermore, Jacobs understands the need to address
the causal relationship that impedes upward mobility.

20
2.8. Research Gap
In the Philippines, most studies focus on poverty, its determinants and its effect
on overall welfare. Hence, researchers tend to overlook the importance of individuals
belonging to other income classes especially the middle class. Furthermore, there are
few studies about income mobility in the Philippines, with existing literature mainly
discussing intergenerational income mobility. Another motivation behind this paper
is that, contrary to the global trend, the Philippine middle class shrank in population.
Thus, this paper will analyze the intra-generational income mobility towards the
middle class in the Philippines. When the population moves toward the middle class,
this implies the growth of the middle class population. More importantly, it indicates
that the living conditions of the people also improve alongside with economic growth.
Results of this study can have significant policy implications for overall economic
growth and development in the Philippines.

21
Chapter 3: FRAMEWORK
3.1 Theoretical Framework
The previous chapter has justified the need for a study on the movement of a
population along the income strata. However, before elaborating on the sequence of
econometric procedures leading to an inference on income mobility in the Philippines,
it is important to discuss the underlying concepts and theories that will provide the
economic framework of this study. By establishing the theoretical foundation, the
basis and the idea of this research can be further understood.
3.1.1 Income Distribution
In classical economics, land, labor, and capital are the three recognized factors of
production. Each of these corresponded to a particular social class, namely the
landowners, the workers and the capitalists. Specifically, landowners collected rent on
land, workers received wages for their contribution to labor, and capitalists earned
interest on funds or capital that they “advance in order to pay wages before
production is completed” (The Classical Economists’ Theory of Income Distribution).
Classical economists, such as Adam Smith, David Ricardo and Karl Marx, were
intrigued with this system and wanted to identify the distribution of wealth among
each of the three aforementioned classes.
Today, Alfonso, Schuknecht, and Tanzi (2008) further analyze the income
distribution by identifying its factors or determinants. These include the inheritance

22
of tangible and financial wealth, inheritance of human capital, societal arrangement
and norms, individual talent, and past governmental policies. The authors also state
that the factors influencing the income distribution are “individually-nested”,
pertaining to distribution of skills, intelligence, and ‘luck’. This means that highly-
skilled and talented individuals are given high salaries in the workplace. Meanwhile,
“luck [refers to] the role that randomness plays in determining incomes in non-
traditional and market-oriented economies” (Alfonso et al., 2008). Lastly, Alfonso et
al. mention that government policies such as taxes, public expenditures and other
regulatory policies have direct and indirect impact of the income distribution of the
country.
Analyses of the income distribution across countries discover that income per
capita tends to converge and the inequality in the personal income continues to
increase (Heshmati, 2006). Papatheodoru (2000) states that the social characteristics
and personal attributes of the households influence income inequality in certain
countries.
3.1.2. Income Mobility and Its Determinants
The persistent high income inequality denotes a wide gap between the rich and
the poor. This implies difficulty in social mobility, which is defined the ability of
households to move “from one social class to another” (Prais, 1955). The fundamental
assumption of the theory on social mobility is the movement of individuals along the
23
social structure after spending a certain amount of time in one class. The length of
time spent in a particular social class is considered as an indicator of the degree of
social mobility. Although this concept encompasses numerous aspects of society, a
sub-branch that is a recurring subject of economic research is income mobility.
Likewise, this aspect will be the focus of the study. Some of the factors identified as
determinants of income mobility are demographic characteristics, physical capital and
labor market resources.
The efficiency wage model postulates that the compensation workers receive for
their services is commensurate to their productivity. However, the Theory of
Discrimination argues that their personal characteristics, albeit unrelated to
productivity, are also valued in the market (Arrow, 1971). This means that the
distinguishing traits of an individual are actually considered during the decision
making process. A concept introduced by Becker in his 1957 book The Economics of
Discrimination is statistical discrimination, which refers to “situations of
discrimination on the basis of beliefs that reflect the actual distributions of
characteristics of different groups” (Autor, 2003). Its main premise is that firms have
limited information on the skills of job applicants; hence, this gives them an incentive
to rely on easily observable characteristics, such as race or gender, to infer the
expected productivity of applicants (Autor, 2003).
Furthermore, human capital can be defined as “any stock of knowledge or
characteristics that a worker has (either innate or acquired) that contributes to his or

24
her productivity” (Acemoglu & Autor, n.d.). The relevant view on human capital is
called the Bowles-Gintis view, which asserts that firms would pay higher wages for
more educated workers. An accompanying theorem to the Theory of Human Capital is
the Separation Theorem. This assumes that “with perfect capital markets, schooling
decisions will maximize the net present discounted value of the individual” (Acemoglu
& Autor, n.d.).
When speaking of human capital, a discussion on education and returns to
education cannot be avoided. With this, it can be said that the opportunity cost of a
year of schooling is the foregone earnings. This implies that the benefit has to be
commensurate with these foregone earnings for an individual to have an incentive to
enroll in another year of education. Thus, this should lead to a proportional increase
in earnings in the future (Acemoglu & Autor, n.d.).
Apart from personal characteristics, market forces can likewise influence the
amount of income received by an individual. According to the Market Theory of
Income Distribution, the remuneration received by productive factors, such as labor,
is tantamount to the market prices determined by supply and demand (Scitovsky,
1964). In other words, the industry in which a worker chooses to offer his productive
services can affect his level of earnings through the forces interacting in the market.
Likewise, a household’s mobility may be hastened or impeded by the major
sources of its income. For instance, Kalecki’s Theory of Income presents that the
percentage gross profit margin added by entrepreneurs to their marginal or average

25
cost in order to determine the price of output is a significant determinant of the
income distribution (Scitovsky, 1964).
The aforementioned theories serve as the foundation for the empirical analysis
on the income mobility of the panel of households. Particularly, the model and
working equation will be grounded on these economic concepts.
3.2 Empirical Framework
Since the theoretical foundation of this study has now been established, the
technicalities and procedures that will be carried out throughout the research will
now be discussed. First, the general operational framework will be described. Second,
the model and the estimation procedure that will be employed in the study will be
discussed. Lastly, another methodology applicable to the study will be discussed,
3.2.1 Multinomial Logit Regression
One of the objectives of this research is to identify the factors that affect the
mobility of the households. Given the qualitative nature of the response variable, the
researchers will employ the multinomial logit model that is patterned after Torche
and Lopez-Calva (2012). This is often used when estimating “categorical placement in
or the probability of category membership on a dependent variable” given a set of
independent variables (Starkweather&Moske, n.d). This will allow the researchers to
estimate the probabilities of the households’ mobility as well as identify the
significant factors affecting their movement.

26
Greene (2003) provides a general multinomial logit model to determine the
probabilities of outcome J + 1 given a set of characteristics xi. That is,
Prob(𝑌𝑖 = 𝑗|𝑥𝑖) =𝑒𝛽𝑗
′𝑥𝑖
1 + ∑ 𝑒𝛽𝑘′𝑥𝑖𝐽
𝑘=1
for j= 0, 1,…,J; β0 = 0
Using this model, the J log-odds ratios can also be computed. It is given by
ln [𝑃𝑖𝑗
𝑃𝑖𝑘] = 𝑥𝑖
′(𝛽𝑗 − 𝛽𝑘) = 𝑥𝑖′𝛽𝑗
if k = 0
This will provide the odds of having an outcome j given the set of
characteristics1. Also, the contribution and effect of a character x to the odds ratio is
given by the beta coefficient 𝛽 and its sign.
3.2.2 Post-estimation procedures
The previous equation merely estimates the coefficients of the characteristic xi
that affects the log odds ratio. In order to infer deeper insight from the model, post-
estimation procedures are performed. To capture the marginal effect of each
characteristic to the probability of an outcome, the following equation is employed:
𝛿𝑗 =𝜕𝑃𝑗
𝜕𝑥𝑖= 𝑃𝑗 [𝛽𝑗 −∑𝑃𝑘𝛽𝑘
𝐽
𝑘=0
] = 𝑃𝑗[𝛽𝑗 − �̅�]
1 The underlying assumption for this model is that the outcomes J are independent of each other. This property of multinomial logit model is called the independence from irrelevant alternatives (Greene, 2012).

27
In addition, different simulations will be run to determine the effects of changes
in the characteristics alongside with the effects of the different combinations of the
characteristics to the log odds ratio.
With this, Torche and Lopez-Calva (2012) are able to determine the factors
affecting mobility of the middle class in Chile and Mexico2 on which this research is
based. Furthermore, the same model is replicated for this study; however, a more in-
depth analysis is made.
3.2.3 Model Specification
As mentioned above, a multinomial logit regression model will be used in order
to capture the mobility of the panel households in 2003 and 2009. The model
employed is
ln [𝑃(𝑀𝑂𝐵𝐼)𝑖𝑗
𝑃(𝑀𝑂𝐵𝐼)𝑖𝑘] = 𝛽0 + 𝐸𝐷𝑈𝐶𝛽1 + 𝐹𝑆𝐼𝑍𝐸𝛽2 + 𝐶𝐻𝑂𝐶𝐶𝑈𝑃𝛽3 +𝑀𝐴𝑅𝑅𝐼𝐸𝐷𝛽4 + 𝑆𝐸𝑋𝛽5 + 𝐴𝐺𝐸𝛽6
+ 𝐷𝐸𝑃𝐸𝑁𝐷𝛽7 + 𝐶𝐴𝑃𝐴𝐵𝐿𝐸𝛽8 + 𝑇𝑂𝑇𝐴𝐿𝐸𝑀𝑃𝛽9 +𝑊𝐼𝐹𝐸𝑀𝑃𝛽10 + 𝑂𝐶𝐶𝑈𝑃𝑛𝛽𝑛 + 𝑢𝑖
where i = household 1, 2,…,6517
j = 0, 1, 2
n = 0, 1, 2,…,9
2Using panel household survey data in 2001-2006 and 2002-2005 respectively, Torche and Lopez-Calva (2012)
have focused on factors pertaining to demographic characteristics, labor market resources and shocks affecting the household.

28
The demographic characteristics, such as the age, sex and marital status of the
household head, are patterned after Torche and Lopez-Calva (2012). For this
research, the employment status of the household head’s spouse and the regional
location of the household are included in the analysis of the demographic
characteristics.
The household head’s educational attainment, the change in the total number of
employed members, and the change in the size of the family are used to determine the
effect of household labor market resources as likewise patterned after Torche and
Lopez-Calva (2012). In addition, the change in the composition of the family size is
also analyzed. The change in the total number of dependents and capable members
also form part of the household’s labor market resources.
Another part of the household’s labor market resources is the occupational class
in which the household is employed or engaged in. This will capture the effect of the
type of occupation of the household head to the mobility of the household.
Furthermore, the effect of the change in the occupational status is also considered in
order to measure the effect of a shift from a higher to a lower ranked occupation and
vice versa.

29
Chapter 4: DATA AND METHODOLOGY
For the purposes of this study, a panel household data from the 2003 and 2009
Family Income and Expenditure Survey undertaken by the National Statistics Office is
used. The Stata 11 software also serves as the instrument in implementing the
framework discussed in the previous chapter and in performing an analysis on the
income mobility of the panel of households.
4.1 Selection of Observations
As a large-scale survey that attempts to capture income and expenditure data in
the Philippines, the Family Income and Expenditure Survey adopts overall sampling
fractions to determine an adequate and appropriate sample size per region. For the
2003 and 2009 survey periods being examined, approximately 51,000 households
were identified and included in the overall sample. However, in order to conduct a
sound study on mobility, it is required that the same households be observed over the
6-year period covered, i.e., 2003 - 2009.
To do this, the researchers requested a specially-processed panel of households
from the FIES division of the National Statistics Office. With the data sorted based on
the aforementioned specification, the panel yielded 6, 517 households that were
surveyed in both 2003 and 2009. The substantial decrease in the data sample may be
accounted for by the attrition rate of 75% per survey year. This means that only 25%

30
of the households included in the master sample of the previous year are retained for
the next survey period.
4.2 Variables
4.2.1. Dependent Variable
Since data describing the mobility of households are not readily available in the
FIES, the researchers generated a variable that would characterize the movement of
the sample members along the income strata. Serving as the dependent variable, this
was called ‘Mobility’ and is reflected as ‘MOBI’ in the data set. It encompasses all
possible outcomes faced by the households, particularly: (0) downward mobility, (1)
immobility and (2) upward mobility.
The value to be assigned to each household is derived by comparing the national
per capita income decile to which it belonged in 2003 and 20093. If the rank of the
household under observation diminished over this period, it will be assigned a value
of 0, signifying the occurrence of downward mobility. Meanwhile, a number of 1 will
be designated to households that experienced immobility, meaning its income
classification did not change between 2003 and 2009. Finally, those that were upward
mobile, or whose rank improved, will be given a value of 2.
To prevent the misinterpretation of results, it is important to note that any
change in rank or income decile, regardless of its magnitude, is still considered
3The classification of the households according to decile was obtained from the 2003 and 2009 Family Income and Expenditure Survey. The 1stdecile is considered as the lowest stratum and the 10thdecile is the highest.

31
upward or downward mobility. For instance, a household which reached the 8thdecile
in 2009 from the 7th in 2003 has undergone the former. Conversely, a member of the
sample whose rank dropped from the 3th decile in 2003 to the 2nd in 2009
experienced the latter.
In addition, although the dependent variable was derived using the income
deciles provided by the FIES, it should be clarified that the analysis performed in this
study will focus on the three general income classes, particularly the: (1) lower class,
(2) middle class and (3) upper class.
In aggregating the ten initial classes into three, the criterion employed by
Solimano (2009) was adopted. Based on their study, the lower class is composed of
the 1st and 2nddeciles while the middle class encompasses the 3rd to the 9thdecile.
Lastly, the upper class is comprised solely of the 10thdecile.
4.2.2. Independent Variables
Region. According to the data dictionary of the Family Income and Expenditure
Survey, “a region is a subnational administrative unit comprising of several provinces
having more or less homogenous characteristics, such as ethnic origin of inhabitants,
dialect spoken, agricultural produce, and others (National Statistics Office, 2013). The
Census 2000 Regional Composition was employed as the coding system of the survey,
resulting in the Philippines being subdivided into 17 regions. Of these, 8 are situated
in Luzon, 6 in Mindanao and 3 in Visayas (National Statistics Office, 2013). The

32
succeeding table shows a list of the regions and the corresponding value assigned to
it:
Region Value Region I – Ilocos Region 1
Region II – Cagayan Valley 2 Region III – Central Luzon 3
Region IVA – CALABARZON 41 Region IVB – MIMAROPA 42
Region V – Bicol 5 Region VI – Western Visayas 6 Region VIII – Central Visayas 7 Region VIII – Eastern Visayas 8
Region IX – Zamboanga Peninsula 9 Region X – Northern Mindanao 10
Region XI – Davao 11 Region XII – SOCCKSARGEN 12
National Capital Region 13 Cordillera Administrative Region 14
Autonomous Region in Muslim Mindanao
15
Region XIII – CARAGA 16 Table 4.5 Regions in the Philippines and their Corresponding Values
Level of Education. The value of the variable reflected in the data represents
the level of education attained by the household head. An individual is considered to
be an undergraduate if he did not obtain a diploma for a certain level. Conversely,
graduates are characterized by the attainment of a diploma or certificate. The table
below shows the corresponding value for each category under the level of education:

33
Level of Education Value No Grade Completed 0
Elementary Undergraduate 1 Elementary Graduate 2
High School Undergraduate 3 High School Graduate 4
College Undergraduate 5 College Graduate 6
Post Graduate 7 Table 4.6 Level of Education Attained by HH Head and its Corresponding Value
Family Size. The family size of a household “refers to the total number of family
members enumerated” (National Statistics Office, 2013)4. To obtain a more
meaningful inference, the researchers obtained the change that occurred in the family
size of the households in the years 2003 and 2009.
Occupation5. Occupation is defined as the type of work, trade or profession an
individual is engaged in during the period concerned (National Statistics Office, 2013).
If the respondent was at work at the time of the interview, the variable represents
“the kind of work he was doing or will be doing if merely waiting for a new job to
begin within twoweeks” (National Statistics Office, 2013).The succeeding table
presents a list of categories under occupation and the associated value:
4 Members whose relationship with the household head can be classified as any of the following is considered
in the count: spouse, son, daughter, father, mother, son-in-law, daughter-in-law, sister, brother,
granddaughter/grandson, other relative
5 Note that in the model, instead of making this variable as a category, the researchers segregated this variable into OCCUP0, OCCUP1, OCCUP2, …, OCCUP9

34
Occupation Value Officials of Government and Special-Interest
Organizations, Corporate Executives, Managers, Managing Proprietors and Supervisors
1
Professionals 2 Technicians and Associate Professionals 3
Clerks 4 Service Workers and Shop and Market Sales
Workers 5
Farmers, Forestry Workers and Fishermen 6 Trades and Related Works 7
Plant and Machine Operators and Assemblers 8 Laborers and Unskilled Workers 9
Special Occupations 0 Table 4.7 Types of Occupation and their Corresponding Values
Apart from classifying the households based on the head’s occupation as of 2003,
the researchers also accounted for the changes in occupational class that occurred
between 2003 and 2009. The method implemented by Torche and Lopez-Calva
(2012) serves as the basis for the procedure employed in measuring this change.
Using the ranking of occupations provided in the Philippine Standard
Occupational Classification (PSOC), the variable indicating a shift from one class to
another is generated by obtaining the difference between the household’s rank in
2003 and 2009. The PSOC ranking is reflected in the table previously shown. The 1st
rank, comprised of officials of government and special-interest organizations,
corporate executives, managers, managing proprietors and supervisors, is considered
as the highest while laborers and unskilled workers, associated with a value of 9, are
considered the lowest. Hence, the variable CHOCCUP receives a positive value when

35
the household head’s occupational rank decreases and a negative value when it
increases. It is also important to note that special occupations serve as a catch-all
category for occupations that cannot be classified into the other classes.
Marital Status. This variable is composed of only two categories: (0) not
married and (1) married. The former encompasses all other possibilities apart from
the household head being married. In particular, these are: (1) single, (2) widowed,
(3) divorced/separated and (4) unknown.
Sex. Sex is defined as the categorization of individuals as either man or woman
based on their biological and physiological characteristics (World Health
Organization, n.d.). The sex of the household head is recorded as “1” for male and “2”
for female.
Age. The Family Income and Expenditure Survey recorded the age of the
household head in terms of the number of years completed. In other words, the value
reflected in the survey is his age as of his last birthday (National Statistics Office,
2013).
Number of Dependents. The number of dependents is composed of household
members that are aged 14 and below as well as 60 and above. This variable was
derived by getting the total number of dependents for years 2003 and 2009 and
subtracting the total in the second year to the first year.
Number of Members Capable of Working. The number of members capable of
working comprises of household members who are treated as part of the working age

36
population. In other words, these are individuals who are within the age of 15 – 59
and are “considered to be able and likely to work” (Working-Age Population, n.d.).
This variable is derived by getting the total number of capable members for both
2003 and 2009 and subtracting the total in 2009 to the total in 2003.
Total Number of Employed Members. This variable represents “the number of
family members including the head who were employed for pay or for profit during
the past six months” (National Statistics Office, 2013).
Employment Status of Spouse. The employment status of the spouse
“determines if the spouse of the family head was employed for pay or for profit for the
past six months” (National Statistics Office).The following are the assigned values for
each of the possible categories:
Status Value Employed 1
Not Employed 2 Not Applicable 3
Table 8.4 Employment Status of Household Head’s Spouse and its Corresponding Values
4.3 Methodology
This research is divided into three different phases in order to obtain a deeper
understanding of income mobility in the Philippine. This will ensure that the
conclusion and economic policy recommendations derived are sound and supported
by the results.
37
Before delving in which factors ultimately have the most significant effect on the
probability of the households to experience mobility, it is important to first identify
who are the middle class among the panel households. This will be done by creating a
profile for the middle class which includes the demographic characteristics as well as
the occupational background of the household head. After which, the persisting
mobility trends within the factors will be determined.
The second part of the research will be the regression analysis and the
identification of the significant factors that would affect the mobility of the middle
class. Diagnostic tests will also be done in order to ensure that no violations are
committed using the model.
Lastly, post-estimation procedures will be performed in order to simulate the
probabilities of having certain characteristics. This will allow the researchers to
compare the different households in terms of experiencing mobility as well as
providing insight on which factors these households may improve, or how certain
economic policies will affect their mobility.
38
Chapter 5: RESULTS AND ANALYSIS
5.1 Descriptive Statistics
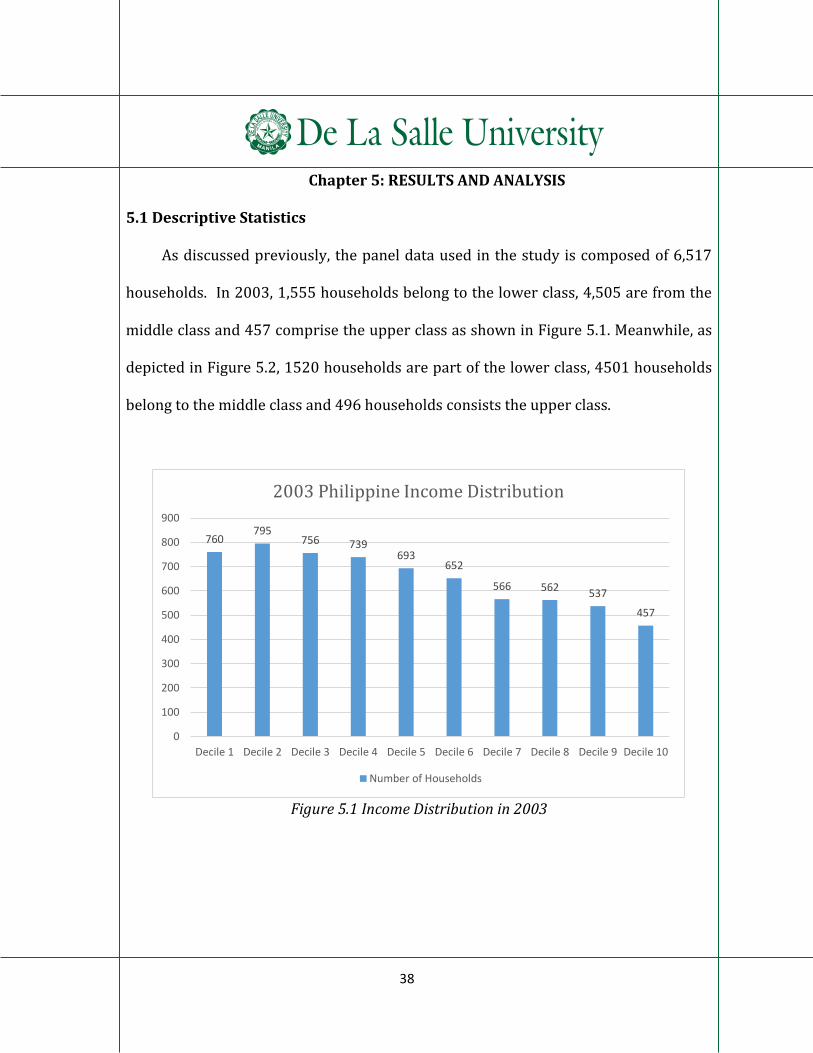
As discussed previously, the panel data used in the study is composed of 6,517
households. In 2003, 1,555 households belong to the lower class, 4,505 are from the
middle class and 457 comprise the upper class as shown in Figure 5.1. Meanwhile, as
depicted in Figure 5.2, 1520 households are part of the lower class, 4501 households
belong to the middle class and 496 households consists the upper class.
Figure 5.1 Income Distribution in 2003
760795
756 739693
652
566 562537
457
0
100
200
300
400
500
600
700
800
900
Decile 1 Decile 2 Decile 3 Decile 4 Decile 5 Decile 6 Decile 7 Decile 8 Decile 9 Decile 10
2003 Philippine Income Distribution
Number of Households

39
Figure 5.2 Income Distribution in 2009
These can be attributed to the movement of the households along the income
strata. Upward mobility is experienced by 38.70% of the households while 35.02%
underwent downward mobility. Immobile households are 26.29% of the sample.
These are summarized in Figure 5.3.
758 762 753
690662 646
607568 575
496
0
100
200
300
400
500
600
700
800
900
Decile 1 Decile 2 Decile 3 Decile 4 Decile 5 Decile 6 Decile 7 Decile 8 Decile 9 Decile 10
2009 Philippine Income Distribution
Number of Households

40
Figure 5.3 Mobility of Sample Households
9.27% of the households came from the Region-IVA which is composed of Cavite,
Laguna, Batangas, Rizal, and Quezon. Meanwhile, 8.45% of the households are from
Region 3 – Central Luzon and 8.06% reside Region VI – Western Visayas. Only 6.72%
are from the National Capital Region (NCR).
Most of the household heads are male (85.45%). The average age of the
household head is 48 years old. The youngest household head is 17 years old while
the oldest is 99 years old. 5,443 out of the 6,517 households are married.
Based on the educational attainment of the household head, 25.04% of the
household heads are elementary undergraduate while 8.03% are college graduates.
The sample has an employment rate of 87.28%. Farmers, forestry workers and
228235.02%
171326.29%
252238.70%
0
500
1000
1500
2000
2500
3000
Downward Mobile Immobile Upward Mobile
Freq
uen
cy
Mobility of Sample Households
Number of Households

41
Total 758 762 753 690 662 646 607 568 575 496 6,517 Tenth Decile 0 0 2 1 8 7 26 50 126 237 457 Ninth Decile 0 1 5 13 23 32 55 104 167 137 537 Eight Decile 1 8 21 34 32 66 93 124 121 62 562 Seventh Decile 9 13 31 42 69 94 98 108 68 34 566 Sixth Decile 17 27 63 84 93 112 105 87 48 16 652 Fifth Decile 28 57 95 120 132 110 90 35 19 7 693 Fourth Decile 53 111 110 132 132 94 64 29 13 1 739 Third Decile 121 146 169 106 83 66 34 24 7 0 756 Second Decile 191 204 145 93 63 55 33 5 5 1 795 First Decile 338 195 112 65 27 10 9 2 1 1 760 decile First Dec Second De Third Dec Fourth De Fifth Dec Sixth Dec Seventh D Eight Dec Ninth Dec Tenth Dec Total capita income FIES09: National per capita income decile National per FIES03:
fishermen comprise 40.35% of the household heads. It is followed by laborers and
unskilled workers and officials of government and special-interest organizations,
corporate executives, managers, managing proprietors and supervisors with 18.27%
and 11.64% respectively. Moreover, 40.94% of the household heads have a spouse
that is currently employed.
5.1.1 Intra-generational mobility across income classes
While there is only a small difference between the percentage of families
classified as upward or downward mobile, the results shown in the table can still be
considered as a positive indicator of mobility since more households were able to
improve their ranking along the income strata.
Table 5.1 Transition Matrix

42
Table 5.1 provides a graphical representation6 of the mobility of the households
along the income strata. It shows the actual number of people moving from one decile
to another. The x-axis represents the decile classification of households in 2003 while
the y-axis illustrates the percentage of households in a particular decile in the base
year that shifted to another class in 2009. Generally, the trend across all income
deciles shows that majority of the households tend to stay in their income decile from
2003 to 2009. Although, those who are in the lower income deciles tend to go one
decile up while those in the high income decile tend to go a decile or two down.
It can be seen that those in the lower class (first and second decile) have stayed
in the same decile while some have moved up to the lowest middle class decile and a
small percentage have moved up to higher deciles in 2009. The households classified
as the middle class (third to ninth decile) have moved within the same decile range in
2009. However for those in the lower middle class, it can be seen that a number of
households have fallen to lower class in 2009. Meanwhile, for the upper class,
majority has remained in their income decile in 2009 and some households have
fallen one income decile down. This phenomenon will be analyzed in the discussions
below.
6 The transition matrix merely provide the number of households moving in and out of income deciles. A Markov analysis is not use in this thesis because of its assumption that the households will not change, i.e. the characteristics of the households must be time-invariant. However, the variables of interest are time-variant, therefore it is not practical for the researchers to follow the Markov analysis.

43
Figure 5.4 Mobility Patterns across Different Regions
On a provincial level, 13 of the regions in the Philippines indicate that upward
mobility was more evident than either of the two other possibilities for movement. Of
these, Region XII or SOCCSSARGEN, whose acronym stands for South Cotabato,
Cotabato, Sultan Kudarat, Sarangani and General Santos City, registered the highest
incidence at 45.16%. It is followed closely by Region VI or Western Visayas with
44.95%. The average for all regions is 40.47%.
On the other hand, downward mobility was more rampant in 4 regions,
particularly in the NCR, Cordillera Administrative Region (CAR), Autonomous Region
in Muslim Mindanao (ARMM) and Region IVA, otherwise known as CALABARZON and
comprises Cavite, Laguna, Batangas, Rizal and Quezon. ARMM registers the highest
0%10%20%30%40%50%60%70%80%90%
100%
Mobility Patterns across Different Regions in the Philippines
Downward Mobile Immobile Upward Mobile

44
incidence at 43.97% of the households experiencing a reduction in their rank. It is
succeeded by CAR, Region IVA and NCR with 42.15%, 41.56% and 36.07%
respectively.
Figure 5.5 Mobility Patterns across Different Levels of Education
On the educational attainment of the household head, high school graduates had
the highest occurrence of upward mobility (42.36%). It is followed by household
heads who elementary graduates (38.90%) and high school undergraduate (37.62%).
However, households which have high school undergraduate household heads had
the highest incidence of downward mobility (38.52%). Elementary undergraduate
(37.07%) and elementary graduate (35.66%) household heads also experienced
downward mobility.
65 605 495 302 437 232 1442
77413 353 193 295 166 209 7
92 614 540 289 538 276 170 3
0%10%20%30%40%50%60%70%80%90%
100%
Mobility Patterns across Different Levels of Education
Downward Mobile Immobile Upward Mobile

45
Figure 5.6 Mobility Patterns based on Household Head’s Sex
Upward mobility is experienced by 39% of the male household heads and
36.92% of the female household heads. 34.42% of the households headed by a male
while 38.50% of households headed by a female had downward mobility.
1917 365
1480233
2172 350
0%
10%
20%
30%
40%
50%
60%
70%
80%
90%
100%
Male Female
Mobility Patterns based on Household Head's Sex
Downward Mobile Immobile Upward Mobile

46
Figure 5.7 Mobility Patterns across Different Types of Occupation
Based on the occupation of the household head, farmers, forestry workers, and
fisherman reported the highest prevalence of upward mobility at 41.66%. It is
succeeded by laborers and unskilled workers and trades and related workers with
40.23% and 35.22% respectively. On the other hand, 40.66% of service workers and
shop and market sales workers had downward mobility. It is followed closely by
40.48% of officials of government and special-interest organizations, corporate
executives, managers, managing proprietors and supervisors. Also, 38.90% of plant
and machine operators and assemblers experienced downward mobility.
16 268 36 46 33 98 743 214 198 348
16 179 46 39 27 56596
152 129 273
16 215 24 40 38 87 956 199 182 418
0%10%20%30%40%50%60%70%80%90%
100%
Mobility Patterns based on Household Head's Occupation
Downward Mobile Immobile Upward Mobile

47
Figure 5.8 Mobility Patterns across Employment of Household Head’s Spouse
41.19% of the household head’s spouse that are currently employed experienced
upward mobility. On the other hand, 38.25% of the households with unemployed
household head’s spouse underwent downward mobility.
5.1.2 Characteristics of the Middle Class
There are 4,501 households distributed evenly across the deciles that belong to
the middle class in 2009 as depicted in Figure 5.9.
836925 521
733656
324
1099837
586
0%
10%
20%
30%
40%
50%
60%
70%
80%
90%
100%
Employed Not Employed Not Applicable
Mobility Patterns based on the Employment Status of Household Head's Spouse
Downward Mobile Immobile Upward Mobile

48
Figure 5.9 Income distribution of the middle class
Most of the household heads are male (84.74%). The average age of the
household head is 48 years old. The youngest household head is 17 years old while
the oldest is 99 years old. 3,698 out of the 4,505 households are headed by couples
who are married. Geographically, 10.64% of the middle class reside in Region IV-A
Calabarzon and Region III – Central Luzon. 7.29% of the middle class are from the
National Capital Region.
0
200
400
600
800
Fre
quency
2 4 6 8 10DECILE09

49
Figure 5.10 Region
Based on Figure 5.11, 22.33% of the household heads of middle class families are
high school graduates. While 21.82 of the household heads are elementary
undergraduates, 312 are college graduates and only 3 have post-graduate diploma.
Figure 5.11 Educational Attainment
353278
452 479
167
256
367321
210160 189
234 225
328
190 158 134
0
100
200
300
400
500
600
Regional Distribution of Middle Class Households
Number of Households
135
982 963
569
1005
532
312
30
200
400
600
800
1000
1200
Educational Attainment of Heads of Middle Class Households
Number of Households

50
The employment rate of the household heads that belong to the middle class is
86.43%. Under the classification set by the FIES, 37.15% of the household head are
farmers, forestry workers and fishermen. Laborers and unskilled workers comprise
16.89% of the middle class household heads. Meanwhile, 12.42% are officials of
government and special-interest organizations, corporate executives, managers,
managing proprietors and supervisors. Furthermore, 41.95% of the household head’s
spouses are employed.
5.1.3 Socioeconomic and Demographic Characteristics of Mobile
Households
5.1.3.1 Inward Mobility
845 households or 12.97 percent of the total surveyed population entered into
the middle class from the year 2003 to 2009. Based on the mobility pattern shown
below, 73.96% of the households experienced upward mobility while 26.04%
underwent downward mobility.

51
Figure 5.12 Inward mobility pattern
Figure 5.13 Income decile source of inward mobile households
220
625
0
100
200
300
400
500
600
700
Number of Households
Mobility Pattern towards the Middle Class
From Upper Class From Lower Class
226
399
220
0
50
100
150
200
250
300
350
400
450
Number of Households
Mobility Pattern towards the Middle Class
From Decile 1 From Decile 2 From Decile 10

52
Moreover, 47.22% of the households that entered the middle class came from
the 2nd decile of the income distribution (Figure 5.13). The movement of the
household along the income strata led to the middle class composition depicted in
Figure 5.14 where 259 out of the 845 mobile households lie in the 3rd decile.
Figure 5.14 Income decile destination of mobile household
Figure 5.15 Region of inward mobile households
050
100
150
200
250
Fre
quency
2 4 6 8 10DECILE09
5144
36
64
35
6773 68
53
73
39 37
6149
3037
28
01020304050607080
Regions of Origin of Inward Mobile Households
Number of Households

53
Male household heads comprise 87.10% of the sample that entered the middle
class. The average age of the household head is 48 years old. The youngest household
head is 17 years old while the oldest is 88 years old. 732 out of the 845 households
are headed by married couples. Moreover, 8.73% of the households came from Region
VI – Western Visayas and Region IX – Zamboanga Peninsula. It is followed by
households from Region VII – Central Visayas and Region 5 – Bicol, with 8.05% and
7.93%, respectively. Only 5.80% of the households came from the NCR as shown in
Figure 5.16.
Based on Figure 5.16, 29.47% are elementary undergraduate while 21.54%
finished elementary. High school graduate household heads also entered the middle
class (16.57%).
Figure 5.16 Educational attainment of HH of inward mobile households
37
249
182
83
140
8766
10
50
100
150
200
250
300
Educational Attainment of Heads of Inward Mobile Households
Number of Households

54
88.28% of the household heads that entered the middle class are employed.
Most of the household heads are farmers, forestry workers and fishermen (48.53%).
Moreover, 43.91% of the spouse also has a job.
5.1.3.2 Outward Mobility
Figure 5.17 Outward mobility pattern
Based on Figure 5.17, 849 households leave the middle class. 30.27% moved to a
higher income class while 69.73% fell into lower income class. 31.45% of the
households which belong to the 3rd decile moved out of the middle class.
592
257
0
100
200
300
400
500
600
700
Number of Households
Outward Mobility Pattern of the Middle Class
Towards Lower Class Towards Upper Class

55
The key characteristics of the household heads that moved out of the middle class
are as follows: 85.04% of them are male and 83.51% of them are married. On the
average, the household head is 47 years old. The youngest is 20 years old while the
oldest is 90 years old.
Figure 5.18 Region of outward mobile households
As shown in Figure 5.18, households from Region 3 – Central Luzon had the
highest incidence of outward mobility. It is succeeded by Region IV-B MIMAROPA,
which is composed of Mindoro, Marinduque, Romblon, and Palawan, with 8.24% and
Region VI – Western Visayas with 8.13%.
4549
72 70
37
52
69
59 62
33
45 44 46 4537
48
36
0
10
20
30
40
50
60
70
80
Regions of Origin of Outward Mobile Households
Number of Households

56
Figure 5.19 Educational attainment of HH of outward mobile households
Based on Figure 5.19, 27.09% are elementary undergraduate while 22.26%
finished elementary. High school graduate household heads also leave the middle
class (17.20%).
Employment rate of household heads that moved out of the middle class is
87.99%. The occupations of 40.83% of them are farmers, forestry workers and
fishermen. Furthermore, only 36.75% of the spouse also has a job.
5.2 Regression Results and Analysis
As mentioned in the empirical framework of the study, a multinomial logit
regression will be employed to calculate the contribution of a specific variable to a
household’s probability in experiencing downward mobility, immobility and upward
24
230
189
96
146
82 80
20
50
100
150
200
250
Educational Attainment of Heads of Outward Mobile Households
Number of Households

57
mobility. In particular, the age, sex, marital status, educational attainment, occupation
of the household head and the employment status of the spouse are verified as
possible regressands. Furthermore, the changes in the family size; number of
dependents, capable and employed members; and the shift in occupational class that
occurred between 2003 and 2009 are also measured.
For the regression analysis, downward mobility is chosen as the base category.
Hence, for variables having negative coefficients, this means that the base category,
i.e. downward mobility, is more likely to be the outcome for a unit increase of such
variable. Conversely, these variables can be considered as upward mobility factors if
the values are decreasing.
Multinomial Logit Regression7
Immobility Upward Mobility
𝛽 p>|z| 𝛽 p>|z|
AGE -0.0040 0.286 -0.0013 0.715
SEX 0.3043 0.115 0.0113 0.951
MARITAL 0.4432 0.022 0.0308 0.864
WIFEMP 2
-0.0531
0.541
-0.1116
0.183
3 -0.0709 0.639 -0.1038 0.467
REGION 2
-0.3199
0.156
-0.0955
0.640
3 -0.1558 0.450 -0.1516 0.432
5 0.1360 0.528 0.1661 0.416
6 0.1308 0.537 0.3772 0.053
7 0.1985 0.345 0.2059 0.302
8 0.0261 0.907 0.1069 0.612
9 0.9928 0.000 0.8457 0.000
7 The base category for the model is downward mobility (0).

58
10 0.2122 0.344 0.0364 0.867
11 0.1060 0.629 0.0047 0.982
12 -0.0698 0.761 0.2749 0.187
13 0.0861 0.699 -0.4211 0.060
14 -0.3799 0.116 -0.5270 0.022
15 -0.3930 0.094 -0.5728 0.011
16 0.4851 0.043 0.3244 0.165
41 -0.2425 0.230 -0.2504 0.186
42 0.3985 0.081 0.0962 0.669
EDUC 1
-0.8749
0.000
-0.6927
0.003
2 -0.8764 0.000 -0.5695 0.016
3 -0.6176 0.000 -1.0377 0.012
4 -1.018 0.000 -0.3689 0.130
5 -0.8903 0.001 -0.1760 0.495
6 -0.1606 0.568 -0.0124 0.966
7 0.8498 0.459 0.6706 0.590
OCCUP0 0.3243 0.446 -0.2062 0.643
OCCUP1 -0.0416 0.810 -0.2844 0.087
OCCUP2 0.1678 0.616 -0.6145 0.098
OCCUP3 0.0137 0.959 -0.4013 0.140
OCCUP4 0.0002 0.999 -0.1577 0.620
OCCUP5 -0.1464 0.507 -0.0743 0.718
OCCUP6 0.1174 0.311 0.2152 0.050
OCCUP7 0.0085 0.955 -0.1494 0.303
OCCUP8 -0.2470 0.111 -0.3605 0.014
OCCUP9 omitted
CHOCCUP -0.0539 0.001 -0.0617 0.000
FSIZE -0.2657 0.000 -0.5010 0.000
DEPEND -0.0747 0.011 -0.1467 0.000
CAPABLE 0.0614 0.093 0.0804 0.021
TOTALEMP 0.1882 0.000 0.3396 0.000
Prob > chi2 0.000
Pseudo R2 0.0913
Table 5.2 Regression Results

59
The regression results show that generally the composition of the households
ultimately affect the mobility of the households. While some factors of occupation as
well as the location of the households are relevant to mobility, it is the change in the
number of households and the kind of household members that have a significant
effect. This implies that the source of capital, i.e. the human capital, plays an important
role in the improvement of the lives of the households as indicated by its income
mobility. Nurturing and developing the potential and existing source of capital of the
household through proper and sufficient education will ultimately push for greater
income mobility.
5.2.1. Downward Mobility Factors
Change in Occupational Status (CHOCCUP). As mentioned in the previous
chapter, the positive change in occupational status would mean a decrease in the
ranking of the occupation. In the regression results, it can be seen that both
immobility and upward mobility have negative coefficients for CHOCCUP indicating
that the household is more likely to experience downward mobility as the household
head’s occupation changes from a higher to a lower rank.
This can be attributed to the wage differential that exists between these types of
occupations due to the difference in labor conditions and requirements or
qualifications. For instance, as one shifts to higher ranking occupations, the level of
education demanded likewise increases. Based on the theories on human capital

60
presented in the framework, this would entail higher compensation for the higher
level of skills possessed by an individual, increasing the probability of the household
in experiencing upward mobility. Furthermore, workers in lower ranking occupations
may not enjoy the same level of job security as those in the higher ranks. It is possible
that they may have to frequently seek other forms of employment to attain regular
income. Another possible explanation would be the few prospects or opportunities for
career growth available to those in low ranking occupations. This reduces their ability
to generate more income through higher positions in the employment ladder. Other
occupational factors that can be considered include the immobility of labor, the
nature of employment and union protection.
Change in Family Size (FSIZE). To reiterate, the positive value in the change
in family size would mean that the household’s size increased from year 2003 to year
2009. Hence, as the family size increases, the probability of experiencing downward
mobility also increases relative to both immobility and upward mobility. This is in
accordance with a priori expectations since an additional member in the family would
entail higher living expenses. Furthermore, given a fixed amount of income, the
household would encounter more difficulty in sustaining its daily needs. Therefore,
the proportion of income allocated to productive activities that could further aid the
family is sacrificed and reduced, increasing the probability of downward mobility.

61
Change in number of dependent members (DEPEND). The number of
dependents in a household has a significant effect on the mobility of a household. As
the number of dependents increases relative to the number of employed members in
the households, the higher the expenses the household is incurring. Hence, the
household’s income may only be enough, if not insufficient, to cover the expenses and
to have higher income resulting in downward mobility. The same analysis as that for
the change in family size can be considered.
Educational Attainment (EDUC). The level of educational attainment of the
household head has a varying effect on the household’s mobility. For lower
educational level, an intuitive result shows that the household is more likely to
experience downward mobility compared to immobility and upward mobility. As for
higher educational level that has counter-intuitive signs, it is possible that those
households, who are more or less in the middle class, have experienced a downward
movement of 1 to 2 deciles.
Based on economic theory, it is generally individuals who have lower
educational attainment that receive less compensation than those who achieved
higher levels. Employers see this as an indicator of their productivity or skill level and
therefore give a wage rate commensurate to this. While the result on the lower levels
of education is supported by the theoretical framework, the counter-intuitive or
ambiguous outcome for higher levels may be explained by other factors not

62
considered. For instance, a particular household may have possessed certain
characteristics that increased its probability of downward mobility and negated the
possible contribution of additional education to upward mobility.
Region (REG). Although most of the regions do not significantly affect the
mobility of the households, two notable regions have a significant effect on the
household’s mobility, particularly downward mobility. Being a household in the
Cordillera Administrative Region or in the Autonomous Region in Muslim Mindanao is
associated with a higher chance of experiencing downward mobility relative to
upward mobility. In fact, about 42.15% and 43.97% of the households living in the
CAR and ARMM regions respectively experienced downward mobility. A possible
explanation for this may be the slowdown of economic growth experienced by CAR in
2003. Likewise, ARMM experienced the lowest gross regional domestic product in
2003 with 0.92% (NSCB, 2004). In addition, it is an area immersed in conflict, creating
an environment that is not conducive for wealth or income generation. Productive
activities may have been halted and resources may have been depleted in the course
of war between militant groups and the armed forces of the government, reducing
opportunities for households situated in this region to generate more income.

63
5.2.2 Upward Mobility Factors
Change in total number of capable members (CAPABLE). The capable
household members have the potential to help and be a source of additional income to
the household. An increase in this would mean having more potential sources of
income. Furthermore, this increases the proportion of income that the household can
allocate to productive avenues, such as investments, that could further enhance its
movement along the income strata. Hence, this would increase the probability of the
household to experience upward mobility. This is supported by the positive
coefficient of the CAPABLE variable.
Change in total number of employed members (TOTALEMP). In connection
with the previous variable, the household members who are actually employed are
additional sources of income of the household. The same analysis could likewise be
applied. Having more sources of income therefore would entail higher chances of
experiencing upward mobility.
Region (REG). While there are regions in which households have a higher
chance of experiencing downward mobility, there are also some regions that have an
impact on upward mobility. In particular, these are Western Visayas and the
Zamboanga Peninsula. This may be because of the improving quality of life in the
Western Visayas in 2003 wherein the poverty incidence has significantly decrease

64
from 44.40% in 2000 to 39.1% in 2003 (Defiesta & Dator-Bercilla, n.d). Although the
poverty incidence in Zamboanga Peninsula is relatively high compared to other
regions, it was able to downplay the poverty incidence in the region from 49.3% in
2003 to 45.3% in 2006 (Regional Development Plan, 2010).
5.3 Post-Estimation Analysis
5.3.1 Marginal Effects
Marginal Effects8 Downward Mobility Immobility Upward Mobility
dy/dx p-value dy/dx p-value dy/dx p-value AGE 0.0005 0.421 -0.0006 0.326 0.0001 0.852 SEX -0.0283 0.370 0.0569 0.076 -0.0287 0.391
MARITAL -0.0427 0.166 0.0815 0.013 -0.0388 0.241 WIFEMP
2
0.0164
0.254
0.0013
0.930
-0.0177
0.235 3 0.0172 0.490 -0.0029 0.905 -0.0143 0.569
REGION 2
0.0383
0.301
-0.0479
0.168
0.0096
0.796
3 0.0309 0.371 -0.0145 0.665 -0.0164 0.636 5 -0.0296 0.403 0.0087 0.804 0.0209 0.570 6 -0.0518 0.126 -0.0152 0.649 0.0669 0.057 7 -0.0391 0.257 0.0166 0.632 0.0225 0.530 8 -0.0139 0.706 -0.0059 0.870 0.0198 0.601 9 -0.1569 0.000 0.1001 0.011 0.0568 0.155
10 -0.0234 0.533 0.0381 0.314 -0.0147 0.702 11 -0.0102 0.781 0.0200 0.583 -0.0099 0.793 12 -0.0256 0.485 -0.0398 0.258 0.0655 0.084 13 0.0332 0.394 0.0587 0.136 -0.0919 0.017 14 0.0950 0.023 -0.0233 0.550 -0.0717 0.075 15 0.1015 0.013 -0.0222 0.559 -0.0793 0.044 16 -0.0752 0.051 0.0614 0.130 0.0138 0.737 41 0.0501 0.139 -0.0214 0.513 -0.0288 0.398 42 -0.0470 0.216 0.0706 0.073 -0.0236 0.550
EDUC 1
0.1434
0.000
-0.1068
0.011
-0.0366
0.357
8dy/dx for factor levels is the discrete change from the base level.

65
2 0.1309 0.000 -0.1192 0.005 -0.0117 0.771 3 0.1510 0.000 -0.1450 0.001 -0.0061 0.885 4 0.1210 0.001 -0.1647 0.000 0.0438 0.294 5 0.0892 0.017 -0.1615 0.000 0.0724 0.105 6 0.0150 0.712 -0.0349 0.501 0.0199 0.688 7 -0.1006 0.389 0.0942 0.592 0.0063 0.970
OCCUP0 -0.0072 0.922 0.0829 0.234 -0.0757 0.337 OCCUP1 0.0335 0.237 0.0211 0.462 -0.0546 0.067 OCCUP2 0.0495 0.416 0.0947 0.074 -0.1442 0.025 OCCUP3 0.0409 0.363 0.0435 0.326 -0.0844 0.086 OCCUP4 0.0165 0.767 0.0161 0.765 -0.0326 0.554 OCCUP5 0.0208 0.557 -0.0204 0.583 -0.0005 0.990 OCCUP6 -0.0330 0.083 0.0005 0.980 0.0325 0.092 OCCUP7 0.0149 0.546 0.0168 0.497 -0.0318 0.222 OCCUP8 0.0598 0.018 -0.0104 0.688 -0.0493 0.064 OCCUP9 omitted)
CHOCCUP 0.0113 0.000 -0.0040 0.142 -0.0073 0.010 FSIZE 0.0762 0.000 0.0003 0.959 -0.0765 0.000
DEPEND 0.0220 0.000 0.0007 0.883 -0.0227 0.000 CAPABLE -0.0139 0.022 0.0035 0.547 0.0104 0.086
TOTALEMP -0.0524 0.000 0.0013 0.832 0.0510 0.000
Table 5.3 Marginal Effects
Table 5.3 shows the marginal effects of each variable to the probability of
immobility, upward and downward mobility. That is, a one unit change in CAPABLE,
i.e. an increase in the number of capable household members, increases the
probability of upward mobility by 5.10%, and decreases the probability of downward
mobility by 5.24%. The same analysis is applicable for the rest of the variables.
It is important to note, however, that while the factors that determine the
households’ mobility are statistically significant, the marginal contribution to the
probability of actual mobility is small and close to zero. This implies that although the
variables are statistically significant, these do not fully determine the cause of

66
mobility of the households. Other factors not captured by the variables may have
more significance and may further explain the cause of mobility, or immobility of the
households. These may include factors such as the political condition of the country as
well as the conditions of the different industries in the Philippines, both of which are
not measurable in terms of household level.
5.3.2. Relative Risk Ratio
Another method of analyzing the effects of the variables to mobility is the use of
relative risk ratio (RRR). RRR indicates “how the risk of the outcome falling in the
comparison group compared to the risk of the outcome falling in the referent group
changes with the variable in question” (Introduction to SAS, n.d). When the RRR of a
variable is greater than 1, this indicates that the risk of the household’s mobility
falling in either immobility or upward mobility relative to downward mobility
increases as the variable increases. Conversely, when RRR < 1, the risk of the
household’s mobility falling in either immobility or upward mobility relative to
downward mobility decreases as the variable increases (Introduction to SAS, n.d). In
other words, RRR tells the risk of experiencing immobility, upward or downward
mobility given a change in the variables.

67
Relative Risk Ratio Immobility Upward Mobility RRR p>|z| RRR p>|z|
AGE 0.9960 0.286 0.9987 0.715 SEX 1.356 0.115 1.011 0.951
MARITAL 1.558 0.022 1.031 0.864 WIFEMP
2
0.9483
0.541
0.8944
0.183 3 0.9316 0.639 0.9014 0.467
REGION 2
0.7262
0.156
0.9089
0.640 3 0.8557 0.450 0.8593 0.432 5 1.146 0.528 1.181 0.416 6 1.140 0.537 1.458 0.053 7 1.220 0.345 1.229 0.302 8 1.026 0.907 1.113 0.612 9 2.699 0.000 2.330 0.000
10 1.236 0.344 1.037 0.867 11 1.112 0.629 1.005 0.982 12 0.9326 0.761 1.316 0.187 13 1.090 0.699 0.6564 0.060 14 0.6839 0.116 0.5904 0.022 15 0.6750 0.094 0.5639 0.011 16 1.624 0.043 1.383 0.165 41 0.7847 0.230 0.7785 0.186 42 1.490 0.081 1.101 0.669
EDUC 1
0.4169
0.000
0.5002
0.003
2 0.4163 0.000 0.5658 0.016 3 0.3543 0.000 0.5392 0.012 4 0.3612 0.000 0.6915 0.130 5 0.4103 0.001 0.8386 0.495 6 0.8517 0.568 0.9876 0.966 7 2.339 0.459 1.955 0.590
OCCUP0 1.383 0.446 0.8137 0.643 OCCUP1 0.9593 0.810 0.7524 0.087 OCCUP2 1.183 0.616 0.5409 0.098 OCCUP3 1.104 0.959 0.6694 0.140 OCCUP4 1.000 0.999 0.8541 0.620 OCCUP5 0.8638 0.507 0.9284 0.718 OCCUP6 1.124 0.311 1.240 0.050

68
OCCUP7 1.009 0.955 0.8612 0.303 OCCUP8 0.7812 0.111 0.6973 0.014 OCCUP9 omitted
CHOCCUP 0.9476 0.001 0.9402 0.000 FSIZE 0.7667 0.000 0.6509 0.000
DEPEND 0.9280 0.011 0.8636 0.000 CAPABLE 1.063 0.093 1.084 0.021
TOTALEMP 1.207 0.000 1.404 0.000 Prob > chi2 0.000 Pseudo R2 0.0913
Table 5.4 Relative Risk Ratio Results
The downward mobility factors discussed in the regression results are
consistent having less than 1 RRR. That is, for an increase in CHOCCUP, the risk of
being immobile or moving upward decreases by a factor of 0.948 and 0.940
respectively. Hence, assuming all else factors are held constant, the household will
more likely experience downward mobility as CHOCCUP increases, i.e. household
heads whose occupation have lower ranks are more likely to experience downward
mobility.
Likewise, factors associated with upward mobility have more than 1 RRR. This
means that the household is more likely to experience upward mobility for a change
in an upward mobility factor. Hence, an increase in CAPABLE increases the risk of
moving upward by a factor of 1.084 relative to the risk of moving downward. This
means that as the number of capable member increases, the household is more likely
to experience upward mobility.

69
Chapter 6: CONCLUSION AND POLICY RECOMMENDATION
As of the moment, the Philippines is regarded as one of the rising tiger
economies in Asia. However, despite the positive growth forecasts released by
numerous credible agencies, many citizens are not impressed and continuously hope
for progress in the country. While growth is clearly evident, development has yet to
be felt by Filipinos. This reality is reflected by the mobility of households in the
income classes. Only 38.70% of the households in the sample experienced upward
mobility while 35.02% underwent downward mobility. However, the middle class
population shrunk from 4,501 households or 69.28% of the sample population in
2009. This is alarming since related literature established that a robust middle class
serves as a catalyst for long-term economic growth and development.
Based on the regression results, occupation, composition of family, and
education are key factors that contribute to mobility. First, the number of family
members and the number of dependent members affect the mobility of the household.
Larger families have difficulty moving to a higher income class. More often than not,
they experience downward mobility. This can be due to inadequate earning of the
family to support their needs. Moreover, a fewer number of dependent members led
to upward mobility since more members of the family contribute to the household’s
income. These results suggest that there is a need for the government to intervene in
the growth of the population. The passage of the Reproductive Health and
Responsible Parenthood Law can promote economic development since it enables

70
citizens to have an informed choice regarding their families. Through this law, couples
will be able to maintain a manageable family size since there are birth control
instruments accessible in local health units or hospitals. Moreover, they will be
educated on the consequences of having many children on the quality of life.
Second, it is evident that education plays a vital role in the welfare of an
individual. With the changes in the curriculum of Philippine education, particularly
with the implementation of the K-12 program, the government aims to further
develop human capital in the country and equip Filipinos with the necessary tools to
become and remain competitive in the domestic and international labor market. In
addition to the K-12 program, one of the other policies that can be explored include
developing a special curriculum for adults aspiring to finish their education. This
would be similar to the night school system in order to accommodate those who
would like to study and work at the same time. Furthermore, the government can opt
to give additional subsidies for public schools and state universities to further
increase the likelihood of students finishing their education. Moreover, scholarships
for different fields of interest can be increased to encourage enrollment in areas that
would have less labor supply, high labor demand and consequently, higher pay
relative to others. The last suggested policy would, likewise, be related to occupation,
which is one of the variables found significant in the study. By engaging in higher
ranked and higher paid occupations, families will be able to increase their likelihood
of improving their standard of life and their placement along the income strata.

71
Individuals concerned with replicating this study might be interested in
incorporating data from the Labor Force Survey of the National Statistics Office along
with the Family Income and Expenditure Survey. Through this, future researchers will
be able to gain deeper insights pertaining to the households’ labor status and
environment, which are important indicators of income mobility. Moreover, the other
aspects of economic or social mobility may be examined in order to present a more
comprehensive analysis on welfare.

72
Chapter 7: BIBLIOGRAPHY
Acemoglu, D., &Autor, D. (n.d.). Lectures in labor economics. Retrieved November 17, 2012 from http://econ.lse.ac.uk/staff/spischke/ec533/Acemoglu%20Autor%20chapter%201.pdf
Acs, G. (2011, September). Downward Mobility from the middle class: Waking up from
the American dream. Retrieved from http://www.pewtrusts.org/uploadedFiles/wwwpewtrustsorg/Reports/Economic_Mobility/Pew_PollProject_Final_SP.pdf
Addawe, M., Querubin, M., &Virola, R. (2007).Trends and characteristics of the middle-
income class in the Philippines: Is it expanding or shrinking?.Makati City: National Statistical Coordination Board.
Addawe, M., Balamban, B., Encarnacion, J., Viernes, M., &Virola, R. (2013). Will the
recent robust economic growth create a burgeoning middle class in the Philippines?. Makati City: National Statistical Coordination Board.
Agence France-Press. (2013, March). Philippines’ elite swallow country’s new wealth.
Inquirer.net. Retrieved from http://business.inquirer.net/110413/philippines-elite-swallow-countrys-new-wealth
Alfonso, A., Schuknecht, L., &Tanzi, V. (2008). Income distribution determinants and
public spending efficiency. European Central Bank. Arrow, K. (1971). The theory of discrimination. Harvard University. Asian Development Bank. (2007). Inequality in Asia. Retrieved from http://graduateinstitute.ch/files/live/sites/iheid/files/sites/developpement/shared
/developpement/mdev/soutienauxcours0809/Gironde%20Pauvrete/Inequality-in-Asia-Highlights.pdf
Asian Development Bank. (2012). Asian Development Outlook 2012: Confronting Rising Inequality in Asia. Retrieved from http://www.adb.org/publications/asian-
development-outlook-2012-confronting-rising-inequality-asia Autor, D. (2003). Lecture note: Self-selection - The Roy model. Massachusetts Institute
of Technology.
73
Banerjee, A., &Duflo, E. (2008). “What is middle class about the middle classes around
the world?” Journal of Economic Perspectives 22(2):3-28. Retrieved from http://pubs.aeaweb.org/doi/pdfplus/10.1257/jep.22.2.3
Birdsall, N. (2010). The (indispensable) middle class in developing countries; or, the
rich and the rest, not the poor and the rest.Equity in a Globalizing World, Ravi Kanbur and Michael Spence, eds., World Bank, Forthcoming.Center for Global Development Working Paper No. 207. Retrieved from http://ssrn.com/abstract=1693899
Bozeat, N., Irving, P., Ramos, X., Vincze, M. P., Juravle, C., & Jesuit, D. (2010).Social
mobility and intra-regional income distribution across EU member states. Belgium: European Union.
Chun, N. (2010). Middle class size in the past, present, and future: A description of
trends in Asia. ADB Economics Working Paper Series, 1-30. Chun, N., Hasan, R., &Ulubasoglu, M. (2011). The role of the middle class in economic
development: What do cross-country data show? ADB Economics Working Paper Series, 1-34.
Collins, L. (1975).An introduction to Markov chain analysis. Retrieved from
http://qmrg.org.uk/files/2008/11/1-intro-markov-chain-analysis2.pdf Defiesta, G. & Dator-Bercilla, J. (n.d). Does Economic Growth Translate to Social
Development? From http://www.socialwatch.org/sites/default/files/pdf/en/14_missingtargets.pdf. Retrieved December 4, 2013.
De Vos, K., & Zaidi, A. (2002, June). Income mobility of the elderly in Great Britain and
the Netherlands: A comparative investigation. Retrieved from http://www.economics.ox.ac.uk/research/WP/PDF/paper107.pdf
Easterly, W. (2001).Middle Class Consensus and Economic Development.World Bank.
Retrieved from http://econ.worldbank.org/external/default/main?pagePK=64165259&theSitePK=475520&piPK=64165421&menuPK=64166093&entityID=000094946_00062005301380
Engerman, S., & Sokoloff, K. (1997) How Latin America fell behind. Retrieved from
http://dss.ucsd.edu/~jlbroz/Courses/Lund/syllabus/Engermann_Sokoloff.pdf

74
Fields, G., Hernandez, R., Rodriguez, S., & Sanchez-Puerta, M. (2006, October). Income
mobility in latin America. Retrieved from http://www.cid.harvard.edu/Economia/Mexico06%20Files/fieldsetal%20102306.pdf
Greene, W. H. (2003). Econometric Analysis (5th ed.). Upper Saddle River, N.J.: Prentice
Hall. Heshmati, A. (2006). The world distribution of income and income inequality: A review
of the economic literature. Retrieved from http://jwsr.ucr.edu/archive/vol12/number1/pdf/jwsr-v12n1-heshmati.pdf
Introduction to SAS. UCLA: Statistical Consulting Group. from
http://www.ats.ucla.edu/stat/sas/notes2/. Retrieved November 30, 2013 Jacobs, E. (2013, September). Does a strong middle class predict upward social mobility
for the poor?. Retrieved from http://www.brookings.edu/blogs/social-mobility-memos/posts/2013/09/06-strong-middle-class-predict-social-mobility-jacobs
Josten, S.D. (2005, January). Middle-class consensus, social capital and the mechanics of
economic development. Helmut Schmidt University, Hamburg. Retrieved from http://econpapers.repec.org/paper/risvhsuwp/2005_5f036.htm
Kharas, H. (2010). The emerging middle-class in developing countries. OECD
Development Centre Working Paper No. 285, Organisation for Economic Co-operation and Development, Paris. Retrieved from http://www.oecd.org/social/povertyreductionandsocialdevelopment/44457738.pdf
Kharas, H., &Gertz, G. (2010, March). Brookings. Retrieved October 5, 2012, from
Research: http://www.brookings.edu/research/papers/2010/03/china-middle-class-kharas
Liu, X., Nuetah, A., Shin, X., &Xin, X. (2010, January)The determinants of household
income mobility in rural China. Retrieved from http://www.cau.edu.cn/cem/upload/20100505060256.pdf
Madland, D. (August, 2012). Making Our Middle Class Stronger: 35 Policies to Revitalize America’s Middle Class. Retrieved from
http://www.americanprogress.org/issues/2012/08/pdf/middle_class_policies.pdf

75
National Statistical Coordination Board. (2004). NSCB Fact Sheet. Retrieved from
http://www.nscb.gov.ph/rucar/pdf/fs/FS_GRDP_Jul04.pdf National Statistical Coordination Board. (October 2013). PH is now the fastest growing economy among ASEAN 5. Retrieved from
http://www.nscb.gov.ph/pressreleases/2013/PR_asean.asp#sthash.WfWXioTe.dpuf
National Statistics Office. (2013, June 24). Family income and expenditure survey.
Retrieved November 18, 2013 fromNational Statistics Office Data Archive: http://www.census.gov.ph/nsoda/index.php/catalog/8/search?vk=decile
Papatheodoru, C. (2000). Decomposing inequality by population subgroups in Greece:
Results and policy implications. Retrieved from http://sticerd.lse.ac.uk/dps/darp/darp49.pdf
Prais, S. J. (1955). The formal theory of social mobility. Population Studies, 9(1), 72-81. Ravallion, M. (2009, January).The developing world’s bulging (but vulnerable)
“middle class.”The World Bank Development Research Group. Retrieved from http://www-wds.worldbank.org/external/default/WDSContentServer/WDSP/IB/2009/01/12/000158349_20090112143046/Rendered/PDF/WPS4816.pdf
Regional Development Plan (2010). Zamboanga Peninsula Regional Development
Plan 2011-2016. from http://www.neda.gov.ph/RDP/2011-2016/RegIX_RDP_2011-2016.pdf. Retrieved December 5, 2013
Scitovsky, T. (1964). A survey of some theories of income distribution. The Behaviour
ofIncome Shares: Selected Theoretical and Empirical Issues, pp. 15-52. Solimano, A. (2009). Stylized facts on the middle-class and the development process.
Retrieved from http://www.andressolimano.com/publicaciones/11-5.pdf Starkweather, J., &Moske, A. K. (n.d.). Multinomial logistic regression. Retrieved from:
http://www.unt.edu/rss/class/Jon/Benchmarks/MLR_JDS_Aug2011.pdf The Classical Economists’ Theory of Income Distribution. (n.d.). Retrieved March 7,
2013, from Mcleveland: http://www.mcleveland.org/Class_notes/Classical-Economists_Income_Distribution-George_Modification.pdf
76
Torche, F. & Lopez-Calva, L. F. (2012). Stability and vulnerability of the Latin American
middle class. Retrieved November 29, 2012 from http://www.wider.unu.edu/publications/working-papers/2012/en_GB/wp2012-098/
Working-age population. (n.d.). Retrieved from Investopedia:
http://www.investopedia.com/terms/w/working-age-population.asp World Bank. (2011). East Asia and Pacific Economic Update 2011, 3. Retrieved from
http://books.google.com.ph/books?id=yUMSAAAAQBAJ&pg=PA44&dq World Health Organization. (n.d.). What do we mean by “sex” and “gender”. Retrieved
December 3, 2013 from http://www.who.int/gender/whatisgender/en/.