the outlook for metals markets - background...
TRANSCRIPT
Background Paper
The Outlook for Metals Markets Prepared for G20 Deputies Meeting Sydney 2006
The World Bank Group Oil, Gas, Mining and Chemicals Department Washington September 2006


Table of Contents
Executive Summary .................................................................................... i 1. Introduction .......................................................................................... 1
2. Recent Developments............................................................................ 2
3. Short-term Outlook .............................................................................. 9
4. Historical Perspective of the Industry ................................................11
5. The Longer-Term Outlook..................................................................23
6. Policy Implications and Challenges ....................................................31 Annex.........................................................................................................35
1. Refined Metals Prices 1990 – 2010 .....................................................36 2. Refined Metals Consumption 1990 – 2010..........................................37 3. Per Capita Consumption of Refined Metals 1990 – 2010 ....................39 4. Refined Metals Production 1990 - 2010 ..............................................40 5. Metals Mine Production 1990 – 2010..................................................42

Note: This paper was produced by the Oil, Gas Mining and Chemicals Department (COC) of the World Bank Group as a background paper for the G20 Deputies Meeting, Sydney, 2006. Valuable inputs were received from Commodities Research Unit, London and Raw Materials Group, Stockholm. The paper was written by a team led by Clive Armstrong, Lead Economist (COCDR), and including Omar Chaudry, Senior Economist (COCDR) and Shane Streifel, Senior Energy Economist (DECPG).

List of Tables, Graphs and Boxes Executive Summary................................................................................................................... i
1. Introduction ....................................................................................................................... 1 Table 1.1: Global Metal Consumption, 1990-2005 (000t) ..................................................................... 1 Graph 1.1 Real Copper Prices 1900 – 2006 (Aug)................................................................................. 2
2. Recent Developments ......................................................................................................... 2 Graph 2.1 Real Metal Prices 2001-2006 (2001 =100)............................................................................ 3 Graph 2.2 China’s Share of Global Metals Demand Growth 1999-2005................................................ 3 Box 2.1 The China Growth Story......................................................................................................... 4 Graph 2.3 Refined Metals Consumption 1990 – 2005 ........................................................................... 5 Graph 2.4 Mining Company Returns 1978-2005................................................................................... 6 Graph 2.5 Global Exploration Budgets 2001-2005 (US$ billion)........................................................... 6 Graph 2.6 New Mining Construction Started 2001-2005 (US$ million)................................................. 7 Graph 2.7 Mining Sector Merges & Acquisitions 1995-2006 ................................................................ 7 Graph 2.8 Movement of the Gold Production Cost Curve 2001-2006 (Q2)............................................ 8
3. Short-term Outlook............................................................................................................ 9 Graph 3.1 Metals Prices 1990-2010 (1990:100).................................................................................... 9
4. Historical Perspective of the Industry ..............................................................................11 Graph 4.1 Growth in Demand for Metals 1960-2005 .......................................................................... 11 Graph 4.2 Steel Consumption and per Capita GDP (2005) .................................................................. 12 Table 4.1 Apparent Metals Consumption per Capita 2005 (Kg per capita)........................................... 12 Table 4.2 Intensity of Metal Consumption, 2005 (Kg per Capita)........................................................ 13 Graph 4.3 Copper Demand per $1000 of GDP across Selected Countries (2005)................................. 13 Graph 4.4 Regional Shares of Metals Production and Processing 2005................................................ 14 Graph 4.5 Copper Production & Ore Grade 1930-2005....................................................................... 15 Graph 4.6 Real Metal Prices 1960-2005 (1960:100)............................................................................ 16 Box 4.1 The Zambian Copper Industry – Nationalization and Privatization ........................................ 17 Graph 4.7 Private Sector Share of Mining Production (%) 1975-2005................................................. 19 Table 4.3 Mining Sector Concentration by Company 1975-2005......................................................... 21
5. The Longer-Term Outlook ...............................................................................................23 Table 5.1 Estimated Long-Run Marginal Costs................................................................................... 23 Table 5.2 Prospective Developing Country Copper Demand............................................................... 24 Box 5.1 Beyond China: India and Other Developing Countries ........................................................... 25 Table 5.3 World Mineral Resources ................................................................................................... 26 Graph 5.1 Growth of the Resource Base 1950-2000............................................................................ 26 Graph 5.2 Global Exploration Budgets 1994-2005.............................................................................. 27 Graph 5.3 Forecast additions to Copper Mine Capacity 2006-2010 ..................................................... 28 Table 5.4 Regional Production and Prospective Investment ................................................................ 29 Graph 5.4 Rest of the World Exploration Spending 1996-2005 ........................................................... 30 Box 5.2 Alternative Scenarios for Supply, Demand and Prices ............................................................ 31
6. Policy Implications and Challenges ..................................................................................31
Annex.......................................................................................................................................35 1. Refined Metals Prices 1990 – 2010............................................................................................... 36 2. Refined Metals Consumption 1990 – 2010.................................................................................... 37 3. Per Capita Consumption of Refined Metals 1990 – 2010............................................................... 39 4. Refined Metals Production 1990 - 2010........................................................................................ 40 5. Metals Mine Production 1990 – 2010 ........................................................................................... 42


Executive Summary Metal Prices are at all time highs in nominal terms
International metals prices have risen substantially the last three years and are at all time highs in nominal terms, and in some cases match or exceed the highest real levels seen in the last thirty years. Prices are significantly above long-run average costs of production. The recent run-up in prices is broadly consistent with the pattern of past metals price cycles, although prices have risen more strongly and high prices could be extended longer than has been typical in the past.
Prices have been driven up by a number of factors. Demand growth increased
sharply, particularly in China, and caught the industry by surprise and helped drive inventories to low levels. Investment and expansion of mining capacity had earlier been discouraged by a long period of low metals prices with uncertain future prospects and poor corporate returns. More recently prices have been driven even higher by technical and labor problems, and delays in bringing on new capacity. Chinese demand growth has been a major factor
A particular feature of markets has been the importance of Asia and particularly of China in accounting for growth in demand. Over the fifteen years since 1990, Chinese metals demand growth has averaged 10% pa, and in the last five years it has accelerated to 17% pa. Chinese metal demand has been driven by fast growth in industrial production, and investment in infrastructure, construction, and manufacturing. For a number of metals, China accounted for 70% or more of global demand growth in last five years, and the country is now the world’s single largest user of almost all metals.
Over the same period, China also made substantial investments in metals mining
and processing and its own production has grown strongly. It is the world’s largest miner or refiner of a number of metals and, by any measure, one of the world’s leading mining countries. In products such as copper and iron ore, where its production of processed metal or ore has lagged growth in its demand, it has emerged as major source of demand for refined metals and raw materials on world markets. Higher prices are bringing strong benefits to producer countries and investors
High metals prices have brought substantial benefits to metals producing countries and to investors. Company profits have increased substantially and tax revenues will follow. The mining industry is flush with cash, share values have soared and exploration and investment spending have both risen significantly. High metal and share values have encouraged further acquisition activity in the industry and have also attracted new entrants to international financial markets from countries as diverse as Russia, India, Kazakhstan and China.
ii
But also imposing costs
High prices and profits, though, are bringing in their wake a number of issues that the industry needs to deal with. Rising investment spending has led to inflation of mining costs, as the mining supply and service industries have been pushed up against capacity constraints and their costs and prices have risen. The industry is also facing higher oil and other energy prices, as well as strong upward pressure on wages due to a limited supply of skilled workers. As the costs of mining investments are being pushed up, in some instances projects are being delayed.
High prices and profits have also attracted the attention of some governments
who, in the face of large profits being earned by investors, have come to feel that they are not receiving an adequate share of the benefits from the development of their national resources. Fiscal terms and conditions are sometimes being changed to capture more for the state. This could delay new investments as investors and governments struggle to reach mutually acceptable terms. Metals prices will come down
Demand growth looks likely to remain buoyant for the immediate future with most forecasters predicting continuing strong Chinese economic growth and investment. At the same time though, high prices are having some impact on demand, and supply will respond to prices that are significantly above the costs of metal production. It is expected that prices will start to come down the next year or so and eventually settle at levels that are closer to the average of the period 1990-2004. However, prices are likely to be somewhat above previous lows as a portion of the increase in costs remains permanent. The exact timing and pace of the inevitable fall in prices from today’s levels is uncertain and will depend on a number of factors and could vary by metal. There are a number of risks that could prolong the period of high prices such as faster global economic growth and interruptions to production and new investment. Conversely, if growth slows more quickly than expected, particularly in China, the fall in prices could come sooner and be much sharper. Longer term metals demand growth is potentially very strong
Partly as a result of China’s rapid growth, developing countries now account for close to 50% of global demand for metals. Developed country metals demand growth leveled off some time ago and is likely to grow only slowly in the future although it will vary by metal. The potential for long-term demand growth from developing countries, however, is very large. Metals use is strongly correlated with economic growth, particularly growth in industrial production, and associated developments such urbanization and rising incomes. If developing countries are to reach the standards of living of rich countries, their metals use will tend to rise to similar levels.
Today, metals consumption per head in developing countries – whose population
in aggregate is more than five times as large as the total of the developed countries – is

iii
often one quarter or less that of the rich countries. While the future path of the world’s developing countries approaching developed country levels of income is uncertain and could be extended, China’s recent experience shows how quickly metal demand can grow when economic growth is fast.
Developing new supplies will be challenging
For more than thirty years, the world’s mining industry has been able to supply
growing amounts of metals to world markets at gradually falling real costs. It has been able to do this despite declining ore grades and tighter environmental and social constraints on its operations. A broad-based and diverse range of incremental improvements in mine operation and processing, including large open pit mining operations that helped realize economies of scale, were responsible for ensuring declining costs. In addition, major breakthroughs have occurred, such as the introduction of leaching technology in the production of copper, and, more recently, the development of pressure acid leaching for the recovery of nickel from laterite deposits.
Looking forward, the potential absolute size of future demand growth the industry
will need to meet will be larger than ever. For the foreseeable future the resource base is not likely to be a major constraint. But, the industry is likely to face continuing challenges in terms of higher energy costs, potentially higher exploration costs, declining ore grades, and increasing environmental and social constraints, including water issues. There may be less scope for reaping gains from major economies of scale due to a growing share of large open pit mines, and new mines may more often be located in remote locations with greater infrastructure costs. But past experience of a dynamic, market-driven industry gives grounds for optimism
The competitive and international nature of the mining industry has been the key to meeting global demand for metals. While the role of the private sector relative to the state has waxed and waned over time, developments over the last two decades in particular mean that the role of the private sector and the global inter-dependent nature of the mining industry will increase substantially. More of the world’s mining industry is now in the private sector and greater subject to market forces than ever before. More parts of the world are engaged in international metals trade and the role of mining companies from countries such as China, Russia, Brazil, South Africa and elsewhere looks likely to increase markedly.
However, the process of continuing internationalization of the industry has some
way to go, is not likely to be entirely smooth, and there could be reversals. Important major mining countries are not yet fully open to private investment, even though that is where they are heading. Some governments today are concerned about the sharing of benefits between themselves and private investors, and of adding value to their resources as opposed to exporting raw materials. In some countries, there has been a resurgence of economic nationalism that appears aimed at restricting foreign investment in the extractives sector, or, at least denying it a leading role. Among established international

iv
investors, there are concerns about fair competition for access to resources when competing with state-supported companies. There are also concerns about the application of common good-practice standards for environmental and social issues, especially in developing countries where government capacity may be weak.
Nevertheless, a broad trend towards a more private-sector/market-based approach looks likely to remain the direction in which the industry will continue to move. This and increased internationalization augur well for a more competitive industry that is better able to meet global demand for metals at reasonable costs.
Price trends will not be dramatically different from the past
The precise long-term trend of metals prices, once the current cyclical high ends and prices revert back towards trend, is uncertain. The path taken will be the net outcome of a range of complex forces on both the demand and supply sides of the market. Rapid world economic growth, particularly fast growth in developing countries, will pose significant challenges. Available knowledge about the resource base and opportunities facing the industry suggest that a competitive, international industry will continue to meet growth in metal demand at reasonable cost, as it has done in the past. However, it is possible that the trend decline in real prices that has been a feature of the last forty years or so could be stopped and reversed to some extent. Real prices, though, look unlikely to stay substantially above past long-term trend levels for sustained periods. Policy Implications
High metals prices do not appear to pose any urgent short-term issues for the global economy. While higher metal prices may impact inflation, the scale of the metals industry is relatively small in relation to the size of the global economy and international trade. The metals industry is much smaller in this respect than the oil industry, and the world has coped well with high oil prices. Moreover, the current period of high metals prices is not necessarily out of line with past price cycles.
For some individual “resource rich” economies, high metals prices can bring
substantial tax, foreign exchange and new investment inflows. These will need to be managed, as will the fall in prices and investment flows should prices follow their expected cyclical path. There is no immediate role for governments in short-term metals supply management. Markets are working to balance supply and demand, and higher prices are a part of this process.
For the longer run, the key message for government policy makers is to help
facilitate access to resources for development, and by providing for a well regulated and internationally competitive mining industry. While there are a number of important roles that governments should play to support the competitive development of their mining sectors, there does not appear to be any pressing need for them to take a role in normal commercial decisions about investment (including exploration) and operation. Allowing markets to work seems to be the best approach to ensuring that the metals industry can
v
effectively meet the demands placed upon it. As the industry becomes more international and countries more inter-dependent, the focus of governments should be on helping facilitate this process and in addressing market imperfections, such as inappropriate barriers to local and foreign private investment, and subsidies and protection for local production.
There is a common interest between investors, host governments and the
international community, to ensure that producing countries and local communities do receive sustainable benefits from the development of their metals resources. This will contribute both to the welfare of these countries and communities, and will help ensure more effective development and operation of the international metals industry.


1. Introduction
Metals are essential for industrial development and quality of life. Global demand for metals has grown approximately in line with economic growth over time. In the last four decades, production of 6 major industrial metals1 grew on average about three and one half times, against a four-fold increase in global output. More recently growth has varied from 2.1% to 3.9% per annum.
Table 1.1: Global Metal Consumption, 1990-2005 (000t)
Iron Ore
Aluminum Copper Lead Zinc Nickel Tin (mt)
1990 18,009 10,755 5,511 6,671 856 238 976 2005 31,947 16,930 7,524 10,580 1,236 332 1,455
Growth rates (% CAGR) 1990-2005 3.9% 3.1% 2.1% 3.1% 2.5% 2.3% 2.7%
Source: Commodities Research Unit, London
Depending on the point in the price cycle, the metals sector accounts for half to one percent of global GDP, and around 2-3% of global trade. In this respect, it is significantly smaller than the oil industry2. Mining can, however, make a substantial contribution to GDP, exports and government revenues for individual countries. There are 15 or more developing countries where mining accounts for 30% or more of exports or government revenues. In some developing country economies the mining sector is dominant in economic terms and even in the case of wealthy, diversified economies such as Australia and Canada, the sector continues to play a very important role.
From the late 1960s, after allowing for cyclical price movements, the mining
industry has generally been able to meet growing demand for metals at a declining real price, notwithstanding declining average ore grades for many metals, as well as additional requirements imposed on the sector in terms of its environmental and social impacts. Viewed from a longer-term perspective, as the graph of real copper prices below shows, there have been long periods when real prices have appeared to trend up or down.
1 Aluminum, Copper, Lead, Nickel, Tin and Zinc. 2The oil and gas industry accounts for about 3-5% of global GDP.

2
Graph 1.1 Real Copper Prices 1900 – 2006 (Aug)
Real Copper Prices 1900-2006
0.0
50.0
100.0
150.0
200.0
250.0
300.0
350.0
400.0
1900
1905
1910
1915
1920
1925
1930
1935
1940
1945
1950
1955
1960
1965
1970
1975
1980
1985
1990
1995
2000
2005
Rea
l 200
0 U
S ce
nts
lb
Source: Commodities Research Unit, London
Today, many metals prices are above or close to historic highs in nominal terms
and, in some cases, higher than post World War II real highs. This paper is intended to provide a broad overview of the global outlook for the metals market and prices. It reviews recent developments and the immediate outlook, and also provides an overview of longer-run developments and possible long-term trends. It concludes with a discussion of policy implications.
2. Recent Developments Prices and Output
Over the last 3-5 years, metals prices have risen sharply to cyclical highs in
nominal terms, although prices are still below past peaks in real terms in most cases. Prices have been driven up by strong global economic growth, and particular strong metal demand in China that caught the industry by surprise. The lengthy period of low prices and weaker growth preceding this price surge, resulted in low levels of investment and shut-in of high-cost surplus capacity. More recently, prices have soared even higher due to a number of technical problems, strikes, and delays bringing on new capacity. Rising costs—notably for energy, wages and materials—and shortages of skilled labor and equipment have also have affected production and new developments.

3
Graph 2.1 Real Metal Prices 2001-2006 (2001 =100)
Recent Metal Prices (Real)
50
100
150
200
250
300
350
400
2001 2002 2003 2004 2005 2006
Real
Pri
ce
Copper Aluminum Lead Zinc Nickel
Source: Commodities Research Unit, London
Propelled by rapid industrialization, Chinese demand for commodities has soared,
mainly for infrastructure development, construction, manufacturing capacity, and local demand for goods. In the fifteen years from 1990, Chinese metals demand grew at an average rate of more than 10% pa. From 1999 to 2005, growth surged to 17% pa and China accounted for more than half of growth in world demand. While China’s mining sector has also grown strongly, it has not fully matched its growth in final demand, and the country’s imports of raw materials and refined metals have grown very rapidly. Graph 2.2 China’s Share of Global Metals Demand Growth 1999-2005
Growth of Refined Metals Consumption 1999-2005
-1000
0
1000
2000
3000
4000
5000
6000
7000
8000
9000
Alum Copper Lead Nickel Tin Zinc
OtherIndiaChina
'000 tons
Source: The World Bank Group

4
Box 2.1 The China Growth Story
China’s dramatic rates of growth and industrialization have had an important impact on metals markets in recent years. From 1990 to 2005 the Chinese economy grew by an average of 10% pa. Key indicators of industrial growth also grew very quickly with overall industrial output, electricity production, and cement production all growing by more than 200%. While it is not possible to de-link China’s booming export sector from the country’s overall growth, its rapid demand for metals appears to have been largely to satisfy its own needs for infrastructure, construction, consumer goods and other manufacturers, and only a small part for direct re-export. China is now the largest consumer of all major metals, sometimes by a factor of more than two over the next largest country, and accounts for 16% to more than 30% of world consumption depending on the metal. However, per capita use of metals in China is only about 30% to 60% of the levels observed in large developed economies such as USA or Europe. Given its population size, relatively low levels of consumption per capita, and the potential rate of growth of its economy, there is scope for significant further growth in Chinese metals use. Over the next 25 years, Chinese real income per head, when measured on a purchasing power parity basis, could move close to the level of the USA and Europe of the 1970s/1980s when per capita metals use in these countries began to plateau. As it moves towards this level of income, China will likely move to similar levels of metal demand per capita. Over the next twenty five years, its demand for metals could grow 2 to 4 times current levels depending on the metal, implying annual increases in demand of about 2.5% to 4.8%. The structure of Chinese economic output is now particularly metals intensive due to very fast rates of overall economic growth and growth in heavy industry and infrastructure and construction. This is reflected in high levels of consumption per capita of metals relative to its income levels. For example, Chinese steel consumption per capita in 2006 could be close to 300 kg per capita – very close to USA levels although Chinese income per capita (however measured) is much lower. Even though Chinese demand for metals will continue to grow over the long run, its current exceptionally fast rate of demand growth will slow, possibly quite sharply. Chinese demand could even fall in a cyclical downturn. Any such cyclical fluctuations in Chinese demand will have a significant impact on global markets given its share of markets and share of demand growth. Mine production and refined metal production in China have also grown rapidly. Its production of steel, copper, and zinc grew more than five fold, and aluminum nine fold, and it is now the world’s number one producer of these metals. It is also the world’s largest miner of several minerals including coal, lead and iron ore. At the same time, Chinese imports of ores and metals have grown exceptionally quickly and have become a major factor in international trade. Gradual liberalization is taking place in the Chinese mining and metals sector, with the Chinese government opening the sector to private and foreign players. Moreover, a number of Chinese mining and metals companies have been listed on domestic and offshore bourses, such as the Hong Kong stock exchange, with the objectives of (i) tapping international capital markets; (ii) introducing international operational and management best practices and (iii) broadening their shareholder base.

5
Some part of the recent increase in metals price is said to be due to investments in commodities by financial investors such as pension and hedge funds. Such investors can mobilize huge financial investments, but is not clear how large their impact has been given their apparently limited positions in physical markets. Recent analysis by economists at the IMF came to the conclusions that there was relatively little evidence that speculators had played a significant part in the ramp of prices in commodity markets recently3. If anything, they found that the causal link was that high prices led to speculative positions rather than the other way round. In practice, such markets can help in providing liquidity and thereby help markets work effectively. However, in markets which are tight and where additional supply capacity is limited or non-existent, it is possible that even relatively small changes to physical demand from speculative investors, could have significant impacts on short-term prices.
Partly as a result of the impact of China, the developing countries share of world
metals consumption has grown strongly in recent years and is now close to 50%. Graph 2.3 Refined Metals Consumption 1990 – 2005
Refined Metals Consumption ('000 tonnes)
0
5000
10000
15000
20000
25000
30000
35000
40000
1990 1993 1996 1999 2002 2005
OECDNon-OECDFSU/EE
Source: The World Bank Group
Impact on Industry Players The sharp rise in metals prices has been accompanied by: Sharp rises in profitability and market capitalization of private mining firms. Total market capitalization of the global mining sector has increased from $389 billion in 2003 to $791 billion at end-2005. From 2002 to 2005 the return on equity for a group of 20 leading mining companies increased from 5% to 25%4. Unlike the case for long periods in the past, the sector has large resources and is generating attractive returns for investors. 3 See, for example, IMF World Economic Outlook, 2006 4 Price Waterhouse Coopers: Mine: Let the good times roll. June 2006

6
Graph 2.4 Mining Company Returns 1978-2005
Total Returns on Investment in the Non-Ferrous Metals Sector
0
5
10
15
20
25
30
35
1978
1980
1982
1984
1986
1988
1990
1992
1994
1996
1998
2000
2002
2004
% return on investment, all quoted non-ferrous companies
0
20
40
60
80
100
120
140
160
180
200
W eighted index of LME metal prices
Average return on equity, non-ferrous sector
Weighted index of LME prices
Source: Commodities Research Unit, London
Exploration spending, as measured by a survey of a large group of mining companies, has grown strongly driven by high prices, readily available financing and high equity values. Graph 2.5 Global Exploration Budgets 2001-2005 (US$ billion)
Estimated Global Exploration Budgets ( US$ billion)
0
1
2
3
4
5
6
2001 2002 2003 2004 2005
Source: Metals Economics Group, Canada New investment has increased sharply as mining companies have brought
forward expansion plans and tried to maximize production to take advantage of high prices.

7
Graph 2.6 New Mining Construction Started 2001-2005 (US$ million)
Metal Mining Projects Under Construction
0
5000
10000
15000
20000
2001 2002 2003 2004 2005
US
$ m
illio
ns
Source: Raw Materials Group, Stockholm
Acquisitions in the mining industry have grown as companies strive to gain
economies of scale and a broader spread of assets. The flurry of activity seen in 2005 has continued into 2006. Leading examples are Xstrata’s takeover of Falconbridge, CVRD of Brazil’s bid for Inco, and the proposed merger of two major Russian aluminum companies, Sual and Rusal, which together with the aluminum assets of Glencore of Switzerland will create the world’s largest aluminum company. Graph 2.7 Mining Sector Merges & Acquisitions 1995-2006
Mining Sector Mergers and Acquisions
0
10000
20000
30000
40000
50000
60000
1995 1996 1997 1998 1999 2000 2001 2002 2003 2004 2005 2006
US
$ m
illio
ns
Source: Raw Materials Group, Stockholm (2006 is first half year)

8
Immediate Challenges
Along with these positive trends for producers, there are a number of immediate
challenges for the industry: Costs have increased for many mining supplies, including energy that can
account for more than 25% of the cost of some metals. Some of these increases may themselves be cyclical and can be reversed as supplier capacity increases. Others, though, could become embedded in the industry’s cost structure or only retreat slowly under the pressures of a tougher metals pricing environment as was the case in past price cycles.
Spurred by high profits and strong demand for skilled workers, employment costs
are escalating. In Australia shortages of skills are impacting developments. In Canada, rising wages and skills shortages are one of the reasons for significant cost escalation in the mining-related tar sands industry. In a number of mining countries, unions are demanding a bigger share of the benefits of high prices in the form of higher wages and better terms and conditions, as evidenced by recent strikes in the copper industry in Mexico and Chile. Comprehensive data is not available, but the overall impact of local cost increases and the recent depreciation of the US$ (which will increase local costs when measured in US$) has been significant. For example, global production costs curves maintained by Raw Materials Group, Stockholm, show that the cost per ounce of gold production (measured at the 50th percentile mark) have increased by 50% between 2002 and the first quarter 2006. Over the same period the US$ depreciated 20%.
Graph 2.8 Movement of the Gold Production Cost Curve 2001-2006 (Q2)
Source: Raw Groups Material, Stockholm
25.0% 50.0% 75.0% 100.0% 255075
100125150175200225250275300325350375400425450475500525550575600625
USD/oz
2006 (Q2)
2001
Cost Curve 2001 – 2006 (Quarter 2)

9
High prices and high levels of profitability are also leading some governments to
assess the sharing of benefits from mining development between investors and the government. In countries such as Peru and Chile, governments have successfully changed tax rates and/or renegotiated contracts, and others may follow.
In some countries, a revival of economic nationalism, together with concerns about foreign and private exploitation of national resources has led to questions about the role of the private sector, notably foreign investors. In some cases, such as Bolivia, Mongolia and Venezuela, this is reflected in proposed changes to conditions concerning ownership and operation, including mandatory government participation. In other places, it is reflected more in terms of informal barriers or discouragement to investment.
3. Short-term Outlook
The recent sharp increase in metals prices may be higher and more extended than previous cycles but otherwise is broadly consistent with the long-standing pattern of cyclical price movements for metals and other commodities. At some point, prices will retreat substantially and possibly rapidly, closer to longer-term trend levels, as metals supply increases from expansions and investments that are already underway, and as the rate of metals demand growth abates.
The views of one of the world’s leading metals markets consultants, Commodity Research Unit (CRU), London, on the outlook for the next five years are summarized below from a report prepared for the World Bank Group. Prices are expected to begin to fall back from current levels within the next year or two, but there is some probability that even within the next five years they will not retreated to the average levels of the 1990s. Investor expectations, as reflected in futures market prices, also appear to anticipate substantial falls from current levels over the next few years. Graph 3.1 Metals Prices 1990-2010 (1990:100)
Selected Metals: Historical Prices and M edium Term Outlook
0
50
100
150
200
250
1990 1992 1994 1996 1998 2000 2002 2004 2006 2008 2010
Nom
inal
Pric
es (1
990=
100)
COPPER ALUM INUM LEAD ZINC NICKEL TIN
Source: Commodities Research Unit, London – see Annex for further detail

10
There are a number of uncertainties that could impact the timing and pace at which prices start to come down to more typical levels. Prices could fall faster if growth in the USA and China slows more quickly than expected. After such a period of rapid growth and capacity expansion in China, some sort of short-term adjustment is possible. On the other hand, more robust global growth than expected or short-term supply disruptions to operations or delays to new capacity coming on stream could prolong the period of high prices and even drive them higher for a time.
The 3-5 years outlooks for each of the major metals are set out below. Copper: Prices recently have hit post World War II highs. Surpluses are forecast
for 2008-10, and the price is expected to fall, but not to the levels prevailing in the 1990s. Global copper mining capacity is forecast to increase to 19.3m tons by 2010, with the increase coming mostly from smaller projects. Almost three quarters of the expansion is expected to be in North and South America. Cost pressures, particularly intense in North and South America, carry a risk for the future profitability of the industry as a whole and the level of future prices. Aluminium: Prices are now at more than ten year highs in real terms, but surpluses expected in 2007-10 will bring prices back to levels only slightly higher than previous peaks in 1990-2004. As reliable low-cost electricity supply continues to drive investment in smelting capacity, developed economies in North America and Western Europe are unlikely to see any new smelting investment. Possible locations for new investment are the Middle East, Africa, Latin America, the Commonwealth of Independent States and China, making the world more reliant on developing economies and the former Eastern bloc for supplies of primary aluminium. Lead: Although still well below previous real peaks, a lingering deficit since 2003 has produced a prolonged spike in the price, now at its highest level for more than fifteen years. Surpluses are expected in 2007-10, and prices are likely to fall but should remain above the average of the 1990s. The share of refined lead production coming from the former Eastern bloc and China will rise to almost 80% of global output growth. Zinc: High prices, which have recently reached 15 year highs, are expected to continue through 2006-07, following large deficits in 2004-05, due to strong steel demand and limited supply growth. The recent pattern of expansion in the former Eastern bloc and little change in the West will persist at least until 2010. The contribution of North America and Western Europe to world refined zinc production will halve, while China’s will almost quadruple to 31.8%. Nickel: Nickel prices are in an exceptionally high cyclical phase. Major surpluses should re-emerge from 2008, but the price is expected to remain well above the average of the 1990s because of a shift upwards in the cost structure of the industry as it moves from sulphide to laterite ores. Going forward, most growth will occur in New Caledonia, Australia, and Brazil where large projects are now under development. China will increase its production of refined nickel from imported concentrates.

11
Tin: The tin price is at levels not seen in the 1990s, despite a recent surplus, as a result of uncertainty about future supply resulting from depletion of stocks and a likely decline in production from informal mines in Indonesia. Most of the growth in production is expected to be in China. The critical issue remains of the sustainability of output in Indonesia through conventional mining operations. Iron ore: Prices for internationally traded iron ore are at their highest real levels for 25 years. No major price changes and modest growth in demand for international trade were seen through the 1990s, but demand growth began to accelerate in 2002 and drove prices higher. Prices are forecast to decline, as increases in supply come on stream in 2008-10, but remain higher than 1990s averages. Most of the supply increases will come from regions that today produce iron ore, and from companies that now dominate international trade. Brazil and Australia are expected to further increase their shares of world production, with smaller increases expected from the CIS, India and South Africa.
4. Historical Perspective of the Industry Demand for Metals
Demand for metals has been correlated with economic growth, especially industrial production growth and associated trends such as urbanization. However, the relationship has varied between metals and over time. From 1960 to 2005, while the size of the global economy grew more than four-fold, the demand for aluminum grew 6 times, for copper 3.5 times but demand for lead grew only 2 times. In part this was due to substitution to aluminum, e.g., autos, reduction in the demand for lead for environmental reasons, and large-scale recycling of lead, also for environmental reasons. Graph 4.1 Growth in Demand for Metals 1960-2005
Demand Growth Multiples for Industrial Metals1960-2005
0.0
1.0
2.0
3.0
4.0
5.0
6.0
7.0
8.0
Aluminium Copper Lead Nickel Tin Zinc
Mul
tiple
Source: Raw Materials Group, Stockholm

12
As countries become richer, their use of metals per capita increases up to a point and then tends to flatten or grow slowly depending on the metal as economies become more service -and less industry-intensive. In the case of steel this relationship can be seen below. Other metals generally show broadly similar relationships. Graph 4.2 Steel Consumption and per Capita GDP (2005)
Steel Consumption and per Capita GDP (2005)
0
200
400
600
800
1000
1200
0 5000 10000 15000 20000 25000 30000 35000 40000 45000
GDP per Capita (2000 $)
Stee
l Con
sum
ptio
n pe
r Cap
ita
(KG
s)
Source: The World Bank Group
Per capita metals consumption can vary considerably among countries even with
similar levels of incomes. Metal use statistics do not track final consumption or metals used for manufactured goods that may be exported. Thus, apparent differences in metals use between two countries may be the result of one being a large net importer of manufactured goods containing metals, and the other being a large exporter. For example, South Korea’s use of copper per capita is twice Japan’s despite a lower level of income than Japan. Germany’s apparent copper use per capita is more than three times that of the UK with broadly similar levels of incomes. This partly has to due with the structure of the economy, infrastructure, and exports. Measured in broader country groupings, there is more consistency in the pattern of use.
Table 4.1 Apparent Metals Consumption per Capita 2005 (Kg per capita)
Copper Aluminum Nickel Lead Zinc Steel USA 7.5 21.1 0.5 5.2 3.8 80 Europe 7.8 17.1 0.8 3.7 4.7 99
Source: Commodities Research Unit, London
Developing countries now account for close to 50% of world metals consumption, but their average per-capita use of metals is only a fraction of the developed economies. The low level of use per capita today, large populations and the prospect of continued economic growth indicate a huge potential for continued growth in developing country metal demand -- assuming the structure of their economies and the life styles of their people follow the broad pattern of the industrialized countries.

13
Table 4.2 Intensity of Metal Consumption, 2005 (Kg per Capita)
Aluminum Copper Lead Zinc Nickel Tin North America 16.6 6.7 4.2 3.6 0.3 0.1 Latin America 3.0 1.0 0.4 1.1 0.1 0.0 W.Europe 17.1 9.1 4.2 5.6 1.1 0.1 E.Europe 9.3 3.5 2.3 2.0 0.0 0.1 Asia 3.0 2.3 0.9 1.5 0.2 0.1 Africa 0.4 0.2 0.1 0.2 0.0 0.0 CIS 3.0 2.6 0.4 1.1 0.1 0.0 World Average 4.9 2.6 1.2 1.6 0.2 0.1
Source: Commodities Research Unit, London
Measured in terms of metal per unit of GDP, metal intensity has tended to increase in line with economic growth and as the structure of economies becomes more materials intensive. Eventually, as economies become less materials and more service-intensive, metal use per unit of GDP falls. Metals use per unit of GDP for the developing countries is usually much higher then in the developed countries, even though developing country use of metals per capita is much less. This is because metals demand has increased rapidly while GDP levels measured in dollars are still relatively low.
Graph 4.3 Copper Demand per $1000 of GDP across Selected Countries (2005)
Copper Demand per $1000 of GDP
0.00
0.50
1.00
1.50
2.00
2.50
Japa
n
Uni
ted
Stat
es
Uni
ted
King
dom
Can
ada
Ger
man
y
Fran
ce
Aust
ralia
Italy
Spai
n
Taiw
an
Kore
a
Mex
ico
Braz
il
Turk
ey
Sout
h Af
rica
Rus
sia
Thai
land
Chi
na
Indo
nesi
a
Indi
a
Dem
and
per $
'000
of G
DP
(Kg)
Source: The World Bank Group
Supply of Metals
Metal resources, production and processing are widely spread among regions. However, the regional supply pattern has changed markedly since the beginning of the industrial revolution. Initial dominance by Europe gave way to growth in North America, followed by growth in other regions. In the last fifteen years, the major change

14
in shares of production and metals processing has been for North America and Europe to lose share to Asia (mainly China), and to a much smaller extent the ex-Soviet bloc for some metals.
Graph 4.4 Regional Shares of Metals Production and Processing 2005
Source: Raw Materials Group, Stockholm
The location of mining has depended mainly on the overall cost competitiveness
of deposits, but also on investors’ access to these resources, the conditions under which they can be developed, perceptions of risks, and market access for outputs. Processing location is usually a function of the relative costs of transporting raw materials compared to local processing, industrial structure, market location and processing costs (especially electricity). At times, because of national supply security or industrial development considerations, governments intervene to influence investment location. For example, importing countries may continue to apply higher tariffs to refined metal imports than to raw materials and may restrict or tax the export of raw materials and intermediate products. These taxes, though small as a percent of metal value, can be large as a percent of smelting and refining margins and may effectively subsidize domestic processing.
There is usually a mismatch between local demand for metals and local production at the country level. While the larger countries, such as Australia, Brazil, Canada, China, Russia, and the United States, usually produce a variety of metals, no country is fully self sufficient. Many countries and regions (e.g. Western Europe) are dependent on producers elsewhere for much of their supply of refined metals or ores. Global interdependence in metals production is expected to increase. Changing patterns of trade will vary by metal but a number of existing trends are likely to continue such as the migration of aluminum processing to sources of low cost electricity (e.g. Middle East), the movement of raw materials to and increased processing of raw materials in China and other parts of Asia, and growth in exports from producers such as Australia, Africa, Brazil and other parts of Latin America.
In a number of metals, there is strong concentration in a few countries. For example, Guinea is estimated to have more than 30% of world bauxite resources. Chile accounts for a third of world mined copper. But it looks unlikely that any country or small group of countries would be able to exploit their market position for long. Past
Average Refining Share 2005 - 7 Major Metals
AFRICA
CHINA
OTHER ASIA
AUSTRALASIA
CIS
EUROPE
NORTH AMERICA
SOUTH AMERICA
Average Mine Production Share 2005 - 6 Major Metals
AFRICA
CHINA
OTHER ASIA
AUSTRALASIA
CIS
EUROPE
NORTH AMERICA
SOUTH AMERICA
15
attempts by producer countries (e.g. in copper, tin, iron and bauxite) or individuals (e.g. in silver markets) to manage markets have not been successful in the face of a competitive industry, substitution and alternative sources of supply. In this respect, the metals industry, which comprises many different metals and operates in competitive international markets, is very different than that of oil where OPEC and the policies of its member governments collectively can result in a price of oil above its short- and long-run marginal costs—contributing to higher overall energy prices as well.
Scrap Recycling
Scrap to metal supply is of growing importance and depends primarily on the
characteristics of a metal’s use. It varies from around 55% of final demand in the case of lead to about 5% for zinc. In mature economies, the proportion of metal available from scrap will be higher as there will be a greater stock of metal embodied in old buildings or cars that can be recycled. Some industry analysts, however, feel that in some countries regulatory and other barriers to metals recovery and secondary processing may be inhibiting recovery of scrap. Higher metal prices will increase the flow of scrap. There is a competitive international market for metals scrap, although some countries control trade to some extent. Looking forward, increases in scrap’s share of metal demand as economies mature will slow the rate of growth of demand for mined metal. In a fast growing economy such as China’s the flow of material from its own scrap is now relatively low, but will increase over time as the economy matures.
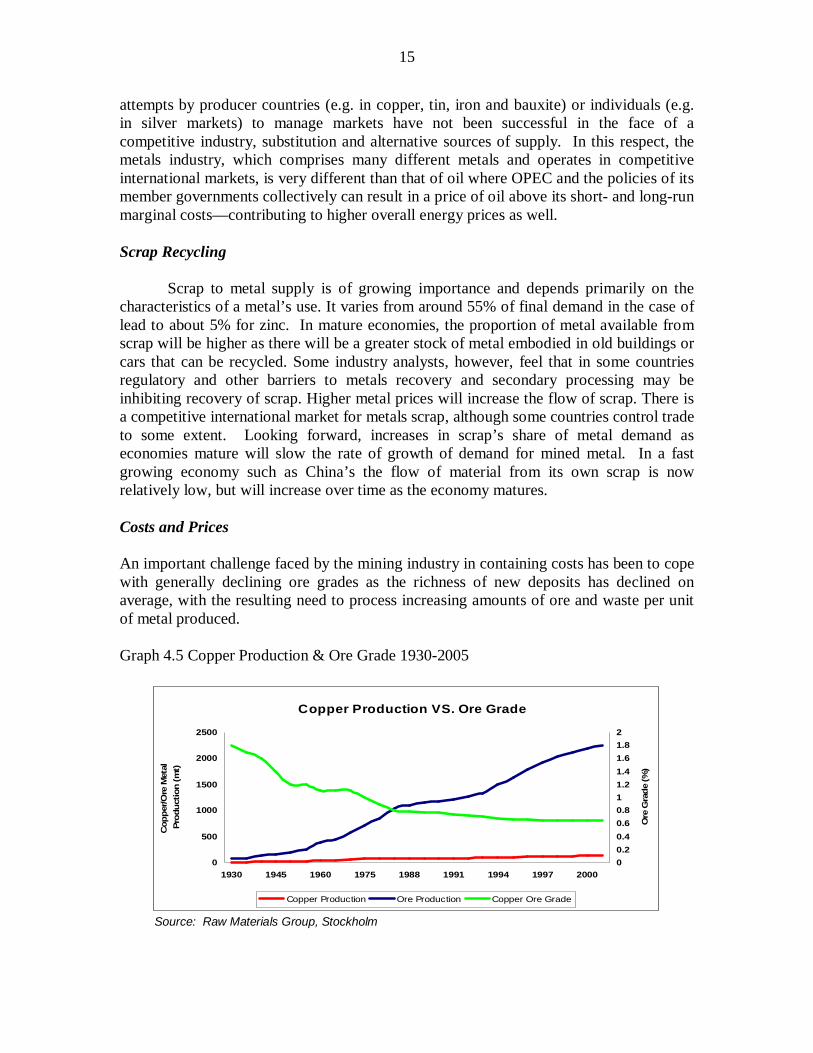
Costs and Prices An important challenge faced by the mining industry in containing costs has been to cope with generally declining ore grades as the richness of new deposits has declined on average, with the resulting need to process increasing amounts of ore and waste per unit of metal produced. Graph 4.5 Copper Production & Ore Grade 1930-2005
Copper Production VS. Ore Grade
0
500
1000
1500
2000
2500
1930 1945 1960 1975 1988 1991 1994 1997 2000
Cop
per/O
re M
etal
Pr
oduc
tion
(mt)
00.20.40.60.811.21.41.61.82
Ore
Gra
de (%
)
Copper Production Ore Production Copper Ore Grade
Source: Raw Materials Group, Stockholm

16
Despite this, the industry has managed in aggregate to increase production by three and one-half times from the early 1960s while reducing costs and prices. It has been able to do this through gradual improvements to equipment, mining processes, and management, rather than to one or two dominant technological breakthroughs. The cumulative impact of gradual improvements over time has been dramatic. In the case of rock drill productivity, output per operator for some machinery has increased 6 fold from the mid 1960s. One of the most important approaches that helped in containing costs has been reaping economies of scale, in particular through the use of large-scale open-pit mining. The development of hydrometallurgical processes in copper, gold and, more recently nickel, has been a major technological advance that contributed to lower costs. Graph 4.6 Real Metal Prices 1960-2005 (1960:100)
Real Metal Prices 1960-2005
0
50
100
150
200
250
1960
1962
1964
1966
1968
1970
1972
1974
1976
1978
1980
1982
1984
1986
1999
1990
1992
1997
1996
1998
2000
2002
2004
2006
Rea
l Pric
e
Alum inum Copper Lead Zinc Nicke l
Source: Raw Materials Group, Stockholm
Mining is capital intensive and technically demanding but the industry spends a
low share of turnover on research and development. It is not clear that this low level of research and development spending has been sub-optimal, but some commentators have identified it as a weakness given the long-term challenges facing the industry. Industry Structure
Over the last fifty years or so, the industry experienced a number of broad changes that have impacted its structure and the role of the private sector. Some of the major recent changes have yet to be fully absorbed. Nationalization
From the 1950s to 1970s, developing countries in Latin America and Africa
moved to nationalize private mining companies. Private investors were displaced and state-owned corporations took ownership and management control. Governments were motivated by a variety of factors including concerns that their countries were not reaping

17
a fair share of the benefits of the exploitation of national resources. This coincided with a broadly held view that state engagement and control of the economy would lead to more rapid industrialization and faster growth than reliance on free markets.
Poor results from state ownership, and the need to attract new investment that
could not be financed by the state, led governments in Latin America, Africa and elsewhere to swing back towards private mining. Chile was one of those that led the way from the 1980s onward when it encouraged new private investment in its copper sector to operate in parallel with state-owned Codelco. Peru reformed its mining laws, privatized state assets and offered attractive terms and conditions to new investors. Brazil changed its rules about private ownership and privatized its flagship state mining company, CVRD. In Zambia, as the once powerful copper industry began to collapse under state ownership, low prices and lack of investment, the government changed course and initiated privatization of the sector and actively sought new private investment.
Overall, the outcomes of greater private sector involvement in terms of
investment, productivity, production and profitability have been very positive. Chilean copper production grew from around 1.5 million tons of copper per year in 1988, to more than 5.5 million today. In Zambia, after falling from a pre-nationalization level of 750,000 tons to 250,000 tons, output has now increased to about 500,000 tons.
Box 4.1 The Zambian Copper Industry – Nationalization and Privatization In the 1950s and 1960s, Zambia was a leading producer of copper. The industry was owned and controlled by a small number of South African and British mining companies dominated by the Anglo American Group and Roan Selection Trust. After independence in 1964, the mines continued to operate under private ownership and annual copper production peaked at about 750,000 tons in 1973, accounting for 10% of world production. In 1982, the Zambia government, driven by concerns to maximize national benefits from mining, nationalized the sector and vested all interests in one state-owned company, ZCCM Limited. Following nationalization, the industry suffered a series of problems caused by under investment and weak management. The contribution of the industry to the government in terms of revenues fell substantially as a result of lower production and low prices. In the mid 1990s, faced with large losses at ZCCM and the need for large new investments, the government embarked on a difficult and drawn out process of privatization that was substantially completed by 2000. By that time, Zambian copper output had fallen to only 257,000 tons. Following privatization, ownership of the Zambian copper industry eventually ended up in the hands of a number of relatively small international companies including some from developing countries. These companies have taken strong actions to reduce costs and invest to increase production. Output is expected to be over 500,000 tons in 2006 and, with further investments now being planned, could grow to reach 800,000 tons in a few years. The Zambian government, assisted by international institutions such as the World Bank has, however, been left with the task of addressing many of the social and environmental legacies from the period of state ownership.

18
Break up of the Soviet Union
For most of the past 50 years, the huge resource sectors of the Soviet Union were off limits to private investors. The transition of the Soviet bloc countries to market economies involved wrenching economic changes including a move away from heavy industrial development and the disruption of previous trading relationships. These led to substantially reduced demand for many commodities within these countries. Where these commodities were not competitively tradable internationally, this in turn led to drastic internal contraction and restructuring, but in other cases it freed up capacity for export.
Liberalization also opened up rich mineral resources and processing plants to
private and foreign investors. From the early 1990s, state mining enterprises have been progressively privatized. Most of the new private resource companies are domestically controlled, although there are some examples of foreign private investment and minority interests in mining ventures. A number of the newly private companies have begun to invest internationally. Norilsk in Russia is the world’s leading nickel producer with a market capitalization of $25 billion. It has made mining investments outside of Russia as well entering into ventures with foreign companies. Other mining companies from the region are also tapping international capital markets and making investments overseas. China
China accounts for a major part of world demand for metals and for a very large share of recent growth in demand. It is also one of the world’s largest mining countries. It is the number one miner of coal, lead, zinc and iron and the number one producer of steel, aluminum and refined zinc, tin and lead. Gradual liberalization is taking place in the Chinese mining and metals sector, with the government opening the sector to private and foreign investors. A number of Chinese mining and metals companies are listed on domestic and offshore exchanges, such as Hong Kong stock, with the objectives of (i) tapping international capital markets; (ii) introducing international operational and management to best practices; and (iii) broadening their shareholder base.
In the past, the Chinese industry has been primarily focused on local production,
but Chinese companies are increasingly active in other parts of the world. In Australia, Chinese companies have taken important stakes in projects that are at least partially focused on supplying China. In developing countries such as Gabon, Mongolia, Papua New Guinea, Peru, and Zambia, Chinese mining companies are investing or contemplating new investment. Foreign mining investment in China is small but growing. These investments come in two main categories:
(i) Strategic investment by foreign majors in Chinese companies. Glencore,
from Switzerland, recently signed a Memorandum of Understanding (MOU) to buy a stake in Qingtongxia Aluminum, the second largest aluminum producer in China.

19
(ii) Western junior gold mining companies, whose major operating assets are their exploration and mining rights to Chinese assets, have been listed on exchanges in Australia, Canada and UK., e.g., Sinogold and Mundoro.
Private Sector Management of the Metals Industry
The share of the world’s mining industry now being managed by private investors
and subject to some degree of market discipline has increased to its highest levels in the last fifty years5. As discussed, in some countries there have been recent reversals to this trend, including moves to increase state equity participation. However, given the apparent continuing broad move to private sector ownership and management of mining in major mining countries such as China, Russia, India and Central Asia, the global industry will continue to become more private and more global.
Graph 4.7 Private Sector Share of Mining Production (%) 1975-2005
Private Share of Mining (non-weighted average 8 metals)
50.0
55.0
60.0
65.0
70.0
75.0
1975 1984 1989 2000 2005
Source: Raw Materials Group, Stockholm
Private ownership of metals processing shows a similar pattern but a lower level
of private control, given the importance of Chinese and other state-owned processing assets such as aluminum smelters.
However, despite the broad trend towards privatization and liberalization, there
are still barriers to new private sector mining investment. In a number of the world’s major mining countries, the transition to private-sector mining development is not complete. In some sub sectors, state ownership remains important and precludes private investment. In others, foreign investment is inhibited by formal or informal barriers, as governments aim to ensure locally-owned companies play the leading role in the sector. Elsewhere, a resurgence of resource nationalism appears to be leading to new restrictions
5 In the absence of available comprehensive statistics, RMG, for this graph, treats the Chinese mining sector as fully in state control. This will understate the total share of the private sector

20
and conditions for foreign investment, including requirements for government ownership participation, which will likely constrain investment.
In the case of other developing countries, governments may wish to attract new
investment but investors may be inhibited by factors such as: uncertain investment frameworks; investor perceptions of political risk; and, weak governance capacity that delays resolution of issues, such as managing local and national concerns about development, or in finding ways to address issues such as the need for shared infrastructure.
Even in open developed market economies, public opinion and resistance by local
communities can slow and even prevent new mining-related developments or expansions. In some cases, new developments may not be warranted but in others it may be a syndrome of local opposition to developments in their neighborhood (NIMBY).
Corporate Concentration
A long standing feature of international cross border mining investment has been
the domination of companies from a relatively narrow group of countries, such as the USA, Canada, Britain, Australia and South Africa. Increased globalization of financial markets means that categorization of the underlying ownership and effective nationality of companies is becoming less clear cut. However, powerful new resource companies are emerging from developing countries. With a strong local base, substantial value and access to local and international capital—and in some cases a national imperative to find and develop resources internationally—some of these companies may develop into strong international competitors to the existing international mining companies.
In addition to companies from Russia and China, CVRD of Brazil is one of the
world’s major mining companies and has begun to invest overseas. It is bidding a reported US$17 billion for Inco, a major Canadian nickel miner. Vedanta, a mid-sized Indian mining company quoted on the London exchange with a market capitalization of $7 billion, has been a successful investor in Zambia’s copper industry as well as in Australia. Rusal, a Russian aluminum producer which may merge with another Russian company, Sual, to form the world’s largest aluminum company, is investing in bauxite and alumina in Guinea. Mittal, controlled by an Indian entrepreneur, has become the world’s largest private steel company and a substantial iron ore producer. Backward integration into raw material production by companies such as Mittal and Rusal in the steel and alumina industries, respectively, is one factor driving increased ownership interest in international mining by Russian, Indian and Chinese companies.
While there has been an increase in corporate concentration by some measures across most of the major metals during the period 1975-2005, this has not been marked enough to impact the underlying competitiveness of these markets. Even in sub-sectors where the degree of concentration is highest, such as platinum, there is little sign in practice of producers being able to exploit market power. In the case of iron ore, seaborne trade is dominated by three companies (BHP Billiton, Rio Tinto and CVRD),

21
and prices are set by annual price negotiations for the year ahead. But some commentators see this as a special case, at least in the recent years of soaring demand. Table 4.3 Mining Sector Concentration by Company 1975-2005
Sector Top 5 producers % 2005
Top 5 producers % 1975
Gold Mining 33.9 54.8 Platinum Mining 86.6 63.3 Copper Mining 39.1 29.7 Iron Ore 41.3 16.9 Aluminum 46.9 38.9 Bauxite Mining 47.3 48.8 Nickel Mining 53.3 51.5 Lead Mining 28.9 22.9 Zinc Mining 27.3 21.7
Source: Raw Materials Group, Stockholm When it comes to concentration as measured by overall company size, the 10
largest companies account for 27% of the value of total production (despite much higher concentration levels in individual metals)6. Growth in industry size and new entrants have limited the impact on industry concentration from recent acquisitions.
Consolidation within the industry has led to larger companies that should be better
able to manage the largest projects, absorb risks and manage commodity cycles as well as reap greater economies of scale and achieve operating efficiencies. Some analysis7 have shown that mergers led to short-term reductions in exploration budgets of the combined entity following the merger. Given the dynamic nature of the industry, including the importance of small entrepreneurial “juniors” in this respect, it is not clear by how much the long-run volume of exploration spending is going to be impacted ultimately. Other factors such as metals price movements and access to capital by junior mining companies appear to have dominated recent investment trends. The Emergence of Sustainability as a key Factor in Mining Development
Concerns about the sustainability of mining activities from an environmental, social and economic perspective have increasingly become a major part in how mining companies operate and develop resources, and in some cases, whether they can access resources and operate at all.
Initially, concerns were focused on the immediate environmental impacts of operations from the processes used, waste materials generated, and the impact on the physical landscape. In some cases, concerns about the impact on health of using products, such as lead or asbestos, ultimately had major ramifications for commodity production.
6 Raw Materials Group, Stockholm, Who Owns Who in Mining 2006 7 D. Pannell: Presentation to Melbourne Mining Club: Challenges to Meeting Global Metals Demand, Metals Economics Group: World Exploration Budgets 2005.

22
Concerns broadened to include social issues and the extent to which local
communities benefited in a sustainable way from mines that were developed in their communities. Local groups in some countries continue to be active in voicing concerns about, and in some cases acting to oppose, projects that they see as not delivering appropriate benefits to the community. In Peru and Argentina, for example, communities have blocked potential mining investments from going ahead.
More recently, there have been concerns about the overall national economic
benefits of resource development and the threat of the “resource curse”. While many developing countries such as Chile, Botswana, Malaysia, South Africa, Brazil and others have clearly benefited from resource development, there are also examples of countries where rich resource developments have not been accompanied by sustainable economic growth and development, for example, Zambia in the past. This latter concern has focused attention on the importance of governance in determining how well countries use their resource industries as a vehicle for broader development.
Addressing the environmental impacts of mining, and to some extent the local
community issues, will be continuing challenges but that are to some extent within the control of the mining industry. Some issues, though, require the engagement of competent governments and are outside the capacity of investors to address alone. Nevertheless, investors and increasingly their financiers are likely to continue to be held accountable for poor outcomes in communities and countries.
Managing sustainability issues and the risks associated with them has become a
priority for operational staff at the project level and a preoccupation for company chief executives. Success or not in this respect can influence corporate access to resources, the capacity to operate effectively, and the access to financing. At the industry level, there are a number of efforts by different groups of stakeholders involving governments, industry and civil society to promote best practices. The Mining and Minerals Sustainable Development (MMSD) initiative was one particular example of a large industry led initiative. The International Council on Mining & Metals (ICMM), a leading international mining association, has continued on from the MMSD process to develop and promote the implementation of sustainable approaches to mining among its members and more widely. Many mining country governments and companies have supported the Extractive Industries Transparency Initiative (EITI) that aims to increase transparency about payments to governments from oil, gas and mining companies.
Success in ensuring that mining development brings sustainable benefits to communities and countries is going to be important because of its implications for the welfare of these communities and countries, and also because of its impact on international markets depending on the ability of the industry to successfully develop and operate mines in these countries.

23
5. The Longer-Term Outlook
Analysis of metals market and price tends to cover the short term of five to ten years ahead. In this time frame, views about supply and demand and prices can be largely determined from an assessment of where the industry is in the metal price cycle, current demand trends, and known plans and construction of capacity underway. Looking to the longer term, more fundamental analysis of long-run demand and supply outcomes become more important in understanding how markets will meet expected future metals demand growth and at what cost. In particular, will the last thirty years or so of declining average real prices be reversed as costs of production rise.
Ultimately, prices are set by long-term marginal costs of production. The past thirty years has shown that competitive markets have allowed the industry to achieve technical and operational improvements to find, produce and process metals at decreasing real costs. This should give some confidence about the future. The known and probable resource base is large and potentially well able to meet expected demand for a long time. There are new technologies to reduce costs in mining and processing that are now being evaluated or developed, and, no doubt, many others will emerge over time.
Table 5.1 Estimated Long-Run Marginal Costs
units LRMC 2005
average market price
2006 Q1 average market price
1990-2004 average price,
nominal terms
1990-2004 average price, 2005
Aluminum US$/tonne 1700-1800 1897 2421 1462 1696 Copper US cents/lb 110-115 166.9 224 96.3 117.2
Lead US$/tonne 650-7000 975 1242 581 692 Zinc US$/tonne 1150-1250 1382 2242 1065 1278
Nickel US cents/lb 450-500 669 672 345 407 Iron ore -fines US cents/dmtu 40-43 61.7 73.4 29.6 35
Tin US$/tonne n.a. 8096 7606 5881 6651 Gold US$/oz n.a. 445 553 271 409
Source: Commodities Research Unit, London However, a number of factors could increase costs and ensure a higher average
level of real prices than during 1990-2004. Energy costs are expected to be higher and mining and metals processing are energy intensive. Water use issues are becoming a concern. Ore grades are likely to continue to fall for a number of metals. Exploration is seen as more expensive and more new mines look likely to be located in more remote locations that need expensive infrastructure. The trend away from underground mining to open pits, which enabled greater economies of scale and reduced costs to offset declining ore grades in the past, may be reversed to some extent.

24
Demand
Given current low levels of metals use in developing countries, the potential for continued strong growth in demand is high. Although demand growth in China, which has been responsible for as much as 70% of recent demand growth for some metals, will at some point slow, there is substantial longer-run demand growth potential in China and other developing countries. The total population of the rest of the developing world excluding China is some four times that of China. Their aggregate contribution to world economic growth over the next 25 year is expected to be substantially greater.
In the case of copper, possible levels of future demand are illustrated in table 5.2.
It shows potential levels of copper demand if developing countries were to reach copper consumption levels of about 5 to 7 kg per capita, which compares to the current developed country average of 7 kg. Such levels of demand would depend on these countries reaching real income levels similar to those of the developed countries today. Table 5.2 Prospective Developing Country Copper Demand
Developing Countries
Current Population (millions)
Per capita copper use (kg capita)
Current demand
(000s tpa)
Potential Long-term Demand (000s tpa) assuming copper use of 5-
7 kg per capita China 1,323 3 3,500 6-9,000 India 1,106 0.4 400 7-10,000
Others 3,061 1.2 3,400 20-27,000 Total 6,353 7,300 33-46,000
Source: The World Bank Group, Commodities Research Unit, London
In the past fifteen years, copper demand increased by 6 million tons. If global copper demand were to grow for the next 15 years (to 2020) at the same rate as it has for the last 15 years (3% pa), and some analysts believe it will grow more quickly, then annual copper demand would increase by 10 million tons pa, compared with total world demand today of 16.9 million tons pa. A further fifteen years of growth at 3% pa (to 2035) would lead to demand growing by another 15 million tons pa. To achieve this growth in demand, the industry would need to find new supply to replace depleting mines.
The potential for substantial demand growth in other metals from developing
countries is very large. Applying the same sort of arithmetic as applied to copper in table 5.1 above, indicates possible long-term growth in aluminum demand from developing countries of some two to three times world consumption today.
25
Box 5.1 Beyond China: India and Other Developing Countries
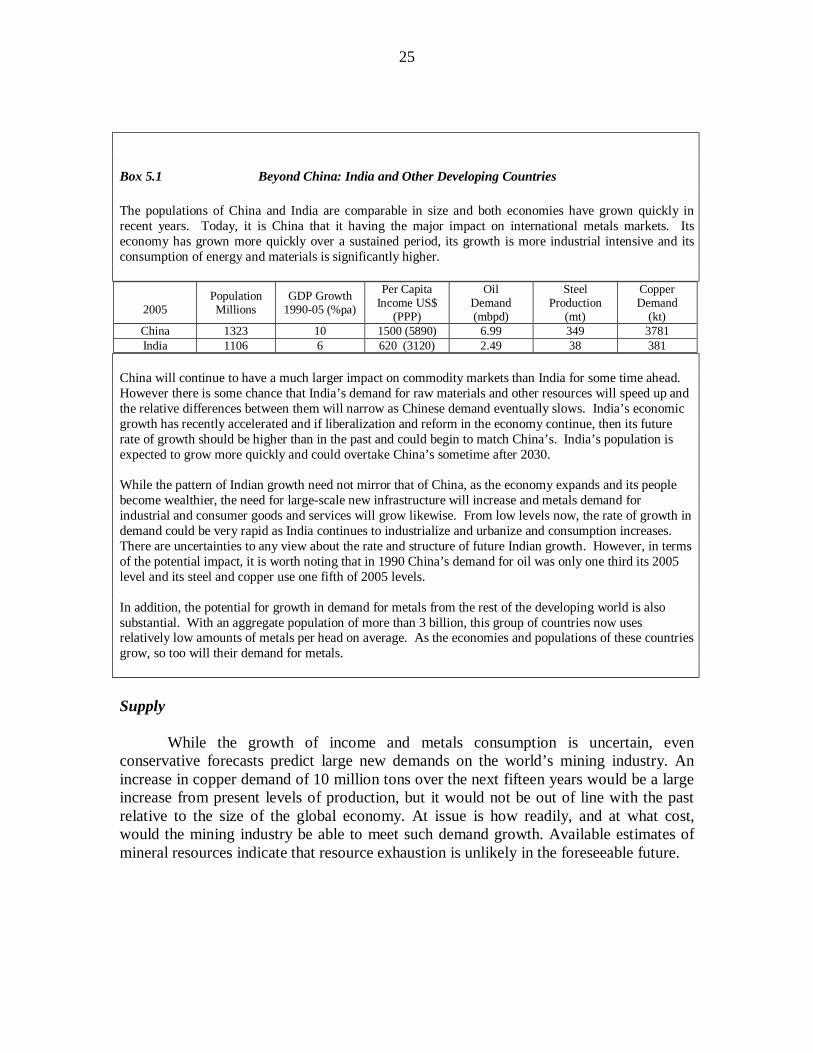
The populations of China and India are comparable in size and both economies have grown quickly in recent years. Today, it is China that it having the major impact on international metals markets. Its economy has grown more quickly over a sustained period, its growth is more industrial intensive and its consumption of energy and materials is significantly higher.
2005
Population Millions
GDP Growth 1990-05 (%pa)
Per Capita Income US$
(PPP)
Oil Demand (mbpd)
Steel Production
(mt)
Copper Demand
(kt) China 1323 10 1500 (5890) 6.99 349 3781 India 1106 6 620 (3120) 2.49 38 381
China will continue to have a much larger impact on commodity markets than India for some time ahead. However there is some chance that India’s demand for raw materials and other resources will speed up and the relative differences between them will narrow as Chinese demand eventually slows. India’s economic growth has recently accelerated and if liberalization and reform in the economy continue, then its future rate of growth should be higher than in the past and could begin to match China’s. India’s population is expected to grow more quickly and could overtake China’s sometime after 2030. While the pattern of Indian growth need not mirror that of China, as the economy expands and its people become wealthier, the need for large-scale new infrastructure will increase and metals demand for industrial and consumer goods and services will grow likewise. From low levels now, the rate of growth in demand could be very rapid as India continues to industrialize and urbanize and consumption increases. There are uncertainties to any view about the rate and structure of future Indian growth. However, in terms of the potential impact, it is worth noting that in 1990 China’s demand for oil was only one third its 2005 level and its steel and copper use one fifth of 2005 levels. In addition, the potential for growth in demand for metals from the rest of the developing world is also substantial. With an aggregate population of more than 3 billion, this group of countries now uses relatively low amounts of metals per head on average. As the economies and populations of these countries grow, so too will their demand for metals. Supply
While the growth of income and metals consumption is uncertain, even
conservative forecasts predict large new demands on the world’s mining industry. An increase in copper demand of 10 million tons over the next fifteen years would be a large increase from present levels of production, but it would not be out of line with the past relative to the size of the global economy. At issue is how readily, and at what cost, would the mining industry be able to meet such demand growth. Available estimates of mineral resources indicate that resource exhaustion is unlikely in the foreseeable future.

26
Table 5.3 World Mineral Resources
World Mineral Resources for Selected Commodities
Units A: Reserves
B: Reserve
base
2005 mine production
Years of supply (A)
Years of supply (B)
Bauxite m tonnes 25,000 32,000 165 152 194 Copper 000 t Cu content 470,000 940,000 14,900 32 63
Gold tonnes Au content 42,000 90,000 2,450 17 37 Iron ore m tonnes ore 160,000 370,000 1,520 105 243
Lead 000 t Pb content 67,000 140,000 3,280 20 43 Nickel 000 t Ni content 62,000 140,000 1,500 41 93
Tin 000 t Sn content 6,100 11,000 280 22 39 Zinc 000 t Zn content 220000 460,000 10,100 22 46
Source: US Geological Survey
Without any increase in reserves, continued demand growth over the long term would lead to reserve-to-production ratios falling rapidly. If copper demand did grow at 3% per annum, then the 470 million tons of reserves, as estimated by the US Geological Service, would last only 32 years (Table 5.2). However, the industry has no incentive to incur costs in proving up reserves beyond, say, 20 years and it is reasonable to expect that as needed, more reserves will be proved up. The reserve base is capable of being expanded through discoveries and changes in technology. Over the past fifty years, for example, the resource base has grown steadily. Some parts of the world have been relatively lightly explored in recent times for base metals.
Graph 5.1 Growth of the Resource Base 1950-2000
Growth of Resource Base
0
20
40
60
80
100
120
1950 1960 1970 1980 1990 2000
Inde
x nu
mbe
r 20
00=1
00
Bauxite Copper Lead Nickel Zinc
Source: Crowson, Astride Mining, Mining Journal Books, 2003
Some industry analysts believe that discoveries are becoming more difficult to
find and point to an apparent fall in the rate of finding major new deposits. They believe
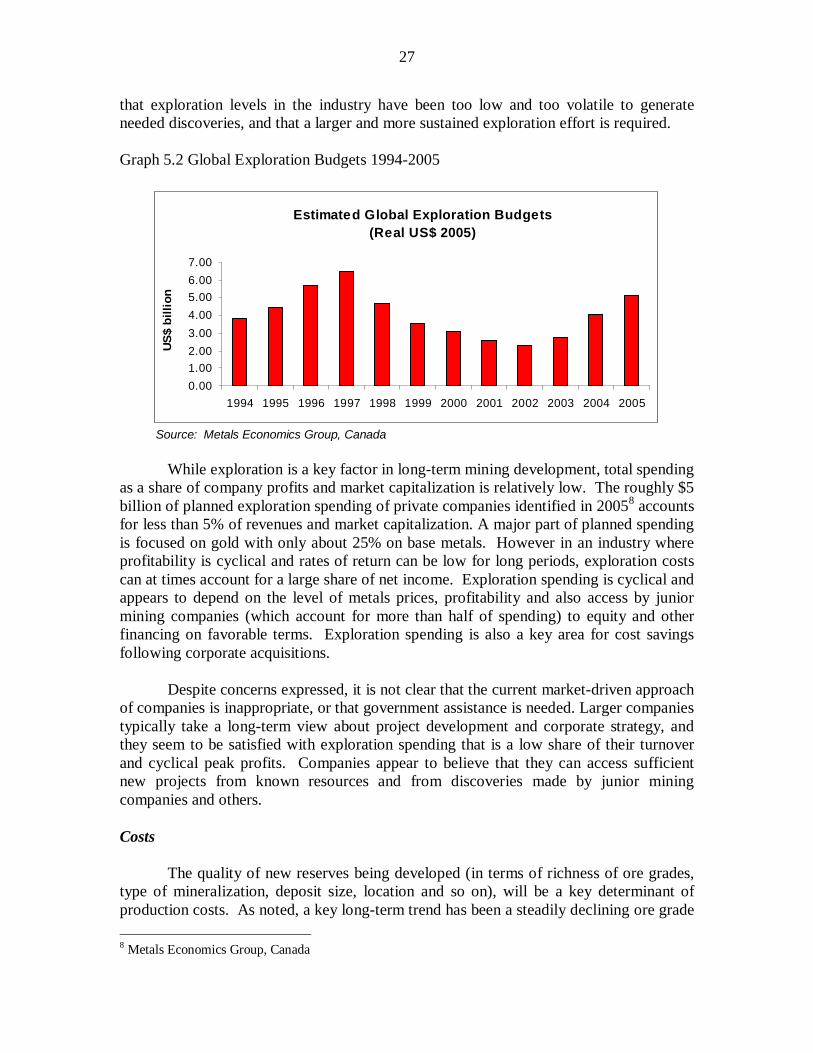
27
that exploration levels in the industry have been too low and too volatile to generate needed discoveries, and that a larger and more sustained exploration effort is required.
Graph 5.2 Global Exploration Budgets 1994-2005
Estimated Global Exploration Budgets (Real US$ 2005)
0.001.002.003.004.005.006.007.00
1994 1995 1996 1997 1998 1999 2000 2001 2002 2003 2004 2005
US
$ bi
llion
Source: Metals Economics Group, Canada
While exploration is a key factor in long-term mining development, total spending
as a share of company profits and market capitalization is relatively low. The roughly $5 billion of planned exploration spending of private companies identified in 20058 accounts for less than 5% of revenues and market capitalization. A major part of planned spending is focused on gold with only about 25% on base metals. However in an industry where profitability is cyclical and rates of return can be low for long periods, exploration costs can at times account for a large share of net income. Exploration spending is cyclical and appears to depend on the level of metals prices, profitability and also access by junior mining companies (which account for more than half of spending) to equity and other financing on favorable terms. Exploration spending is also a key area for cost savings following corporate acquisitions.
Despite concerns expressed, it is not clear that the current market-driven approach
of companies is inappropriate, or that government assistance is needed. Larger companies typically take a long-term view about project development and corporate strategy, and they seem to be satisfied with exploration spending that is a low share of their turnover and cyclical peak profits. Companies appear to believe that they can access sufficient new projects from known resources and from discoveries made by junior mining companies and others.
Costs
The quality of new reserves being developed (in terms of richness of ore grades,
type of mineralization, deposit size, location and so on), will be a key determinant of production costs. As noted, a key long-term trend has been a steadily declining ore grade 8 Metals Economics Group, Canada

28
for some metals. Technical and other operating improvements, including economies of scale, helped offset this and the industry moved along a flat-to-slowly-declining real marginal cost curve. There is a concern that for some metals, more new mines will be underground and relatively smaller scale. Therefore realizing increased economies of scale may be more difficult than in the past. In the copper industry, medium-term projections seem to signal this trend. Graph 5.3 Forecast additions to Copper Mine Capacity 2006-2010
Source: Commodities Research Unit, London In the case of nickel, the lack of new sizeable sulfide ores, and the need to move
to greater use of nickel laterite ores—where processing is more difficult and expensive and currently problematic in some cases—may tend to increase costs in that sector.
In other metals, the prospect that major new developments will be in remote areas
and require significant new infrastructure investment is also seen as likely to increase costs (e.g., the development of Guinea as a major new iron ore producing province). Many major developments (e.g. Western Australia iron ore or Indonesian copper) have required major new investments in infrastructure. These areas have been able to expand in a period of generally declining real prices by increasing production on an incremental basis and leveraging off initial infrastructure and other fixed-cost investment. However, major new developments may require higher prices than the 1990-2004 period average to commence development.
Recent sharp increases in energy costs may prove to be a cyclical phenomenon,
but it looks more likely that oil and other energy prices will on average be higher than in the past. Electricity prices will in some cases also be related to oil costs. Even where not directly linked, the industry is likely to find that electricity costs will tend to move higher as the opportunity cost of electricity increases in many countries as spare hydro and other low-cost sources of electricity are reduced.
Forecast additions to copper mine capacityCapacities of potential greenfield copper mine projects, 2006-2010
0
200
400
600
800
1000
1200
1400
1600
1800
2006 2007 2008 2009 2010
000
typ,
Cu
cont
ent <100ktpy
>100ktpy
Mine size:
Forecast Additions to Copper Mine Capacity Capacities of potential greenfield copper mine projects, 2006-2010

29
Finally, it seems unlikely that the social and environmental demands made on the
sector will diminish. If anything, they are likely to increase and become more uniformly widespread. While it is not possible to predict any long-term trends in terms of government attitudes to private mining and foreign investment, in some countries supply development could be slowed by restrictions on access to attractive resources or discouraged from unattractive fiscal terms. In some cases these may be introduced as a reaction to current exceptional levels of prices and industry profitability. Location of Future Supply
The location of future mine production will be determined mainly by the economic geological resource base, but other factors, such as investors’ capacity to access resources, government policies and so on, will also play a part. Over the last 15 years, the share of world production has increased for Australasia, Asia (especially China) and Latin America, and shares have declined for Africa, Europe, North America and the CIS. The trend in metals refining for China and other Asia to gain substantial share from North America, Europe, CIS and Africa has been even stronger and looks likely to continue in the immediate future.
Looking forward, the location of new mining investment and where mining
production is going to move can be taken from a number of surveys that track known and expected spending by the mining industry in terms of projects that are under construction, known pipeline of possible future projects, and planned exploration spending.
. Table 5.4 Regional Production and Prospective Investment
2005
1990 Mine
Production9
2005 Mine
Production
Construction Underway10.
Pipeline Projects Tracked
Planned Exploration Spending11
Region % Share % Share % Share % Share % Share Africa 11 7 10 16 17
Australasia 13 16 30 20 17 South America 14 20 34 32 18 North America 24 15 13 12 32 Rest of World 38 41 14 19 16
China 8 17 5 2 3 Other Asia 7 10 2 9 3
Europe + CIS 23 14 7 8 10 Total 100 100 100 100 100
Source: Commodities Research Unit, London, Raw Materials Group, Stockholm, Metals Economics Group, Canada
9 Commodities Resources Unit, London. Non-weighted average share of output of 6 metals (gold, copper, zinc, iron ore, nickel, lead) 10 Raw Materials Group, Stockholm. Note data base is likely to understate prospective brown field investments and prospective investments by state and quasi state companies (e.g. in China). 11 Metals Economics Group, Canada 2005 Corporate Exploration Strategies

30
Based on this data, the key messages appear to be:
• The continuing importance of traditional mining centers, such as Australia and North America that account for 30-40% of projects and exploration spending.
• South America to continue to increase its share of production over time. • Low levels of construction underway, prospective projects and exploration for
the rest of the world that includes China, India and CIS. Such messages need to be interpreted cautiously given some uncertainty in the current state of transition of mining in major producing regions such as China, CIS and India, and the probability that investments in these areas may not be fully captured by existing surveys. Given their production bases and land masses, this group’s share of long-term investment is likely to be larger than implied. In the short run, planned exploration spending for this group of countries has grown rapidly. Graph 5.4 Rest of the World Exploration Spending 1996-2005
Rest of the World Exploration (% share)
6
8
10
12
14
16
18
1996 1997 1998 1999 2000 2001 2002 2003 2004 2005
Source: Metals Economics Group, Canada
Conclusions on Longer-Term Supply, Demand and Prices
In a world where long-term growth in demand for metals remains robust and
given the supply challenges facing the industry, there is some probability that the trend of real costs and prices will be higher than recent trend lows (1990-2004 average prices). However, it would be foolish to underestimate the impact of price signals, the power of markets and the versatility of the mining industry to address the challenges that it faces. Although outcomes may vary by metal, the prospects of substantial and sustained price rises look low, given such dynamism in terms of supply and demand responses.

31
Box 5.2 Alternative Scenarios for Supply, Demand and Prices There is little doubt prices will continue to be cyclical and volatile. With an apparently adequate geological base, the future average price of metals is going to depend to some extent on the pace of growth of demand and the capacity of the industry to develop supplies to meet new growth and replace depleting mines. The rate of growth of the world economy and, in particular, the rate of growth of the developing countries will be the key determinants of the pace of growth of metal demand. In a fast growth scenario, China will continue to grow strongly for some time. India will follow, extending its recent period of fast growth. Accompanying these two giants will be the many other developing countries which in aggregate, contain more than 3 billion people. In this scenario, metals demand will continue to grow for some time at faster rates than in the last twenty years. Slower global growth, including a slowdown in China and the failure of India to take off will, conversely, lead to much slower metals demand growth. The outlook for supply will depend on many factors, but the key is likely to be the ability of the mining sector to access the best resources for development. In an optimistic scenario, current trends towards a more open and globally competitive metals market for trade and investment will continue. Regions such as Russia, China, India and Central Asia will continue to liberalize their metals sectors and encourage new private investment from both local and foreign investors. Latin America will resist calls in some countries to move back to greater state control, and in Africa, issues relating to political insecurity and infrastructure will be addressed effectively. Leading companies from all regions will spread more internationally providing new sources of investment, expertise and competition in international mining. In developed countries, governments will steer a reasonable line that balances industry needs with constraints and safeguards. In such a world, the level of effective long-term investment would be optimized and supply would more often comfortably meet demand. In the alternative supply scenario of a protectionist and over-restrictive world, where competition is lessened and distorted, some of the best resources will not be accessible and supply will be less likely to anticipate demand. The outcome for prices will depend on what mix of these alternative scenarios for supply and demand actually eventuate. A combination of strong growth in demand but a relatively poor environment for supply development internationally is more likely to lead to tight supply with prices more often above long-run marginal costs and higher on average.
6. Policy Implications and Challenges
In the short term, two of the most pressing issues facing policy makers in the resource rich countries are:
• To manage increased revenue inflows resulting from high prices, and to
manage the likely cyclical fall in metals prices as supply/demand pressures abate and prices return to more typical levels, i.e., the recurring boom-bust cycle. For resource intensive countries, price falls will have a significant impact on foreign exchange earnings and government tax revenues that will be accentuated by subsequent falling levels of exploration and mine development spending. Some countries, such as Chile which is now receiving substantial

32
windfalls from high copper prices, are already planning for this by allocating revenues to savings and sterilization funds.
• To address concerns about revenue sharing in a systematic way. In times of
high prices, governments can perceive that their returns from mining are inadequate. This can be particularly the case when company profits are large but government revenues lag because of, for example, accumulated depreciation charges or tax free periods which constrain profits tax. Governments must take a longer-term perspective of profitability over the whole investment and price cycles. If investors are to continue to operate, they need to earn adequate returns for shareholders. There may be lessons and experiences for government and industry about the structure of fiscal terms and conditions under which mining is carried out and how these can cope better with cyclical prices.
There does not appear to be any role for governments in short-term supply and
demand management. Markets are working to balance supply and demand and higher prices are a part of this process.
Longer term, the main messages for governments are: Facilitate Access by Private Investors, Encourage Competitive Development
• A private-sector-led metals and mining industry should find and produce the
amounts of metals to meet growing demand. While there are examples of successful state mining operations, even these are likely to perform best when they are subject to commercial and market disciplines.
• Governments can assist by providing appropriate oversight and administrative
services and by setting up policy frameworks that facilitate access to, and the most effective development of, their resources and long-term operation. In the case of some major mining provinces, access by foreign private investors is difficult today and governments should aim to better ensure access on appropriate terms to foreign as well as local private investors.
• Even in developed countries which typically have open international access,
governments need to periodically review licensing and other conditions for mining development. They should ensure there is a reasonable balance between environmental, social and economic conditions in order that sustainable mining can proceed.
• There do not appear to be any reasons why governments need concern
themselves with international metal pricing mechanisms. International metals markets are competitive and prices determined on the basis of marginal costs of production in the long run. Unlike the case of the oil sector, there is no dominant producer group that can determine prices for any significant time by

33
managing supply. Recent consolidations in the metals sector have increased concentration, but this does not appear to have altered the competitive nature of markets. Also in contrast to the case of oil product prices in some countries, metals are not typically heavily taxed or subsidized to consumers and other users.
• It is not clear that self sufficiency, in terms of raw material production or metals
processing, is a useful economic policy objective. Almost no country is fully self sufficient in all metals, and for many countries self sufficiency in any metal is not a feasible objective.
• Barriers remain to free trade and investment in mining and governments should
aim to further promote international trade and investment in mining and metals, including reducing formal and informal barriers to local and foreign private investment. They should aim to address fiscal and other economic distortions that effectively subsidize or protect local production and impact the location of mining and metals processing investments and trade flows.
Actively Engage When Government has a Distinctive Role
• In the case of new mining provinces, especially in risky countries, large-scale
infrastructure investment may significantly increase development capital costs and perceived risks. While it is not appropriate for the cost of infrastructure used by the mining sector to be subsidized, in some cases governments will need to work with the industry to ensure effective solutions for infrastructure investment that can benefit the country more widely.
• In some cases and some countries, assistance from international institutions may
be needed to help overcome perceptions of high political risks that may otherwise discourage investment, and governments should be prepared to support this continued engagement when appropriate.
• Governments can effectively facilitate metals supply by promoting and
facilitating recycling schemes that make economic and environmental sense. • Metals supply-security issues do not seem to be an appropriate area for active
government intervention in either the short term (e.g. stock holding etc.) or long term (e.g. direct investment or investment subsidies). Even more than is the case with energy security, governments generally are not going to be able to ensure “metals security” by making their countries independent of international markets. Mutual interdependence in a world of open trade is the most effective way forward in this respect.
• Like other sectors, mining industries need to ensure that the environment and
social costs of its operations are mitigated as far as possible, and are reasonable given the benefits generated locally, nationally and internationally. However,

34
while it is the responsibility of the industry to manage these issues (and ultimately for metals consumers to bear the costs), governments need to help by effectively addressing issues that are primarily their responsibility, including helping resolve and address issues at the local community level.
• Relatively low levels of research and development and exploration expenditures
are a long standing feature of the industry, and there appears no role for significant government intervention in these respects. However, there may be areas where governments can selectively work with industry and academia to ensure that appropriate research is conducted in respect of long-term issues of common interest. These could include the implications of global warming and carbon emission reduction objectives for the mining and metals processing industry (e.g. carbonless steel), and longer-term environmental management issues such as water use in mining and long-term mine closure planning.
• Within the Western mining industry a number of commentators have expressed
concern about what they see as a serious skilled labor shortage given the age profile of much of the industry and the diminished flow of new skills from institutions. Governments have a role to work with industry and academia to help address this problem.
Selective Management of Macro Economic Issues
• Other than in the case of individual resource rich countries needing to manage
cyclical fluctuations in their revenues and investment flows from mining, there do not appear to be any urgent global issues of macro-economic management associated with movements in metals prices.
• Mining industries can generate large benefits in terms of tax revenues, foreign
exchange earnings, infrastructure, jobs and supplier linkages and so on. These can provide an important boost to the economy, but are unlikely by themselves to transform economies. The policy challenge for resource rich developing countries is to translate the potential benefits from mining into sustainable development, by ensuring that the overall macro-economic framework and economic management encourage growth and investment more broadly.
• The international community and development institutions can play a part by
supporting governments in areas such as providing assistance to strengthen their capacities for management of their metals sectors and their economies. And by encouraging countries to adopt initiatives such as the Extractive Industries Transparency Initiative (EITI).
Finally, there remains uncertainty about very long-term demand and very long-
term supply costs. Governments and the industry need to keep these under review.

ANNEX
Refined Metals Prices 1990 – 2010 Refined Metals Consumption 1990 – 2010 Per Capita Consumption of Refined Metals 1990 – 2010 Refined Metals Production 1990 – 2010 Metals Mine Production 1990 – 2010


36
1. Refined Metals Prices 1990 – 2010
Copper Prices ($/ton)
0
1000
2000
3000
4000
5000
6000
7000
1990 1995 2000 2005 2010
Aluminum Prices ($/ton)
0
500
1000
1500
2000
2500
3000
1990 1995 2000 2005 2010
Lead Prices ($/ton)
0
200
400
600
800
1000
1200
1400
1990 1995 2000 2005 2010
Nickel Prices ($/ton)
0
2500
5000
7500
10000
12500
15000
17500
20000
1990 1995 2000 2005 2010
Gold Prices ($/toz)
0
100
200
300
400
500
600
700
800
1990 1995 2000 2005 2010
Iron Ore Prices (cents/dmtu)
0
20
40
60
80
1990 1995 2000 2005 2010
Zinc Prices ($/ton)
0
500
1,000
1,500
2,000
2,500
3,000
3,500
1990 1995 2000 2005 2010
U.S. Steel Sheet Prices ($/ton)
0
100
200
300
400
500
600
700
1990 1995 2000 2005 2010

37
2. Refined Metals Consumption 1990 – 2010
Aluminum Consumption ('000 tons)
0
2000
4000
6000
8000
10000
12000
14000
1990 1995 2000 2005 2010
ChinaEuropeN AmerOth AsiaJapanLatin AmCISAfricaOceania
Aluminum Consumption ('000 tons)
0
5000
10000
15000
20000
25000
30000
35000
40000
45000
1990 1995 2000 2005 2010
CISChinaOth AsiaJapanN AmerEuropeLatin AmOceaniaAfrica
Copper Consumption ('000 tons)
0
1000
2000
3000
4000
5000
6000
1990 1995 2000 2005 2010
ChinaEuropeN AmerOth AsiaJapanLatin AmCISAfricaOceania
Copper Consumption ('000 tons)
0
3000
6000
9000
12000
15000
18000
21000
1990 1995 2000 2005 2010
CISChinaOth AsiaJapanN AmerEuropeLatin AmOceaniaAfrica
Lead Consumption ('000 tons)
0
500
1000
1500
2000
2500
3000
3500
1990 1995 2000 2005 2010
ChinaEuropeN AmerOth AsiaJapanLatin AmCISAfricaOceania
Lead Consumption ('000 tons)
0
2000
4000
6000
8000
10000
1990 1995 2000 2005 2010
CISChinaOth AsiaJapanN AmerEuropeLatin AmOceaniaAfrica
Zinc Consumption ('000 tons)
0
500
1000
1500
2000
2500
3000
3500
4000
4500
1990 1995 2000 2005 2010
ChinaEuropeOth AsiaN AmerLatin AmJapanCISOceaniaAfrica
Zinc Consumption ('000 tons)
0
2000
4000
6000
8000
10000
12000
14000
1990 1995 2000 2005 2010
CISChinaOth AsiaJapanN AmerEuropeLatin AmOceaniaAfrica

38
Refined Metals Consumption 1990 – 2010 (cont.)
Nickel Consumption ('000 tons)
0
100
200
300
400
500
1990 1995 2000 2005 2010
EuropeChinaOth AsiaN AmerJapanAfricaCISLatin AmOceania
Nickel Consumption ('000 tons)
0
300
600
900
1200
1500
1800
1990 1995 2000 2005 2010
CISChinaOth AsiaJapanN AmerEuropeLatin AmOceaniaAfrica
Tin Consumption ('000 tons)
0
20
40
60
80
100
120
1990 1995 2000 2005
ChinaEuropeN AmerOth AsiaJapanLatin AmCISAfricaOceania
Tin Consumption ('000 tons)
0
50
100
150
200
250
300
350
1990 1995 2000 2005
CISChinaOth AsiaJapanN AmerEuropeLatin AmOceaniaAfrica
Iron Consumption (m tons) (Pellets, Fines and Lumps )
0100200300400500600700800900
1000
1990 1995 2000 2005 2010
ChinaOth AsiaEuropeCISJapanLatin AmN AmerAfricaOceania
Iron Consumption (m tons) (Pellets, Fines and Lumps )
0
400
800
1200
1600
2000
1990 1995 2000 2005 2010
CISChinaOth AsiaJapanN AmerEuropeLatin AmOceaniaAfrica
Steel Consumption (m tons) (Traded Hot-Rolled Sheet Products)
0
10
20
30
40
50
60
70
1990 1995 2000 2005 2010
ChinaEuropeOth AsiaN AmerOtherJapanLatin AmCISOceania
Steel Consumption (m tons) (Traded Hot-Rolled Sheet Products)
0
50
100
150
200
250
1991 1996 2001 2006
CISChinaOth AsiaJapanN AmerEuropeLatin AmOceaniaOther
Note: China iron ore consumption includes ore with low Fe content.
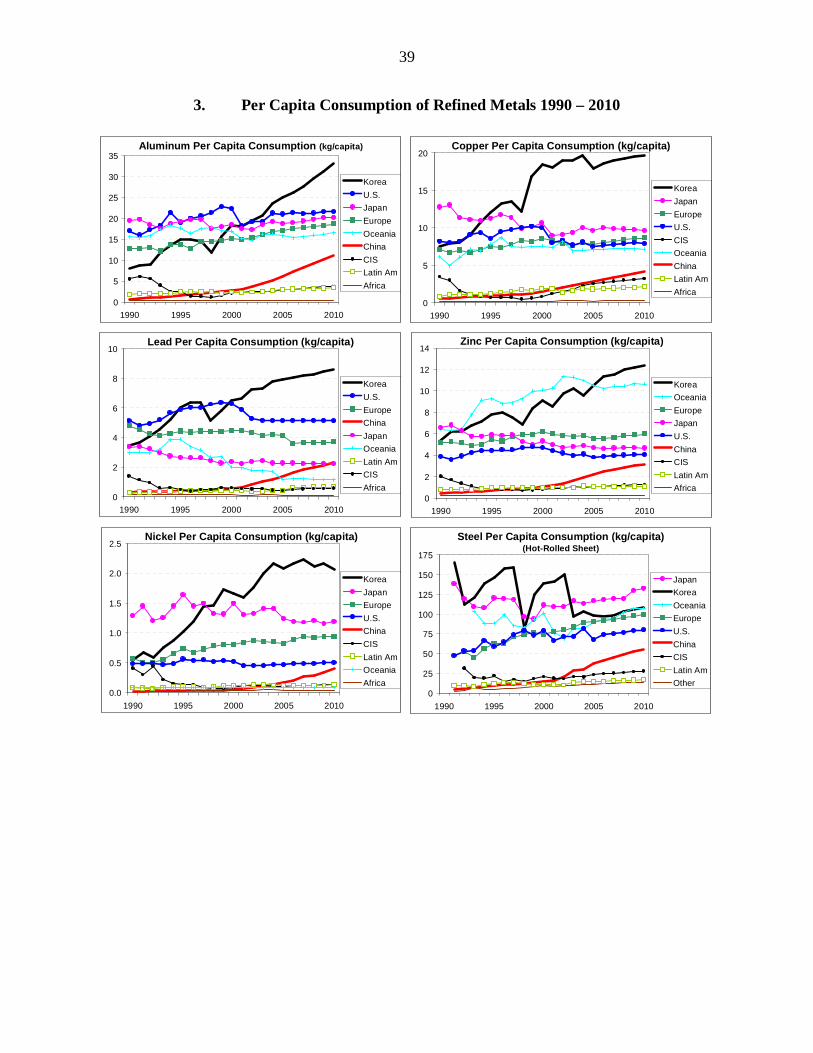
39
3. Per Capita Consumption of Refined Metals 1990 – 2010
Aluminum Per Capita Consumption (kg/capita)
0
5
10
15
20
25
30
35
1990 1995 2000 2005 2010
KoreaU.S.JapanEuropeOceaniaChinaCISLatin AmAfrica
Copper Per Capita Consumption (kg/capita)
0
5
10
15
20
1990 1995 2000 2005 2010
KoreaJapanEuropeU.S.CISOceaniaChinaLatin AmAfrica
Lead Per Capita Consumption (kg/capita)
0
2
4
6
8
10
1990 1995 2000 2005 2010
KoreaU.S.EuropeChinaJapanOceaniaLatin AmCISAfrica
Zinc Per Capita Consumption (kg/capita)
0
2
4
6
8
10
12
14
1990 1995 2000 2005 2010
KoreaOceaniaEuropeJapanU.S.ChinaCISLatin AmAfrica
Nickel Per Capita Consumption (kg/capita)
0.0
0.5
1.0
1.5
2.0
2.5
1990 1995 2000 2005 2010
KoreaJapanEuropeU.S.ChinaCISLatin AmOceaniaAfrica
Steel Per Capita Consumption (kg/capita)(Hot-Rolled Sheet)
0
25
50
75
100
125
150
175
1990 1995 2000 2005 2010
JapanKoreaOceaniaEuropeU.S.ChinaCISLatin AmOther

40
4. Refined Metals Production 1990 - 2010
Aluminum Refined Production ('000 tons)
0
2000
4000
6000
8000
10000
12000
14000
1990 1995 2000 2005 2010
ChinaN AmerEuropeCISOth AsiaLatin AmAfricaOceaniaJapan
Aluminum Refined Production ('000 tons)
0
5000
10000
15000
20000
25000
30000
35000
40000
45000
1990 1995 2000 2005 2010
CISChinaOth AsiaJapanN AmerEuropeLatin AmOceaniaAfrica
Copper Refined Production ('000 tons)
0
1000
2000
3000
4000
5000
6000
1990 1995 2000 2005
Latin AmChinaEuropeOth AsiaN AmerJapanCISAfricaOceania
Copper Refined Production ('000 tons)
0
4000
8000
12000
16000
20000
24000
1990 1995 2000 2005
CISChinaOth AsiaJapanN AmerEuropeLatin AmOceaniaAfrica
Lead Refined Production ('000 tons)
0
500
1000
1500
2000
2500
3000
3500
1990 1995 2000 2005 2010
ChinaEuropeN AmerOth AsiaLatin AmOceaniaCISJapanAfrica
Lead Refined Production ('000 tons)
0
2000
4000
6000
8000
10000
1990 1995 2000 2005 2010
CISChinaOth AsiaJapanN AmerEuropeLatin AmOceaniaAfrica
Zinc Refined Production ('000 tons)
0
500
1000
1500
2000
2500
3000
3500
4000
4500
1990 1995 2000 2005 2010
ChinaEuropeOth AsiaN AmerCISLatin AmJapanOceaniaAfrica
Zinc Refined Production ('000 tons)
0
2000
4000
6000
8000
10000
12000
14000
1990 1995 2000 2005 2010
CISChinaOth AsiaJapanN AmerEuropeLatin AmOceaniaAfrica
Forecast is for zinc capacity
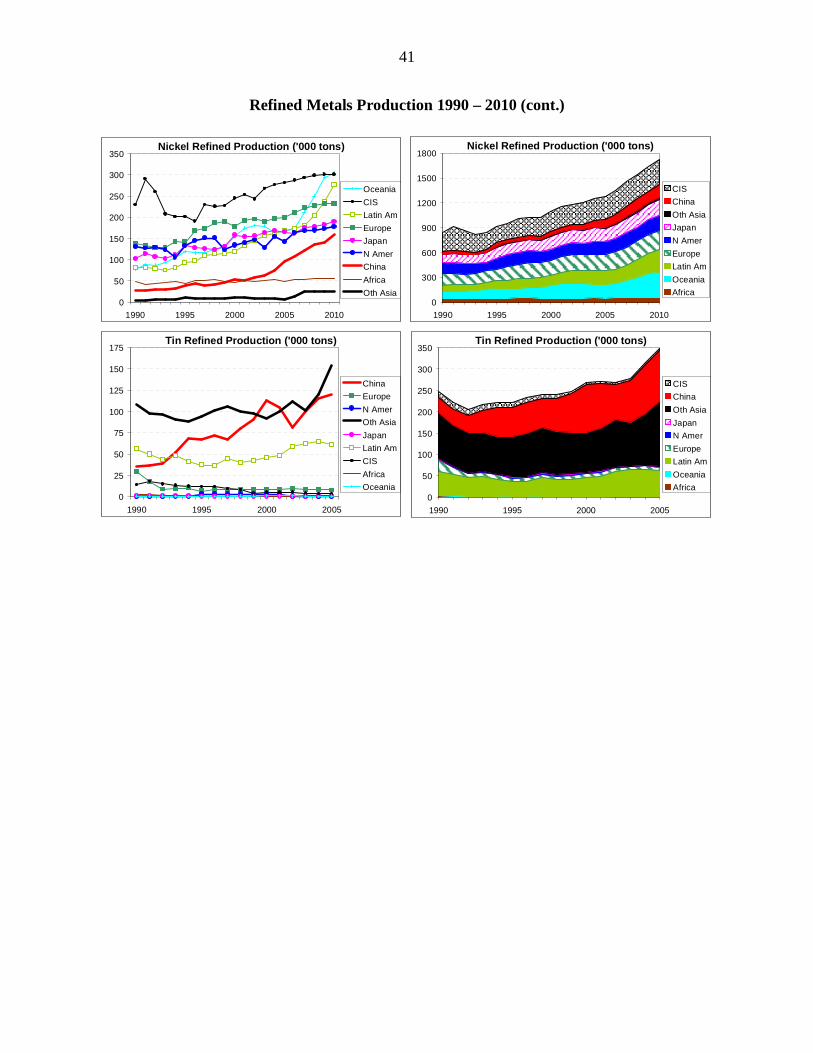
41
Refined Metals Production 1990 – 2010 (cont.)
Nickel Refined Production ('000 tons)
0
50
100
150
200
250
300
350
1990 1995 2000 2005 2010
OceaniaCISLatin AmEuropeJapanN AmerChinaAfricaOth Asia
Nickel Refined Production ('000 tons)
0
300
600
900
1200
1500
1800
1990 1995 2000 2005 2010
CISChinaOth AsiaJapanN AmerEuropeLatin AmOceaniaAfrica
Tin Refined Production ('000 tons)
0
25
50
75
100
125
150
175
1990 1995 2000 2005
ChinaEuropeN AmerOth AsiaJapanLatin AmCISAfricaOceania
Tin Refined Production ('000 tons)
0
50
100
150
200
250
300
350
1990 1995 2000 2005
CISChinaOth AsiaJapanN AmerEuropeLatin AmOceaniaAfrica

42
5. Metals Mine Production 1990 – 2010
Copper Mine Production ('000 tons)
0
1000
2000
3000
4000
5000
6000
7000
8000
9000
1990 1995 2000 2005 2010
Latin AmN AmerOth AsiaEuropeAfricaOceaniaChinaCIS
Copper Mine Production ('000 tons)
0
4000
8000
12000
16000
20000
1990 1995 2000 2005 2010
CISChinaOth AsiaJapanN AmerEuropeLatin AmOceaniaAfrica
Lead Mine Production ('000 tons)
0
300
600
900
1200
1500
1800
1990 1995 2000 2005 2010
ChinaOceaniaLatin AmN AmerEuropeAfricaOth AsiaCIS
Lead Mine Production ('000 tons)
0
500
1000
1500
2000
2500
3000
3500
4000
4500
1990 1995 2000 2005 2010
CISChinaOth AsiaJapanN AmerEuropeLatin AmOceaniaAfrica
Zinc Mine Production ('000 tons)
0
500
1000
1500
2000
2500
3000
3500
1990 1995 2000 2005 2010
ChinaLatin AmOceaniaN AmerEuropeCISOth AsiaAfrica
Zinc Mine Production ('000 tons)
0
2000
4000
6000
8000
10000
12000
14000
1990 1995 2000 2005 2010
CISChinaOth AsiaN AmerEuropeLatin AmOceaniaAfrica
Nickel Mine Production ('000 tons)
0
100
200
300
400
500
1990 1995 2000 2005 2010
OceaniaLatin AmOth AsiaCISN AmerAfricaEuropeChina
Nickel Mine Production ('000 tons)
0
500
1000
1500
2000
1990 1995 2000 2005 2010
CISChinaOth AsiaN AmerEuropeLatin AmOceaniaAfrica

43
Metals Mine Production 1990 – 2010 (cont.)
Bauxite Production ('000 tons)
0
10000
20000
30000
40000
50000
60000
1990 1995 2000 2005
OceaniaLatin AmAfricaChinaOth AsiaCISEuropeN Amer
Bauxite Production ('000 tons)
0
25000
50000
75000
100000
125000
150000
175000
1990 1995 2000 2005
CISChinaOth AsiaN AmerEuropeLatin AmOceaniaAfrica
Tin Mine Production ('000 tons)
0
25
50
75
100
125
150
1990 1995 2000 2005
Oth AsiaChinaLatin AmCISOceaniaAfricaEuropeN Amer
Tin Mine Production ('000 tons)
0
50
100
150
200
250
300
350
1990 1995 2000 2005
CISChinaOth AsiaN AmerEuropeLatin AmOceaniaAfrica
Iron Production - Pellets, Fines and Lump (m tons)
0
100
200
300
400
500
600
1990 1995 2000 2005 2010
ChinaLatin AmOceaniaCISOth AsiaN AmerAfricaEurope
Iron Production - Pellets, Fines and Lump (m tons)
0
500
1000
1500
2000
1990 1995 2000 2005 2010
CISChinaOth AsiaN AmerEuropeLatin AmOceaniaAfrica
Steel Hot-Rolled Sheet (m tons)
0
20
40
60
80
1990 1995 2000 2005 2010
ChinaEuropeOth AsiaN AmerJapanCISLatin AmAfricaOceania
Steel Hot-Rolled Sheet (m tons)
0
50
100
150
200
250
1991 1996 2001 2006
CISChinaOth AsiaJapanN AmerEuropeLatin AmOceaniaAfrica
Note: China iron ore production includes ore with low Fe content.