the origin of severe winds in a tornadic bow-echo storm
TRANSCRIPT

The origin of severe winds in a tornadic
bow-echo storm over northern Switzerland
Willi Schmid and Hans-Heinrich Schiesser
Atmospheric Science, ETH, CH-8093 Zürich, Switzerland
Markus Furger
Paul Scherrer Institute, CH-5232 Villigen PSI, Switzerland
Mario Jenni
Institute of Geography, University of Berne, CH-3012 Berne, Switzerland
Final manuscript, published inMonthly Weather Review, 128, 192-207.
Corresponding author address: Dr. Willi SchmidInstitute for Atmospheric Science, ETHCH-8093 Zürich, SwitzerlandTel. +41 1 633 36 25Fax. +41 1 633 10 58Email: [email protected]
- 1 -
urred
rom a
tion of
es fol-
trong
ormed
ated
t signa-
low”
4 km
lses.
the in-
t 7 to
Lat-
ined
Abstract
A severe bow-echo storm over northern Switzerland is investigated. Wind damage occ
along a track 15 km long and some 100 m wide. Damage data, meteorological data f
ground micronet, and Doppler radar data are analysed. Volume-scan radar data in direc
the approaching storm are available every 2.5 min.
The storm reached a weak-evolution mode when the damage occurred. Updraft impuls
lowed each other in time steps of typically 5 min. The damage track can be attributed to a s
radar-observed vortex of 2-7 km diameter. The vortex developed at a shear line that was f
by the downdraft outflow of an earlier thunderstorm cell. Most of the damage was colloc
with the strongest Doppler winds but some of the damage occurred beneath the stronges
ture of azimuthal shear. A weak tornado was observed in that shear region.
The two extremes in Doppler velocity, associated with the vortex and referred to as “inf
and “outflow” velocities, are analysed separately. Early strengthening of the vortex at 2-
altitude was due to an acceleration of inflow velocity, caused by the rising updraft impu
Subsequent strengthening at low layers (0-2 km) could be related to acceleration of both
flow and outflow velocities. At this stage, the diameter of the vortex decreased from abou
less than 2 km. The low-level intensification of the vortex is attributed to vortex stretching.
er on, the vortex and inflow velocity at low layers weakened but the outflow velocity rema
strong.

- 2 -
uthern
. The
of se-
ground
steps
asso-
ar at
efined
re with
e bow-
ciated
.g.,
ution
dis-
-echo
evere
doc-
loped
deep-
more
mul-
1. Introduction
A large mesoscale convective system (MCS) passed over northern Switzerland and so
Germany on 22 July 1995. Hail, water and wind damage was reported in both countries
southern part of the system developed into an intense bow-echo which produced a track
vere wind damage and a weak tornadic event. The parent thunderstorm crossed a dense
micronet and was captured with a Doppler radar, producing sector-volume scans in time
of 2.5 min. Detailed information about the damage is available. The damage track can be
ciated with a rapidly growing thunderstorm cell and with a vortex, observed with the rad
low layers.
Bow-echo storms have been investigated in the U.S. in the last decades. Fujita (1978) d
a bow-echo as an outward bulge within a line of radar echoes and associated the signatu
downbursts. He pointed out that the strongest downbursts may occur near the apex of th
echo. Two explanations for the formation of a bow-echo exist. A bow-echo can be asso
with a “rear-inflow” jet, caused by entraining of dry air into the rear flank of the storm (e
Smull and Houze 1987). Another explanation is that the bow-echo evolves from a redistrib
of hydrometeors due to a vorticity couplet circulation (Lee et al. 1992). Such a circulation
torts an elongated radar echo into a bow shape. Przybylinski (1995) showed that bow
storms exhibit a variety of features that can be associated either with downbursts, s
straight-line winds, or tornadoes. Multiple vortex circulations within bow-echo storms are
umented by Funk et al. (1996a, b). The first of the two studies shows that the vortices deve
in the low-levels as a cyclonic-convergent zone along the bow apex, and intensified and
ened into the middle-levels of the storm. The second study discusses such an evolution in
detail. Three vortex circulations are documented. The three circulations are linked to rapid

- 3 -
por-
and
ny hail-
e se-
s had
rrence
sible
1997).
k et al.
inds,
ls and
iculty
atures.
tion of
that
l res-
vec-
te the
, Kes-
995,
dings
ticellular growth on the leading convective line. Is is argued that vortex stretching is one im
tant element for spin-up of the circulations, generally similar to that found by Wakimoto
Wilson (1989).
Studies about European bow-echo storms are rare. Houze et al. (1993) showed that ma
storms in Switzerland exhibit a “false-hook” structure, similar to bow-echo storms. Thre
vere storms in central Switzerland were analysed in Schmid et al. (1997). Two of the storm
a bow-echo structure. The two storms were similar with respect to the simultaneous occu
of the strongest wind damage and rapidly growing rotating cells. Another storm with a pos
coincidence between a tornado and growing cells has been analysed by Martin et al. (
Hence, these European storms may have similarities to the U.S. storms analysed by Fun
(1996a, b).
Thus, rapidly growing convective cells along a bow-echo are often a source for severe w
e.g., downbursts or microbursts, but also for tornadoes. The link between the growing cel
the damaging winds, however, is not understood in detail. One reason for this is the diff
to document the full sequence of evolving thunderstorm cells and associated vortex sign
The radar data used by Funk et al. (1996a,b) and Schmid et al. (1997) have a time resolu
5-6 min. This time step may lead to errors in the process of identifying and tracking cells
follow each other in time intervals of typically 5 min. Radar measurements with a tempora
olution of 2-3 min or less are required for a reliable analysis of these rapidly changing con
tive elements. High-resolution Doppler studies of similar phenomena exist and demonstra
possibility to identify relevant processes in the formation of downbursts or tornadoes (e.g.
singer et al. 1988, Wakimoto and Wilson 1989, Lee et al. 1992, Roberts and Wilson 1
Wakimoto and Atkins 1996). However, the question remains if one can extrapolate the fin

- 4 -
e for
the
logical
ted with
dar-ob-
e vor-
wth.
ed to
nd to
yers.
ations,
etwork
ology
and
here-
wers,
about
meters
of these studies to the small-scale features along bow-echoes.
The availability of radar volume scans every 2.5 min gives us the possibility to investigat
the first time the full cycle of the events that led to the damaging winds. An overview of
available data can be found in Section 2. In Section 3, we summarize the mesometeoro
setting and the evolution of the storm system. The damage and the radar patterns associa
the damage area are shown in Section 4. The connection between the damage and the ra
served vortex is emphasized. In Section 5 we investigate the formation and evolution of th
tex. We show how the gust front outflow of an earlier cell triggered secondary cellular gro
A sequence of convective “impulses” is observed and analysed. A simple method is us
demonstrate the link between the growing impulses and the formation of the vortex, a
judge the role of vortex stretching in the subsequent strenghtening of the vortex at low la
Conclusions are given in Section 6.
2. Data and procedures
Meteorological data are available from several data sources: two networks of surface st
two radiosounding stations, damage data, satellite data, data from the operational radar n
of Switzerland and data from the Doppler radar at the Swiss Federal Institute of Techn
(ETH). An overview of the investigated area is given in Fig. 1. The radar station on Albis
the sounding station in Payerne are operated by the Swiss Meteorological Institute (SMI
after). The Paul Scherrer Institute (PSI hereafter) operated a dense network of 12 m to
measuring wind, temperature and humidity. Twenty stations were distributed in an area of
20 km radius (crosses in Fig. 1). Time-averaged measurements of meteorological para

- 5 -
n au-
e sta-
ith a
sed to
easure-
. The
of 250
ler
re
ed (at
storm
cedure.
from
PIs at
ere
ards
ction
terly
are stored in 2.5 min intervals. Data from private station owners and from the ANETZ, a
tomatic network operated by the SMI (stars in Fig. 1) are included in the database. Thes
tions provide additional data of pressure, wind, maximum wind gusts and precipitation w
time resolution of 10 min.
Satellite data (METEOSAT) and the data of the operational C-band radar network are u
document the evolution of the system on the mesoscale (see Section 3). Detailed radar m
ments of the event were obtained with the C-band Doppler radar at ETH (Li et al. 1995)
radar is at 600 m MSL, operates at a frequency of 5.63 GHz and has a transmitted power
kW, a half-power beam width of 1.65o, PRFs of 1200/800 Hz (Dual-PRF mode, see e.g., Kee
and Passarelli 1990) and a pulse width of 0.5µs. On 22 July 1995, sector volume scans we
made between 1443 and 1531 UTC in time steps of 2.5 min. Two volume scans were miss
1446 and 1521 UTC). The sector boundaries were continuously adapted such that the
center was scanned by the radar. The elevation angles were fixed by an automated pro
The scans were made “from top to bottom”. The number of scans per volume decreased
15 to 9, depending on the distance of the approaching storm from the radar. Two full P
low elevation angles (3o and 20o) were repeated in time steps of 10 min. The collected data w
processed following the steps given in the Appendix. Hereafter, Doppler velocities tow
(away from) the radar are defined as positive (negative) since the storm occurred in dire
W-WNW from the radar. In such a setting, the Doppler winds represent roughly the eas
component of the wind vectors.

- 6 -
storm
ith a
face
front
t 100
s ob-
f Swit-
a (not
hwand
ther-
y layer
l forc-
ained
ta of
s and
MSL
of low-
hows
asure-
3. Mesometeorological setting and storm evolution
This section summarizes the information about the meteorological environment of the
and highlights the evolution of the storm system. A surface cold front was associated w
weak upper-level trough over the British Isles (Fig. 2). At 1200 UTC a region with a flat sur
pressure distribution over Central Europe (Fig. 2b) was located southeast of the front. The
approached from the NW. A convergence line (dashed line in Fig. 2b) was located abou
km ahead of the front. This convergence line helped initiate the deep convection that wa
served in the subsequent hours.
On the mesoscale, there was a distinct boundary between a moist air mass in the north o
zerland and a drier one further southwest. This becomes evident from the ground dat
shown) and from radiosoundings (Fig. 3a) released in Payerne (1200 UTC) and Merensc
(1400 UTC). The sounding from Merenschwand probably represents best the pre-storm
modynamic environment. The sounding shows a moist layer up to about 600 hPa and a dr
aloft. An inversion at 800 hPa inhibits the release of convection ahead of the strong fronta
ing.
The Merenschwand sounding did not measure wind. Profiles of horizontal wind were obt
with the VVP-technique (Waldteufel and Corbin 1979; Siggia 1991) from the Doppler da
the ETH-radar. The VVP-technique calculates mean wind vectors from the radial velocitie
corrects errors introduced by folded velocity data. Clear-air echoes up to a height of 3 km
were visible ahead of the approaching storm. These echoes indicate a substantial change
level wind, compared to the wind profile measured with the Payerne sounding. Fig. 3b s
the wind hodograph based on a composite of the Payerne sounding and the VVP wind me

- 7 -
ore
gh alti-
and
mp
997)
alcu-
e in-
srud et
ecip-
these
00 J
ower.
ystem
rontal
aphy
tion of
hiesser
ance
em. A
arge
ments. No VVP wind information is available for the levels above 3 km MSL. It is theref
assumed that the Payerne sounding represents the wind environment of the storm at hi
tudes (above 6 km MSL). A linear interpolation of wind was performed for 3-6 km.
The “convective available potential energy” (CAPE hereafter, for definition see Weisman
Klemp 1984), the “Bulk Richardson number” (BRN, for definition see Weisman and Kle
1984), the “Bulk Richardson number shear” (BRNSHR, for definition see Stensrud et al. 1
and “storm-relative environmental helicity” (SREH, see Droegemeier et al. 1993) were c
lated from the data shown in Fig. 3. We obtain CAPE=890 J kg-1, BRN = 18, BRNSHR = 49
m2 s-2, and SREH = 171 m2 s-2. These values indicate an environment that represents som
termediary state between tornadic supercell storms and outflow-dominated storms (Sten
al. 1997, see e.g. Fig. 1b in that study). Outflow-dominated storms might be either high-pr
itation supercell storms, well-organized MCSs, bow-echo storms or a combination of
storm types. The environmental CAPE for such storms is typically of the order of 1500-30
kg-1 in the central U.S. (e.g., Weisman 1993). The CAPE for the here-analysed storm is l
One might therefore argue about the reasons why such a well-organized and long-lived s
nevertheless could develop. Two reasons can be offered. One of them is the forcing by f
circulations, and the second is the interaction of the evolving storm with the complex orogr
(see next paragraph). Both mechanisms can have a significant impact on the organiza
convection within mesoscale convective systems (e.g., Hashem and Biggerstaff 1997; Sc
et al. 1995).
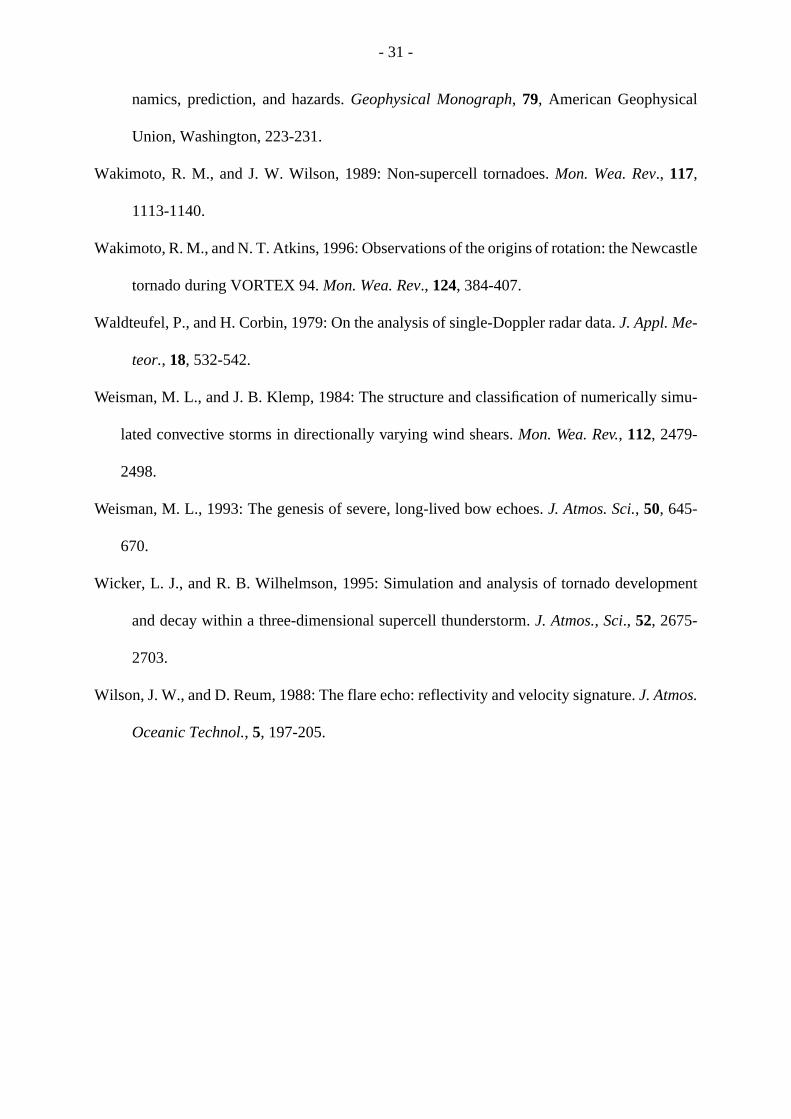
The satellite image of Fig. 4 shows the large cloud shield of the incoming cold front over Fr
and Germany. The convective activity was along the southeastern flank of the cloud syst
cell (arrow, Fig. 4) developed over the ridge of the Jura and grew within 80 min into a l

- 8 -
ding
g. 5a).
ar of
ng the
strong
ld air,
e et
recipi-
ered
e of
f bro-
TC,
ouze
Swiss
hiess-
pos-
of the
known
bow-echo storm. At 1430 UTC the cell merged with the incoming storm system, and its lea
edge advanced quickly through the orographic gap between Jura and Black Forest (Fi
This rapid movement produced a bulge towards the SE. The potentially cold air in the re
the MCS advanced faster than to the north and south where the line was retarded alo
mountains. At 1520 UTC, the severe wind damage and tornado development occurred. A
bow-echo and large notch in the rear of that part of the system indicate a rear inflow of co
according to the conceptual model of a leading line/trailing stratiform (ll/ts) MCS of Houz
al. (1990). The notch might be exaggerated by attenuation of the radar beam by strong p
tation. The cold air moved into the Swiss “Mittelland” (enclosed by Jura and Alps) and trigg
new cells in the warm and moist air. The cells then merged with the advancing MCS.
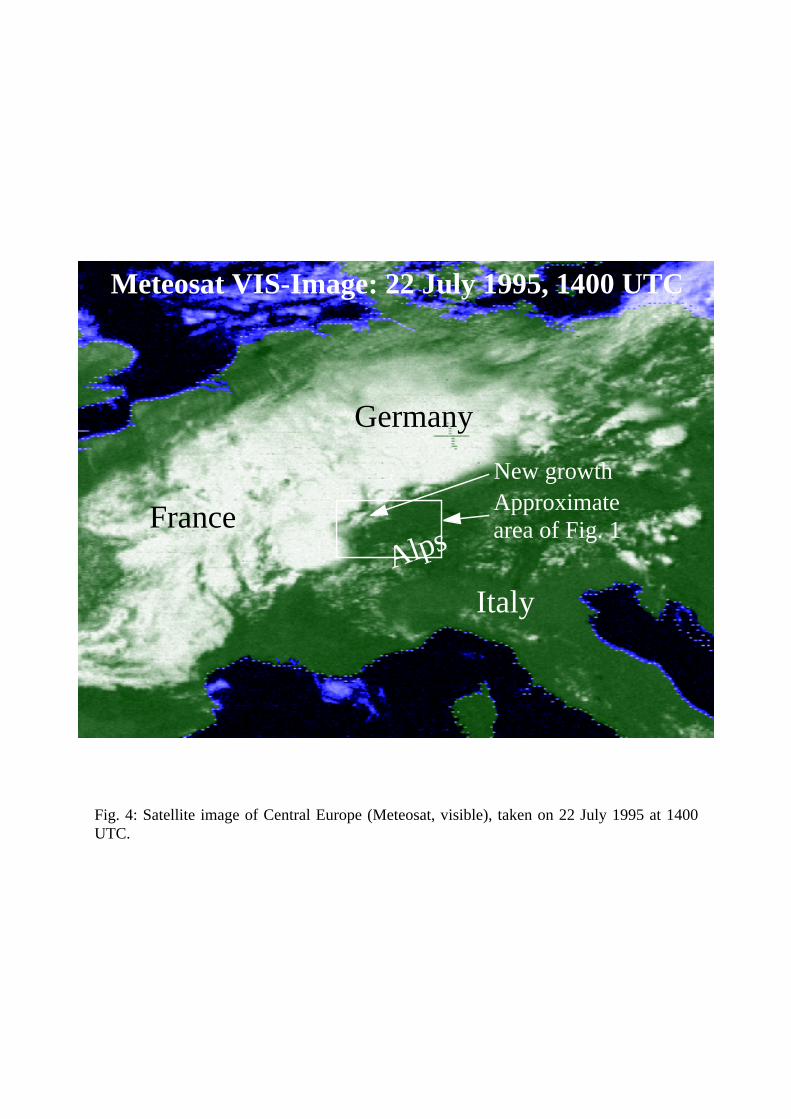
After 1520 UTC the continuous line grew in length until 1700 UTC when the ideal stag
MCS-organization was reached (length of the continuous line about 200 km, total length o
ken line at least 260 km, delimited by the edge of the SMI radar image, Fig. 5b). At 1700 U
the MCS had a structure almost identical to the archetypical asymmetric ll/ts structure (H
et al. 1990). This degree of mesoscale organization has not been observed previously in
thunderstorms, at least it was not seen in the entire five-year radar-echo climatology of Sc
er et al. (1995). The maximum dimension of the system in N-S direction (derived from com
ite images of the German and Swiss radars) was about 700 km, and the maximum length
convective line was about 500 km. These dimensions are larger than the sizes of all other
cases of the recent years in Central Europe (Schiesser et al. 1996).

- 9 -
ge in
15 km
ter the
of the
clear-
doc-
apers
uiries
orted
amage
and
mpany
mage
rred in
ge in-
rooted
t half
tterns
re the
4. Ground observations and low-level radar data
a. Damage information
In the following we focus on that part of the storm that produced the severe wind dama
northern Switzerland. Severe damage occurred in forests and villages along a track about
long and some 100 m wide. A first inspection of the damage was obtained in the weeks af
event. A systematic survey was realised with a delay of almost nine months, when most
damage was either already repaired (buildings) or removed (broken trees). While forest
ings were still visible at that time, details like directions of fallen trees could no longer be
umented. Damage to buildings was analysed considering information from local newsp
and from the building insurance agencies. Interviews of people were complemented by inq
with a survey form. This form was sent to all foresters in the communities that had rep
damage. The data were integrated into a Geographical Information System (GIS), and d
maps were produced (Jenni 1997).
The damage region is hilly and is composed of a mix of forests, cultivated land (grass
crops), and small villages. Crop damage is documented by the Swiss hail insurance co
but is not considered here. The reason is the difficulty to identify the source of the crop da
(hail or wind). As a consequence, the damage patterns were not contiguous but occu
patches with intermediary areas without documented destruction (Fig. 6). Forest dama
cluded single broken trees in otherwise undestroyed areas, small groups of broken or up
trees, and complete clearings with widths of the order of 100 m. Many trees were broken a
height (6 to 10 m above ground), some of them showing effects of rotating winds. The pa
of the uprooted or broken trees mostly showed diverging airflow except for one spot whe

- 10 -
tiles.
am-
locity,
-500 m
age and
the
e azi-
ortex
e
aller
ttern of
pped
l close
ebris
ibility
heavy
fallen stems were oriented in all directions. A total volume of 15000 m3 wood in trees was felled
by the storm. Damage to buildings consisted mostly of destroyed or removed roofs and
Repair costs exceeded 2 million CHF (about 1.5 million US$). Buildings outside the main d
age track remained almost untouched.
b. Damage patterns and Doppler radar velocities
Fig. 6 shows the locations of the heaviest damage and contours of constant Doppler ve
observed at the lowest elevation angle. The radar measurements were taken at about 300
above the ground. One notes a good spatial agreement between the locations of the dam
the maximum Doppler winds at Sulz/Leidikon and Mandach. At Oberhofen and Hottwil,
damage occurred a bit north of the strongest Doppler winds and was collocated with larg
muthal shear (1515 and 1517 UTC). The pattern of Doppler velocity indicates a small v
(diameter about 1 km, azimuthal shear about 3.10-2 s-1) at this stage (Fig. 7). The size of th
vortex is of the order of the spatial resolution of the radar beam. The vortex was possibly sm
and stronger than seen with the radar, thus may have reached tornadic strength. The pa
radar reflectivity shows a “hook” echo, most probably caused by precipitation particles wra
around the center of the vortex (Fig. 7).
c. Eyewitness reports
A 10-year old boy from Oberhofen (damage location see Fig. 6) observed a tornado funne
to his home. He stated that the funnel was over a corn field for some time, whirling crop d
around its center. The funnel was transparent, with a diameter of a couple of meters. Vis
was good, i.e. more than 500 m. Another eyewitness in the village of Mandach reported

- 11 -
itly
line.
Tem-
ds
f wind
wind
iss-
e
d for a
aneous
a). The
NETZ
s net-
een 11
rying
, and
precipitation and a visibility of 10 m (“white wall”). In this case a tornado funnel was explic
not observed.
d. Meteorological surface data
Precipitation, partly hail, was short in duration and mainly collocated with the convergence
Ten minute averages of rainfall intensity varied between 4 and 34 mm per hour (Fig. 8a).
perature (Fig. 8b) dropped by about 10 to 12oC during the passage of the storm. Wind spee
showed mostly a narrow maximum at the same time, in some cases together with a shift o
direction towards northwest and north (Fig. 8c, see also Furger et al. 1996). However, a
shift did not occur at stations lying in valleys oriented parallel to the airflow. The station Ge
berg recorded a peak value of 23.4 m s-1 (2.5 min average) at 12 m AGL (Fig. 8c). During th
subsequent hour, winds faded to almost calm, and at some stations easterly flow occurre
while.
The pressure trace of a conventional microbarograph at PSI showed an almost instant
pressure increase of 8.5 hPa and a subsequent drop of 4 hPa within a few minutes (Fig. 9
exact duration of the pressure peak cannot be determined from the barograph strip. The A
station at PSI measured a peak gust speed (ten seconds average) of 43.8 m s-1 between 1520 and
1530 UTC (Fig. 9b) with an anemometer mounted on a stack, at 74 m AGL.
A synoptic representation of the isochrones of wind speed maxima measured with PSI’
work reveals the movement of an organized structure from west to east with speeds betw
and 33 m s-1 (Fig. 10). The variation of the spacing between isochrones is a signature of va
propagation velocities and must be attributed partly to frictional effects of the topography

- 12 -
e rec-
f the
icro-
n at-
near
ction
om-
n and
rtly to
Peo-
st un-
muthal
am-
es re-
s most
good
ny ex-
partly to the dynamics of the storm itself. At 1520 UTC a bulge towards south-east can b
ognized just west of the city of Brugg. This bulge can be attributed to the deformation o
gust front seen with the radar data (Fig. 11, see Section 5a).
e. Discussion
Strong winds in a thunderstorm connected to a line of destruction can be attributed to m
bursts, tornados, or a storm-relative rear-to-front jet (Biggerstaff and Barritt 1996). In a
tempt to identify the sources of destruction, we discuss hereafter the observations
Oberhofen and PSI Würenlingen (locations see Fig. 6).
The rotating, but transparent ‘whirlwind’ observed near Oberhofen may have been a su
vortex (Fujita 1981) or a tornado funnel not extending visibly to the ground. This is not unc
mon in mountainous terrain, probably due to drier environments at lower levels (Bluestei
Golden 1993; Szoke et al. 1984). Lack of other visual observations must be attributed pa
obstructed viewing in hilly orography, and partly to the absence of well-trained observers.
ple in Switzerland do not know how to watch thunderstorms, and tornado chasing is almo
known. The eyewitness observation is consistent with the radar patterns. The largest azi
shear occurred over the locations of Oberhofen and Hottwil (Fig. 6). The formation of a d
aging tornado was therefore most probable in that region.
Further east, the shear signature weakened rapidly but the maximum Doppler velociti
mained strong (Fig. 6). Therefore, the damage near Mandach and PSI-Würenlingen wa
probably caused by non-tornadic winds. This interpretation of the Doppler signatures is in
agreement with the ground observations. The barograph at PSI (Fig. 9a) did not register a
- 13 -
p to 5
estein
This is
aviest
par-
most
tional
e ob-
lected
com-
ern of
ssible
re is
har-
er, in-
ssion
PSI an-
ow-
time
twice
a larg-
traordinary pressure drop which could indicate the vicinity of a tornado. Pressure drops u
hPa have been observed within a radius of less than 1 km from the funnel of a tornado (Blu
and Golden 1993). We conclude that no tornado was closer than 1 km to the PSI area.
consistent with the damage survey in the forest of Würenlingen, where the area with the he
destruction was located roughly 1 km north of PSI (location see Fig. 6). In this place, at a
ticular spot, stems from uprooted and broken trees were pointing in any direction, although
of the fallen trees in the surroundings were streamlined in a west-east direction. No rota
structure could be figured out. In such a setting, one or two microbursts could cause th
served pattern of the fallen trees. Damage to a corn field resembling the patterns of def
microbursts was observed and photographed nearby from a motorglider (Fuchs, private
munication). Another spot immediately to the east of PSI showed a more organized patt
fallen trees, as expected from a microburst.
The pressure variations in Fig. 9a at about 1520 UTC can be interpreted in terms of a po
microburst that is embedded within the gust front head of a cold air outflow. The signatu
similar to, but more distinct than the signatures typically associated with a pure gust front (C
ba, 1974; Johnson and Hamilton 1988). After the jump, the pressure remained 4 hPa high
dicating the mesohigh (Johnson and Hamilton 1988). At about 1700 UTC the wake depre
caused a local pressure minimum that preceded a steady, post-frontal pressure rise. The
emometer (Fig. 9b) registered extreme wind gusts within one single 10-min time interval. H
ever, considerable gustiness also occurred in the immediately preceding and following
intervals. Hence, the overall duration of strong gustiness was at least 10 min, or more than
as long as expected for a pure microburst (Fujita 1985).
In summary, a combination of a short-lived tornado and several microbursts embedded in

- 14 -
s and
imoto
ita scale
ication
bute
cts of
S that
is en-
nd 15
trong
e two
ted in
nated
ocity,
30 m
t that
ted
er rear-to-front jet gives the most consistent interpretation of the observations. Tornadoe
microbursts occurring in close vicinity are not uncommon, see e.g., Forbes and Wak
(1983). From the damage assessment the event could be classified as F1 or F2 on the Fuj
(Fujita 1981) which is consistent with the peak gust speed measured at PSI. Such a classif
is subject to uncertainties. In hilly terrain, local confluence and diffluence of air may contri
to a strengthening or weakening of wind. It is probably impossible to assess the local effe
hilly orography on heavy wind in the here-analysed case.
5. Radar history
a. Gust front
Section 3 showed that the parent thunderstorm was part of a large and well-organized MC
produced a bow-echo in the region where the vortex occurred (Fig. 5a). The bow-echo
larged in Fig. 11. The vortex developed near the apex of the bow, at about 40 km west a
km north of the radar (Fig. 11). An analysis of the volume radar data revealed that two s
thunderstorm cells (cell 1 and cell 2 hereafter) occurred during the period of interest. Th
cells dominated many smaller and short-lived cells. The tracks of the two cells are indica
Fig. 11, together with the damage track. Both cells were triggered by a gust front that origi
from former thunderstorm cells. The gust front can be seen in the patterns of Doppler vel
observed with the lowest sector-volume scans. Fig. 11 shows the contours of 15, 25 and
s-1 Doppler velocity in time steps of 5 min. The contour 15 m s-1 is an indicator for the position
of the gust front since this contour corresponds with maximum convergence. It turns ou
the gust front propagated mainly from WSW to ENE. The gust front was originally orien
- 15 -
. The
ntal
TC),
r the
cell
con-
for-
was
r. The
f max-
ted to
an 45
vor-
t the
e time
gust
h the
ved
ring
n are
along a more or less straight line. A deformation becomes apparent at about 1507 UTC
maximum Doppler velocity increased and reached peak values of about 35 m s-1 ten minutes
later.
Fig. 12a shows a time-height diagram of maximum radar reflectivity, derived from horizo
radar cross-sections (CAPPI’s), for cell 1 (1443 - 1459 UTC) and cell 2 (1506 - 1531 U
respectively. Only reflectivities larger than 44 dBZ are shown. This diagram does not cove
whole life cycles of the cells. For clarity, cell 1 is shown up to 1459 UTC only although the
survived this time by a couple of minutes. Cell 2 was captured at the time when the 55 dBZ
tour was first identifiable as a separate entity. The formation of cell 2 is collocated with the
mation of the vortex, also shown in Fig. 12a. The vertical extension of the vortex
determined by a careful inspection of the patterns of Doppler velocity and azimuthal shea
data of azimuthal shear were smoothed with a 7 point median smoother. The signatures o
imum azimuthal shear were identified at various altitudes, and the signatures were attribu
the same vortex when the axis through the centers of the signatures was tilted by less tho
from the vertical. The formation and evolution of the vortex is discussed in Section 5c. The
tex remained within the analysis domain up to 1520 UTC. After that time, the vortex lef
domain of the sector-volume scans. Therefore, the analysis of the vortex is restricted to th
period before 1520 UTC.
The maximum Doppler velocity behind the gust front is a measure for the strength of the
front outflow since the viewing angle of the radar coincides within some ten degrees wit
direction of the gust front outflow. The time evolution of maximum Doppler velocity, obser
at 1.1 km MSL, is plotted in Fig. 12b. The figure shows that the outflow is accelerated du
two specific periods: 1453-1458 UTC and 1508-1518 UTC. The origins of this acceleratio

- 16 -
ion for
UTC
ontal
hun-
ers A,
with
and D
ortex
of the
stent or
at the
ndraft.
ence
996).
s the
d
t front
ever,
e use
not the same for the two periods. In order to understand the possible source of accelerat
the first period, we show hereafter the patterns of reflectivity and Doppler velocity at 1451
(Fig. 13), i.e. immediately before the acceleration of the outflow is observed. The horiz
cross-section (Fig. 13a) at 6 km altitude points to a Doppler pattern typical for a splitting t
derstorm (e.g., Klemp 1987). Three signatures of large azimuthal shear (marked with lett
B, and D in Fig. 13a) indicate rotation. The southern signature (A) is probably associated
a cyclonically rotating vortex at the southern edge of the updraft whereas signatures B
point to vortices associated with the edges of the downdraft. One would also expect a v
signature in the north of signature D, being associated with a vortex at the northern edge
updraft. This signature does not appear, most probably because the updraft was non-exi
weak in that region. In fact, the divergence pattern at high levels (not shown) indicates th
strongest updraft is located in the vicinity of vortex signature A.
Signature C (Fig. 13a) indicates convergence at the boundary between updraft and dow
This convergence is visible through a deep layer of 9 km (Fig. 13b). Mid-altitude converg
is an indicator of a strong downdraft leading to heavy surface winds (Schmocker et al. 1
Hence, the gust front is most probably accelerated by the downdraft of cell 1. Fig. 11 show
first appearance of the 25 m s-1 contour of Doppler velocity at 1457 UTC. This contour move
in direction ENE. The associated enhanced flow contributed to the deformation of the gus
and to the formation of a shear line some minutes later.
b. Updraft impulses
It was already noted that two cells dominated the storm evolution. A refined analysis, how
shows a more complex pattern of convective cells. Following Foote and Frank (1983) w

- 17 -
tend
rafts.
eved
. It is
ina-
tilize
olu-
-sec-
city.
of up-
er-
lec-
pler
small.
ntifica-
city
uped
hereafter the term "updraft impulses" or briefly "impulses" for those convective units that
to merge continuously with the main updraft, hence, are not identifiable as individual upd
Foote and Frank (1983) defined impulses as local maxima in vertical wind velocity, retri
from multiple-Doppler data. Here, we use volume-scan data from a single-Doppler radar
therefore not possible to retrieve vertical wind. However, single Doppler data allows exam
tion of the patterns of reflectivity and Doppler velocity in three dimensions, and one can u
the full resolution of the data. Animations of 3D-displays allows for visualisation of the ev
tion of successive impulses. We discuss isosurface plots of reflectivity and vertical cross
tions, taken in W-E direction through the volume-scan data of reflectivity and Doppler velo
These cross-sections reveal patterns that point to the formation and further development
draft impulses. Several criteria can be used to identify an impulse:
1. A local minimum in Doppler velocity, indicating that the inflow from east is accel
ated.
2. A local maximum of reflectivity or an eastward or upward extension of a high-ref
tivity zone, preferably above a zone with lower reflectivity ("weak echo region").
3. A signature of convergence, normally located a bit west of the minimum in Dop
velocity and below the reflectivity signature of the impulse.
It was found that these signatures moved upwards. The ground-relative motion remained
This means that the signatures moved into the approaching storm system. For proper ide
tion of the impulses, we used the following procedure. First, local minima of Doppler velo
(criterion 1) were identified in the full-volume data sample. Second, the minima were gro

- 18 -
illed.
ed in
e, ob-
tails
se im-
ll
(Fig.
sig-
n 46.5
. The
d at 2
gust
506
sub-
quent
uch
. 14d).
511
weak
such that they represent growing impulses. Third, it was tested if criteria 2 and 3 are fulf
Three impulses were identified immediately north of the vortex. The impulses are visualiz
Fig. 14 with a sequence of vertical cross-sections and with plots of the 40 dBZ isosurfac
tained with the ARGOS-software (Bresch and Liniger, personnel communication, for de
see http://www.lapeth.ethz.ch/argos/). The white numbers refer to the signatures of the
pulses. The “italic” numbers (e.g., “1”) mark the local minima in Doppler velocity. The sma
numbers (e.g., “1”) point to the reflectivity signatures, and the large numbers (e.g., “1”) high-
light the convergence signatures. Impulse 1 is first seen at 1501 UTC at a height of 3 km
14a). A local minimum of Doppler velocity is located immediately east of the convergence
nature, and the 40 dBZ reflectivity contour shows a small bulge towards the east at locatio
km west and at 3.5 km height. Thus, the three defined criteria for an impulse are visible
impulse is also associated with a signature of horizontal shear (at position -47 km west an
km height). This horizontal shear points to a rotor, located at the boundary between the
front outflow and the inflow stream. The rising impulse 1 is clearly visible at 1503 and 1
UTC (Figs. 14b and c) and appeared to disintegrate later on (Figs. 14d).
Impulse 2 is first visible at 1503 UTC at position 42 km west (Fig. 14b). Again, one notes
stantial horizontal shear at the boundary between inflow and gust front outflow. The subse
rise of the impulse can be followed up to 1513 UTC (Fig. 14f). The impulse became m
stronger than impulse 1 and was associated with a weak echo region at 1508 UTC (Fig
Impulse 2 can be attributed to the formation of cell 2. Impulse 3 can be identified first at 1
UTC and tracked until 1516 UTC (Figs. 14e-g). This impulse evolved above a marked
echo region.

- 19 -
vals of
scales
ively,
e im-
here-
e
light
lcu-
ppen-
a scale
ameter
tween
ds a
pecific
ter on.
hows
vor-
um
he
ntial
The analysis shows that the three documented impulses followed each other in time inter
3-7 min. The horizontal distance between the core of the impulses is less than 5 km. These
are smaller than the typical scales of multicell storms (10-20 min and 10-20 km, respect
see e.g., Smull and Houze 1985, Fovell and Ogura 1988 or Fovell and Dailey 1995). Th
pulses represent modulations of the overall updraft rather than individual updrafts. The
analysed storm therefore reached aweak-evolutionmode (Foote and Frank 1983) when th
damaging wind gusts were formed.
c. Evolution of the vortex
Azimuthal shear is normally used to quantify the strength of a vortex signature and to high
the evolution in height and time of a vortex (e.g., Vasiloff 1993). Azimuthal shear was ca
lated from the Doppler velocities and smoothed with a 7-point median smoother (see A
dix). The smoothing is necessary to reduce the noise in the data. However, features with
less than 3-4 km tend to disappear. Therefore, azimuthal shear is underestimated if the di
of a vortex is less than 3 km. The diameter of the investigated vortex (i.e. the distance be
the extremes in Doppler velocity) is typically 4-5 km. We believe that the smoothing yiel
reasonable estimate of azimuthal shear between the extremes in Doppler velocity. One s
period, for which the diameter of the vortex decreased to less than 2 km, is discussed la
We also investigate the extremes in Doppler velocity associated with the vortex. Fig. 15a s
a time-height diagram of maximum Doppler velocity (retrieved from CAPPI’s) south of the
tex center (“outflow velocity” hereafter). Fig. 15b shows, in a similar manner, the minim
Doppler velocity north of the vortex center (“inflow velocity” hereafter). First, we point to t
change of inflow velocity associated with the rising impulse 2. Fig. 15b indicates a substa

- 20 -
sso-
dis-
utes
, we
2a and
lana-
ion
f
hear
pler
nificant-
ces that
with a
updraft
Wil-
de.
alistic
acceleration of inflow velocity from 2 to 4 km altitude. This acceleration can probably be a
ciated with a mid-level low pressure perturbation noted by LeMone (1983) and further
cussed by Fovell and Ogura (1988). The acceleration of inflow velocity contrib
substantially to the formation and strengthening of the vortex.
Second, we discuss the evolution of the vortex at low altitudes (below 2 km MSL). For this
distinguish between three stages, indicated with rectangles and italic numbers in Figs. 1
15.
Stage 1:An increase of azimuthal shear is seen during stage 1 (Fig 12a). The key for exp
tion of this increase can be found in Fig. 11. One notes that the velocity contour 25 m s-1 ap-
proaches the velocity contour 15 m s-1 between 1502 and 1507 UTC. The discussion in Sect
5a has shown that the velocity contour 25 m s-1 can be attributed to the downdraft outflow o
cell 1. Hence, it is suggested that this downdraft outflow contributed to the formation of a s
line during stage 1.
Stage 2:One notes for some minutes a “symmetric” acceleration of both extremes in Dop
velocity (compare Figs. 15a and b). The distance between these extremes decreases sig
ly (see the numbers at the bottom of Fig. 15a). These changes are probably caused by for
act simultaneously on both extremes in Doppler velocity. These forces can be associated
pressure perturbation caused by the updraft impulses 2 and 3. It is probable that a strong
existed above the low-level vortex during stage 2. Vortex stretching (e.g., Wakimoto and
son 1989) can therefore explain the observed vortex intensification at this time and altitu
Stage 3:In Fig. 12, one notes a decrease of azimuthal shear. This decrease is only partly re

- 21 -
t stage
the az-
rap-
sible
flow
veloc-
s. 11
some
max-
about
ndis-
at that
d with
naly-
olution
l mode
icker
inter-
in or-
severe
since the diameter between the extremes in Doppler velocity is less than 2 km during tha
(Fig. 15a and Fig. 7). The smoothed azimuthal shear, shown in Fig. 12a, underestimates
imuthal shear of the low-level vortex at 1513-1517 UTC. However, the vortex weakened
idly later on, as already noted in Section 4e (Fig. 6). A decrease of inflow velocity is respon
for this weakening (Fig. 6) whereas the outflow velocity remained strong. Note that the in
velocity already started to weaken during stage 3 (Fig. 15b). We assume that the outflow
ity was kept strong by a downdraft. A signature for a possible downdraft can be seen in Fig
and 12b. Fig. 11 shows at 1512 and 1517 UTC a secondary maximum in Doppler velocity,
km northwest of the vortex. We traced this maximum in a similar manner as the primary
imum in the south of the vortex center. Fig. 12b shows that this maximum is accelerated at
1515 UTC. This acceleration is not affected by the vortex, hence, it is probably a fairly u
turbed downdraft signature. The presence of a downdraft reaching low levels is probable
time but it remains an open question how and to what degree such a downdraft interacte
the vortex.
So far, we used multicell/squall-line concepts for interpretation of the observations. The a
sis, however, has shown that the storm reached a weak-evolution mode. The weak-ev
mode represents an intermediary state between the multicell mode and the supercel
(Foote and Frank 1983). Therefore, supercell concepts (e.g., Lemon and Doswell 1979; W
and Wilhelmson 1995; Dowell and Bluestein 1997) may also be important for a complete
pretation of the observed events. We probably have to await numerical model simulations
der to obtain a more quantitative assessment of the factors that influence the formation of
winds in the analysed storm.

- 22 -
rd over
as ex-
m and
at led
out-
sec-
within
km
g of
ing.
gth.
ortex
out-
6. Conclusions
A large MCS developed on 22 July 1995 over eastern France and propagated eastwa
southern Germany and northern Switzerland. The size and the degree of organization w
traordinary for Central Europe. A bow-echo formed near the southern edge of the syste
could be attributed to a track of severe wind damage. A coherent picture of the events th
to the damaging winds was found:
1. The downdraft of a thunderstorm cell accelerated locally the existing gust front
flow.
2. A bulge in the gust front was formed. This bulge led to a shear line and to heavy
ondary convection.
3. The storm reached a weak-evolution mode. Several updraft impulses developed
15 min. The “inflow” wind of the rising impulses was accelerated at layers 2-4
MSL. This acceleration contributed substantially to the formation and strengthenin
a deep vortex.
4. The vortex was intensified at low levels (0.5-2 km MSL) through vortex stretch
The “outflow” wind south of the vortex center was accelerated to damaging stren
A weak and short-lived tornado was seen at the time when the diameter of the v
reached a minimum.
5. A downdraft may have contributed to further sustainment and strengthening of the

- 23 -
. The
n the
ele-
tion
re be-
ns can
sed in
ciated
set of
uch a
sor cell
that
s of se-
n help
n an
flow wind and to the formation of microbursts.
This study benefited from a nearly optimal combination of various measuring systems
availability of rapid radar volume-scans was especially useful. The short time lag betwee
volume-scans (2.5 min) allowed identification of some of the rapidly changing convective
ments within this storm. To our knowledge, the formation of severe winds in weak-evolu
storms has not been considered previously in numerical model simulations. We therefo
lieve that combining rapid-scan radar data of such storms and numerical model simulatio
contribute to improve the understanding and the forecasting of storms of the type discus
this study.
For nowcasting, it is important to note that severe winds in Central Europe tend to be asso
with secondary rapid cellular growth (Schmid et al. 1997). The time scale between the on
cellular growth and the onset of damaging winds may be very short (some minutes). In s
setting, a successful nowcasting of severe winds has to be done on the basis of the precur
- cell 1 in the here-investigated storm. In spite of the limited number of cases, we believe
storms of the type analysed here and in Schmid et al. (1997) represent an important clas
vere wind-producing storms in Central Europe. Therefore, methods are searched that ca
improving the prediction of the exact location and time of secondary cellular growth withi
evolving thunderstorm.

- 24 -
orolog-
le-
d the
rstver-
. Willi
age.
lume
puter
use of
anon-
Acknowledgements
Surface network data, radiosoundings and radar data were obtained from the Swiss Mete
ical Institute (SMI) and from the WINDBANK project (PSI’s Mesonetwork), which was imp
mented under the responsibility of Werner Graber. Volker Herrnberger from PSI provide
microbarograph data. Damage data were obtained from the forest agency (Kantonale Fo
waltung Aargau) and the building insurance agency (Aargauisches Versicherungsamt)
Fuchs from MetAir provided aerial photographs that helped in the analysis of the dam
Wolfgang Linder operated the radar on 22 July 1995 and defined the correct sector-vo
scans during the “hot” stage of the event. He and Susanne Mecklenburg developed com
programs for the analysis of the data, and David Bresch generously supported us in the
the ARGOS software. We also appreciate the helpful and constructive comments of two
ymous reviewers.

- 25 -
oppler
be cor-
phics
eliable
h that
. The
eloc-
ctions
es with
tricted
data
ired, in
tion
sed the
APPENDIX
Processing of the Doppler radar data
The properties of Doppler measurements depend on the characteristics of the radar, the D
processor, and on the software used to calculate and store the data. Doppler data need to
rected and edited. An interactive procedure was written for this purpose, using the IDL gra
software package. Hereafter, we summarize the various steps in the process to obtain r
Doppler data:
1. The “PP02”-Doppler processor (manufactured by Sigmet, Inc.) was programmed suc
noisy Doppler velocities, caused by broad Doppler spectra, were set to “missing data”
“Dual-PRF” mode (e.g., Keeler and Passarelli 1990) was used to correct folded Doppler v
ities in the interval -32 m s-1 ... 32 m s-1.
2. The Doppler data were stored in polar coordinates with a resolution of 0.5o in azimuth and
600 m in range. The PPI data were converted to a Cartesian grid before any other corre
were made. The “nearest neighbor” method was used for the conversion. Two data sampl
different resolutions were produced (0.5 and 0.25 km), and the maximum ranges were res
to 120 and 60 km, respectively. The motivation for this split was to minimize the size of the
samples and the computing time. On the other hand, a good spatial resolution was des
order to minimize the loss of information by the coordinate conversion. The low-resolu
sample was used when data beyond 60 km were needed (Figs. 11-13). Otherwise, we u
high-resolution data (Figs. 7, 14 and 15).

- 26 -
edure
n and
edure.
shear
per-
ther,
uthal
om the
ity.
3. Folded Doppler data beyond the interval -32 m s-1 ... 32 m s-1 were corrected with an inter-
active computer procedure.
4. Erroneous pixel values, caused by the Dual-PRF method, were corrected with a proc
similar to that used by “Environment Canada” (Paul Joe, personal communication).
5. The Doppler data were carefully inspected for sidelobe echoes and flare echoes (Wilso
Reum 1988). Pixels affected by such echoes were set to “missing data”.
6. Missing data were replaced by interpolated data using a standard interpolation proc
Such an interpolation may smooth out significant shear features. Therefore, calculated
may underestimate the “true” shear in some cases.
7. The data were interpolated to horizontal layers (“CAPPI’s”). Linear interpolation was
formed in vertical direction.
8. The data of reflectivity and Doppler velocity were smoothed with a 3-point median smoo
in order to reduce the disturbing influence of extreme pixel values. Calculated data of azim
shear were smoothed with a 7-point median smoother since the shear data, estimated fr
first derivative of Doppler velocity, are more noisy than the original data of Doppler veloc

- 27 -
ere
lifor-
h, D.
mics,
ont.
81:
n nu-
low
bursts
di-
ulti-
es-
REFERENCES
Biggerstaff, M. I., and R. C. Barritt, 1996: Role of gust front circulations in long-track sev
straight-line winds. Preprints, 18th Conf. on Severe Local Storms, San Francisco, Ca
nia, Amer. Meteor. Soc., 504-508.
Bluestein, H. B., and J. H. Golden, 1993: A review of tornado observations. In: C. Churc
Burgess, C. Doswell and R. Davies-Jones (Editors), The tornado: Its structure, dyna
prediction, and hazards.Geophysical Monograph, 79, American Geophysical Union,
Washington, 319-352.
Charba, J., 1974: Application of gravity current model to Analysis of squall-line gust fr
Mon. Wea. Rev., 102, 140-156.
Dowell, D. C., and H. B. Bluestein, 1997: The Arcadia, Oklahoma, Storm of 17 May 19
Analysis of a supercell during tornadogenesis.Mon. Wea. Rev., 125, 2562-2582.
Droegemeier, K. K., S. M. Lazarus, and R. Davies-Jones, 1993: The influence of helicity o
merically simulated convective storms.Mon. Wea. Rev., 121, 2005-2029.
Foote, G. B., and H. W. Frank, 1983: Case study of a hailstorm in Colorado. Part III: Airf
from triple-Doppler measurements.J. Atmos. Sci., 40, 686-707.
Forbes, G. S., and R. M. Wakimoto, 1983: A concentrated outbreak of tornadoes, down
and microbursts, and implications regarding vortex classification.Mon. Wea. Rev., 111,
220-235.
Fovell, R. G., and Y. Ogura, 1988: Numerical simulation of a midlatitude squall line in two
mensions.J. Atmos. Sci., 45, 3846-3879.
Fovell, R. G., and P. S. Dailey, 1995: The temporal behavior of numerically simulated m
cell-type storms. Part I: modes of behavior.J. Atmos. Sci., 52, 2073-2095.
Fujita, T. T., 1978: Manual of downburst identification for project Nimrod. Satellite and M
- 28 -
iv. of
les.
hica-
.
n as-
en-
cisco,
bow-
onf.
Swit-
ology
3-
tems.
rain-
r-
sität
ometeorology Research Paper No. 156. Department of Geophysical Sciences, Un
Chicago, 104 pp.
Fujita, T. T., 1981: Tornadoes and downbursts in the context of generalized planetary scaJ.
Atmos. Sci., 38, 1511-1534.
Fujita, T. T., 1985: The downburst. SMRP Research Paper, 210. University of Chicago, C
go, 122 pp.
Funk, T. W., K. E. Darmofal, J. D. Kirkpatrick, M. T. Shields, R. W. Przybylinski, Y. J. Lin, G
K. Schmocker, and T. J. Shea, 1996a: Storm reflectivity and mesocyclone evolutio
sociated with the 15 April 1994 derecho. Part II: storm structure and evolution over K
tucky and southern Indiana. Preprints, 18th Conf. on Severe Local Storms, San Fran
California, Amer. Meteor. Soc., 516-520.
Funk, T. W., B. F. Smull, and J. D. Amman, 1996b: Structure and evolution of an intense
echo embedded within a heavy rain producing MCS over Missouri. Preprints, 18th C
on Severe Local Storms, San Francisco, California, Amer. Meteor. Soc., 521-526.
Furger, M., M. Jenni, and W. Schmid, 1996: The severe storm of 22 July 1995 in northern
zerland - a tornado case study? 24th International Conference on Alpine Meteor
(ICAM 96). Hydrometeorological Institute of Slovenia, Ljubljana, Bled, Slovenia, 15
159.
Hashem, M. S., and M. Biggerstaff, 1997: Organization of convection in mesoscale sys
Preprints, 28th Conf. Radar Meteor., Austin, Texas, Amer. Meteor. Soc., 483-484.
Houze, R. A., Jr., B. F. Smull, and P. Dodge, 1990: Mesoscale organization of springtime
storms in Oklahoma.Mon. Wea. Rev., 118, 613-654.
Houze, R. A. Jr., W. Schmid, R. G.Fovell, and H.-H. Schiesser, 1993: Hailstorms in Switze
land: left movers, right movers, and false hooks.Mon. Wea. Rev., 121, 3345 - 3370.
Jenni, M., 1997: Der Sturm über dem Fricktal vom 22. Juli 1995. Diploma Thesis, Univer

- 29 -
H-
to the
Atlas,
g mi-
bow-
struc-
with
sed on
vere
served
Bern, 107 pp. [Available from Institute of Geography, KLIMET, Hallerstrasse 12, C
3012 Bern, Switzerland]
Johnson, R. H., and P. J. Hamilton, 1988: The relationship of surface pressure features
precipitation and airflow structure of an intense midlatitude squall line.Mon. Wea. Rev.,
116, 1444-1472.
Keeler, R. J., and R. E. Passarelli, 1990: Signal processing for atmospheric radars. In: D.
Ed.,Radar in Meteorology, Amer. Meteor. Soc., 199-229.
Kessinger, C. J., D. B. Parsons, and J. W. Wilson, 1988: Observations of a storm containin
socyclones, downbursts, and horizontal vortex circulations.Mon. Wea. Rev., 116, 1959-
1982.
Klemp, J. B., 1987: Dynamics of tornadic thunderstorms.Ann. Rev. Fluid Mech., 19, 369-402.
Lee, W.-C., R. M. Wakimoto, and R. E. Carbone, 1992: The evolution and structure of a "
echo-microburst" event. Part II: The bow-echo.Mon. Wea. Rev., 120, 2211-2225.
Lemon, L. R., and C. A. Doswell, 1979: Severe thunderstorm evolution and mesocyclone
ture as related to tornadogenesis.Mon. Wea. Rev., 107, 1184-1197.
LeMone, M. A., 1983: Momentum transport by a line of cumulonimbus.J. Atmos. Sci., 40,
1815-1834.
Li, L., W. Schmid, and J. Joss, 1995: Nowcasting of motion and growth of precipitation
radar over a complex orography.J. Appl. Meteor., 34, 1286-1300.
Martin, F., R. Riosalido, and L. de Esteban, 1997: The Sigüenza tornado: a case study ba
convective ingredients concept and conceptual models.Meteor. Appl., 4, 191-206.
Przybylinski, R. W., 1995: The bow-echo: Observations, numerical simulations and se
weather detection methods.Wea. Forecasting, 10, 208-218.
Roberts, R. D., and J. W. Wilson, 1995: The genesis of three nonsupercell tornadoes ob
with Dual-Doppler radar.Mon. Wea. Rev., 123, 3408-3436.

- 30 -
severe
-pro-
Mes-
rland:
am-
ng the
ther
adar
tra-
re-
ic and
bsyn-
rch,
, dy-
Schiesser, H.-H., R. A. Houze, Jr., and H. Huntrieser, 1995: The mesoscale structure of
precipitation systems in Switzerland.Mon. Wea. Rev., 123, 2070-2097.
Schiesser, H.-H., W. Schmid, R. A. Houze, Jr., and B. Bauer-Messmer, 1996: A tornado
ducing mesoscale convective system in northern Switzerland. Preprints, 7th Conf on
oscale Processes, Reading, England, Amer. Meteor. Soc., 459-461.
Schmid, W., H.-H. Schiesser, and B. Bauer-Messmer, 1997: Supercell storms in Switze
case studies and implications for nowcasting severe winds with Doppler radar.Meteorol.
Appl., 4, 49-67.
Schmocker, G. K., R. W. Przybilinski, and Y.-J. Lin, 1996: Forecasting the initial onset of d
aging downburst winds associated with a mesoscale convective system (MCS) usi
mid-altitude radial convergence (MARC) signature. Preprints, 15th Conf. on Wea
Analysis and Forecasting, Norfolk, Virginia, Amer. Meteor. Soc., 306-311.
Siggia, A. D., 1991: One pass velocity unfolding for VVP analysis. Preprints, 25th Conf. R
Meteor., Paris, Amer. Meteor. Soc., 882-884.
Smull, B. F., and R. A. Houze, Jr., 1985: A midlatitude squall line with a trailing region of s
tiform rain: radar and satellite observations.Mon. Wea. Rev.,113, 117-133.
Smull, B. F., and R. A. Houze, Jr., 1987: Rear inflow in squall lines with trailing stratiform p
cipitation.Mon. Wea. Rev., 115, 2869-2889.
Stensrud, D. J., J. V. Cortinas Jr., and H. E. Brooks, 1997: Discriminating between tornad
nontornadic thunderstorms using mesoscale model output.Wea. Forecasting, 12, 613-
632.
Szoke, E. J., M. L. Weisman, J. M. Brown, F. Caracena, and T. W. Schlatter, 1984: A su
optic analysis of the Denver tornado of 3 June 1981.Mon. Wea. Rev., 112, 790-808.
Vasiloff, S.V., 1993: Single-Doppler radar study of a variety of tornado types. In: C. Chu
D. Burgess, C. Doswell and R. Davies-Jones (Editors), The Tornado: Its structure
- 31 -
stle
imu-
ent
namics, prediction, and hazards.Geophysical Monograph, 79, American Geophysical
Union, Washington, 223-231.
Wakimoto, R. M., and J. W. Wilson, 1989: Non-supercell tornadoes.Mon. Wea. Rev., 117,
1113-1140.
Wakimoto, R. M., and N. T. Atkins, 1996: Observations of the origins of rotation: the Newca
tornado during VORTEX 94.Mon. Wea. Rev., 124, 384-407.
Waldteufel, P., and H. Corbin, 1979: On the analysis of single-Doppler radar data.J. Appl. Me-
teor., 18, 532-542.
Weisman, M. L., and J. B. Klemp, 1984: The structure and classification of numerically s
lated convective storms in directionally varying wind shears.Mon. Wea. Rev., 112, 2479-
2498.
Weisman, M. L., 1993: The genesis of severe, long-lived bow echoes.J. Atmos. Sci., 50, 645-
670.
Wicker, L. J., and R. B. Wilhelmson, 1995: Simulation and analysis of tornado developm
and decay within a three-dimensional supercell thunderstorm.J. Atmos., Sci., 52, 2675-
2703.
Wilson, J. W., and D. Reum, 1988: The flare echo: reflectivity and velocity signature.J. Atmos.
Oceanic Technol., 5, 197-205.

- 32 -
s are
. La-
Stars
ions is
s show
60 km
re. This
urope
ther
1995.
otion
lative
1400
(b),
in the
FIGURE CAPTIOS
Fig. 1: Overview of the study area. Orography is shown as a relief. Major mountain chain
labelled. Thick solid lines are political boundaries. Thin solid lines are rivers and lakes
belled dots mark radar and sounding stations. Labelled small circles mark major cities.
mark mesonet stations operated by the SMI. The altitude (mean sea level) of some stat
indicated. Crosses mark mesonet stations operated by the PSI. The two white rectangle
the areas of Figs. 6 (small rectangle) and 10 (large rectangle). The large circles mark the
and 120 km ranges of the radar at Hönggerberg. The Swiss coordinate system is used he
system is defined such that the coordinates 600 East/200 North are in Bern.
Fig. 2: 500 hPa weather chart (a) and enlarged section of the surface chart for Central E
(b). Adapted from “Berliner Wetterkarte”. The radar at Hönggerberg is shown in (b), toge
with the radar ranges 60 km and 120 km.
Fig. 3: Two radiosoundings (a) and a composite wind hodograph (b), obtained on 22 July
The numbers in (b) indicate height in km MSL. The arrow in (b) represents the mean m
(250o, 17 m s-1) of two large cells shown in Fig. 11. The shaded area represents storm-re
helicity over a layer from the ground (0.5 km MSL) to 3.5 km MSL.
Fig. 4: Satellite image of Central Europe (Meteosat, visible), taken on 22 July 1995 at
UTC.
Fig. 5: The evolving MCS, seen with the radars of the SMI, at 1520 UTC (a) and 1700 UTC
The thick dashed lines indicate major mountain chains (the Alps in the south, the Jura

- 33 -
at the
by the
s
m
e sep-
d radar
nd sta-
ction
, ob-
edian
s and
tem-
and a
cations
re trace
e in-
wind
west, and the Black Forest in the north, compare with Fig. 1).
Fig. 6: Map of the damage areas and the associated Doppler velocity patterns, observed
lowest available elevation angle. Damage areas are black. The names of villages affected
damage are indicated. Contours of constant Doppler velocity are solid (20, 30, and 35 m-1 to-
wards the radar) and dashed (5 and 10 m s-1 towards the radar). These contours were drawn fro
unsmoothed plots of Doppler velocity. The Doppler patterns observed at different times ar
arated by grey-shaded bars. The times (UTC) and the elevation angles of the associate
scans are also indicated. The two crosses mark the locations of two meteorological grou
tions mentioned in the text. The arrow in the upper right corner of the figure shows the dire
towards the radar. The square (dotted, grey-shaded) marks the range of Fig. 7.
Fig. 7: Reflectivity (grey shaded) and Doppler velocity (solid lines) of the vortex signature
served on 22 July 1995, 1517 UTC, at the lowest available elevation angle. A 3-point m
smoother was applied to the arrays of reflectivity and Doppler velocity. Radar range circle
azimuth lines are drawn in steps of 2 km and 5o, respectively.
Fig. 8: Time series of relative humidity at the station Geissberg (a), rainfall rate at PSI (a),
perature at Geissberg (b), and of the u- and v-components of wind at Geissberg (c). Two
half minute averages are shown. Rainfall values at PSI are ten minute averages. The lo
of Geissberg and PSI are shown in Fig. 6.
Fig. 9: Pressure (a) and gust speeds (b) measured at PSI (location see Fig. 6). The pressu
was manually extracted from a microbarograph paper strip. Due to a systematic drift of th
strument clock, the data has been shifted by about 20 minutes to coincide with the peak in

- 34 -
dure
grey-
arked
he
ermis-
ark
alti-
(cell
d black
lowest
or-vol-
are
of Fig.
r de-
city
lowest
speed.
Fig. 10: Isochrones of wind speed maxima (white lines), retrieved with an objective proce
from the data of the ground networks. Black lines are rivers. The height of the ground is
shaded (300-1000 m MSL, in steps of 100 m). The ground stations of PSI’s network are m
with a “+”. Stars are ANETZ stations of the SMI. Major cities are marked with a circle. T
names of some locations and of the rivers (bold) are also given. (Reproduced with the p
sion of the Swiss Federal Office of Topography, dated 24 July 1998.)
Fig. 11: Reflectivity pattern (grey shaded) at 1511 UTC of the bow echo. The light arrows m
the paths of two large thunderstorm cells, determined from the reflectivity cores at 8 km
tude. The time periods of the two cells are 1443-1459 UTC (cell 1) and 1506-1531 UTC
2), see also Fig. 12. The grey-shaded line marks the damage track. The solid and dashe
lines are contours of Doppler velocity, seen from the sector-volume radar scans at the
available elevation angles. The contour lines are truncated at the boundaries of the sect
ume scans. Radar range circles and azimuth lines are drawn in steps of 10 km and 10o, resp.
Fig. 12: Time evolution of some radar parameters. Maximum reflectivities of cells 1 and 2
shown in (a). Azimuthal shear of the vortex is grey shaded in steps of 2.5.10-3 s-1 and starts at
5.10-3 s-1. The white numbers indicate azimuthal shear (in units of 10-3 s-1). The solid bar marks
the time when the vortex passed the damage region. The large rectangle marks the range
15. The labelled small rectangles refer to specific stages in the evolution of the vortex (fo
tails see text). The bottom panel (b) shows the time evolution of maximum Doppler velo
(northwest and south of the vortex). These values were derived from the radar data at the
available altitude (1.1 km MSL).

- 35 -
d az-
d
part-
e
of 16
tion.
azi-
iso-
eriod
of the
and
ghted
rtex
“W”
vor-
ite
e
h the
ottom
Fig. 13: Horizontal (a) and vertical (b) cross-section through cell 1. Radar range circles an
imuth lines are drawn in (a) in steps of 5 km and 5o, respectively. Reflectivity (grey-shaded) an
Doppler velocity (solid and dashed lines) are shown. The contours of Doppler velocity are
ly labelled with black numbers (ground-relative, m s-1, positive values mean motion towards th
radar), and partly labelled with white numbers (storm-relative, assuming a storm motion
m s-1 towards the radar). The white line in (a) marks the location of the vertical cross-sec
The white line in (b) marks the altitude of the horizontal cross-section. Signatures of large
muthal and radial shear are labelled with white letters in (a).
Fig. 14: W-E cross-sections of reflectivity and Doppler velocity (left side), and the 40 dBZ
surface, together with a relief of orography (right side). The diagrams (a)-(g) refer to the p
1501-1516 UTC. The location of the cross-sections is indicated in the upper right corner
diagram (y=... km north of the radar). Reflectivity (grey shaded) and Doppler velocity (solid
dashed lines, partly labelled with black numbers) are shown. Updraft impulses are highli
with white numbers (for details see text). The label “V” marks the x-coordinate of the vo
center near the ground. The viewing direction to the isosurfaces is from ENE. The label
marks a “weak echo region”, and the label “H” marks a hook echo, also visible in Fig. 7.
Fig. 15: Shaded contours of maximum Doppler velocity in the outflow region south of the
tex (a), and of minimum Doppler velocity in the inflow region north of the vortex (b). The wh
numbers mark the velocities of the contours (m s-1). The black lines mark the altitudes of thre
convective impulses (“1”, “2’, and “3”, see Section 5b). The labelled rectangles agree wit
small rectangles of Fig. 12a and refer to the discussion in Section 5c. The numbers at the b
of (a) indicate the diameter of the vortex (in km) near the ground.

J u r a
Blackforest
A l p s
Radar
RadarSounding
Sounding
Fig. 1: Overview of the study area. Orography is shown as a relief. Major mountain chains arelabelled. Thick solid lines are political boundaries. Thin solid lines are rivers and lakes. Labelleddots mark radar and sounding stations. Labelled small circles mark major cities. Stars mark mes-onet stations operated by the SMI. The altitude (mean sea level) of some stations is indicated.Crosses mark mesonet stations operated by the PSI. The two white rectangles show the areas ofFigs. 6 (small rectangle) and 10 (large rectangle). The large circles mark the 60 km and 120 kmranges of the radar at Hönggerberg. The Swiss coordinate system is used here. This system isdefined such that the coordinates 600 East/200 North are in Bern.
MerenschwandAlbis
Hönggerberg
Payerne
Bern
Zürich
Basel
7o30 E
47oN
60 km120 km
610 m
1599 m422 m
1407 m
3580 m

Fig. 2: 500 hPa weather chart (a) and enlarged section of the surface chart for Central Europe(b). Adapted from “Berliner Wetterkarte”. The radar at Hönggerberg is shown in (b), togetherwith the radar ranges 60 km and 120 km.
Radar60 km
120 km
Convergence line

10 20-10
10
-10
m s-1Ground (0.5 km)
1 km
2
3 7
8
4 6
Payerne, 1200 UTC
VVP Zürich, 1500 UTC
Storm motion vector
-40 -30 -20 -10 0 10 20 30 40Temperature (oC)
1000850
700600500
400
300250
200
150
100
Pre
ssur
e (m
b)
Merenschwand, 22 July 1995, 14 UTC
1 2 3 4 5 6 7 8 910111213
Alt
itud
e ab
ove
MSL
(km
)
22 July 1995
Payerne
Merenschwand
a)
b)
Fig. 3: Two radiosoundings (a) and a composite wind hodograph (b), obtained on 22 July 1995.The numbers in (b) indicate height in km MSL. The arrow in (b) represents the mean motion(250o, 17 m s-1) of two large cells shown in Fig. 11. The shaded area represents storm-relativehelicity over a layer from the ground (0.5 km MSL) to 3.5 km MSL.
1200 UTC
1400 UTC
-40 -20 0 20 401000
850
700
500
300
200
100
0
2
4
6
8
10
12
Temperature (oC)
Pre
ssur
e (h
Pa)
Hei
ght (
km M
SL)
5
Interpolated
Meteosat VIS-Image: 22 July 1995, 1400 UTC
Germany
Italy
France
New growthApproximatearea of Fig. 1
Alps
Fig. 4: Satellite image of Central Europe (Meteosat, visible), taken on 22 July 1995 at 1400UTC.
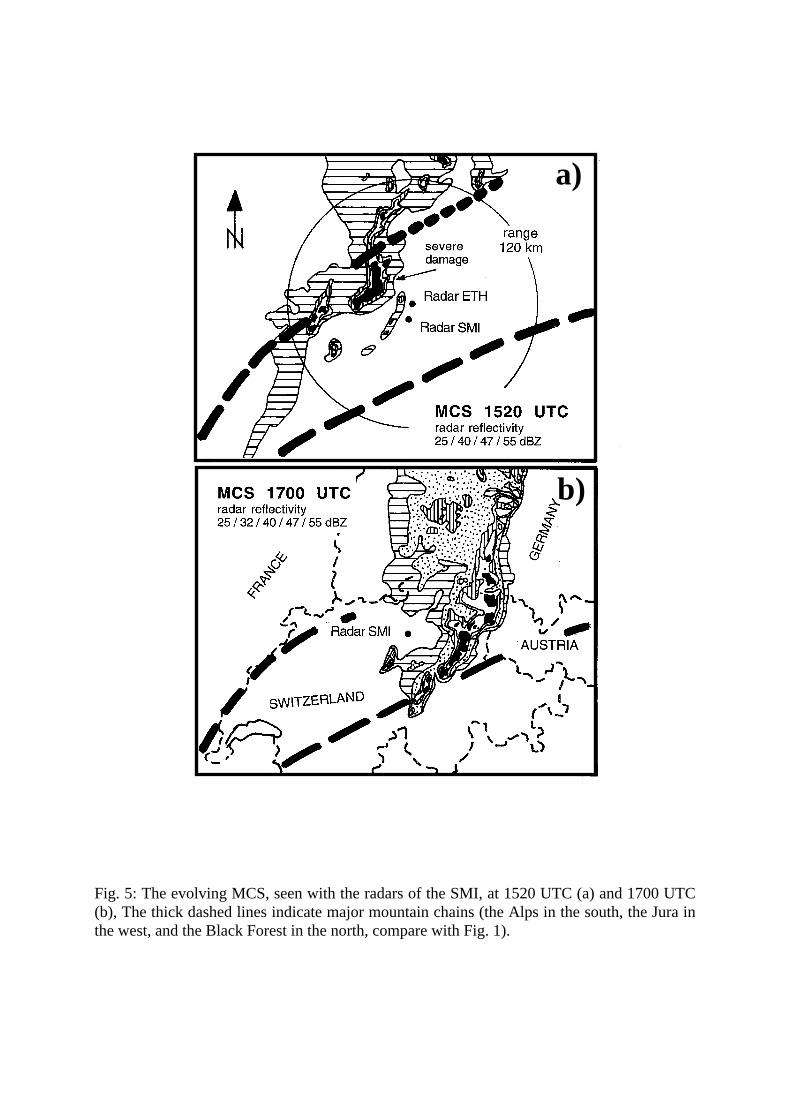
Fig. 5: The evolving MCS, seen with the radars of the SMI, at 1520 UTC (a) and 1700 UTC(b), The thick dashed lines indicate major mountain chains (the Alps in the south, the Jura inthe west, and the Black Forest in the north, compare with Fig. 1).
a)
b)

650 660
265
270
152000
151730151500
Sulz/LeidikonOberhofen
HottwilMandach
PSI Würenlingen
Swiss coordinates east (km)645 655
Sw
iss
coor
dina
tes
nort
h (k
m)
22 July 1995
35
151230
+
5
30
10
+Geissberg
5
0.6o0.6o
1.0o
1.0o
20
1020
3030
Fig. 6: Map of the damage areas and the associated Doppler velocity patterns, observed at thelowest available elevation angle. Damage areas are black. The names of villages affected by thedamage are indicated. Contours of constant Doppler velocity are solid (20, 30, and 35 m s-1 to-wards the radar) and dashed (5 and 10 m s-1 towards the radar). These contours were drawn fromunsmoothed plots of Doppler velocity. The Doppler patterns observed at different times are sep-arated by grey-shaded bars. The times (UTC) and the elevation angles of the associated radarscans are also indicated. The two crosses mark the locations of two meteorological ground sta-tions mentioned in the text. The arrow in the upper right corner of the figure shows the directiontowards the radar. The square (dotted, grey-shaded) marks the range of Fig. 7.
Range of Fig. 7

-30 -28 -26 -2412
14
16
18
Distance east from radar (km)
Dis
tanc
e no
rth
from
rad
ar (
km)
35
30
20
105
10
30
30
2525
Z(dBZ)22 July 1995
10
20
30
40
PPI, 1.0o
151730 UTC
Fig. 7: Reflectivity (grey shaded) and Doppler velocity (solid lines) of the vortex signature, ob-served on 22 July 1995, 1517 UTC, at the lowest available elevation angle. A 3-point mediansmoother was applied to the arrays of reflectivity and Doppler velocity. Radar range circles andazimuth lines are drawn in steps of 2 km and 5o, respectively.

-15
-10
-5
0
5
10
15
20
25
Time CET
u
v
10
15
20
25
30
35
10
15
20
25
30
35
40
50
60
70
80
90
100
05101520253035
Rainfall at PSI
Geissberg, 22 July 1995
Rai
nfal
l (m
m/h
)
1200 1400 1600 1800 2000 2200
Time (UTC)
Fig. 8: Time series of relative humidity at the station Geissberg (a), rainfall rate at PSI (a), tem-perature at Geissberg (b), and of the u- and v-components of wind at Geissberg (c). Two and ahalf minute averages are shown. Rainfall values at PSI are ten minute averages. The locationsof Geissberg and PSI are shown in Fig. 6.
a)
b)
c)
1200 1400 1600 1800 2000 2200
Time (UTC)

965
970
975
980
985
Pre
ssur
e (h
Pa)
••••••••••••••••••••••••••
••••••••••••••••••••••••
•
•
•••••••••••••••
•••••••••••••••••••••••••••••••••••••••••••••••••••••••••••••••••••••••••••••05
1015202530354045
12:00 AM 06:00 AM 12:00 PM 06:00 PM
Gus
t pea
k sp
eed
(m/s
)
Time UTC, 22 July 1995
PSI Anemometer (70 m AGL)
00:0018:0012:0006:0000:00
PSI Barograph
Fig. 9: Pressure (a) and gust speeds (b) measured at PSI (location see Fig. 6). The pressure tracewas manually extracted from a microbarograph paper strip. Due to a systematic drift of the in-strument clock, the data has been shifted by about 20 minutes to coincide with the peak in windspeed.
a)
b)

Reuss
22 July 1995
Rhein
Aare
Limmat
Swiss coordinates east (km)
Sw
iss
coor
dina
tes
nort
h (k
m)
15:20
15:10
15:40
ET
H r
adar
15:3
0
Waldshuto
+
+
+ ++
+
+
+
+
+
+
+
+
+
+ ++
++
+
+
245
250
255
260
265
270
275
280
285
290
295
640 645 650 655 660 665 670 675 680
* Leibstadt
* Beznau
o Brugg
Geissberg * PSI
Fig. 10: Isochrones of wind speed maxima (white lines), retrieved with an objective procedurefrom the data of the ground networks. Black lines are rivers. The height of the ground is grey-shaded (300-1000 m MSL, in steps of 100 m). The ground stations of PSI’s network are markedwith a “+”. Stars are ANETZ stations of the SMI. Major cities are marked with a circle. Thenames of some locations and of the rivers (bold) are also given. (Reproduced with the permis-sion of the Swiss Federal Office of Topography, dated 24 July 1998.)
10
20
30
40
50
Z(dBZ)
-70 -60 -50 -40 -30 -20-10
0
10
20
30
40
Distance east from radar (km)
Dis
tanc
e no
rth
from
rad
ar (
km)
22 July 1995
1511 UTCPPI, 3o
Cell 1
Cell 2Damage
Fig. 11: Reflectivity pattern (grey shaded) at 1511 UTC of the bow echo. The light arrows markthe paths of two large thunderstorm cells, determined from the reflectivity cores at 8 km alti-tude. The time periods of the two cells are 1443-1459 UTC (cell 1) and 1506-1531 UTC (cell2), see also Fig. 12. The grey-shaded line marks the damage track. The solid and dashed blacklines are contours of Doppler velocity, seen from the sector-volume radar scans at the lowestavailable elevation angles. The contour lines are truncated at the boundaries of the sector-vol-ume scans. Radar range circles and azimuth lines are drawn in steps of 10 km and 10o, resp.
1444
14521457
1502
15071512 1517
15 m s-125 m s-130 m s-1

45 dBZ50
55
60
65
4550
55
6065
Max. velocity south of vortex
a)
b)
Fig. 12: Time evolution of some radar parameters. Maximum reflectivities of cells 1 and 2 areshown in (a). Azimuthal shear of the vortex is grey shaded in steps of 2.5.10-3 s-1 and starts at5.10-3 s-1. The white numbers indicate azimuthal shear (in units of 10-3 s-1). The solid bar marksthe time when the vortex passed the damage region. The large rectangle marks the range of Fig.15. The labelled small rectangles refer to specific stages in the evolution of the vortex (for detailssee text). The bottom panel (b) shows the time evolution of maximum Doppler velocity (north-west and south of the vortex). These values were derived from the radar data at the lowest avail-able altitude (1.1 km MSL).
Cell 1 Cell 2
7.5
12.5
Max. velocity northwest of vortex
1 2 3

-70 -65 -60 -55 -50-5
0
5
10
15
Distance east from radar (km)
Dis
tanc
e no
rth
from
rad
ar (
km)
20
30
40
50
60
0
0
10
20
10
20
25
Z(dBZ)22 July 1995, 1451 UTC
10
10
2020
1020
0
25
-70 -60 -55 -50-65
Distance east from radar (km)
2
4
6
8
10
12
14
Hei
ght (
km M
SL)
20
30
40
45
50
55
Z(dBZ)22 July 1995, 1451 UTC
30
A
B
C
D
Fig. 13: Horizontal (a) and vertical (b) cross-section through cell 1. Radar range circlesand azimuth lines are drawn in (a) in steps of 5 km and 5o, respectively. Reflectivity (grey-shaded) and Doppler velocity (solid and dashed lines) are shown. The contours of Dopplervelocity are partly labelled with black numbers (ground-relative, m s-1, positive valuesmean motion towards the radar), and partly labelled with white numbers (storm-relative,assuming a storm motion of 16 m s-1 towards the radar). The white line in (a) marks thelocation of the vertical cross-section. The white line in (b) marks the altitude of the hori-zontal cross-section. Signatures of large azimuthal and radial shear are labelled with whiteletters in (a).
a)
b)
-6
-64
84
-64
-21
14

-50 -45 -40 -35
2
4
6
8
10
12
Hei
ght (
km M
SL)
Distance east from radar (km)
1506 UTC
02020
20
y=15 km
1
2
c)
Fig. 14: W-E cross-sections of reflectivity and Doppler velocity (left side), and the 40 dBZ iso-surface, together with a relief of orography (right side). The diagrams (a)-(g) refer to the period1501-1516 UTC. The location of the cross-sections is indicated in the upper right corner of thediagram (y=... km north of the radar). Reflectivity (grey shaded) and Doppler velocity (solid anddashed lines, partly labelled with black numbers) are shown. Updraft impulses are highlightedwith white numbers (for details see text). The label “V” marks the x-coordinate of the vortexcenter near the ground. The viewing direction to the isosurfaces is from ENE. The label “W”marks a “weak echo region”, and the label “H” marks a hook echo, also visible in Fig. 7.
2
11
2
V102030
40455055
2
4
6
8
10
12
102030
40
455055
Hei
ght (
km M
SL)
Z(dBZ)22 July 1995
1501 UTC
0
20
y=14 km
1
a)
11
V
102030
40455055
-50 -45 -40 -35
2
4
6
8
10
12
Hei
ght (
km M
SL) 1503 UTC
0
0
20
y=15 km
1
2
b)
1
21
2V
-50 -45 -40 -35 -16
-56
24
-6Distance north (km)
Distance east (km)
+ PSI
1
15
10
5
km
1
2
1
2

2
4
6
8
10
12
Hei
ght (
km M
SL)
2
4
6
8
10
12
Hei
ght (
km M
SL)
-45 -40 -35 -30
-45 -40 -35 -30Distance east from radar (km)
102030
40455055
102030
40455055
Z(dBZ)
d)
e)
Fig. 14: (cont.)
2
2
3
W
W
2
2
3
2
2
3
2
2
3
1508 UTC
1511 UTC
y=16 km
0
25
y=17 km
0
25
20
V
V
W
W

2
4
6
8
10
12
Hei
ght (
km M
SL)
2
4
6
8
10
12
Hei
ght (
km M
SL)
-40 -35 -30 -25
-40 -35 -30 -25
Distance east from radar (km)
102030
40455055
102030
40455055
Z(dBZ)
f)
g)
Fig. 14: (cont.)
2
3
2
W
W
3
H
H
2
3
3
2
3
3
2
3
3
1513 UTC
1516 UTC
y=17 km
0
25
15
y=19 km
0
15
V
V
W
W

20
25
30
35
0
-5
-10
-5
0
5
5
Fig. 15: Shaded contours of maximum Doppler velocity in the outflow region south of the vor-tex (a), and of minimum Doppler velocity in the inflow region north of the vortex (b). The whitenumbers mark the velocities of the contours (m s-1). The black lines mark the altitudes of threeconvective impulses (“1”, “2’, and “3”, see Section 5b). The labelled rectangles agree with thesmall rectangles of Fig. 12a and refer to the discussion in Section 5c. The numbers at the bottomof (a) indicate the diameter of the vortex (in km) near the ground.
a) b)1
2
3
1
2
3
1 2 1 27 4 2.5 1.5
331