5.1 radar characteristics of violent tornadic storms …
TRANSCRIPT

5.1 RADAR CHARACTERISTICS OF VIOLENT TORNADIC STORMS USING THE NSSL ALGORITHMS ACROSS SEPARATE
GEOGRAPHIC REGIONS OF THE UNITED STATES
National Weather Service Chris Broyles * Richard Wynne Neal Dipasquale Hector Guerrero Tim Hendricks Amarillo, TX Amarillo, TX Sterling, VA San Angelo, TX San Angelo, TX
1. INTRODUCTION Much work has been done in recent years concerning
the National Severe Storms Laboratory (NSSL) algorithmsrelating to tornadic storms. Greg Stumpf (June 1998 Wea.Forecasting) recently lead the Tornado Warning Guidanceproject at NSSL to improve tornado warnings by associatingtornado detections of the NSSL algorithms to ground truth. Inaddition, Carpenter et al. (2000) looked at the NSSL algorithmswith respect to tornadoes in the Jackson, Mississippi NationalWeather Service county warning area. Also, Burgess andMagsig (1993, 1998 and 2000) identified various radarcharacteristics associated with the Red Rock, Oklahoma; Tulsa,Oklahoma; Louisville, Kentucky; Jarrell, Texas; and OklahomaCity, Oklahoma violent tornadoes. The purpose of this researchis to expand on the work of previous studies by increasing theunderstanding of radar characteristics associated with violenttornadic storms and to determine the similarities and differencesof the characteristics across separate geographic regions of theUnited States. For this study, 38 United States violent tornadicstorms were analyzed from 1993 to 2001 using the NSSLalgorithms. Storm types and environment characteristics wereidentified. In addition, radar signatures were recorded alongwith cell and meso parameters. As a result, radar characteristicsfavorable for violent tornadoes are presented for differentgeographic regions of the United States. 2. METHODOLOGY
For the radar portion of this study, 38 United Statesviolent tornadic storms from 1993 to 2001 were examined. The“Storm Data” publication was used to determine the time ofeach violent tornado. The program, “Severe Plot” version 2.0,was obtained from the Storm Prediction Center and was used todetermine the location of each violent tornado. The resultingUnited States map is shown to the left in Figure 1. The tornadotracks for each event are circled.
Figure 1: To the left, the F4 and F5 events are circled on aUnited States violent tornado map from 1993 to 2001. To theright, the map shows the designated regions of the United Statesfor the radar portion of this study.
For this paper, the United States was divided into five
sections shown in the right portion of Figure 1. The divisionswere made so that the similarities and differences of the radarcharacteristics associated with the violent tornado cases couldeasily be explained in the text. There were ten storms in theSouthern Plains, ten storms in the Northern Plains, ten stormsin the Southeast, and eight storms in the Northeast.
For this study, we gathered cell and meso data fromthe algorithm tables and used the .5 degree reflectivity image toanalyze radar signatures for each violent tornadic storm from 65minutes prior to the first violent tornado to ten minutes after thelast violent tornado touchdown. We obtained the 1993 to 2001radar data from the National Climatic Data Center (NCDC).
* Corresponding author address: Chris Broyles, NationalWeather Service, 1900 English Road, Amarillo, TX 79108
We used the WSR-88D Algorithm Testing and Display System(WATADS) to display the radar data on the ScientificApplications Computer (SAC). As we gathered the data fromeach violent tornadic storm, we entered each value from the celland meso tables on a form. We also recorded the violenttornadic storm’s radar signatures, cell type and the positioningof the storm relative to other storms around it. After wegathered all the data, we entered the values onto separatespreadsheets for each characteristic. In this way, we created adatabase with over 15,000 entries. We made graphs showingthe average value of all 38 storms at each volume scan duringthe 65 minutes prior to the first violent tornado to ten minutesafter the first violent tornado touchdown. The first volume scanprior to the violent tornado included any data that fell from oneto five minutes prior to the violent tornado. The second volumescan included data that fell from six to ten minutes prior to theviolent tornado. In this way, we broke each volume scan intofive minute intervals. Then, we made graphs of all the dataacross the United States as well as graphs showing regional datafor comparison to other regions. 3. RESULTS
The main goal during our research was to make graphsof how different radar characteristics changed during the hourprior to the violent tornado touchdown. The radar signaturesthat we identified included hooks, pendants, rear flankdowndrafts, inflow notches, V-notches, crescent-shaped echoes,and weak echo regions. The main storm characteristics that weconsidered included cell-based VIL, cell direction of movement,cell top height, meso max rotational velocity, meso gate to gateshear and meso diameter. Other characteristics included cellspeed, the value and height of the maximum reflectivity, cellbase height, meso strength index, meso rank, meso base height,meso depth, meso low-level rotational velocity, meso maximumshear, meso speed, meso direction of movement, and any tvs orother meso algorithm alerts. The average values for all 38violent tornadic storms are shown in graphs on the followingpages. It is important to note that although the individual stormdevelopment varied considerably, the graphs show that there isa distinct process taking place during the hour prior to theviolent tornado for the average violent tornadic storm. 3.1 Cell and Environment Characteristics
The storm type was determined for each tornadicstorm just before the violent tornado touched down. As a result,35 of the storms were supercells and three were bow echoes. Ofthe 35 supercells, ten were large supercells, 15 were medium-sized supercells and ten were small supercells. The area ofgreater than 50 dBZ in large supercells was generally greaterthan 120 square miles while the area greater than 50 dBZ insmall supercells was generally less than 40 square miles. Alsoto determine size, the storm’s dominance and the surroundingcell environment was also taken into account.
Of the 35 supercells, four were rapid developersincluding one large supercell, one medium-sized supercell andtwo small supercells. All of the rapidly developing supercellstook place in the Great Plains with two in the Southern Plainsand two in the Northern Plains. One in the Southern Plains wasa large supercell and the other was a medium-sized supercell.The two in the Northern Plains were small supercells.
Of the large supercells, seven of the ten occurred inthe Great Plains. Of the medium-sized supercells, 11 of the 15occurred in the Southern States. Of the small supercells, eightof the ten occurred in the Northern States with four in theNortheast and four in the Northern Plains. Out of the ten smallsupercells, four were supercell hybrids. Three of the hybridsoccurred in the Northeast with one in the Northern Plains. Allof the bow echo cases occurred in the East with two in theNortheast and one in the Southeast.
The violent tornadic storm’s cell environment wasalso determined. As a result, 19 of the 38 storms (50 %) wereassociated with lines. Twelve of the 19 storms occurred withina line of storms with the other seven of the 19 at the absolutenorth or south end of the line. Six of the 12 storms within a linehad a significant clear gap to the south or southwest. Three ofthe 12 storms within a line had a significant clear gap to thenorth or northeast. In these cases, the violent tornado occurred
on the storm’s south end with no gap to the south or southwest.The other three storms of the 12 within a line were embedded ina solid or nearly solid line. Two of the embedded storms werebow echoes with one being a small supercell hybrid.
The remaining seven storms of the 19 that wereassociated with lines, occurred at the absolute northern orsouthern end of the line. Three of the seven storms occurred atthe southern end of a line with a clearing in all areas to thesouth. These were true tail-end charlies. Four of the sevenstorms occurred at the northern end of a line with a clearing inall areas to the north. In these cases, the violent tornadooccurred on the storm’s southern end with no gap to the southor southwest. We called these storms hammerhead echoes.
As a result, of all 19 storms associated with lines, ninestorms occurred at the southern end of the line with either aclearing in all areas to the south or a gap to the south orsouthwest within the line. Seven of the 19 storms werehammerhead formations, occurring at the northern end of theline with either a clearing in all areas to the north or a gap to thenorth or northeast within the line. In these cases, the violenttornado formed on the southern end of the storm.
Of the 19 storms that were not associated with a line,12 occurred in a storm cluster, six were fairly isolated with onebeing truly isolated. Of the 12 that occurred within a cluster,seven were on the cluster’s south end, four were at the cluster’seast end and one was at the cluster’s west end. Five of the sixfairly isolated storms had other storms away from the stormstretched from the northwest to the northeast. One of the fairlyisolated storms had a line to the west. The only truly isolatedviolent tornadic storm was the Jarrell, Texas large supercell.
Considering regional differences, the three storms thatwere embedded in a line occurred in the Northern States. Tenof the 16 storms that were associated with a line but notembedded occurred in the Great Plains. Seven of the ninestorms that formed at the southern end of a line with all areasclear to the south or a gap to the south or southwest were in theGreat Plains. Four of the seven storms that formed at thenorthern end of a line with all areas clear to the north or a gapto the north or northeast were in the Southeast. All but one ofthe 12 storms within clusters were in the Northern states andSouthern Plains. Four of the six fairly isolated storms were inthe Southeast.
For all 38 violent tornadic storms, the average timefrom cell initiation to the first violent tornado was two hoursand ten minutes. The average time from meso initiation to theviolent tornado was 20 minutes. The meso here was defined asthe actual mesocyclone element that produced the violenttornado, not the first mesocyclone in the storm. Average regionaltimes from initiation to the violent tornado are given in Table 1.
Time from Time from Geographic Region Cell Initiation Meso Initiation Southern Plains 141 min. 14 min. Northern Plains 102 min. 24 min. Southeast 170 min. 27 min. Northeast 117 min. 13 min. Table 1. The average time from cell and meso initiation to theviolent tornado in minutes for each region.
As a result, the storms in the Southeast took thelongest to produce the violent tornado from cell and mesoinitiation. The storms in the Northern Plains took the shortesttime from cell initiation and the Northeast storms took theshortest time from meso initiation.
Considering direction of movement, ten of the 11violent tornadic storms that moved from the south to southsouthwest were in the Great Plains. In fact, 13 of 20 storms inthe Great Plains moved from the south to southwest. Only twoSouthern Plains storms moved from a different direction beingfrom the north and north northeast. Eight of the ten storms inthe Southeast moved from the west southwest or from the west.Seven of the eight Northeast storms moved from a directionanywhere from west southwest to northwest.
As a result, the Great Plains storms generally movedfrom the south southwest, while the Southeast storms generallymoved from the west southwest. The Northeast stormsgenerally moved from the west or from the west northwest.
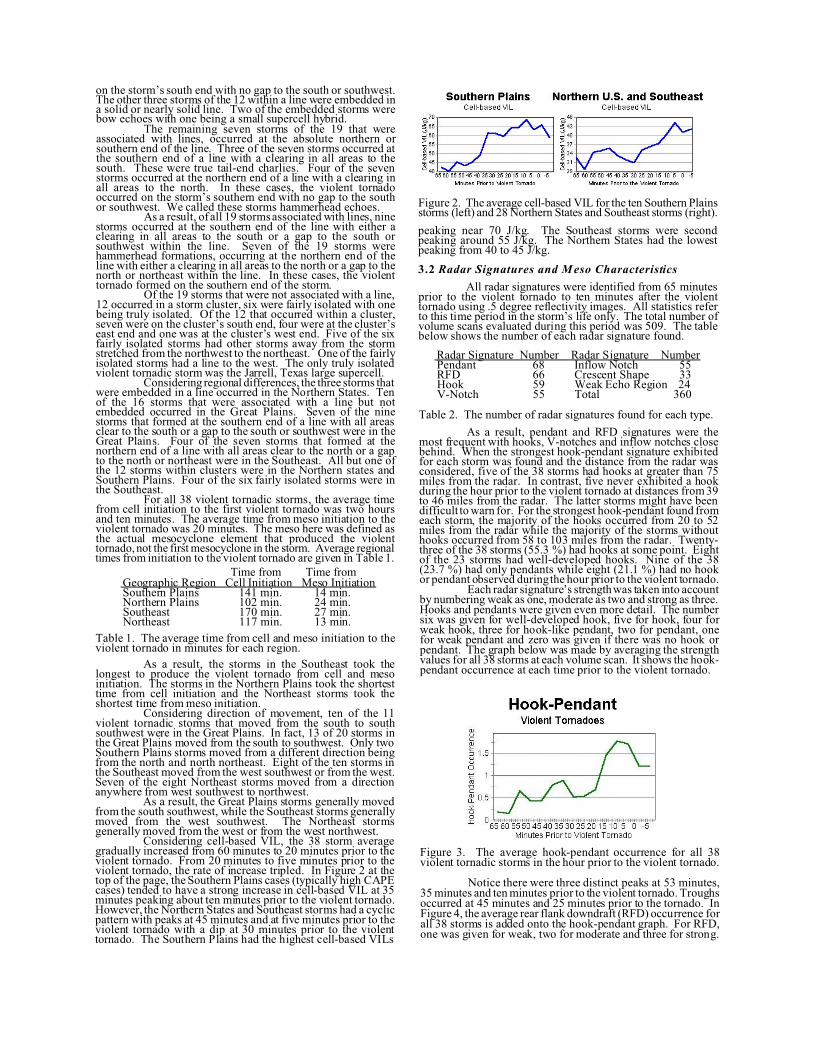
Considering cell-based VIL, the 38 storm averagegradually increased from 60 minutes to 20 minutes prior to theviolent tornado. From 20 minutes to five minutes prior to theviolent tornado, the rate of increase tripled. In Figure 2 at thetop of the page, the Southern Plains cases (typically high CAPEcases) tended to have a strong increase in cell-based VIL at 35minutes peaking about ten minutes prior to the violent tornado.However, the Northern States and Southeast storms had a cyclicpattern with peaks at 45 minutes and at five minutes prior to theviolent tornado with a dip at 30 minutes prior to the violenttornado. The Southern Plains had the highest cell-based VILs
Figure 2. The average cell-based VIL for the ten Southern Plainsstorms (left) and 28 Northern States and Southeast storms (right). peaking near 70 J/kg. The Southeast storms were secondpeaking around 55 J/kg. The Northern States had the lowestpeaking from 40 to 45 J/kg.
3.2 Radar Signatures and M eso Characteristics
All radar signatures were identified from 65 minutesprior to the violent tornado to ten minutes after the violenttornado using .5 degree reflectivity images. All statistics referto this time period in the storm’s life only. The total number ofvolume scans evaluated during this period was 509. The tablebelow shows the number of each radar signature found.
Radar Signature Number Radar Signature Number Pendant 68 Inflow Notch 55 RFD 66 Crescent Shape 33 Hook 59 Weak Echo Region 24 V-Notch 55 Total 360
Table 2. The number of radar signatures found for each type. As a result, pendant and RFD signatures were the
most frequent with hooks, V-notches and inflow notches closebehind. When the strongest hook-pendant signature exhibitedfor each storm was found and the distance from the radar wasconsidered, five of the 38 storms had hooks at greater than 75miles from the radar. In contrast, five never exhibited a hookduring the hour prior to the violent tornado at distances from 39to 46 miles from the radar. The latter storms might have beendifficult to warn for. For the strongest hook-pendant found fromeach storm, the majority of the hooks occurred from 20 to 52miles from the radar while the majority of the storms withouthooks occurred from 58 to 103 miles from the radar. Twenty-three of the 38 storms (55.3 %) had hooks at some point. Eightof the 23 storms had well-developed hooks. Nine of the 38(23.7 %) had only pendants while eight (21.1 %) had no hookor pendant observed during the hour prior to the violent tornado.
Each radar signature’s strength was taken into accountby numbering weak as one, moderate as two and strong as three.Hooks and pendants were given even more detail. The numbersix was given for well-developed hook, five for hook, four forweak hook, three for hook-like pendant, two for pendant, onefor weak pendant and zero was given if there was no hook orpendant. The graph below was made by averaging the strengthvalues for all 38 storms at each volume scan. It shows the hook-pendant occurrence at each time prior to the violent tornado.
Figure 3. The average hook-pendant occurrence for all 38violent tornadic storms in the hour prior to the violent tornado.
Notice there were three distinct peaks at 53 minutes,35 minutes and ten minutes prior to the violent tornado. Troughsoccurred at 45 minutes and 25 minutes prior to the tornado. InFigure 4, the average rear flank downdraft (RFD) occurrence forall 38 storms is added onto the hook-pendant graph. For RFD,one was given for weak, two for moderate and three for strong.
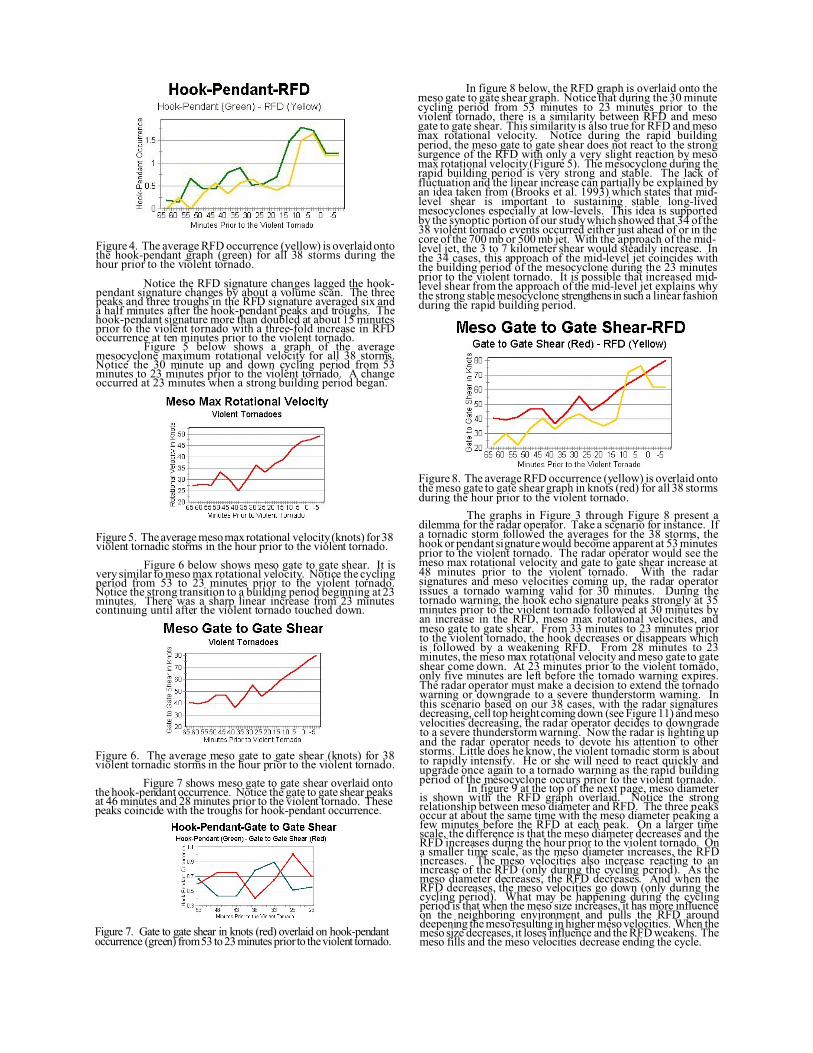
Figure 4. The average RFD occurrence (yellow) is overlaid ontothe hook-pendant graph (green) for all 38 storms during thehour prior to the violent tornado.
Notice the RFD signature changes lagged the hook-pendant signature changes by about a volume scan. The threepeaks and three troughs in the RFD signature averaged six anda half minutes after the hook-pendant peaks and troughs. Thehook-pendant signature more than doubled at about 15 minutesprior to the violent tornado with a three-fold increase in RFDoccurrence at ten minutes prior to the violent tornado.
Figure 5 below shows a graph of the averagemesocyclone maximum rotational velocity for all 38 storms.Notice the 30 minute up and down cycling period from 53minutes to 23 minutes prior to the violent tornado. A changeoccurred at 23 minutes when a strong building period began.
Figure 5. The average meso max rotational velocity (knots) for 38violent tornadic storms in the hour prior to the violent tornado.
Figure 6 below shows meso gate to gate shear. It isvery similar to meso max rotational velocity. Notice the cyclingperiod from 53 to 23 minutes prior to the violent tornado.Notice the strong transition to a building period beginning at 23minutes. There was a sharp linear increase from 23 minutescontinuing until after the violent tornado touched down.
Figure 6. The average meso gate to gate shear (knots) for 38violent tornadic storms in the hour prior to the violent tornado.
Figure 7 shows meso gate to gate shear overlaid ontothe hook-pendant occurrence. Notice the gate to gate shear peaksat 46 minutes and 28 minutes prior to the violent tornado. Thesepeaks coincide with the troughs for hook-pendant occurrence.
Figure 7. Gate to gate shear in knots (red) overlaid on hook-pendantoccurrence (green) from 53 to 23 minutes prior to the violent tornado.
In figure 8 below, the RFD graph is overlaid onto themeso gate to gate shear graph. Notice that during the 30 minutecycling period from 53 minutes to 23 minutes prior to theviolent tornado, there is a similarity between RFD and mesogate to gate shear. This similarity is also true for RFD and mesomax rotational velocity. Notice during the rapid buildingperiod, the meso gate to gate shear does not react to the strongsurgence of the RFD with only a very slight reaction by mesomax rotational velocity (Figure 5). The mesocyclone during therapid building period is very strong and stable. The lack offluctuation and the linear increase can partially be explained byan idea taken from (Brooks et al. 1993) which states that mid-level shear is important to sustaining stable long-livedmesocyclones especially at low-levels. This idea is supportedby the synoptic portion of our study which showed that 34 of the38 violent tornado events occurred either just ahead of or in thecore of the 700 mb or 500 mb jet. With the approach of the mid-level jet, the 3 to 7 kilometer shear would steadily increase. Inthe 34 cases, this approach of the mid-level jet coincides withthe building period of the mesocyclone during the 23 minutesprior to the violent tornado. It is possible that increased mid-level shear from the approach of the mid-level jet explains whythe strong stable mesocyclone strengthens in such a linear fashionduring the rapid building period.
Figure 8. The average RFD occurrence (yellow) is overlaid ontothe meso gate to gate shear graph in knots (red) for all 38 stormsduring the hour prior to the violent tornado.
The graphs in Figure 3 through Figure 8 present a
dilemma for the radar operator. Take a scenario for instance. Ifa tornadic storm followed the averages for the 38 storms, thehook or pendant signature would become apparent at 53 minutesprior to the violent tornado. The radar operator would see themeso max rotational velocity and gate to gate shear increase at48 minutes prior to the violent tornado. With the radarsignatures and meso velocities coming up, the radar operatorissues a tornado warning valid for 30 minutes. During thetornado warning, the hook echo signature peaks strongly at 35minutes prior to the violent tornado followed at 30 minutes byan increase in the RFD, meso max rotational velocities, andmeso gate to gate shear. From 33 minutes to 23 minutes priorto the violent tornado, the hook decreases or disappears whichis followed by a weakening RFD. From 28 minutes to 23minutes, the meso max rotational velocity and meso gate to gateshear come down. At 23 minutes prior to the violent tornado,only five minutes are left before the tornado warning expires.The radar operator must make a decision to extend the tornadowarning or downgrade to a severe thunderstorm warning. Inthis scenario based on our 38 cases, with the radar signaturesdecreasing, cell top height coming down (see Figure 11) and mesovelocities decreasing, the radar operator decides to downgradeto a severe thunderstorm warning. Now the radar is lighting upand the radar operator needs to devote his attention to otherstorms. Little does he know, the violent tornadic storm is aboutto rapidly intensify. He or she will need to react quickly andupgrade once again to a tornado warning as the rapid buildingperiod of the mesocyclone occurs prior to the violent tornado.
In figure 9 at the top of the next page, meso diameteris shown with the RFD graph overlaid. Notice the strongrelationship between meso diameter and RFD. The three peaksoccur at about the same time with the meso diameter peaking afew minutes before the RFD at each peak. On a larger timescale, the difference is that the meso diameter decreases and theRFD increases during the hour prior to the violent tornado. Ona smaller time scale, as the meso diameter increases, the RFDincreases. The meso velocities also increase reacting to anincrease of the RFD (only during the cycling period). As themeso diameter decreases, the RFD decreases. And when theRFD decreases, the meso velocities go down (only during thecycling period). What may be happening during the cyclingperiod is that when the meso size increases, it has more influenceon the neighboring environment and pulls the RFD arounddeepening the meso resulting in higher meso velocities. When themeso size decreases, it loses influence and the RFD weakens. Themeso fills and the meso velocities decrease ending the cycle.

Figure 9. RFD (yellow) overlaid on meso diameter in nautical miles(purple) for all 38 storms in the hour prior to the violent tornado.
When the cycling period ends at 23 minutes, a significantreversal occurs. In Figure 10, meso gate to gate shear is overlaidonto the meso diameter graph. Notice the sharp reversal at 23minutes. At this time, the strong and stable mesocyclone beginsto strengthen linearly and the meso diameter begins to shrink.This shrinking and strengthening stage continues for ten minutesuntil the strong surgence of the RFD beginning at 13 minutesprior to the violent tornado. The meso velocities in the large
Figure 10. Meso gate to gate shear in knots (red) overlaid ontothe meso diameter graph in nautical miles (purple) for all 38storms in the hour prior to the violent tornado. stable mesocyclone do not react to the surgence of the RFD butthe meso diameter does widen or stretch. The shrinking stage istemporarily interrupted. When the RFD begins to weaken atthree minutes prior to the violent tornado, a strong snap backoccurs. The strong and large mesocyclone then snaps back intothe rapidly shrinking state. The meso diameter shrinks quicklyby 25 % as the violent tornado touches down.
Figure 11. V-notch (left) and cell top height in feet (right) for 38violent tornadic storms in the hour prior to the violent tornado.
At the left in Figure 11, a graph for V-notch is shownfor all 38 violent tornadic storms. Notice the V-notchoccurrence decreases in the hour prior to the violent tornado.There is a sharp decrease at 18 minutes prior to the violenttornado. This is the result of a collapsing storm top which isshown to the right in Figure 11. Notice the cell top height dropssharply with a trough at 18 minutes prior to the violent tornadomatching the V-notch trough. Rapid hook formation occurs justafter the storm top collapse. Then, the storm top collapse causesa sudden and very strong surgence of the RFD. This all happensin the first half of the rapid building period of the mesocyclone.
At the left in Figure 12 at the top of the page, a graphfor inflow notch is shown for all 38 violent tornadic storms.Notice the two sharp peaks at 43 minutes and 23 minutes forinflow notch coincide with the troughs for hook-pendantoccurrence. This shows that as the hook or pendant weakens,the inflow notch occurrence increases. These peaks occur justafter peaks in the RFD occurrence and meso velocities. Themiddle graph in Figure 12 shows weak echo region. Notice thetwo peaks at 48 minutes and at 23 minutes. Like inflow notch,the peaks in the weak echo region coincide with the troughs inthe hook-pendant signatures. The weak echo region appearsduring the times of strong inflow and near or just after the peak
Figure 12. Inflow notch (left), weak echo region (middle) andcrescent shape (right) for 38 violent tornadic storms during thehour prior to the violent tornado.
in meso velocities. At the right in Figure 12, a graph forcrescent shape is shown. Notice that the crescent-shapedappearance of the echo steadily increases during the 40 minutesprior to the violent tornado.
4. SUMMARY
The radar characteristics for violent tornadic stormscontain a broad spectrum. Most of the violent tornadic stormswere supercells with only a few bow echoes. The supercellsvaried in size from miniature-sized to large dominant storms.And the storms formed in a variety of storm cell environmentsassociated with lines, clusters, or being fairly isolated. Whenradar signatures were considered, pendants and rear flankdowndraft signatures were the most frequent. To summarize from our 38 storm average, there is acycling period from 53 minutes to 23 minutes prior to theviolent tornado. From 23 minutes until the violent tornado,there is a strong mesocyclone building period. During thecycling period, two distinct cycles occur. Each cycle beginswhen the meso diameter rapidly shrinks. At this time, themesocyclone fills causing the meso rotational velocities toweaken. As the meso shrinks, the hook or pendant strengthens.The hook or pendant peaks when the meso is small and close tothe precipitation shaft. The cell top collapses a bit during thisperiod. Three to five minutes later, the meso diameter increasescausing the hook to decrease or disappear. The largermesocyclone then pulls the RFD around. This deepens themesocyclone and the meso velocities go up. Near or just afterthis time, inflow notch and weak echo region signatures appearrelating to strong inflow. As the RFD weakens, inflow takesover, the meso velocities go down and the meso shrinks endingthe cycle. At 23 minutes prior to the violent tornado, the hookor pendant, RFD and meso velocities are all decreasing. As aresult, the cell top collapses causing the V-notch to disappear.However, during this time, the cycling period ends and thestrong stable mesocyclone begins to rapidly build. The mesovelocities begin to linearly increase possibly resulting from asteady increase in mid-level shear. As the meso velocities go up,the meso diameter steadily shrinks causing the hook to rapidlydevelop beginning at 18 minutes. The storm top collapse causesa strong surge of the RFD beginning at 13 minutes prior to theviolent tornado. This causes the meso to increase in diameter,temporarily interrupting the shrinking stage of the meso. Whenthe RFD begins to weaken at three minutes prior to the violenttornado, a strong snap back occurs. The strong and largemesocyclone then snaps back into the rapidly shrinking state.The meso diameter shrinks quickly by 25 % as the violenttornado is born. For a color webpage of this study, go tohttp://www.srh.noaa.gov/ama/html/Violenttornadoes.html.
To conclude, many ideas have been presented forviolent tornadic supercells. It is hoped that the reader cameaway with an increased understanding of violent tornadicstorms. Hopefully, this paper will better help prepare the radaroperator for the next violent tornadic supercell that comes their way. 5. REFERENCES Brooks, H., C. Doswell, and R. Wilhelmson, The Role ofMidtropospheric Winds in the Evolution and Maintenance of Low-levelMesocyclones. Mon. Wea. Rev., 122, 126-136.
Burgess, D.W. and L.R. Lemon, 1990: Severe Thunderstorm detectionby radar in Radar in Meteorology (D. Atlas, ed.), Amer. Meteor. Soc.,Boston, 619-647 pp.
Burgess, D.W., M. Magsig, J. Wurman, D. Dowell, and Y. Richardson,2001: Radar observations of the 3 May 1999 Oklahoma City tornado.Submitted to Wea. and Forecasting.
Burgess, D.W. and M.A. Magsig, 1998: Recent observations of tornadodevelopment at near range to WSR-88D radars. Preprints, 19th Conf.on Sev. Local Storms, Sep 14-18, Amer. Met. Soc., Minn., MN, 756-759.
Carpenter, E., A. Gerard, and Agre, E.: An Analysis of NSSL WDSSCirculation Parameters during 1999-2000 Tornado Events in the NWSJackson, Mississippi, County Warning Area. Preprints, 20th Conf onSev. Local Storms, Sep 11-15, Amer. Met. Soc., Orlando, FL 368-370.
Markowski, P., E. Rasmussen, and J. Straka, 2000: SurfaceThermodynamic Characteristics of RFDs as Measured by a MobilMesonet, Preprints, 20th Conf on Sev. Local Storms, Sep 11-15, Amer.Meteor. Soc., Orlando, FL 251-254.
Stumpf, G. J., Ed., 1999: NWS Tornado Warning Guidance.http://www.osf.noaa.gov/otb/PAPERS/twg99/index.htm
For Additional References See Papers JP1.4 and JP1.5 and the webpage