the optimum temperature and ph to hydrolyse meat proteins with an
TRANSCRIPT

The optimum temperature and pH to hydrolyse meat
proteins with an enzyme complex from kiwifruit
Yingjie Liu
A thesis submitted to
AUT University in partial fulfillment of the
requirements for the degree of
Master of Applied Science
2010
Primary Supervisor: Associate Professor Owen Young
School of Applied Sciences

I
Abstract
Sarcopenia is the loss of skeletal muscle mass in elderly people. It is usually considered
an inevitable part of ageing, but results from AUT University doctoral study by Donaldson
(2008) suggest that a combination of higher stomach pH and lower pepsin secretion into the
stomach of the elderly limits the nutritional benefits of protein in the diet, eventually resulting
in muscle wasting. To aid digestion, the proteolytically-active fruit kiwifruit, is increasingly
used in clinically validated therapies to improve geriatric nutrit ion. An alternative strategy is
to use protein preparations previously hydrolysed by kiwifruit protease complex as a
non-bitter dietary supplement. The best conditions for hydrolysis are currently unknown.
The hydrolysis of meat protein by an enzyme complex isolated from kiwifruit (Zyactinase®)
was studied to evaluate the influence of temperature (35, 40, 45 and 55°C), and pH (1 to 8) on
the protein solubility. In a typical experiment, each trial was incubated for two hours, which
followed by centrifugation. The post-centrifugation supernatant was divided into two parts:
the first part was undertaken Kjeldahl method; the second part after dilution was carried out an
ultraviolet scanning. Once the optimum conditions were determined, a characterisation of
the protein hydrolysate was carried out by using sodium dodecylsulphate polyacrylamide gel
electrophoresis (SDS-PAGE). It was found that the highest Zyactinase-dependent solubility
occurred at 35°C and pH 2 by Kjeldahl method while the highest total protein solubility
occurred at 45°C and pH 2. However, the biggest Zyactinase-dependent absorbance was at
40°C and pH 2 by UV scanning. The optimum conditions of hydrolysis were optimised
using response surface methodology. The optimum conditions were determined as 40°C and
pH 2. The SDS-PAGE profiles in the hydrolysate from optimum conditions included myosin,
actinin, actin and tropomyosin.

II
Acknowledgement
First and foremost, I offer my sincerest gratitude to my supervisor, Associate Professor
Owen Young, who has supported me throughout my thesis with his patience and knowledge
whilst allowing me the room to work in my own way. I attribute the level of my Master
degree to his encouragement and effort. One simply could not wish for a better and friendlier
supervisor. That’s like an old Chinese saying: ‘pearls are everywhere but not the same as the
eyes’.
My sincere thanks also go to Bruce Donaldson for his guidance of Kjeldahl method and
giving me an understanding of Zyactinase. I also would like to acknowledge Vital Food
Processors Limited New Zealand for the supply of freeze-dried Zyactinase. In addition, I
offer my regards and blessings to all those who supported me in any respect during the
completion of this project, particularly the laboratory technicians.
Finally, I deeply thank my parents in China for their continuing but silent love and
support.

III
Statement of Originality
I hereby declare that this submission is my own work and that, to the best of my
knowledge and belief, it contains no material previously published or written by another
person nor material which to a substantial extent has been accepted for the qualification of any
other degree or diploma of a university or other institutions of higher learning, except where
due acknowledgement is made in the acknowledgement.
Signed by ____________________________________
Date _____________________________________

IV
Table of Contents
Abstract ........................................................................................................................................ I
Acknowledgement ......................................................................................................................II
Statement of Originality............................................................................................................ III
Table of Contents ...................................................................................................................... IV
List of Figures ........................................................................................................................... VI
List of Tables.......................................................................................................................... VIII
Chapter 1 Introduction ............................................................................................................. 1
1.1. Protein structure ............................................................................................................ 1
1.2. Muscle proteins as meat ................................................................................................ 5
1.3. Collagen structure ........................................................................................................11
1.4. Classes of proteases .....................................................................................................11
1.5. Enzymatic hydrolysis of protein ................................................................................. 14
1.6. Sarcopenia ................................................................................................................... 19
1.7. Mechanism of sarcopenia............................................................................................ 19
1.8. Medical intervention for the treatment of sarcopenia ................................................. 21
Chapter 2 Materials and Methods .......................................................................................... 24
2.1. Meat ............................................................................................................................ 24
2.2. The kiwifruit enzyme .................................................................................................. 24
2.3. Chemicals.................................................................................................................... 25
2.4. Equipment ................................................................................................................... 25
2.5. General procedure ....................................................................................................... 26
2.6. Determination of protein solubility by the Kjeldahl method ...................................... 28
2.6.1. The principle of the Kjeldahl method .................................................................. 28
2.6.2. Equipment ............................................................................................................ 28
2.6.3. Procedure ............................................................................................................. 29
2.7. Spectrophotometry ...................................................................................................... 30
V
2.8. Sodium dodecylsulphate polyacrylamide gel electrophoresis (SDS-PAGE).............. 30
2.8.1. The principle of SDS-PAGE ................................................................................ 30
2.8.2. Equipment and solutions ...................................................................................... 31
2.8.3. Gel preparation and electrophoresis..................................................................... 32
2.8.4. Procedure ............................................................................................................. 32
2.9. Experimental Design................................................................................................... 34
2.10. Determination of Protein Solubility ............................................................................ 35
2.11. Data analysis ............................................................................................................... 36
Chapter 3 Results and Discussion .......................................................................................... 37
3.1. Total protein content of minced beef and Zyactinase ................................................. 37
3.2. The effect of pH and temperature on protein solubility .............................................. 38
3.3. Ultraviolet absorbance of supernatants prepared under the effect of pH and
temperature ................................................................................................................ 49
3.4. Optimisation for hydrolysis of meat protein by Zyactinase........................................ 56
3.5. Kinetics ....................................................................................................................... 59
3.6. Electrophoresis............................................................................................................ 62
Chapter 4 Overall Discussion and Conclusions ..................................................................... 65
4.1. Factors affecting denaturation of proteins .................................................................. 65
4.2. The effect of temperature and pH on Zyactinase and substrate proteins .................... 66
4.3. The influence of conformation of Zyactinase and substrate proteins on digestion
products ..................................................................................................................... 68
4.4. The protein digestion in human gut and the implication of gel results ....................... 69
4.5. Conclusions ................................................................................................................. 70
4.6. Future work ................................................................................................................. 71
References ................................................................................................................................. 72

VI
List of Figures
Figure 1. The 20 essential amino acids. ......................................................................... 2
Figure 2. Basic structure of protein. ............................................................................... 3
Figure 3. Formation of disulphide bridge....................................................................... 4
Figure 4. A schematic representation of single myosin molecule .................................. 6
Figure 5. A schematic representation of the structure of myosin thick filament............ 7
Figure 6. Structure of actin and its assembly into a thin filament. ................................. 7
Figure 7. Various levels of organisation of muscle ........................................................ 8
Figure 8. Electron micrograph of a longitudinal view of muscle ................................... 9
Figure 9. A schematic representation of sarcomere........................................................ 9
Figure 10. A sarcomere in relaxed and contracted states ............................................... 10
Figure 11. A schematic representation of collagen .........................................................11
Figure 12. Catalytic mechanism of cysteine proteases................................................... 14
Figure 13. Various proposed mechanisms of sarcopenia. .............................................. 20
Figure 14. Incubation equipment.................................................................................... 26
Figure 15. Protein solubility at 35°C .............................................................................. 39
Figure 16. Effect of pH on water holding capacity by meat. ......................................... 39
Figure 17. Zyactinase-dependent solubility at 35°C ...................................................... 40
Figure 18. Protein solubility at 40°C .............................................................................. 42
Figure 19. Zyactinase-dependent solubility at 40°C ...................................................... 43
Figure 20. Protein solubility at 45°C .............................................................................. 44
Figure 21. Zyactinase-dependent solubility at 45°C ...................................................... 45
Figure 22. Protein solubility at 45°C after pre-cooked at 75°C. .................................... 46
Figure 23. Zyactinase-dependent solubility at 45°C after a pre-cook treatment ............ 46
Figure 24. Protein solubility at 55°C .............................................................................. 47
Figure 25. Zyactinase-dependent solubility at 55°C ...................................................... 48
Figure 26. Difference of protein absorbance at 35°C ..................................................... 51
Figure 27. Difference of protein absorbance at 40°C ..................................................... 52
Figure 28. Difference of protein absorbance at 45°C ..................................................... 53

VII
Figure 29. Difference of protein absorbance at 55°C ..................................................... 54
Figure 30. Total areas of Zyactinase-dependent absorbance curves .............................. 55
Figure 31. Superimposition of total protein solubility and Zyactinase-dependent
solubility........................................................................................................ 58
Figure 32. The kinetics of protein solubility at 40°C and pH 2 ..................................... 60
Figure 33. Difference of protein absorbance for kinetics ............................................... 61
Figure 34. Total areas of Zyactinase-dependent absorbance curves corrected for dilution
between 200 and 300 nm at 40°C and pH 2. ................................................. 61
Figure 35. SDS-PAGE electrophoresis........................................................................... 63
Figure 36. Total protein solubility in presence of Zyactinase. ....................................... 67
Figure 37. All the Zyactinase-dependent solubilities. .................................................... 67
Figure 38. Wavelength scans of different temperature at pH 2. ..................................... 69

VIII
List of Tables
Table 1. The composition of muscle by mass. ...................................................................5
Table 2. Classification of proteases by amino acids characterising actives sites ............ 12
Table 3. Taste of D-amino acids and various peptides .................................................... 18
Table 4. Conversion factors of different materials .......................................................... 30
Table 5. The formulas of resolving gel and stacking gel................................................. 32
Table 6. Molecular mass of marker proteins ................................................................... 34
Table 7. Protein content of minced beef .......................................................................... 37
Table 8. Protein content of Zyactinase ............................................................................ 37
Table 9. The linear regression coefficient between Zyactinase-dependent wavelength
scan areas and solubilities ................................................................................. 56
Table 10. Summary of two-way ANOVA analysis ........................................................... 57

1
1. Chapter 1 Introduction
A wide range of low value meat by-products have been rendered to produce stock feed
and fertiliser, or packaged as pet food. Many of these materials contain large quantities of
protein, and are potentially suitable for producing edible products for humans. There is a
growing market for protein hydrolysates. These hydrolysates may be used as flavor
enhancers, functional ingredients or simply as nutritional additives to foods of low protein
quality. A range of processes have been employed to hydrolyse meat proteins. However,
enzymatic hydrolysis is considered as the most promising process.
Protein hydrolysates find in nutritional management of individuals who cannot digest
whole/intact protein. This proteinaceous material is rich in low molecular weight of free
amino acids and peptides, especially di- and tri-peptides, which have been shown to have
nutritional and therapeutic values (Vijayalakshmi et al., 1986). Most properties of protein
hydrolysates depend on the enzymatic hydrolysis conditions and the starting materials. A lot
of studies have been conducted to optimise the conditions of hydrolysis on meat proteins,
which involved in several different proteases including pepsin, papain and Alcalase.
Another potential protease is actinidin, also in papain enzyme family, which is extracted
from kiwifruit. It is cheap to produce in New Zealand given the abundance of this fruit.
However, the information of optimum conditions and effects of actinidin on hydrolysing meat
proteins is limited. In this study, the objective is to determine the optimum temperature and
pH for hydrolysis of meat proteins catalysed by actinidin in the form of a kiwifruit isolate
marketed as Zyactinase®, with the long term aim to produce a nutritional supplement to
relieve sarcopenia, a symptom of loss of skeletal muscle mass
First however, it is necessary to understand protein structure, muscle protein, proteases
and enzymatic hydrolysis. These will be discussed in the following sections.
1.1. Protein structure
In their simplest form all proteins consist of amino acids which are joined in series

2
through peptide bonds. In this arrangement each amino acid is called a residue and can be
identified by numbering from the amino acid of the protein molecule. The sequence of
amino acids (or residues) in a particular protein is unvarying, being ultimately determined by
the series sequence of nucleotides in DNA. The unvarying amino acid sequence gives each
protein unique physicochemical properties. The genetic codes for 20 amino acids occur in
varying proportions in different proteins (Figure 1). All of these essential amino acids are
α-amino acids, since the amino group is on the α-carbon atom. They have either polar or
non-polar side chains (usually called the R group). A polar molecule has a degree of ionic
character and is hydrophilic while a non-polar molecule is water hating in character and is
hydrophobic.
This image has been removed by the author of this thesis for copyright reasons.
Figure 1. The 20 essential amino acids. (Nelson & Cox, 2005).
To perform their biological function, proteins fold into specific spatial conformations,
driven by a number of non-covalent interactions such as hydrogen bonding, ionic interactions
and Van Der Waals forces.

3
Arising from the interactions of amino acids internal and external to the protein, four
separate levels of protein structure can be identified (Figure 2). The primary structure is the
amino acid residue sequence of the polypeptide chain or chains, because proteins may
comprise one or more polypeptide chains. However, one chain is the most common.
Secondary structure is the area of folding or coiling of parts of the peptide chain within a
protein. Regular and repeating patterns are formed in the polypeptide chain and are
stabilised by hydrogen bonding that act over short inter-residue distances. The patterns
include α- helix and β- sheet patterns.
This image has been removed by the author of this thesis for copyright reasons.
Figure 2. Basic structure of protein. (NHGRI, 2010).
Tertiary structure is the usual final three-dimensional structure of a protein, which result
from a great amount of long-range interactions between residues including hydrogen bonds,
ionic interactions, Van Der Waals forces and sulphur bridges, hypothetically between residue
58 (cysteine) and residue 110 (cysteine) (Figure 3). A final higher level of organisation is
quaternary structure where non-covalent interactions bind multiple polypeptides into a single,
larger protein structure, a good example being haemoglobin with four subunits. These

4
tertiary and quaternary structures are usually referred to conformations.
This image has been removed by the author of this thesis for copyright reasons.
Figure 3. Formation of disulphide bridge. (Clark, 2004).
Proteins can be conveniently divided into two large groups on the basis of conformation:
globular and fibrous proteins. Proteins in the same family descend from a common ancestor
by way of DNA that ultimately codes for primary structure.
Globular proteins have a rounded tertiary structure (often ovoid) and are generally
soluble in water. The globins are a related family of proteins, all of which have similar
primary and tertiary structure (amino acid sequence and folding). These proteins all
incorporate the globin fold, a series of eight alpha helical segments. Two prominent
members of this family include myoglobin (the oxygen storage protein in our tissue) and
haemoglobin (the oxygen transport protein in erythrocytes) (Buxbaum, 2007).
In contrast, as the name suggests, fibrous proteins have an elongated structure and are
usually based on extended helical structures. They are insoluble in water and when arranged
anisotropically in tissues are physically tough, which enables them to play a structural role.
These include collagen, the protein that dominates connective tissues, keratin the dominant
protein in hair and fingernails, silk, and elastin, a protein that occurs in ligaments.
Collagen is a good example to explain the importance and functions of fibrous proteins in
human body. The structure of collagen is triple helix which produces an elongated and
strong characteristic in organism for support or protection. For instance, collagen connects
and supports other bodily tissues, such as skin, bone, tendons, muscles, and cartilage.
Collagen is one of the most plentiful proteins present in the bodies of mammals. It makes up

5
about 25 percent of the total amount of proteins in the body. Without it, the body would fall
apart because it gives the body tissues form and provides firmness and strength (Madison,
2009).
To better understand muscle protein and its metabolism, therefore, it is significant to have
a general idea that the composition and structure of muscle proteins through the next sections.
1.2. Muscle proteins as meat
Table 1 summarises the composition of muscle by mass, focusing on the major proteins
such as myosin, actin and collagen.
Table 1. The composition of muscle by mass.
Non-nitrogenous
components
Nitrogenous components Fraction of
fresh muscle
(% w/w)
Fraction of each
component (%
w/w)
Water 72 Proteins 19
Lipids 5 Myofibrillar
Myosin
Actin
Titin
Tropomyosin
Troponin
Others
Sarcoplasmic
Collagen and elastin
Particulate e.g. mitochondria
11
5
2
1
1
1
1
6
1
1
100
43
22
8
5
5
17
Minerals 1 Non-proteins 2
Carbohydrates 1
Vitamins <1
Non-nitrogenous
components
79 Nitrogenous components 21
From Hedrick (1994)

6
Myosin and actin are the two principle muscle proteins (Table 1). Myosin, the most
dominant component of meat, accounts for 5 % of the wet weight of meat and 43% of the
myofibrillar proteins that comprise the contractile apparatus. Actin comprises 22% of the
myofibrillar proteins.
An individual myosin molecule, with a molecular weight of about 200 kDa, comprises a
fibrous protein tail and a globular head. In muscle and meat the individual molecules are
composed of two of these head-and-tail molecules twisted as a double helix into a doublet as
shown schematically in Figure 4 (Tamarkin, 2006).
This image has been removed by the author of this thesis for copyright reasons.
Figure 4. A schematic representation of single myosin molecule that comprises two
subunits arranged as a double helix with two heads. (Tamarkin, 2006).
These doublet myosin molecules are assembled into a so-called thick filament, which
typically has over 200 myosin molecules in it (Tamarkin, 2006) arranged in a bipolar
anti-parallel manner (Figure 5). (In Figure 5 the ‘single myosin molecule’ represents the
doublet shown in Figure 4 because it has two heads.) In the thick filament the myosin heads
protrude from the surface of the filament (Figures 4 and 5).

7
This image has been removed by the author of this thesis for copyright reasons.
Figure 5. A schematic representation of the structure of myosin thick filament.
An Armstrong (Å) is 0.1 nm. (Tamarkin, 2006).
On the other hand, globular protein actin (G-actin) has a molecular weight of 42 kDa, but
in muscle and meat is similarly assembled into a double-helical filament, to give a thinner
filament comparing with a myosin filament (Figure 6) (Tamarkin, 2006). Actin in filament
form is termed F-actin.
This image has been removed by the author of this thesis for copyright reasons.
Figure 6. Structure of actin and its assembly into a thin filament.
(Glicksman, 2004).
Figure 6 shows that other proteins are distributed in a regular manner along the thin

8
filament. These are tropomyosin and troponin, which each account for 1% of myofibrillar
protein respectively (Table 1,page 5).
Then the thick and thin filaments are orgainised into regular, repeating subunits. These
subunits are the basic contracting units of muscle which are called sarcomere. Figure 7
shows the organization of muscle at various levels, e.g. a schematic representation of
sarcomere in myofibril.
This image has been removed by the author of this thesis for copyright reasons.
Figure 7. Various levels of organisation of muscle. (Greaser & Pearson, 1999).
Viewed longitudinally in thin sections at electron microscope resolution, myosin and
actin appear respectively as thick and thin filaments that interdigitate (Figure 8) as shown
schematically in Figure 7. On the other hand, viewed in cross section, myosin and actin are

9
arranged hexagonally and, usually with six thin filaments surrounding one thick filament
(Figure 9).
This image has been removed by the author of this thesis for copyright reasons.
Figure 8. Electron micrograph of a longitudinal view of muscle. A=A band,
I=I band, H=H zone, M=M line, Z=Z line. (Hedrick 1994).
This image has been removed by the author of this thesis for copyright reasons.
Figure 9. A schematic representation of sarcomere. 1=thin filaments,
2=overlapping thick and thin filaments, 3=M line, 4=thick filaments .
(Belitz & Grosch, 1999).
In the myofibril, the muscle contraction in skeletal muscle is associated with the

10
regulatory complex of troponins and tropomyosin. The calcium ion binds to troponin present
on the thin filament, which allows the tropomyosin to move, unblocking the cross-bridge
binding site (Figure 6,page 7). This enables myosin molecule binding to the newly
uncovered binding sites on the thin filament and therefore actin-myosin cross-bridge is formed,
which is the driving force of muscle contraction and is fuelled by adenosine triphosphate.
Contraction and relaxation of the sarcomere and thus the muscle are the consequence of
repeated formation and breaking of cross-bridge (Lawrie & Ledward, 2006). Figure 10
shows a single sarcomere in relaxed and contracted states.
This image has been removed by the author of this thesis for copyright reasons.
Figure 10. A sarcomere in relaxed (upper) and contracted (lower) states .
(NCBI, 2007).
As discussed above, myosin, actin and other regulatory proteins are the proteins primarily
responsible for muscle contraction. The force generated by this contractile system is
transmitted to bones by a largely inextensible fibrous protein called collagen that typically
represents 1% of the fresh weight of muscle as meat (Table 1,page 5) but can be much higher
in muscles with specialized roles in the live animals. Moreover, at the point of origin and
insertion on bones – in what is technically the boundary between muscle and bone –

11
contractile tissue rapidly becomes collagen.
1.3. Collagen structure
Each muscle is surrounded by a layer of connective tissues consisting almost entirely of
the protein collagen. It is the most abundant protein in mammals, making up 25% of the
whole body protein content. Collagen fibers are composed of cross linked, longitudinally
arranged tropocollagen molecules. The tropocollagen molecule itself consists of three very
similar polypeptide chains. The polypeptide chains of its primary structure each have the
repeating sequence glycine-proline-hydroxyproline-one of the other amino acids (Lawrie &
Ledward, 2006). In its secondary structure, the conformation of each polypeptide chain is an
extended left-handed helix and the three chains wind together in a right-handed helix as shown
in Figure 11. Tropocollagen molecules self-assemble to form fibrils and these fibrils
aggregate to form fibres.
This image has been removed by the author of this thesis for copyright reasons.
Figure 11. A schematic representation of collagen shows the triple helix.
(Mathews et al., 1999).
1.4. Classes of proteases
Proteases are enzymes that catalyse the hydrolysis of proteins into smaller peptides and
free amino acids. The type of protease selected for hydrolysis is critical to the patterns and
properties of protein hydrolysates. Proteases are conventionally classified into six groups in

12
terms of characterising amino acids or features present in their active sites. These are serine/
threonine, cysteine, aspartic, metallo and glutamic proteases (Jakubowski, 2010), examples for
five of which are shown in Table 2.
Table 2. Classification of proteases by amino acids characterising actives sites
Class (active site) Example
Serine/ threonine Trypsin, chymotrypsin, subtilisin, elastase
Aspartate Pepsin
Metallo Thermolysin
Cysteine Papain family
From Jakubowski (2010)
Collectively, serine/threonine proteases are characterised by having a chemically
sensitive catalytic triad consisting of three amino acids: histidine (His 57), serine (Ser 195)
and aspartic acid (Asp 102) (Jakubowski, 2010). Trypsin and chymotrypsin are involved in
the process of digestion of proteins in the duodenum, and belong to the serine protease family.
Trypsin predominantly cleaves peptide chains at the carboxyl side of the basic amino acids,
lysine and arginine (Worthington, 2003). On the other hand, chymotrypsin cleaves peptides
especially at the carboxyl side of tyrosine, tryptophan, and phenylalanine because these three
amino acids contain aromatic rings, which fit into a ‘hydrophobic pocket’ in the enzyme.
Chymotrypsin also hydrolyses other peptide bonds on the carboxyl side of leucine.
As aspartate protease, pepsin is the main gastric enzyme which breaks proteins into
smaller fragments (Collins, 2000). Pepsin preferentially cleaves peptides at the amino side of
aromatic amino acids such as phenylalamine, tryptophan and tyrosine. Pepsin functions best
in acidic environment, particularly those with a pH of 1.5 to 2 and has a temperature optimum
between 37 and 42°C.
The metallo proteases are found in bacteria and fungi. While they differ widely in their
structures, the majority of metallo proteases contain a zinc atom located at the active site.
This catalytic zinc atom is coordinated to three residues of the protein and an active water
molecule. For example, thermolysin’s structure indicates that zinc is bound by two histidines

13
and one glutamic acid. Its mechanism leads to the formation of a non-covalent tetrahedral
intermediate after the attack of a zinc-bound water molecule on the carbonyl group. This
intermediate is further decomposed by transfer of the glutamic acid proton to the leaving
group (Holmes & Matthews, 1982).
Papain from papaya fruit and leaves, bromelain from juice and stems of pineapples, and
actinidin from kiwifruit belong to the cysteine protease family. Arguably these enzymes and
other variants from figs and other plants should all be called papain because each shows only
subtle variation in primary structure (Glazer & Smith, 1971). However, the trivial names are
in common use, and certainly the catalytic properties, while similar, are not identica l.
Collectively they are characterised by having a chemically sensitive sulfhydryl group at their
active site (Glazer & Smith, 1971). Papain is present in papaya and awareness of its
proteolytic activity has been inferred from the widespread use of papaya products to tenderise
meat in the tropics where the plant thrives. Likewise bromelain and actinidin can also be
used as one of components in proprietary meat tenderisers.
Papain consists of 212 amino acids stabilised by 3 disulfide bridges. Its tertiary
structure consists of 2 distinct structural domains with a cleft between them. This cleft
contains the active site, which contains a catalytic triad. The catalytic triad is made up of 3
amino acids: the chemically sensitive cysteine-25, histidine-159 and asparagine-158.
The mechanism by which it breaks peptide bonds involves deprotonation of Cys-25 by
His-159. Cys-25 then performs a nucleophilic attack on the carbonyl carbon of a peptide
backbone. This frees the amino terminal of the peptide and forms a covalent acyl-enyzme
intermediate. The enzyme is then deacylated by a water molecule and releases the carboxyl
terminal portion of the peptide (Figure 12).
As expected for a papain family enzyme, actinidin has a titratable free sulphydryl group
that is essential for activity (Baker, 1980). The three-dimensional structure of actinidin was
determined by X-ray crystallographic analysis, which showed that the polypeptide chain
conformation was essentially identical to that of papain (Drenth et al., 1971). Therefore
actinidin is likely to perform in a similar way to papain on protein hydrolysis.

14
This image has been removed by the author of this thesis for copyright reasons.
Figure 12. Catalytic mechanism of cysteine proteases. (Diwan, 1998).
1.5. Enzymatic hydrolysis of protein
There are three general methods to hydrolyse the protein into essential amino acids.
Those methods are acid hydrolysis, alkaline hydrolysis and enzymatic hydrolysis. The
former two treatments cause reactions which may be undesirable for food use, such as
racemization of amino residues, elimination and addition reactions which may lead to toxic
effects (Michel et al., 1995). Thus enzymatic hydrolysis has advantages over the uncatalysed
chemical methods.
For the production of protein hydrolysates with enzymes, a protein with a certain amino
acids composition and sequence is hydrolysed by one or more enzymes each with a certain
specificity and activity. Enzymes are highly selective in the reactions that they catalyse.
Since they bind to their substrates by way of a series of selective enzyme-substrate binding

15
interactions at a chiral active site, they are able to distinguish the most subtle change in
substrate structure (Bugg, 2004). The choice of the enzyme is determined by a range of
parameters such as the required amount of free amino acids and the required degree of
hydrolysis (DH). DH is defined as the percentage of peptide bonds cleaved. The DH is
usually approximated by the AN-to-TN ratio in which AN is the amount of amino nitrogen and
TN is the amount of total nitrogen as determined by the Kjeldahl method (Whitaker et al.,
2003). An enzyme with a broader specificity in general results in a higher DH.
However, enzymatic hydrolysis of proteins is affected by several factors including the
primary structure of the protein, secondary and tertiary structure, self hydrolysis, and the more
obvious factors like temperature, enzyme-to-protein ratio, absolute concentration of enzyme,
and pH. At the primary structure level, a particular peptide bond may be susceptible to the
enzyme, e.g. the carboxyl side peptide bond of leucine is susceptible to chymotrypsin, but if
the protein is folded to render the bond inaccessible to the enzyme, hydrolysis cannot take
place. Heat denaturation and pH adjustment are two common ways of making bonds more
susceptible, and up to a point increasing temperature accelerates hydrolysis from purely
molecular velocity effects. Thus, many studies on hydrolysis of meat proteins by proteases
have been carried out to find the conditions resulting in highest degree of hydrolysis,
particularly temperature and pH.
Digestion of proteins in the gastrointestinal tract of the human body is a good example to
explain enzymatic hydrolysis involving with several different enzymes. As noted on page 3,
proteins are composed of complex polypeptide chains. To be successfully digested the
peptide bonds linking amino acids within chains must first be broken. This process begins in
the stomach, where hydrochloric acid, secreted as the major component of the stomach’s
gastric secretion, lowers the pH of the gastric contents to pH 1 and 3 that a key gastric enzyme,
pepsin, can work efficiently in its role of hydrolysing the peptide bonds progressively
liberating peptides and amino acids (Collins, 2000). Importantly the acid environment also
tends to destroy tertiary and probably secondary protein structure. The rate of protein
digestion is influenced by concentration and amount of pepsin, acidity and temperature of the
stomach, and the type of protein needed to be digested. In respect of meat proteins, three

16
dominant proteins are particularly important, myosin, actin and collagen. It is important to
note that myosin and collagen have considerable helical character, a feature that makes them
resistant to enzymatic hydrolysis. When denatured by heat and, in the context of digestion,
by a low pH, they become more susceptible to enzymatic hydrolysis.
Digestion of proteins continues in the duodenum, the first segment of the small intestine.
The pancreas secretes the proteases trypsin and chymotrypsin for continued digestion in the
duodenum. These enzymes continue the process started by pepsin to the point that small
peptides and amino acids can pass through the intestinal lining into the vascular system.
Once in the bloodstream, the amino acids are distributed by both red blood cells and by the
liquid blood plasma to tissues throughout the body where they are used in the creation and
repair of cell structures. The body is able to maintain a constant balance of amino acids in
the blood, which is the demand for protein (Collins, 2000). If protein requirements are
exceeded by protein intake, the surplus amino acids may be converted to glucose for energy
use, or converted to fatty acids and stored as adipose tissue. However, if insufficient protein
is consumed, the body may break down protein stored in the muscles and transport the amino
acids to the more vital organs as required.
In vitro hydrolysis of proteins can be used to study human digestion, but more commonly
is used to generate hydrolysates from slaughterhouse wastes for food purposes. The potential
for better utilization of low value meat beyond rendering to meals has been recognised for
many years (O’Meara & Munro, 1983). Meat scraps and meat retained on bones may be
upgraded to protein hydrolysates containing readily absorbable amino acids (O’Meara &
Munro, 1984). All hydrolyses of meat protein in those studies were catalysed by different
proteases, which abound in nature, far beyond the limited scope of pepsin, trypsin and
chymotrysin. Plant enzymes, such as the papain family including papain and bromelain,
have been extensively employed in hydrolysis of meat protein.
Research was conducted by Webster et al. (1982) to produce protein hydrolysates from
meat by-products using four different proteases (pepsin, papain, neutrase and Alcalase). It
showed that all the reactions, at an enzyme-to-substrate ratio of 1:50 by mass, were rapid for 2
hours and plateaued within 3 hours under optimum conditions. This was supported by

17
O’Meara and Munro’s (1984) research. It was evident that papain was the most effective
hydrolysing enzyme of those studied (Webster et al., 1982). According to O’Meara and
Munro (1984), the optimum temperature of papain- and bromelain-catalysed hydrolysis was
40 to 50°C to obtain the greatest solubility. The optimum pH for papain was between 5 and 6
while for bromelain was 6. These optimum conditions will be the basis of the experimental
design of the present research with actinidin.
Among the few studies with actinidin as a proteolytic enzyme, one proposed that
actinidin had a broad pH range for enzyme activity on myofibrillar proteins (Nishiyama, 2001).
Moreover, the detailed proteolytic effects of actinidin on myofibrillar proteins were
pH-dependent. In the pH range of 3 to 4, actinidin thoroughly hydrolysed all of the
myofibrillar proteins, including myosin heavy chain and actin. In the pH range of 5.5 to 8,
actinidin only selectively hydrolysed myosin heavy chain into fragments with smaller
molecular mass. Another study by Aminlari et al. (2009) indicated that actinidin
significantly increased solubility and tenderisation of beef when slices of beef were treated
with actinidin at 37°C for 2 hours.
While papain-family enzymes produced satisfactory yields of soluble proteinaceous
matter in the digestion of meat (Webster et al., 1982) there is another problem. Hydrolysis
often releases bitter-tasting mixtures of peptides and amino acids, which limits their
application in dietary supplementation. Table 3 shows that bitterness is very common in
amino acids and small peptides (Belitz & Grosch, 1999). For example, according to Webster
et al. (1982), the protein hydrolysates of their research were rich in leucine which is bitter in
nature. And even small peptides with leucine in the peptide chains (Gly-Leu, Leu-Gly)
usually have a bitter taste. Those peptides naturally arise from hydrolytic reactions of
proteins in food and where enzymes have been used to extensively hydrolyse low value meat
wastes. For instance, while a bitter taste in gourmet cheeses is often sought after, extreme
bitterness in cheese is a consequence of faulty maturation where endogenous milk proteases
and microbial proteases catalyse excessive hydrolysis of milk proteins. To avoid a bitter
taste in hydrolysed food proteins, it is necessary to modify the proteolysis by using specific
proteases during hydrolysis (Belitz & Grosch, 1999).

18
Table 3. Taste of D-amino acids and various peptides in
aqueous solution at pH 6 to 7
Amino acids Taste Peptide Taste
Alanine Sweet Gly-Leu Bitter
Glycine Sweet Gly-Leu Bitter
Proline Sweet & Bitter Leu-Leu Bitter
Serine Sweet Leu-Leu Bitter
Threonine Sweet Gly-Leu Bitter
Asparagine Neutral Leu-Gly Bitter
Aspartic acid Neutral Ala-Val Bitter
Cystine Neutral Phe-Gly Bitter
Glutamine Neutral Gly-Phe Bitter
Arginine Bitter Phe-Gly-Phe-Gly Bitter
Histidine Bitter
Isoleucine Bitter
Leucine Bitter
Lysine Bitter
Phenylalanine Bitter
Tryptophan Bitter
Tyrosine Bitter
From Belitz & Grosch (1999)
In terms of the study by Webster et al. (1982), papain was the most effective hydrolytic
enzyme for meat proteins. It is therefore possible, even probable that protease actinidin,
which is also in the papain family, might be as effective as papain. Actinidin is derived from
kiwifruit, which is actually a mixture of papain-class proteases (Aminlari et al., 2009). An
active enzyme complex has been commercially extracted isolated from kiwifruit by Vital Food
Processors, and is marketed under the name of as Zyactinase®. This was the preparation used
in unpublished studies by Donaldson and Lang studies, researching on behalf of Vital Food
Processors. This research was on the basis of two patents (Donaldson, 2001; Donaldson &
Lang, 2007) which claim that Zyactinase-catalysed hydrolysates are not bitter, so making this
enzyme preparation for special attention. The reasons for this are presumably due to the
particular but unknown pattern by which Zyactinase hydrolyses the available peptide bonds in
19
meat proteins.
Previous works conducted by Donaldson in terms of Zyactinase was to relieve sarcopenia.
As a further development on this subject, it is important to understand the mechanism and
interventions of sarcopenia in the next section.
1.6. Sarcopenia
The average person can expect to lose a quarter of adult muscle mass by age 70 and
another quarter by age 90. Even if our weight does not change as we get older, our body
composition does — we have more fat and less muscle. This phenomenon is called
sarcopenia, the slow, continuous and apparently inevitable loss of skeletal muscle of an adult
with increasing age. During the process of sarcopenia, there is a replacement of muscle
fibres with fat and an increase of fibrosis (Whitaker, 2005).
Though sarcopenia is not an actual disease, it contributes to the loss of skeletal muscle
mass, strength and endurance. Perhaps most seriously, it responsibly prevents an elderly
person from living an independent life due to the loss of independence (Whitaker, 2005).
This will definitely cost governments more money to cover the welfare of aged people, such
as nursing services. In terms of the increasing proportion of elderly people in developed
countries, sarcopenia is emerging as a major public health concern. As a result, relieving
sarcopenia is a big challenge New Zealanders have to face.
1.7. Mechanism of sarcopenia
Various mechanisms have been proposed to explain the mechanism by which sarcopenia
develops, but there is no doubt that a change in protein metabolism is central to any model
(Greenlund & Nair, 2003; Thomas, 2007). Protein in muscle is not static. There is a
continual turnover throughout life. A healthy person is able to maintain the equilibrium
between anabolism and catabolism of the muscle proteins, but this balance is upset in people
subject to sarcopenia. Sarcopenia occurs when the breakdown rates of proteins exceed
20
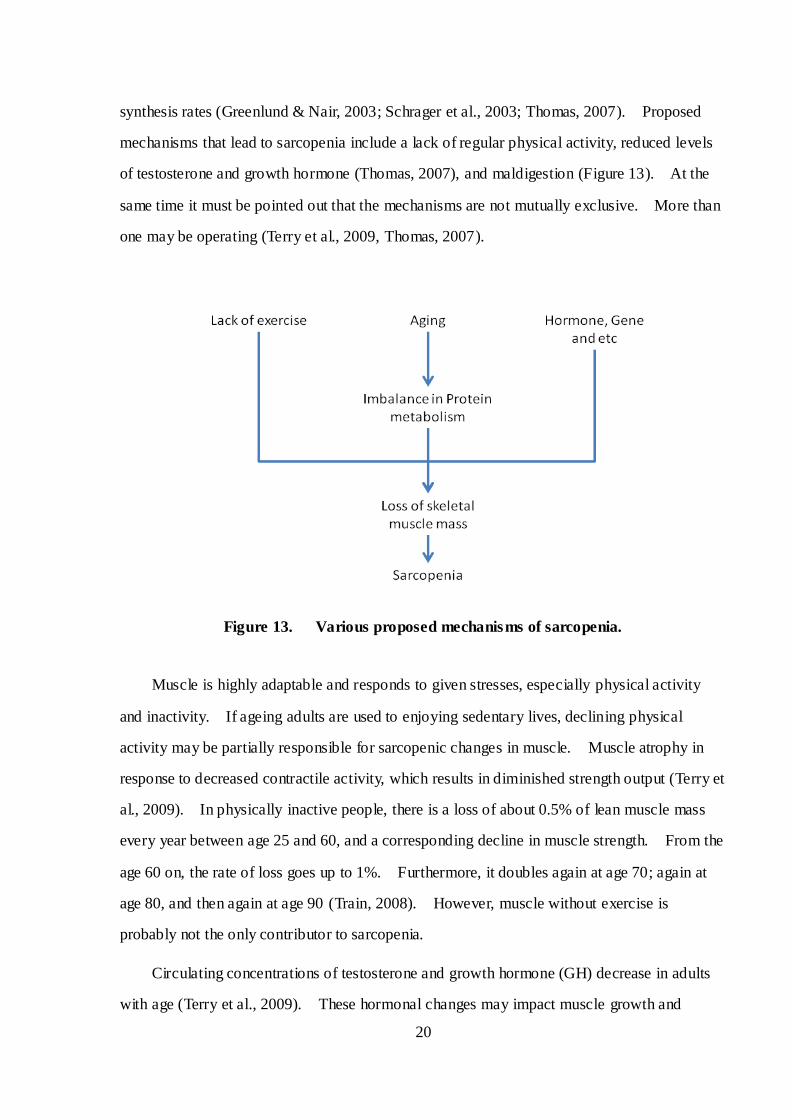
synthesis rates (Greenlund & Nair, 2003; Schrager et al., 2003; Thomas, 2007). Proposed
mechanisms that lead to sarcopenia include a lack of regular physical activity, reduced levels
of testosterone and growth hormone (Thomas, 2007), and maldigestion (Figure 13). At the
same time it must be pointed out that the mechanisms are not mutually exclusive. More than
one may be operating (Terry et al., 2009, Thomas, 2007).
Figure 13. Various proposed mechanisms of sarcopenia.
Muscle is highly adaptable and responds to given stresses, especially physical activity
and inactivity. If ageing adults are used to enjoying sedentary lives, declining physical
activity may be partially responsible for sarcopenic changes in muscle. Muscle atrophy in
response to decreased contractile activity, which results in diminished strength output (Terry et
al., 2009). In physically inactive people, there is a loss of about 0.5% of lean muscle mass
every year between age 25 and 60, and a corresponding decline in muscle strength. From the
age 60 on, the rate of loss goes up to 1%. Furthermore, it doubles again at age 70; again at
age 80, and then again at age 90 (Train, 2008). However, muscle without exercise is
probably not the only contributor to sarcopenia.
Circulating concentrations of testosterone and growth hormone (GH) decrease in adults
with age (Terry et al., 2009). These hormonal changes may impact muscle growth and

21
maintenance. Testosterone is an anabolic hormone that influences protein synthesis. There
is evidence that people with sarcopenia have lower testosterone levels than those without
(Szulc et al., 2004). Growth hormone also has a positive impact on muscle protein synthesis.
Growth hormone deficiency results in loss of muscle mass and increase adipose mass
(Greenlund & Nair, 2003).
Another model involves maldigestion. Ingestion of protein from the food is the primary
source of amino acids for the formation of body protein. However, if insufficient protein is
ingested or protein maldigestion occurs, the body may catabolise protein in the muscles to
transport the amino acids to vital organs when required. The protein maldigestion model
proposed by Donaldson (2008) is that protein maldigestion is likely to increase significantly as
the gastric medium alters with age. There are two main compositional changes in gastric
medium with age including reduced acidity and reduced pepsin concentration.
Gidal (2006) and Russell et al. (1993) showed that advancing age resulted in increased
gastric pH. While the stomach acidity of a healthy young adult is pH 2.5±0.5, these
researchers showed that elevated gastric pH ( > 5) impaired the complete digestion and
absorption. According to Bohak (1969), pepsin exhibits 90% of activity at pH 1.5 whereas
about 35% of activity at pH 4.5. This was also demonstrated by Donaldson (2008) that the
activity of pepsin was greatly reduced above pH 3.0. Consequently, the digestibility of
dietary protein declines with age for this reason alone. Moreover, because pepsin is activated
from pepsinogen by acidity, a decrease in acidity has the compounding effect of not only
restricting the protein unfolding but also inhibiting pepsin activity regardless of its
concentration (Donaldson, 2008). Finally, it is proposed that the stomach yields less
pepsinogen with age (Bloomfield & Keefer, 1928). Thus there may be three factors at work
in the maldigestion model, each working in the same direction, leading to a concentration of
circulating amino acids below that required for effective maintenance of muscle anabolism.
1.8. Medical intervention for the treatment of sarcopenia
Figure 13 (page 20) summarises the causes that have been proposed for sarcopenia and

22
the arrowed shows sites where intervention may be applied. Conventional interventions for
muscle loss include exercise and hormone replacement therapy. The benefits of regular
exercise are well understood for all age groups but it is hard to maintain in many individuals
for many different reasons. In addition, hormone replacement therapy has significant
promise but side effects have hindered its universal adoption including risks of blood clot,
cancer, gallbladder and cardiovascular disease. If the maldigestion model is valid then a
dietary intervention may be applied. Dietary nutritional supplement are low cost, easy to
administer, and nominally would have no negative side effects and thus no ethical issues.
Many nutritional supplement regimens are well tolerated by elderly individuals and can result
in increased daily protein and energy intake (Douglas et al., 2006). In support of the
maldigestion model, supplementation with the so-called essential amino acids has been shown
to stimulate muscle protein synthesis in the elderly (Douglas et al., 2006). According to
another study, supplementation of the diet with essential amino acids improves lean body mass,
strength and physical function (Elisabet et al., 2008). And a study conducted by Donaldson
(2008) at AUT University supports the model in another way. In that work, inclusion of a
papain-family proteolytic enzyme preparation from kiwifruit (Actinidia deliciosa) called
Zyactinase® in an in vitro gastric model of the elderly increased meat protein hydrolysis.
Thus supplementation can be direct (protein hydrolysates containing readily absorbable
peptides and amino acids) or indirect (supplementation by enzymes that will increase
hydrolysis in vivo). The subject of the present study is the direct approach, where an enzyme
is used to partially hydrolyse meat proteins. The resulting mixture would be the basis of the
dietary supplement.
A range of enzymes might be used to hydrolyse low value meat into hydrolysates that
could be used as a supplement to prevent sarcopenia. The criteria governing choice will
include safety, degree of hydrolysis, costs wherever these may arise, and very importantly
flavor. As noted in Table 3 (page 18), many amino acids and peptides are bitter. A protease
that yields a relatively non-bitter hydrolysate would be particularly useful. Patent literature
from a New Zealand company - Vital Food Processors Limited suggests that a papain extract
from kiwifruit – with the proprietary name Zyactinase® – generates no bitter taste (Donaldson,

23
2001; Donaldson & Lang, 2007). Thus, if the cheap plant sulphydryl proteases are to be used
Zyactinase® might be the enzyme of choice.
The details of Zyactinase activity will be explored in this project, which is directed at
temperature and pH. Previous studies about the application of actinidin as meat tenderiser
had been conducted (Lewis & Luh, 1988). However, the optimum conditions for
hydrolysing the meat protein by Zyactinase were not discussed.
In this study, a great amount of treatments on hydrolysis of beef protein catalysed by
Zyactinase have been carried out under different combinations of temperature and pH. The
success of Zyactinase-catalysed hydrolysis can be measured by the relative solubility of
proteinaceous matter (proteins, peptides and amino acids) and the specific materials in the
hydrolysate. Therefore, Kjeldahl method, ultraviolet scanning and gel electrophoresis were
utilised to analyse the hydrolysate, respectively. These will be explained in next chapter in
detail.

24
2. Chapter 2 Materials and Methods
2.1. Meat
Chilled cross-cut blade steak from beef, was purchased from a local butchery (Auckland,
New Zealand). This type of beef was selected because it contains relatively high proportion
of connective tissue and therefore represents a lower price category of meat. Low value meat
is the most likely source of raw material for upgrading by enzymatic hydrolysis of meat
protein. The use of discrete pieces of whole fresh meat tissue would have inevitable
variation in hydrolysis because of the compositional variation between each sampled piece.
To eliminate this variability, it was decided to use the cross-cut blade steak from a single
animal and to further reduce variation by mincing.
All the visible fat was trimmed from the chilled meat before it was cut into smaller pieces
with a knife and subsequently minced by two passes through a 3 mm mincing plate fitted to
domestic Kenwood MG450 mincer. The resulting fine mince mixture divided into aliquots
of about 4 g that were separately frozen at -80°C in plastic containers. Mincing and
subsampling were done at room temperature without delay.
In this study, the Kjeldahl method was used for analysis of protein solubility. With the
equipment available (page 29) the quantity of meat recommended for each hydrolysis and
distillation is 2 g. Therefore 2.5±0.1 g of beef was chosen to be hydrolysed by Zyactinase
for each trial.
2.2. The kiwifruit enzyme
The enzyme complex used in this study was developed by an Auckland based company,
Vital Foods Processor Limited, which is a finely powdered freeze-dried kiwifruit extract of
known protease activity called Zyactinase. The extract was prepared from the common
Hayward variety. Previous research by Nishiyama (2001) and Aminlari et al. (2009), showed
that an active protease extract from kiwifruit could induce significant hydrolysis of meat
protein under controlled conditions. Zyactinase is a dispersed dried product of kiwifruit,

25
nutritionally replicating the fresh fruit with water content reduced by 97% and the protease
activity standardized. In an unpublished study, reportedly done by Dr Douglas Lang, a
copatenter with Mr Bruce Donaldson (see reference list), it was claimed that the concentration
of Zyactinase required to cost-effectively hydrolyse meat was 2 to 3% w/w. As cost was not
a consideration in the current study, 4% w/w was selected as an appropriate starting po int,
which gave an enzyme-to-substrate ration of 1:50. This ratio was also used in a previous
study (Webster et al. (1982). With the standard substrate of 2.5 g of fresh beef it was
calculated that 100±0.2 mg of Zyactinase was required for each sample to represent 4% w/w.
The Zyactinase was stored in air tight container and refrigerated for the extent of the study.
Otherwise Zyactinase loses its activity in the air.
2.3. Chemicals
Hydrochloric acid and sodium hydroxide solutions were used to adjust pH. Sulphuric
acid, hydrogen peroxide, metal salt and boric acid were used in Kjeldahl method.
Acrylamide, bis-acrylamide, ethylene-diamine-tetra-acetic acid (EDTA), N, N, N',
N'-tetramethyl-ethane-1, 2-diamine (TEMED), sodium dodecylsulphate (SDS),
tris-(hydroxymethyl) amino methane also known as Tris base, glycine, ammonium persulphate,
2-mercaptoethanol, bromophenol blue, methanol, ethanol, acetic acid and Coomassie brilliant
blue were all involved in sodium dodecyl sulphate polyacrylamide gel electrophoresis
(SDS-PAGE). A molecular weight maker kit was purchased from Sigma Chemical Co.
(Saint Louis, Mo., U.S.A.) to identify proteins in SDS-PAGE gels. All other chemicals were
analytical grade available from general laboratory supplies.
2.4. Equipment
A Meterlab PHM201 portable pH meter was utilised to determine the final pH of the
mixture prior to adding Zyactinase, accurate to 2 decimal places. The pH electrode was
calibrated using fresh made pH calibration buffers with known pH 4 and 7, which provided 99%
accuracy readings. This process was carried out before pH adjustment commenced.

26
A water-bath (Techne FJP80, Bibby Scientific Ltd, UK), was fitted with a
thermostatically controlled heater (Techne TE-10A, Bibby Scientific Ltd, UK). A Griffin
Flask shaker (Figure 14) was employed to perform the incubation. The temperature was
checked constantly using an independent laboratory thermometer.
Figure 14. Incubation equipment. The incubation tubes were secured by clamps
connecting to the arm of shaker unit. The arm oscillates through 15°.
The required amount of minced beef and Zyactinase for each trial was weighed on a
standard analytical balance, accurate to 4 decimal places. The accuracy of the balance was
checked prior to commencement of the study. All the materials for each trial were weighed
in sequentially numbered evaporating dishes and transferred to numbered screw top plastic
incubation tube by tweezers.
To carry out centrifugation, all the incubation tubes (Fisherbrand Easy Reader plastic
centrifuge tubes, 50mL) were placed in laboratory centrifuge (Heraeus Megafuge 1.0R).
2.5. General procedure
The aliquots of frozen mince were defrosted overnight in a refrigerator. There was no

27
drip. Samples of the defrosted mince were placed in 50 mL centrifuge tubes that also served
as the incubation vessel. Ten millilitres of deionised water was added to incubation tube and
mixed by glass rod with the 2.50 ± 0.01 g samples of minced beef. Without acid or alkali
addition the pH was 5.6 ± 0.1 reading in the pH meter, which was verified throughout the
study. This pH is typically found in meat (Du, 2001). The pH value of mixture was
adjusted as required (which will be discussed in Experimental Design on page 34) by using
standard laboratory HCl or NaOH prior to the addition of Zyactinase. Mixing was achieved
with the glass rod. The volume of the acid/alkali added was monitored such that the total
volume of liquid from 2.5 g meat, acid/alkali, and water was 32.5 mL. This assumes the
moisture content of meat was about 78%. After the pH was determined, the weighed amount
of Zyactinase (none or 100 ± 2 mg) was then added into the mixture.
The filled incubation tubes were immediately transferred to the shaker unit and secured
by clamps so that the entire contents were below the surface of water in the bath. The shaker
unit was set to 240 shakes per minute. The incubation temperatures chosen were 35, 40 45
and 55°C.
The incubation time was recorded from when the Zyactinase was added to the time of
removal from the water bath. Following the incubation, the incubation tubes were placed in
ice for 20 minutes to greatly slow the hydrolysis reaction.
After ice cooling, the tubes were immediately centrifuged at room temperature 4,000 rpm
for 10 minutes. This was equivalent to 4160 gravities at the base of the incubation tube.
This produced a clear, colourless supernatant above a firm precipitate. The supernatants
were then decanted into the Kjeldahl digestion tubes. The precipitate was then washed with
10 mL of deionised water, stirred by glass rod, and re-centrifuged for a further 5 minutes.
The supernatant from the second centrifugation was added to the primary supernatants in
Kjeldahl digestion tubes. The total volume of each tube was recorded, and was in the range
38 to 40 mL.
Subsequently exactly 5 mL of supernatant from each trial was transferred to a plastic
container for spectrophotometry (page 30). These 5 mL aliquots represented a known loss of

28
nitrogen from the combined supernatants and correction was later applied to Kjeldahl data.
Some supernatants were also sampled for gel electrophoresis, and some precipitates were
freeze dried also for later gel electrophoresis.
2.6. Determination of protein solubility by the Kjeldahl method
2.6.1. The principle of the Kjeldahl method
Technical grade sulphuric acid (98%) is used to oxidatively release nitrogen from peptide
bonds and side chains of protein in the form of ammonium ions. The sulphuric acid also
converts the remaining organic matter to carbon dioxide and water, both released as gases.
Metal salts and H2O2 are added to the digestion mixture to promote total oxidative digestion.
Cooled, fully-digested tubes are mounted in the Kjeldahl steam distilling unit. A volume of
concentrated NaOH, well in excessive of that required to neutralize the remaining acid, is
added thus converting the ammonium ion (NH4+) into free ammonia (NH3). Steam is passed
through the digestion mixture, volatilising the ammonia that is trapped in a solution of boric
acid or a known volume and strength of HCl. These solutions are titrated to a neutral end
point and the moles of ammonia and thus nitrogen are calculated. The principle can be
summarised chemically by formulas as follow:
Meat (protein) + H2SO4 → (NH4)2SO4 + H2O + CO2 (not a balanced equation)
(NH4)2SO4 + 2NaOH → 2NH3 + Na2SO4 + 2H2O
NH3 + H3BO3 → NH4+:H2BO3
-
NH4+:H2BO3
- + HCl → NH4Cl + H3BO3
2.6.2. Equipment
A VELP Scientifica DK20 heating block and a UDK126A steam distilling unit were
employed to carry out digestion and distillation, respectively. A standard laboratory burette
was used for titration.
29
2.6.3. Procedure
The digestion tubes containing supernatant were immersed in water at ambient
temperature to minimise heat build-up and prevent loss of ammonia immediately after the
initial introduction of 10 mL of H2SO4. This addition was immediately followed by 10 mL
of H2O2 added to digestion tube. Finally 7.5 g of catalyst (9 K2SO4 + 1 CuSO4·5H2O) was
added to the mixture. The tubes were then placed in heating block located at fume cabinet
and heated to 300°C until complete digestion was indicated by a color change of the
transparent liquid to a clear pale green.
Generally, the digestion was completed in 20 to 45 minutes, which depended on the
amount of protein in hydrolysates. At the beginning of digestion, a large volume of bubbles
were produced in the tube, and had the potential to overflow with subsequent loss of contents
and unreliable results. Therefore, heat had to be initially moderated by sporadically lifting
the tubes from the heating block. During the process, a white vapor, not carbon dioxide or
water, rather SO3 fumes in some mixture with steam, was given off by the reaction mixture.
On completion of the digestion, the tubes were cooled and then 50 mL of deionised water
was added to each tube. In the steam distilling unit, 50 mL of 35% NaOH was added and the
mixture steam was distilled into 4% boric acid (H3BO3) until 100 mL of distillate was
collected. The distillate mixture was titrated against a known concentration of hydrochloric
acid (HCL) using Kjeldahl mixed indicator solution (methyl red and bromocresol green).
Ten drops of indicator solution were added to the solution prior to titration. At the end point,
the colour changes from green to pink. The amount of soluble nitrogen in the supernatant
was calculated by the moles of HCl used for titration.
The nitrogen content was calculated from the formula below:
Nitrogen (mg) = (v × c) × F
v = volume of HCl is used for titration (mL),
c = concentration of hydrochloric acid (M),
F = a factor that depends on the concentration of HCl.
Due to the relatively small amounts of nitrogen in supernatants, the researcher used a
relatively low concentration of HCl (0.0702 M), for which the value of F is 0.984 g M-1

30
(VELP Scientifica). In the Kjeldahl method, a factor is used to convert the nitrogen content
to protein equivalent. From Table 4, the usual factor for red meat is 6.25. Using this
conversion factor the approximate protein content can be calculated from the nitrogen content.
Table 4. Conversion factors of different materials
Foods Factor
Egg or meat 6.25
Dairy products 6.38
Wheat 6.70
Peanuts 5.46
From Nielsen (1998)
2.7. Spectrophotometry
In this study, an ultraviolet/visible spectrometer (Ultrospec 2100 pro, Amersham
Biosciences, United Kingdom) was used to scan absorbances in the range 200 to 800 nm.
The raw supernatants absorbed strongly in the ultraviolet, and all had to be diluted
proportionally with deionised water to reduce absorbance to less than 2. Reported
absorbances were corrected for this dilution. Two matched quartz cuvettes contained 3 mL
of deionised water as the reference and diluted supernatant respectively. The samples were
scanned from 200 to 800 nm, using the slow scan setting and recording at 2 nm intervals.
The supernatant cuvette was then scanned under the same conditions. The absorbances were
recorded using Bio-DC software and later copied to a spreadsheet.
2.8. Sodium dodecylsulphate polyacrylamide gel electrophoresis (SDS-PAGE)
2.8.1. The principle of SDS-PAGE
By adding an anionic detergent (SDS) and a reducing agent to reduce intramolecular
cystine to cysteine, proteins in solution lose their tertiary and secondary structure to become
31
linear peptide chains where the hydrophobic residues bind the dodecyl alkyl chain and the
sulphate residues confer water solubility. Approximately one SDS molecule binds to two
amino acid residues. This gives them a nearly uniform mass to charge ratio thereby allowing
proteins, peptides and amino acids to be separated solely on the basis of their size (Nelson &
Cox, 2005). After unfolding the proteins become nearly linear and molecules of similar size
travel more consistently. The polyacrylamide gel is a cross- linked matrix that acts like a
filter by providing resistance to the proteins trying to pass through under the influence of an
electric charge. Smaller proteins travel faster because they can fit the pores of the gel more
easily while larger proteins have difficulty travelling through the pores. Therefore, larger
proteins travel more slowly. After the gel has been loaded, voltage is applied which will
allow all the proteins to migrate towards the anode. A tracking dye is usually added to the
protein solution under study to track the migration. The negatively charged dye has a small
molecular weight compared with protein and peptides and so leads the migration. When the
dye reaches the end of the gel the power is switched off, the gel is removed, stained, destained
and photographed.
2.8.2. Equipment and solutions
The Joey gel casting system (Owl Scientific, Inc. 10 Commerce Way Woburn, MA 01801,
USA) was used for gel pouring. The Penguin water-cooled dual gel electrophoresis system
(Owl Scientific, Inc. 10 Commerce Way Woburn, MA 01801, USA) was used. Power supply
(PowerPac Basic, Bio-Rad) was used to provide current for gel electrophoresis.
The acrylamide monomer solution contained acrylamide (111 g) and bis-acrylamide (2.5
g) made to 250 mL with (deionised) water. Other gel ingredients were 100 mM of EDTA,
TEMED, 10% (w/v) SDS, resolution (lower) gel buffer (1.5 M of Tris-HCl, pH 8.8), stacking
(upper) gel buffer (0.5 M of Tris-HCl, pH 6.8) and 10% (w/v) ammonium persulphate.
Reservoir buffer was prepared from 3 g of Tris base, 14.4 g of glycine, and 0.5 g of SDS made
to 500 mL. A sample buffer solution was also prepared. It comprised 1 g of SDS, 0.303 g
of Tris, 15 mL of glycerol, 0.5 mL of 2-mercaptoethanol, one drop of concentrated
bromophenol blue (tracking dye) and deionised water to 50 mL. A volume of 250 mL

32
staining solution (125 mL of methanol, 100 mL of deionised water, 25 mL of acetic acid and
0.625 g of Coomassie brilliant blue) was employed to stain the gel after electrophoresis. To
destain the gel, a volume of 100 mL the destaining solution (78.5 mL of ethanol, 16.5 mL of
acetic acid and 5 mL of deionised water) was adopted. All the solutions were stored at
refrigeration temperatures (4°C), but SDS and ammonium persulphate were made fresh for
each gel preparation.
2.8.3. Gel preparation and electrophoresis
The formulas for resolution and stacking gels are showed at Table 5. The resolution gel
was prepared first and the polymerisation was started by addition of ammonium persulphate.
The ratio of TEMED to ammonium persulphate was such that polymerization occurred within
4 minutes, resulting in a perfectly flat top surface that was important for high resolution
(Young & Davey, 1981). After rinsing the top surface with upper gel buffer, the stacking gel
was cast. This discontinuous gel system comprised a 15% resolution gel overlaid with a 3%
stacking gel. And plastic comb was inserted into the stacking gel solution to create 10
sample wells before polymerization occurred also within 4 minutes.
Table 5. The formulas of resolving gel and stacking gel
Resolving gel Volume (mL) Stacking gel Volume (mL)
Gel solution 6.7 Gel solution 1.35
Deionised water 7.8 Deionised water 13.25
EDTA 0.1 EDTA 0.1
Lower gel buffer 5.0 Upper gel buffer 5.0
TEMED 0.02 TEMED 0.02
SDS 0.2 SDS 0.2
Ammonium persulphate 0.2 Ammonium persulphate 0.2
2.8.4. Procedure
After thorough cleaning and drying the glass plates, they were assembled to make a gel
casting system with spacers between them to create a 0.8 mm gap. Then the assembled
casting system was placed into a plastic pouch, which was maintained in a casting stand for
33
gel pouring.
After the stacking gel had set, the plated casting system was transferred to the gel
electrophoresis system. Reservoir buffer was added to the upper and lower reservoirs to
cover the bottom of the resolution gel and the top to the stacking gel. This buffer completes
the electric circuit. The comb was then removed from stacking gel.
The protein samples analysed by SDS-PAGE were supernatant (0.5 mL) and freeze-dried
precipitate (0.02 g±0.001) from the hydrolysis at optimum conditions, supernatant (0.5 mL)
and freeze-dried precipitate (0.02 g±0.001) from the unhydrolysed conditions, and a
controlled sample from fresh meat (0.025 g±0.001). Before loading the protein to wells, it
was necessary to digest the protein with sample buffer to unfold and straighten protein
molecules. Therefore, each one of samples was mixed with sample buffer solution to a total
volume of 1 mL. Afterward, the mixture was digested at 50°C for 20 minutes.
Bromophenol blue was also added to give a blue marker for the proteins.
To identify the proteins in the supernatant, precipitate and in fresh meat, a molecular
weight marker was utilised. Likewise, it was mixed with sample buffer solution and
bromophenol blue as well. The molecular weight standards were showed in Table 6.

34
Table 6. Molecular mass of marker proteins
Protein Approximate
molecular mass (kDa)
Myosin, porcine 200
β -Galactosidase, from Escherichia coli 116
Phosphorylase b, from rabbit muscle 97
Albumin, bovine 66
Ovalbumin, from chicken egg white 45
Carbonic anhydrase, from bovine erythrocytes 29
After digestion of protein samples, a volume of 20 μL mixture from each sample and
molecular weight marker was sequentially loaded into the wells. After proteins loading, the
gel electrophoresis began when switched on the power supply. The current was adjusted and
maintained at 60 mA during the migration process of stacking gel. And it was turned up to
80 mA when the protein arrived at the top of resolution gel. The whole process required 80
minutes.
Gel electrophoresis stopped when the proteins with a colour of blue reached the bottom
of gel. Only the resolution gel was removed from the gel casting system and immersed in gel
staining solution overnight. After staining, the gel was immediately destained until the gel
demonstrated a clear background and the proteins were indicated as blue bands in the gel.
2.9. Experimental Design
First, three trials with 2.5 g samples of minced beef were carried out with the Kjeldahl
method to find the mass of protein, so that the protein solubility of each trial was able to be
calculated in later experiments. This process was repeated to find the mass of protein in 100
mg of Zyactinase.
A complete factorial design was employed to find the conditions of hydrolysis with
Zyactinase, which evaluated the influence of temperature and pH on protein solubility. In
terms of previous studies on papain family enzymes (pages 16 and 17), it was thought that the

35
optimum temperature and pH for Zyactinase would be around 40°C and 4 to 5. Values on
either side were chosen to cover the possibility that these were not the optimum conditions.
The range of temperature was 35, 40, 45 and 55°C, and the pH range was 1, 2, 3, 4, 5, 6, 7 and
8. This was a 4 x 8 factorial design. Furthermore, to investigate the effects of Zyactinase
on the hydrolysis of meat protein at different combinations of temperature and pH, a control
experiment, the hydrolysis with no enzyme, was conducted at the same time. All the trials
were run in duplicate.
Initially, all the trials were incubated for 2 hours, suggested in previous research (page
16). Once the optimum conditions were determined, another analysis of kinetics at the
optimum conditions was carried out to further verify the best hydrolytic time. This included
0, 60, 120 and 180 minutes. In addition, the proteins in the supernatant and the precipitate
that were obtained from optimum conditions were analysed by SDS-PAGE. A control
experiment to identify the proteins in supernatant and precipitate under unhydrolysed
conditions was conducted as well. In addition, once the highest total protein solubility was
found, a pre-cook treatment was introduced to find if it resulted in increased or decreased
protein solubility. To do this, the 2.5 g sample of minced beef was first heated to 75°C for
15 minutes in 10 mL of deionised water. Subsequently 20 mL of each buffer was added to
each, along with Zyactinase or not, to bring the total volume to the standard 32.5 mL. The
only chemical difference between these pre-cook trials and the others was the 33% lower
concentration of buffer.
2.10. Determination of Protein Solubility
Protein Solubility, or the ratio of the percent protein in the hydrolysate to that in the
original substrate, was used as an indication of protein solubility and calculated using the
following equation:
PS (%) = MPs/MP×100%
Where PS is the protein solubility (%); MP is the mass of protein present in the original
substrate (g); MPs is the mass of protein present in the supernatant (g). The protein contents
36
in the supernatant were determined using the Kjeldahl method as said before.
2.11. Data analysis
All data were statistically analysed by SPSS software (version 16.0, SPSS Inc, Chicago,
U.S.A.). The results of protein solubility obtained from all the trials were analysed using the
two-way ANOVA to study the interaction between temperature and pH. All the graphs were
plotted by Microsoft Excel and Sigma Plot 8.0, respectively.

37
3. Chapter 3 Results and Discussion
3.1. Total protein content of minced beef and Zyactinase
To calculate the protein solubility of each trial, the mass of protein present in 2.5 ± 0.01 g
of minced beef had to be determined at the beginning. The results showed that the mean
protein content in the very lean beef was 18% by weight (Table 7). The mean protein content
of Zyactinase was 8.8% (Table 8). These values translate to a ratio of Zyactinase protein to
meat protein of about 1: 51. In calculating solubility due to Zyactinase, it is debatable
whether Zyactinase-dependent solubility should or should not be corrected for the extra
amount of protein due to the addition of Zyactinase. No correction was made for two reasons:
there is no evidence that the Zyactinase proteins will remain in solution under the reaction
conditions (pH 1 to 8, and 35 to 55°C); and if the Zyactinase proteins were in solution the
error would be small – due to the ration of 51:1 – and constant.
Table 7. Protein content of minced beef
Trial 1 Trial 2 Trial 3 Mean
Weight of minced beef (g) 2.5159 2.5119 2.5150 2.5143
Nitrogen content (g) 0.0713 0.0734 0.0748 0.0731
Protein content corrected by 6.25 (g) 0.4455 0.4585 0.4672 0.4571
Percentage of protein in beef (%) 17.71 18.25 18.58 18.18
Table 8. Protein content of Zyactinase
Trial 1 Trial 2 Trial 3 Mean
Weight of Zyactinase (mg) 101.9 101.6 101.3 101.6
Nitrogen content (mg) 1.45 1.45 1.38 1.43
Protein content (mg) 9.07 9.07 8.60 8.91
Percentage of protein in Zyactinase (%) 8.9 8.9 8.5 8.8

38
3.2. The effect of pH and temperature on protein solubility
As described in Materials and Methods (page 27), frozen aliquots of finely minced lean
beef were thawed and 2.5-g samples were accurately weighed into the incubation tubes.
Water and HCl or NaOH were added to a final volume of 32.5 mL assuming that the 2.5 g of
meat occupied 2.5 mL. The particles were dispersed with a glass rod and 100 mg of
Zyactinase was added to one tube of a pH pair but not the other. The 2.5 g of meat
contributed 450 mg of protein to each, while the Zyactinase contributed 8.8 mg. The
experimental design always compared the plus Zyactinase treatment with a no Zyactinase
control. Assuming for the moment that Zyactinase-derived protein was soluble under all
conditions, all solubility differences due to enzyme activity should corrected for the 8.8 mg of
protein that was added to the incubation mixture when Zyactinase was added. However,
there is no information on the solubility of Zyactinase proteins under the experimental
conditions employed so this potential error has been temporarily ignored. It will be further
discussed in the results section.
When the meat samples were incubated at 35°C without Zyactinase, solubility was least
at pH 4 (2.5%), increasing to the 9.7% in the acid direction and increasing to 8.1% in the
alkaline direction (Figure 15). The muscle protein has lowest solubility (Haworth, 2004) and
water holding capacity at its isoelectric point (Elton et al., 2001). The isoelectric point (pI) is
the pH of an aqueous solution of amino acids or peptides at which the molecules carry zero net
electrical charge. The isoelectric point of meat is around 5.0 (Elton et al., 2001) (Figure 16),
but the result obtained here suggests that the isoelectric point was lower.

39
Figure 15. Protein solubility at 35°C.
This image has been removed by the author of this thesis for copyright reasons.
Figure 16. Effect of pH on water holding capacity by meat.
Elton et al. (2001).

40
As can be seen, the protein hydrolysis without Zyactinase was minimal at this
temperature, and may correspond to the solubility of sarcoplasmic proteins rather than
myofibrillar proteins. It is likely that the temperature was sufficient to weaken and break
down the bonds from the long range interactions which are necessary for the presence of
tertiary structure (Mangino, 2007). However, the hydrogen bonds stabilising helical structure
in myofibrillar proteins could not be broken and thus hydrophobic groups were unable to be
exposed to solvent. Therefore irreversible denaturation did not occur.
When the Zyactinase was introduced to the incubation mixture at 35°C, it was obvious
that all the solubilities were markedly increased in the acid direction except at pH 1. The
maximum solubility occurred at pH 2 (28.6%), but it abruptly dropped down to the least at pH
1 (8.4%). Zyactinase had an effect on increasing the solubilities in the alkaline direction, but
the increment was rather static. This can be clearly seen in Figure 17.
Figure 17. Zyactinase-dependent solubility at 35°C.

41
Zyactinase-dependent solubility was least at pH 1 (-1.3%) but peaked at pH 2 (21.5%)
and decreased with increasing pH. (Zyactinase-dependent solubility means the difference in
solubility between the hydrolysates with and without Zyactinase, and is not therefore total
solubility.) The fact that Zyactinase-dependent solubility was negative at pH 1, could mean
two things. It could indicate error or it may be real, mechanism unknown. This could be
resolved by replication but it must be realized that these determinations are time consuming
and the issue is unimportant to the main aim of defining the best hydrolysis conditions for
commercial application.
Viewed simplistically, the data suggest that Zyactinase was completely inactive at pH 1,
but most active at pH 2, and retains high activity up to pH 4. (As will be discussed later in
Chapter 4, enzyme activity is a complex mix of eight or so factors, but not all of these will be
explored in the current description of Zyactinase activity as affected by pH and temperature.)
It should be noted that the Zyactinase-dependent solubility was 1.9% at pH 8 which is
equal to 8.75 mg protein. It is likely that this was contributed by the protein content of
Zyactinase. Therefore, it indicates that Zyactinase had no effect on protein hydrolysis at pH
8.
Figure 18 shows protein solubilities of meat samples incubated with and without
Zyactinase at 40°C. (This graph and others showing plus Zyactinase and no Zyactinase
results are equally scaled to make comparisons easy.) The hydrolysis with no enzyme
produced slightly higher protein solubilities comparing with their counterparts at 35°C. This
could be attributed to more energy breaking down more bonds from long range interactions.
As can be seen, the solubility was greatest at pH 3 (15.7%), decreasing to 9.4% in acid
direction and to 7.1% in the alkaline direction. At first sight, the model of minimum
solubility at the isoelectric point appears to be invalid at this temperature. No clear minimum
was observed around pH 4 or 5. However, two hours incubation at this temperature under
acid conditions may be sufficient to hydrolyse susceptible peptide bonds resulting in solubility
for reasons other than isoelectric properties. But against this argument is the fact that
hydrolysis of bonds would be expected to be greatest at pH 1. This was clearly not the case.
This matter is unresolved.

42
Figure 18. Protein solubility at 40°C.
When Zyactinase was introduced, the highest protein solubility also occurred at pH 2
(30.2%) followed by 24.3% at pH 3 while the lowest one occurred at pH 1 (9.7%) in the acid
direction and pH 8 (9.4%) in the alkaline direction, respectively. The Zyactinase-dependent
solubility is shown in Figure 19, which confirms that Zyactinase was most effective at pH 2,
totally inactive at pH 1 and lost activity with increasing pH. It is shown that the absolute
solubility was increased at pH 2, but the Zyactinase-dependent solubility was decreased
compared with the result at 35°C. The reason is probably that Zyactinase maintained a high
activity and still had a great effect on protein hydrolysis at 40°C. However, the temperature
exerted bigger influence on self hydrolysis than enzymatic hydrolysis. In addition, the
Zyactinase-dependent solubility was 2% at pH 8 which is 9.25 mg of protein. This suggests
that Zyactinase had little effect on the hydrolysis at pH 8.

43
Figure 19. Zyactinase-dependent solubility at 40°C.
When the temperature was adjusted to 45°C, the hydrolysis with no enzyme produced
solubilities a few percentage points higher (Figure 20) than those at 40 and 35°C; thus at pH 3
the respective no enzyme values were 17.2, 15.7 and 6.0% respectively. As at 40°C, the
concept of minimum solubility at the isoelectric point appears to be flawed. Again self
hydrolysis favored an acidic environment.

44
Figure 20. Protein solubility at 45°C.
When the Zyactinase was included in the incubations at 45°C, the overall protein
solubilities were greater than those at 35 and 40°C. This can be seen by comparison of
Figures 15, 18 and 20. Thus at 45°C the plus Zyactinase treatments reached a maximum of
33.2% at pH 2 and even the lowest value (at pH 8) was greatest of the three temperatures 9.8%.
However, comparisons of Figures 17, 19 and 21 shows that 35°C was the most productive for
Zyactinase-dependent solubility. Thus at pH 2, the respective values were 21.5, 20.1 and
18.2%. At pH 3, the equivalent values were 16.1, 8.6 and 8.4%. Therefore pH 2 was
clearly the most useful pH value. The Zyactinase-dependent solubility decreased with
increasing temperature showing that high temperature governed the hydrolysis of protein.

45
Figure 21. Zyactinase-dependent solubility at 45°C.
It is well known that food proteins are generally more susceptible to proteases after
cooking. Therefore the incubation of all trials at 45°C was repeated after a pre-cook
treatment with no enzyme at 75°C for 15 minutes. Figure 22 shows the results. When the
pre-cooked meat samples were incubated without Zyactinase, the highest solubility was 6.2%
at pH 3 while the lowest was 1.8% at pH 7. For the incubation with Zyactinase, the
maximum and minimum solubility occurred at pH 2 (17.4%) and pH 1 (3.6%) respectively.
As can be seen, the protein solubilities were distinctly lower comparing with those at any
temperature regardless of the treatments with and without enzyme. Therefore there was no
advantage to be gained by the pre-cook treatment (compare Figure 20 and 22), of which the
results suggest that denaturation of substrate protein caused by heat was making the protein
less susceptible to Zyactinase. This can be clearly observed from Figure 23. Zyactinase did
not have a satisfied effect on hydrolysis of meat protein.

46
Figure 22. Protein solubility at 45°C after pre-cooked at 75°C.
Figure 23. Zyactinase-dependent solubility at 45°C after a pre-cook
treatment.

47
When the temperature was increased to 55°C, the hydrolysis without Zyactinase
produced higher protein solubilities than those at any temperature (Figure 24). It is simply
that the higher temperature, more protein was solubilised. The maximum occurred at pH 3
(20.5%) while the lowest solubility was at pH 1 (9.5%).
Figure 24. Protein solubility at 55°C.
When the incubation contained added Zyactinase, the greatest protein solubility occurred
at pH 2 (26.9%) followed by 23.2% at pH 3, while the minimum solubility was 9.5%, again at
pH 1. However, their highest values in the presence of Zyactinase were lower than those at
45 and 40°C. Therefore, the difference between the hydrolysis p lus and no Zyactinase was
much reduced. This can be easily viewed from Figure 25. The Zyactinase hardly increased
solubility at this temperature. The reason is likely that the high temperature at 55°C caused
denaturation of the enzyme, which resulted in loss of enzymatic activity. As a result, the
hydrolysis of meat protein at 55°C relied much more on heating. This in itself was
interesting because some muscle proteins may be precipitated at higher temperatures
especially under pH conditions far removed from the physiological pH of around 7. Thus,

48
fish muscle protein at least from cold-water fish will precipitate under acid conditions, e.g.
lemon juice, at refrigeration temperatures.
Figure 25. Zyactinase-dependent solubility at 55°C.
To summarise, when the meat samples were incubated without Zyactinase, the protein
solubility was least in the acid range at pH 1. It was maximal at pH 3, and generally declined
as pH was increased to 8. However, the incubation at 35°C was a clear exception to this with
minimum solubility at pH 4 (Figure 15, page 39). The reason is likely that 35°C is just
below mammalian physiological temperature (~ 37°C) and its different behavior at this
temperature may reflect the behaviour of meat proteins around the isoelectric point (Figure 16,
page 39). At non-physiological temperatures solubility behaviour may vary from expected
patterns. Generally, protein solubility increased without Zyactinase but increased with
temperature, although an upper limit was not established. The secondary and tertiary
structure of the meat proteins under these conditions is unknown, but important because
proteases might be expected to hydrolyse denatured proteins. Thus heat-denatured proteins

49
are believed to be more susceptible to digestive enzymes (Ophardt, 2003), but the limited
available data with Zyactinase on heated proteins (Figure 23, page 46) indicates that this
argument does not apply to Zyactinase.
When the meat samples were incubated with Zyactinase, the minimum protein solubility
due to Zyactinase occurred at pH 1 in the acid direction, which indicates Zyactinase is almost
certainly inactive at pH 1. It is likely the enzyme was denatured at such an extreme acidic
environment. However, this could only be confirmed by treating Zyactinase at pH 1,
recovering the enzyme and testing its activity at high pH values. This is beyond the scope of
this thesis. However, the protein solubility due to Zyactinase increased abruptly and reached
a maximum solubility at pH 2, which shows that Zyactinase was most active at pH 2 on the
proteins available in meat in the unknown conformational state induced by strongly acidic pH.
Rephrased, the enzyme may not be maximally active at pH 2, whereas the conformation of the
substrate proteins may be optimal for hydrolysis. Zyactinase-dependeny hydrolysis was
maximal at 35°C. It seems highly unlikely that the decreasing trend in solubility with
increasing temperature would be reversed above 55°C, but below 35°C remains unexplored.
The maximum Zyactinase activity at pH 2 and 3 at near physiological temperatures may have
important implications for digestive therapies, and will be further discussed in Chapter 4. At
this time, however, it is important to point out that higher Zyactinase-dependent activity at
35°C does not necessarily mean the enzyme is most active at this temperature. The
conformational nature of the substrate is also temperature dependent, and an enzyme can have
higher activity at a higher temperature but at the same time suffer from progressive
denaturation with time at the higher temperature. Nonetheless, commercial demands ignore
these complexities, meaning that with the information to hand, 35°C is best. It is possible
that a lower temperature, e.g. ambient, would be more useful, but there was not enough time to
explore this possibility.
3.3. Ultraviolet absorbance of supernatants prepared under the effect of pH and
temperature
Though the diluted supernatants were scanned in the wavelength range from 200 to 800

50
nm, only the data in the range 200 to 300 nm were of interest because the supernatants were
light brown, and absorbed little at longer wavelength. After correction for dilution, the data
were plotted showing the difference of protein absorbance between the hydrolysis with and
without Zyactinase. (Zyactinase-dependent absorbance means the difference in absorbance
between the hydrolysates with and without Zyactinase, and is not therefore total absorbance.)
When the meat samples were incubated at 35°C, the biggest difference of protein
absorbance occurred at pH 2 with a broad peak around 210 nm (Figure 26). Tryptophan,
tyrosine, and phenylalanine variously absorb between 200 and 300 nm (Luebke et al., 1975),
and histidine, cysteine and methionine absorb between 200 and 210 nm (Leo et al., 1952;
Belitz & Grosch, 1999). The broad peak at 210 nm could comprise any of these amino acids
in mixture in peptides and or as free amino acids. The difference spectrum at pH 3 also
showed a broad peak at 210 nm, but the absorbance was lower than that at pH 2. This
suggests the digestion profile at these two pH values was similar, only differing in degree.
At pH 1, Zyactinase-dependent absorbance was negligible confirming that Zyactinase was
inactive at pH 1. As can be observed, the curves at pH 4 and 5 showed an absorbance shift to
longer wavelength, suggesting that the soluble digestion products of Zyactinase on meat
proteins changed with pH value. Thus at different pH values the substrate proteins will have
different conformations, and Zyactinase may exhibit different specificities at different pH
values. At pH 6, 7 and 8, the Zyactinase-dependent absorbance progressively decreased,
with evidence of a shift to longer wavelengths. These differences in wavelength profiles are
unlikely to be due to pH in the samples prepared for spectrophotometry, because the aliquots
from post-centrifugation supernatants are routinely diluted 1:40 to bring absorbances within
the dynamic range of the spectrophotometer. However, the pH of diluted supernatant was not
tested, so a pH influence remains a slight possibility.

51
pH 2
pH 6pH 5
pH 4
pH 1
pH 7
pH 3
pH 8
Wavelength (nm)
200 210 220 230 240 250 260 270 280 290 300
Zya
ctin
ase-d
epe
nden
t a
bso
rba
nce
co
rre
cte
d for
dilutio
n
-200
0
200
400
600
800
Figure 26. Difference of protein absorbance at 35°C.
When the meat samples were incubated at 40°C, the biggest difference in absorbance
occurred at pH 2, with a broad peak around 206 nm (Figure 27), caused by a mixture of
proteinaceous matter as discussed before. All the absorbances were generally higher at 40°C
than those at 35°C, which was unexpected because Zyactinase-dependent solubility was
greatest at 35°C (Figure 17, page 40). It is likely that ultraviolet light-absorbing matter other
than protein, like nucleic acids, may be preferentially solubilised at the higher temperature.
As in Figure 26, absorbances from digestions at pH 1, 7 and 8 were negligible (Figure 27).
Also as in Figure 26, the wavelength shifts from hydrolysis at different pH values show that
the soluble digestion products of Zyactinase on meat proteins changed with pH value.

52
Wavelength (nm)
200 210 220 230 240 250 260 270 280 290 300
Zya
ctin
ase
-de
pe
nd
en
t a
bso
rba
nce
co
rre
cte
d fo
r d
ilu
tio
n
-200
0
200
400
600
800
pH 2
pH 4
pH 3
pH 5
pH 6
pH 1
pH 7
pH 8
Figure 27. Difference of protein absorbance at 40°C.
When the incubation temperature was increased to 45°C, the biggest difference in
absorbance still occurred at pH 2, and showed a broad peak around 223 nm (Figure 28).
Compared with the results at 35 and 40°C, the peak of pH 2 at 45°C has shifted to longer
wavelengths, again suggesting the involvement of different protein conformations in substrate,
and perhaps in Zyactinase, at different temperatures with different hydrolysis outcomes. The
overall absorbance was lower than that at 40°C but still higher than that at 35°C.
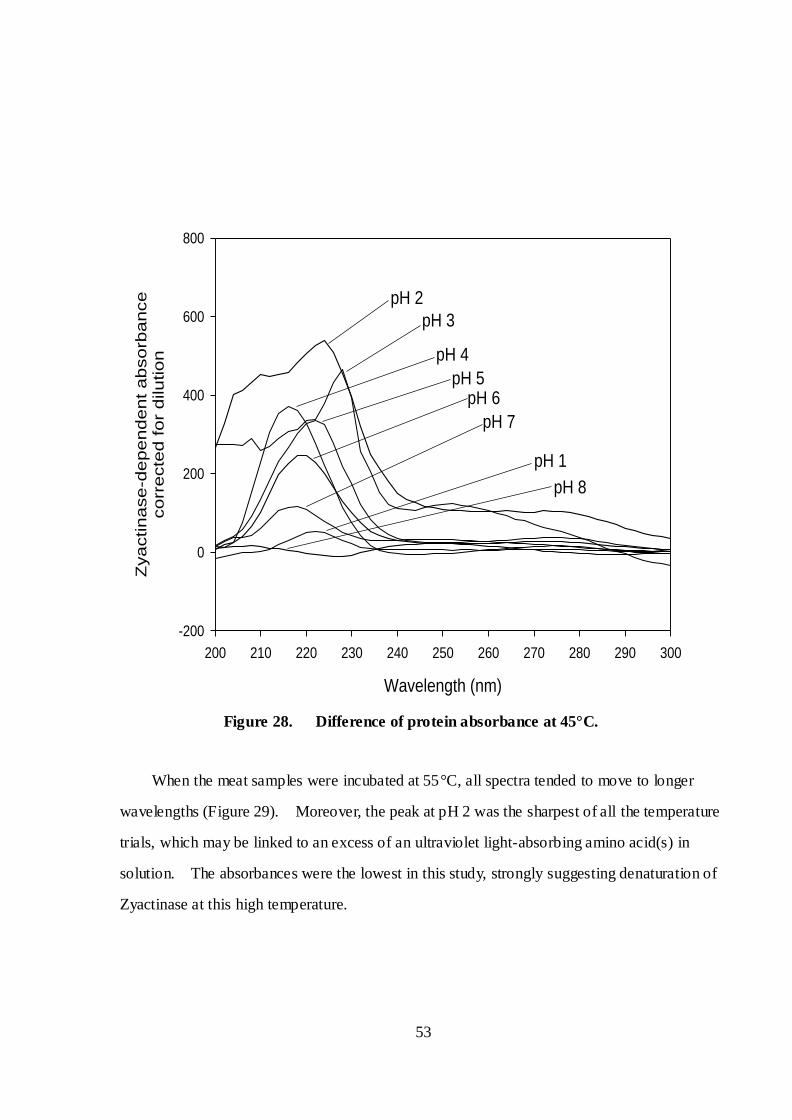
53
Wavelength (nm)
200 210 220 230 240 250 260 270 280 290 300
Zyactinase-d
epen
dent absorb
ance
corr
ecte
d for
dilution
-200
0
200
400
600
800
pH 2
pH 4
pH 5pH 6
pH 1
pH 3
pH 7
pH 8
Figure 28. Difference of protein absorbance at 45°C.
When the meat samples were incubated at 55°C, all spectra tended to move to longer
wavelengths (Figure 29). Moreover, the peak at pH 2 was the sharpest of all the temperature
trials, which may be linked to an excess of an ultraviolet light-absorbing amino acid(s) in
solution. The absorbances were the lowest in this study, strongly suggesting denaturation of
Zyactinase at this high temperature.

54
Wavelength (nm)
200 210 220 230 240 250 260 270 280 290 300
Zyactinase-d
epen
dent absorb
ance
corr
ecte
d for
dilution
-200
0
200
400
600
800
pH 1
pH 4pH 5
pH 6
pH 2pH 3
pH 8
pH 7
Figure 29. Difference of protein absorbance at 55°C.
The emphasis in Figures 26 to 29 is on peaks and differences due to Zyactinase under
different conditions. The data also permit a calculation of the total relative absorbance ‘color’
of each absorbance curve in the 200 to 300 nm range. This was done by summing the 51
Zyactinase-dependent absorbance values at every 2 nm between and including 200 and 300
nm (Figure 30). It is clear that all the maximum absorbances occurred at pH 2 no matter
what temperature was adopted. Moreover, at each temperature, a similar shape at different
pH values can be observed when compared with the Zyactinase-dependent solubility graphs
(Figures 17, 19, 21 & 25). However, it shows that the maximum area (or most absorbance)
for the study occurred at 40°C. This implies that the most proteinaceous matter was released

55
due to Zyactinase at pH 2 and 40°C. This is in contrast to the results from
Zyactinase-dependent solubility by Kjeldahl method showing that pH 2 and 35°C generated
the greatest protein solubility.
Figure 30. Total area of Zyactinase-dependent absorbance curve
corrected for dilution between 200 and 300 nm.
To formally examine the relationship between Zyactinase-dependent solubility (from
Kjeldahl method) and the areas of Zyactinase-dependent absorbance curves (from UV
scanning), a correlation test was carried out and the linear coefficient (r) was calculated (Table
9).
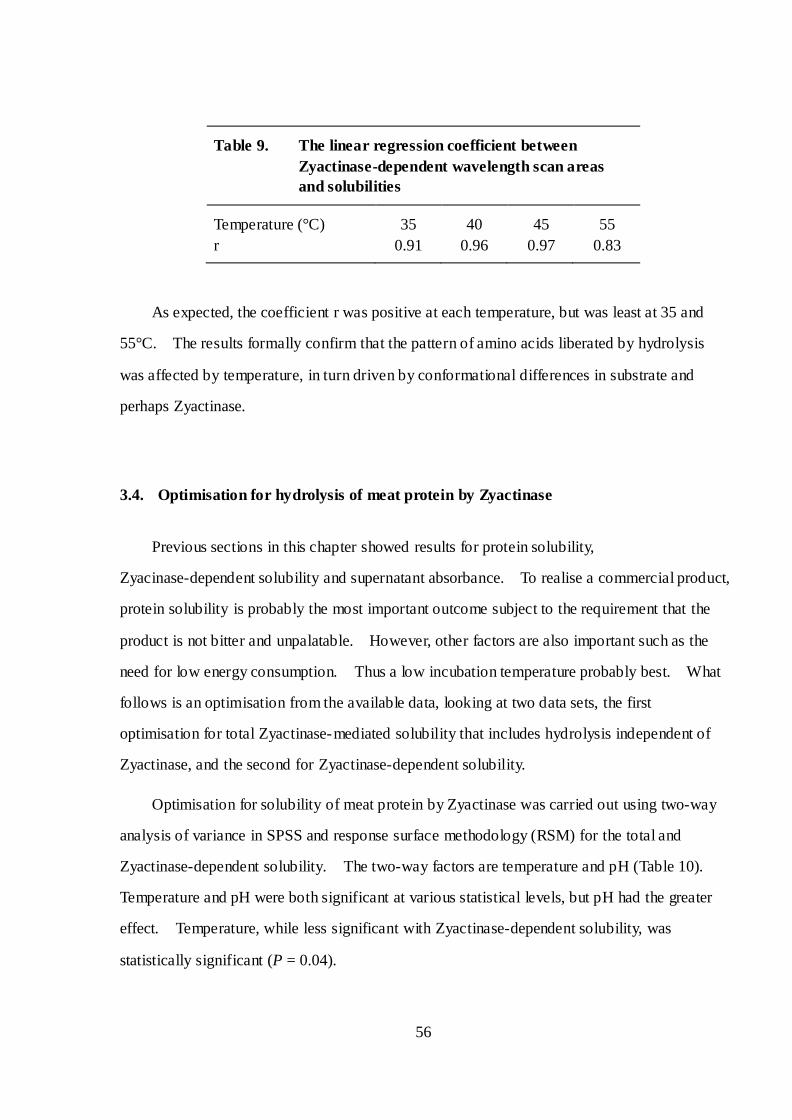
56
Table 9. The linear regression coefficient between
Zyactinase-dependent wavelength scan areas
and solubilities
Temperature (°C) 35 40 45 55
r 0.91 0.96 0.97 0.83
As expected, the coefficient r was positive at each temperature, but was least at 35 and
55°C. The results formally confirm that the pattern of amino acids liberated by hydrolysis
was affected by temperature, in turn driven by conformational differences in substrate and
perhaps Zyactinase.
3.4. Optimisation for hydrolysis of meat protein by Zyactinase
Previous sections in this chapter showed results for protein solubility,
Zyacinase-dependent solubility and supernatant absorbance. To realise a commercial product,
protein solubility is probably the most important outcome subject to the requirement that the
product is not bitter and unpalatable. However, other factors are also important such as the
need for low energy consumption. Thus a low incubation temperature probably best. What
follows is an optimisation from the available data, looking at two data sets, the first
optimisation for total Zyactinase-mediated solubility that includes hydrolysis independent of
Zyactinase, and the second for Zyactinase-dependent solubility.
Optimisation for solubility of meat protein by Zyactinase was carried out using two-way
analysis of variance in SPSS and response surface methodology (RSM) for the total and
Zyactinase-dependent solubility. The two-way factors are temperature and pH (Table 10).
Temperature and pH were both significant at various statistical levels, but pH had the greater
effect. Temperature, while less significant with Zyactinase-dependent solubility, was
statistically significant (P = 0.04).

57
Table 10. Summary of two-way ANOVA analysis
Factors Sum of squares Mean square P value
Total protein solubility
pH
Temperature
1478.8
33.4
211.3
11.2
< 0.001
0.001
Zyactinase-dependent solubility
pH
Temperature
774.8
98.4
110.7
32.8
< 0.001
0.040
As described on page 17, research conducted by Webster et al. (1982) showed that papain
was the most effective protease among others from different catalytic families to hydrolyse
meat protein at its optimum conditions (50°C and pH 5.5). At an enzyme-to-substrate ratio
of 1:50, papain-dependent hydrolysis was increased by 15% within 2 hours of hydrolysis.
Compared with papain, the highest Zyactinase-dependent solubilities at pH 2 were satisfied at
the temperature range between 35 and 45°C. Moreover, the Zyactinase-dependent
solubilities at these temperatures were both more than 20%. These are similar to the result
from research by Aminlari et al. (2009). They showed that actindin significantly increased
protein solubility by 20% at 37° for 2 hours. Therefore the optimum temperature for
Zyactinase is likely to be around the mammalian physiological temperature.
In terms of previous analysis, pH 2 was the best for hydrolysing meat protein into soluble
proteinaceous matter. However, the optimum temperature was more difficult to determine,
and it was useful to use the overlapped contours of the protein solubility and
Zyactinase-dependent solubility to find the optimum temperature (Figure 31). After
combining the two results, it shows that the optimum temperature for total protein solubility
was 45°C while for Zyactinase-dependent solubility was 40°C.

58
Optimum region
pH
1 2 3 4 5 6 7 8
Tem
pera
ture
(℃)
35
40
45
50
55
9
12
15
18
21
24
27
30
33
4
4
8
8
16
12
20
4
0
1 2 3 4 5 6 7 8
35
40
45
50
55
0
4
8
12
16
20
Protein solubility (%)
Zyactinase-dependentsolubility (%)
Optimum regions
Figure 31. Superimposition of total protein solubility and Zyactinase-dependent
solubility. Total solubility is colour coded while and the white lines are
Zyactinase-dependent solubilities. Optimum region for total protein
solubility occurred at 45°C (about 30%) and pH 2, while for
Zyactinase-dependent solubility (20%) occurred at 40°C and pH 2.
On the face of it, high total solubility would appear to be most important. However, the
peptide mix resulting from Zyactinase might have better properties for digestion. Clinical
trials would have to be applied to answer this question. However, in the current study, the
focus is on the chemical properties of hydrolysates after digestion. Zyactinase-dependent
absorbance and Zyactinase-dependent solubility was highest at 40 and 35°C, respectively, and
the total protein solubility was highest at 45°C. As a compromise, the optimum conditions
were declared: 40°C and pH 2.

59
3.5. Kinetics
From the analysis above, Zyactinase worked most effectively on beef proteins at pH 2
and 40°C. However, this result was obtained for only one incubation period, arbitrarily
chosen to be 120 min. For industrial applications, kinetics is critically important because, for
instance, halving reaction time effectively halves the cost of capital equipment because
throughput can be doubled.
The experiment reported here determined protein solubility at pH 2 and 40°C in the
presence and absence of Zyactinase over 180 min (Figure 32). The expectation was that both
total and Zyactinase- independent hydrolysis would increase with time and then plateau. In
the situation where Zyactinase was present this would be attributed to the enzyme running out
hydrolysable substrate (as determined by primary and secondary protein structure), and/or
enzyme inactivation. Figure 32, which was reproducible, showed that
Zyactinase- independent showed a low peak at 60 min and declined subsequently. The total
solubility peaked at 120 min then declined to equal the Zyactinase- independent value, around
6%. Such value would be commercially useless. It is important to emphasise that solubility
is cumulative in Figure 32, so the results can only mean that initially soluble proteinaceous
matter eventual precipitated. The reason for this is currently unknown at this time, but will
be further discussed in Chapter 4.

60
Figure 32. The kinetics of protein solubility at 40°C and pH 2.
The result in Figure 32 was confirmed by the ultraviolet absorbance scan of diluted
supernatants from that figure. As discussed earlier, absorbance in the ultraviolet region is
caused by certain cyclic and aromatic amino acids, giving an approximate idea of the amount
of protein in solution. In Figure 33, the scans represent the difference between incubation
with and without Zyactinase. The highest absorbance peak occurred at 120 minutes, and by
180 minutes this had collapsed. The relative areas beneath the curves in Figure 33 are shown
in Figure 34. It shows that the maximum area or (most absorbance) occurred at 120 min,
which suggests that most proteinaceous matter was released due to Zyactinase at the
determined optimum conditions when the meat sample incubated for 2 hours.

61
Wavelength (nm)
200 210 220 230 240 250 260 270 280 290 300
Zyactinase-d
ependent absorb
ance
corr
ecte
d for
dilution
-200
0
200
400
600
800
0 min
60 min
120 min
180 min
Figure 33. Difference of protein absorbance for kinetics.
Figure 34. Total areas of Zyactinase-dependent absorbance curves corrected for
dilution between 200 and 300 nm at 40°C and pH 2.

62
3.6. Electrophoresis
SDS-PAGE electrophoresis was performed on the supernatant and precipitates obtained
from the optimum Zyactinase-dependent trial (40°C and pH 2) and a less-than-optimum trial
(pH 4) at the same temperature. In addition, a sample of the original minced beef was
analysed as well.
The SDS-PAGE profiles are shown in Figure 35. In the supernatant from pH 2 and
40°C (Tracks 2 and 7), several protein bands with molecule weights between 29 and 200 kDa
were observed including a very faint band of residual myosin heavy chain (200 kDa) (clearer
in Track 7 than 2), unknown bands around 90 kDa, 42 kDa and 30 kDa. Some supernatant –
perhaps cross-linked proteinaceous matter – did not enter the gel as can be seen at the top of
Tracks 2 and 7, and some low-molecular-weight peptides comigrated with the bromophenol
blue front. Proportions in different molecular weight ranges cannot be realistically
determined from these data.

63
Figure 35. SDS-PAGE electrophoresis. Column 1 is the molecule weight marker.
Column 2 and 7 are supernatants from pH 2 and 40°C, column 3 is
precipitate from optimum conditions. Column 4 and 5 is supernatant and
precipitate from pH 4 and 40°C, respectively. Column 6 is a sample of
minced beef. Bands were identified from Young and Davey (1981).
In the precipitate from the pH 2 treatment (Track 3), it was difficult to identify any native
protein, but inspection at high resolution revealed traces of myosin heavy chain and actin.
Again, some protein did not enter the gel even though the SDS/mercaptoethanol digests were
visually fully dissolved as observed at the time the stacking gel tracks were loaded. The
results suggest that most proteins in meat were hydrolysed into supernatant at pH 2 and 40°C.
However, it was previously established that only 30.2% of the protein was hydrolysed under
these conditions (Figure 18, page 42), so the protein that did not enter the gel may be very
important. The results obtained at pH 2 contrasts sharply with the results at pH 4,

64
particularly in the precipitate (Track 5). Very many protein bands, some very intense were
observed. Plainly these did enter the gel and importantly myosin heavy chain was lost,
probably but not necessarily, yielding a major band around 116 kDa. Actin, however,
appeared to be little degraded. Track 4 shows that little hydrolysis occurred. The marked
contrast between Tracks 3 and 5 will be further discussed in Chapter 4.

65
4. Chapter 4 Overall Discussion and Conclusions
4.1. Factors affecting denaturation of proteins
Before discussing the present results with Zyactinase and meat proteins, it is useful to
examine existing models of enzyme activity and protein denaturation. Temperature and pH
are the two major factors affecting denaturation of proteins. Denaturation greatly affects the
functional properties of proteins including enzyme activity. According to Mangino (2007) a
higher temperature generally results in an increase in enzyme activity. However, if the
temperature rises above a critical point, the heat will denature the enzyme, causing it to lose its
three-dimensional functional shape by breaking its hydrogen bonds. As these bonds are
broken, water can interact with and form new hydrogen bonds with the amide nitrogen and
carboxyl oxygen of the peptide bonds. The presence of water further weakens nearby
hydrogen bonds and subsequently unfolding occurs. Therefore, hydrophobic groups are
exposed to solvent which results in an irreversible denaturation of protein. This process also
applies to the substrate protein except that the issue of catalysis does not apply. At constant
pH, the solubility of most proteins from mesophilic organisms generally increases with
temperature between 0 and 40°C. Above 40°C, the increase in thermal kinetic energy causes
protein denaturation, exposure of non-polar groups, aggregation and precipitation, that is,
decreased solubility (Damodaran et al., 2008).
Many proteins in solution generally precipitate at their isoelectric points and have the
minimum solubility because the net charge is zero and thus charge repulsions of similar
molecules are at minimum. If the pH is far from the isoelectric point, the protein will only
contain similar positive or negative charges. The similar charges will repel each other and
prevent protein from aggregating. In areas of large charge density, the intramolecular
repulsion may be great enough to cause unfolding of protein and expose hydrophobic groups,
and consequently cause irreversible denaturation (Mangino, 2007). In other words, the
properties of proteins, such as enzymes activity as one of many possible examples, are pH
dependent. For instance, optimum pH helps enzyme maintain its intact conformation.

66
Temperature and pH both have coordinative and cooperative influence on the properties
of proteins such as solubility. However, solubility may be governed by other factors, e.g.
protein cross- linking. The presence of covalently crosslinked protein molecules will tend to
reduce the extent of protein denaturation. When proteins are cross- linked, it is more difficult
for them to unfold to expose hydrophobic groups to the aqueous solvent; even if the secondary
bonds are weakened, the crosslinks will tend to maintain the structure (Mangino, 2007).
Both temperature and pH affecting protein conformation can be applied to the present
situation of Zyactinase activity and meat proteins.
4.2. The effect of temperature and pH on Zyactinase and substrate proteins
As discussed in Chapter 3, the total protein solubilities tended to increase slightly with
temperature and peaked at 45°C whereas Zyactinase-dependent solubilities tended to decrease
with temperature, and this was particularly obvious at pH 2 and 3 (Figures 36 and 37). This
suggests that the total protein solubilities above 40°C relied more on heating than on
Zyactinase activity to maintain high yields. This is because the enzyme protein molecules
became denatured above 40°C and the effect of Zyactinase was decreasing. The thermal
energy breaks the hydrogen bonds holding the secondary and tertiary structure of enzyme
together, so the enzyme loses its shape and becomes a random coil. Thus the substrate can
no longer fit into the active site (John, 2010). From those results, it can be explained that
Zyactinase was most active around the physiological temperature (35 and 40°C). And the
enzyme activity lost remarkably after 40°C. However, the exact optimum temperature is
currently unknown.

67
Figure 36. Total protein solubilitys in presence of Zyactinase.
Figure 37. All the Zyactinase-dependent solubilities.
It is clear that the optimum pH for hydrolysis was 2 (Figures 36 and 37). On one hand,

68
it implies that Zyactinase worked best at pH 2, and that other pH values the hydrogen-bonding
status may be optimal, and certainly not so at pH 1 and probably at pH 8. On the other hand,
Zyactinase may not be maximally active at pH 2 whereas the conformation of the substrate
protein may be optimal for hydrolysis. A change in pH may not only affect the structure of
an enzyme, but also the structure or charge properties of the substrate, so that either the
substrate cannot bind to the active site or it cannot undergo catalysis.
4.3. The influence of conformation of Zyactinase and substrate proteins on digestion
products
As can be seen from Figures 26 and 27 (pages 51 and 52), the soluble digestion products
at pH 2 and 3 were similar when the incubation temperature was 35 and 40°C respectively.
This is because Zyactinase was most active between pH 2 and 3, which exerted the major
effect on the hydrolysis of meat protein. However, even in the same temperature, the soluble
digestion products obtained beyond the optimum pH changed with pH, as judged by the
ultraviolet absorbance profile. This result similarly suggests that pH values affected the
secondary and tertiary structure of Zyactinase and/or the substrate. Which is dominant
cannot be known from the present data.
When the incubation temperature was above 40°C, all the absorbances have shifted to
longer wavelength (Figures 28 and 29, pages 53 and 54). It implies that the soluble digestion
products obtained beyond the optimum temperature changed with increasing temperature.
As noted in previous sections of this chapter, high temperature caused Zyactinase protein
denaturation and thus the influence of enzyme on hydrolysis became less. Heating was
becoming dominant in the hydrolysis of meat protein when temperature was increased. As a
result, different hydrolysis outcomes were resulted from different conformations of substrate
protein at different temperatures. This can be seen more clearly by the comparison of
absorbances at optimum pH (Figure 38).

69
Figure 38. Wavelength scans of different temperature at pH 2.
4.4. The protein digestion in human gut and the implication of gel results
Protein digestion starts in the stomach which is an extreme acidic environment (pH 2 or 3)
but ideal for pepsin activity to digest proteins. Pepsin can begin the hydrolysis of any protein
in the diet, although the focus here is meat. Even collagen in the connective tissue
component of meat can be digested by pepsin at low pH even though other digestive enzyme
cannot easily attack it at higher pH values (Collins, 2000). The mechanism of pepsin attack
will probably depend on the loss of the triple helical structure that occurs when collagen is
acidified (Nelson & Cox, 2005). When lacking a low pH or sufficient pepsin, meat proteins
are poorly hydrolysed by other digestive enzymes that are secreted more distally in the
digestive tract and thus poorly digested. After leaving the stomach, protein has been broken
down to smaller peptide or amino acids. As soon as these partially broken-down products
enter the small intestine, they are attacked by pancreatic enzymes like trysin and chymotrysin.
These enzymes further break down the longer chain peptides to small peptides and individual
amino acids that can be absorbed in the small intestine.

70
The hydrolysis by Zyactinase is similar to the digestion by pepsin. Under acid
conditions Zyactinase activity on meat was high in experiments limited to 120 minutes.
From Figure 35 (page 62), the principle muscle proteins in meat including myosin, actin, and
tropomyosin were broken down to smaller soluble digestion products in supernatant at 40°C
and pH 2. The supernatant at pH 2 contained several bands that were probably hydrolysis
products, but amino acids and some peptides may be small enough to migrate with the
bromophenol blue (and were dissolved in the lower reservoir of the electrophoresis apparatus)
and/or were small enough that they were not fixed by the staining and destaining solutions.
Thus they might be present in the digest, but not visible on the gel. At the same time the ‘pH
2 precipitate’ did not generate an interpretable gel pattern and there is the possibility that the
precipitate became cross linked and could not enter the gel. At pH 4 the supernatant also
failed to generate a pattern, and the same peptide/amino acid argument might apply.
However, what was striking was the evidence for digestion of myosin in the ‘pH 4 precipitate’.
Actin and tropomyosin by contrast appeared to be unaffected. There is no simple model that
can explain the gel results and unfortunately these are limited. Moreover, the curious
behaviour of solubility at pH 2 when incubation time was extended to 180 minutes suggests
the situation is more complicated than first appears.
4.5. Conclusions
It is concluded that Zyactinase has a useful effect on preparation of protein hydrolysates
from low value meat that rich in connective tissue. Under the optimum conditions (enzyme
to substrate ratio of 1:50, temperature of 40°C, pH 2), the total protein solubility was increased
by 20.1% to 30.2% when meat protein was hydrolysed by Zyactinase for 2 hours. As a
result, , Zyactinase will help protein digestion in the human gut due to its acidic optimum pH,
and its optimum temperature which is close to physiological temperature. Also, low value
meat can be upgraded to edible and nutritious products for human consumption, and in this
way is likely to be useful in the prevention of sarcopenia.

71
4.6. Future work
Although the optimum temperature for the hydrolysis of meat protein by Zyactinase was
determined as 40°C, ambient temperature may be more commercially useful for industry
because no heating would be required. However, this possibility cannot be explored in this
study due to the time limit. Therefore, a further study is needed to focus on temperature,
particularly the range between ambient and 40°C. And gel electrophoresis should be applied
extensively in that study.
It is expected that this study will be commercialised to develop a dietary nutritional
supplement. Initially, the focus on this study was all about the effect of Zyactinase on protein
solubility to determine optimum temperature and pH. This part of work had been done by
Kjeldahl method. Apart from the throughput of the hydrolysis, the composition and
nutritional quality of digestion products as well as efficiency of the hydrolysis are also critical
to its commercialisation. Therefore, it is necessary to look much more closely at the gel
electrophoresis results to evaluate the best hydrolysates. Moreover, to further understand the
kinetics and hydrolysis at 180 minutes, gel electrophoresis experiment will also be important
because it will clearly show that whether the proteinaceous matter eventually precipitates.
Finally, although a theoretical- and experimental-approved result is achieved, it must be
practically proved as well. Therefore, clinical trials need to be carried out to investigate what
best conditions for a mixture to be fed to elderly people. This will involve in two aspects:
one is investigating the positive and negative influence of intake of supplementation; the other
is evaluating the palatability of the supplementation.

72
References
Adam, H. (2003). What is protein synthesis? Retrieved from
http://www.wisegeek.com/what-is-protein-synthesis.htm
Aminlari, M. Shekarforoush, S. S. Gherisari, H. R. Golestan, L. (2009). Effect of actinidin on
the protein solubility, water holding capacity, texture, electrophoretic pattern of beef,
and on the quality attributes of a sausage product. Journal of Food Science, 74 (3),
C221-6.
AOAC. (1995). Association of analytical chemists. Official methods of analysis. (16 ed.).
Washington, D. C.: AOAC, 678 p.
Baker, E. N. (1980). Structure of actinidin, after refinement at 1.7 Å resolution. Academic
Press Inc, 240441-44.
Belitz, H. D. & Grosch, W. (1999). Food Chemistry, (2nd ed.), New York: Springer.
Bloomfield, A. L. & Keefer, C. S. (1928). Gastric motility and the volume of gastric secretion
in man. J. Clin. Invest. 5(2), 295-301.
Bohak, Z. (1969). Purification and characterization of chicken pepsinogen and chicken pepsin.
The Journal of Biological Chemistry, 244 (17).
Bugg, T. (2004). Introduction to enzyme and coenzyme chemistry, (2nd ed.), Blackwell
Publishing.
Buxbaum, E. (2007). Fundamentals of protein structure and function, New York: Springer.
Clark, J. (2004). The structure of proteins. Retrieved from:
http://www.chemguide.co.uk/organicprops/aminoacids/proteinstruct.html
Collins, A. (2000). Digestion of protein. Retrieved from
http://www.annecollins.com/digestive-system/digestion-of-protein.htm
Damodaran, S. Parkin, K. Fennema, R. O. (2008). Fennema’s food chemistry. (4 ed). CRC
Press.
Diwan, J. J. (1998). Molecular Biochemistry II: protein degradation. Retrieved from:
http://www.rpi.edu/dept/bcbp/molbiochem/MBWeb/mb2/part1/protease.htm
Donaldson, B. W. (2001). Improvement in and relating to digestive/laxative compositions. PCT
Patent Number: PCT/NZ2001/000044.
Donaldson, B. W. & Lang, D. (2007). Animal medicament and method of manufacture. PCT
Patent Number: PCT/NZ2006/000220.
Donaldson, B. W. & Lang, D. (2007). Enzymatic recovery of protein. PCT patent number:
PCT/NZ2007/000015.
Donaldson, B. W. (2008). Thesis of Master of Philosophy. The influence of protein digestion
and absorption on age-related loss of skeletal muscle mass.
Douglas, P. J. Melinda, S. M. Christos, S. K. Xiao-Jun Zhang. Robert, R. W. (2006).
Differential stimulation of muscle protein synthesis in elderly humans following
isocaloric ingestion of amino acids or whey protein. Experimental Gerontology, 41(2),
215-219.
Drenth, J. Jansonius, J. N. KoeKoek, R. Wolthers, B. G. (1971). Advan. Protein Chemistry. 25,
79-115.
Du, W. (2001). Meat pH and pork quality. Retrieved from
http://www.omafra.gov.on.ca/english/livestock/swine/facts/info_qs_meatph.htm

73
Elisabet, B. Quynh-Uyen, T. B. Sandrine, T. Hisamine, K. Arny, A. F. Robert, R. W. (2008).
Effect of amino acid supplementation on muscle mass, strength and physical function in
elderly. Clinical Nutrition, 27(2), 189-195.
Elton, D. A. John, C. F. David, E. G. Edward, W. M. (2001). Principles of meat science. (4 ed.),
chapter 5, 83-99. Kendall Hunt Pub Co.
Fleg, J. L. & Lakatta, E. G. (1988). Role of muscle loss in the age-associated reduction in VO2
max. Journal of Applied Physiology, 65, 1147-1151.
Gidal, B. E. (2006). Drug absorption in the elderly: Biopharmaceutical consideration for the
antiepileptic drugs. Epilepsy in the Elderly: new Directions Epilepsy Research, 68 (1),
65-69.
Glazer, A. M. & Smith, E. L. (1971). Papain and other sulfhydryl proteolytic enzymes. In
enzymes, (3 ed.). 3, 501.
Glicksman, H. (2004). Muscle cells and how they contract. Retrieved from:
http://www.arn.org/docs/glicksman/eyw_040901.htm
Greaser, M. L. & Pearson, A. M. (1999). Flesh foods and their analogues. In: A. J. Rosenthal
Food Texture: Perception and Measurement, 228-258.
Greenlund, L. J. S. & Nair, K. S. (2003). Sarcopenia-consequences, mechanisms, and potential
therapies. Mechanisms of Ageing and Development, 124(3), 287-299.
Gro, H. B. (1999). Men, Ageing and Health. World Health Organization.
Haworth, I. S. (2004). Protein solubility. Retrieved from
http://www.chemistryexplained.com/Pr-Ro/Protein-Solubility.html
Hedrick, H. B. (1994). Principles of meat science. Kendall/Hall.
Holme, T. A. (2005). Fibrous protein. Retrieved from
http://www.encyclopedia.com/doc/1G2-3400900192.html
Holmes, M. A. & Matthews, B. W. (1982). Structure of thermolysin refined at 1.6 Å
resolution. Institute of molecular biology and department of physics, University of
Oregon, Eugene, USA.
Iranmanesh, A. Lizarralde, G. Veldhuis, J. D. (1991). Age and relative adiposity are specific
negative determinants of the frequency and amplitude of growth hormone secretory
bursts and the half- life of endogenous GH in healthy men. J Clin Endocrinol Metab, 73,
1081-1088.
Jakubowski, H. (2010). Biochemistry online: an approach based on chemical logic. Retrieved
from
http://employees.csbsju.edu/hjakubowski/classes/ch331/catalysis/olcatenzmech.html
John, C. (2010). CCEA AS Biology: Unit 1: Molecules and Cells. Philips Allan.
Laemmli, U. K. (1970). Cleavage of structural proteins during the assembly of the head of
bacteriophage T4. Nature 227:685-9.
Lawrie, R. A. & Ledward, D. A. (2006). Lawrie’s meat science. (7 ed.). Woodhead Publishing
Limited.
Leo, J. S. Robert, G. Sheldon, W. (1952). The absorption spectra of amino acids in the region
200 to 230 millimicrons. The Journal of Biological chemistry. 197 (1). 285-191.
Lewis, D. A. & Luh, B. S. (1988). Application of actinidin from kiwifruit to meat
tenderization and characterization of beef muscle protein hydrolysates. Journal of Food
Biochemistry. 12. 147-158.

74
Lubke, K. Schroder, E. Kloss, G. (1975). Chemistry and biochemistry of amino acids, peptide
and protein. Georg Thieme verlag: Stuttgart.
Madison, N. (2009). What is collagen? Retrieved from
http://www.wisegeek.com/what-is-collagen.htm
Mangino, M. (2007). Protein denaturation. Lecture of Food Science. Retrieved from
http://class.fst.ohio-state.edu/FST822/lecturesab/Denat.htm
Mathews, C. K. Van Holde, K. E. Ahern, K. G. (1999). Biochemistry. Benjamin Cummings.
Michel, L. Jacques, F. Michel, P. Michelle, S. Roger, P. (1995). Protein recovery from veal
bones by enzymatic hydrolysis. Journal of Food Science, 60(5), 949-952.
Michele, Iannuzzi-Sucich. Karen, M. P. Anne, M. K. (2002). Prevalence of Sarcopenia and
Predictors of Skeletal Muscle Mass in Healthy, Older Men and Women. Journal of
Gerontology: Medical Sciences, 57A, 12, 772-777.
NCBI. (2007). National centre for biotechnology information. NIH curriculum supplement
series. Retrieved from:
http://www.ncbi.nlm.nih.gov/bookshelf/br.fcgi?book=curriculum&part=A757#muscul
oskeletal_references.rl1
Neil, A. C. Jane, B. R. Lawrence, G. M. (1999). Biology. (5 ed.). Benjamin-Cumming Pub Co.
Nelson, D. L. & Cox, M. M. (2005). Lehninger principles of biochemistry. (4 ed.). New York:
W. H. Freeman and company.
NHGRI. (2010). National Human Genome Research Institute. Retrieved from:
http://commons.wikimedia.org/wiki/File:Protein-structure.png
Nielsen, S. S. (1998). Food Analysis. (2 ed.). Gaithersburg, Md.: Aspen Publishers.
Nishiyama, I. (2001). pH-Dependent proteolytic effect of actinidin on myofibrillar proteins.
Journal of Home Economics of Japan, 52(11), 1083-1089.
O’Meara, G. M. & Munro, P. A. (1983). Effects of reaction variables on the hydrolysis of lean
beef tissue by alcalase. Meat Science, 11(3), 227-238.
O’Meara, G. M. & Munro, P. A. (1984). Selection of a proteolytic enzyme to solubilize lean
beef tissue. Enzyme and Microbial Technology, 6(4), 181-185.
Ophardt, C. E. (2003). Denaturation of Protein. Virtual chembook. Elmhurst college.
Retrieved from: http://www.elmhurst.edu/~chm/vchembook/568denaturation.html
Russell, T. L., Berardi, R. R., Barnett, J. L., Dermentzoglou, L. C., Jarvenpaa, K. M., Schmaltz,
S., (1993). Upper gastrointestinal pH in seventy-nine healthy, elderly, North American
men and women. Journal Pharmaceutical Research, 10 (2), 187-196.
Schrager, M. Bandinelli, S. Maggi, S. Ferrucci, L. (2003). Sarcopenia: twenty open questions
for a research agenda. Basic Appl Myol, 13 (4), 203-208.
Szulc, P. Duboeuf, F. Marchand, F. Delmas, P. D. (2004). Hormonal and lifestyle determinants
of appendicular skeletal muscle mass in men: The MINOS study. American Journal of
Clinical Nutrition, 80, 496-503
Tamarkin, D. A. (2006). Myofibril composition. STCC Foundation Press. Retrieved from
http://faculty.stcc.edu/AandP/AP/AP1pages/Units5to9/Unit7/myofibri.htm
Terry, E. J. Katherine, W. S. Julia, G. K. Kylie, R. K. Tara, L. M. Wayne, B. S. (2009).
Sarcopenia – Mechanisms and Treatments. Journal of Geriatric Physical Therapy, 32 (2),
32-45.

75
Thomas, D. R. (2007). Loss of skeletal muscle mass in ageing: Examining the relationship of
starvation, sarcopenia and cachexia. Clinical Nutrition, 26 (4), 389-399.
Train, R. (2008). Sarcopenia: as we age muscle loss occurs. Retrieved from
http://content.momsnetwork.com/artman/publish/sarcopenia-muscle-loss-occurs-age.sh
tml
Tzankoff, S. P. & Norris, A. H. (1977). Effect of muscle mass decrease on age-related BMR
changes. Journal of Applied Physiology: respiratory, environmental and exercise
physiology, 43, 1001-1006.
Webster, J. D. Ledward, D. A. Lawrie, R. A. (1982). Protein hydrolysates from meat industry
by-products. Meat Science, 7(2), 147-157.
Whitaker, J. R. Voragen, A. G. J. Wong, D. W. S. (2003). Handbook of food enzymology,
Marcel Dekker INC.
Whitaker, J. (2005). Sarcopenia. Retrieved from
http://www.alive.com/3004a6a2.php?subject_bread_cramb=111
Worthington, A. (2003). Mutant rat trypsin. Retrieved from
http://biology.kenyon.edu/BMB/Chime2/2002/Trypsin/FRAMES/index.htm
Young, O. A. & Davey, C. L. (1981). Electrophoretic analysis of proteins from single bovine
muscle fibres. Biochemistry Journal. 195, 317-327.