the oil & gas upstream cycle: development and productionthe oil & gas upstream cycle:...
TRANSCRIPT

Varenna, July 23rd 2019
The Oil & Gas Upstream Cycle: Development and Production
Piero Balossino – G&G Petrophysics Coordinator

2
Development
Oil & Gas Activity: Upstream
BASIN EVALUATION Regional Studies in order to identify areas with
Hydrocarbon potential
EXPLORATION Licenses Acquisition, Geological Studies, Seismic
Acquisition & Drilling
DEVELOPMENT Development Plan and Drilling
Facilities and Infrastructure Construction
PRODUCTION Reservoir Management, Work-Over,
Abandonment

3
Development
Oil & Gas Activity: Development Phase
BASIN EVALUATION Regional Studies in order to identify areas with
Hydrocarbon potential
EXPLORATION Licenses Acquisition, Geological Studies, Seismic
Acquisition & Drilling
DEVELOPMENT Development Plan and Drilling
Facilities and Infrastructure Construction
PRODUCTION Reservoir Management, Work-Over,
Abandonment

Oil & Gas Activity: Development Phase
The purpose of the development process is to configure, design and implement projects for producing oil resources from new discoveries or from existing assets in line with business objectives and company strategies
The development process is a fundamental component of the company’s strategy. Therefore technological solutions and managerial best practices updated to the best industry levels must be adopted and innovative solutions utilized in order to improve project performance in terms of safety, environmental protection, profitability, financial exposure and reduction of risk factors.

Oil & Gas Activity: Development Phase
Each Development Project is structured and governed according to guidelines defined by the Company. All the projects are based on a phase gate approach and consist of five distinct phases. Each phase has a set of clear objectives that, once achieved, allow the project to proceed through a gate into the next phase.
The first three phases focus on the value identification to ensure the selection of the «right project» which will maximise the asset value. The last two phases focus on the value realisation where the defined actions must be executed efficiently. As the project is already defined only minor improvements to its value can be achieved. In this process the Concept Selection phase, where the optimum development configuration is selected and outlined, plays a critical role to drive the following phases.

Development Project: the Concept Selection phase
Reservoir Evaluation
Drilling and Completion Study
Engineering Study
HSE Studies
Logistic Study
The objective of the Concept Selection phase is the identification of the optimal development concept, i.e. the technically feasible asset development solution that maximises the project value in terms of the best comprimise among maximum economic results and minimum associated risk Different disciplines are involved to develop a set of studies to ensure that asset development and project execution will be done at the best reducing uncertainties.
The Reservoir Characterization study is a fundamental activity in the Concept Selection phase.

Simulation Model
History match & forecast
7
Concept Selection phase studies: the Reservoir 3D Model
The Reservoir Characterization study is a multi-step construction of a model of a petroleum reservoir made with a computer, with the purpose of : - improving the estimation of oil in
place and reserves - predicting future production - evaluating alternative reservoir
management scenarios.
A model can be subdivided into a Geological or Static Model and a Dynamic Simulation Model
Structural modelling & grid design
Stratigraphic modelling
Facies modelling
Petrophysical modelling

The Structural Modelling is the process of defining the geometrical and structural properties of the reservoir.
The Reservoir 3D Static Model: structural modelling
The Bulk Volume of the reservoir is represented through a grid, regular or irregular, made up by 3D cells whose size is defined in order to preserve the reservoir heterogeneity observed on seismic and shown by the collected well data.

The creation of a Stratigraphic framework is the most traditional among reservoir geologists’ tasks.
The Reservoir 3D Static Model: stratigraphic modelling
Well 3
Well 4
It is based on a well to well correlation in order to define the surfaces that bound the main reservoir units. Correlations are based on the sedimentological model and on sequence stratigraphy concepts.
A correct description of the geometry of the sedimentary bodies is an essential requisite for the simulation of the production performance of a field as fluid flow takes place largely along the stratigraphic units

The Facies Modelling is the process of assigning to each cell of the model a lithological information on the basis of the defined environment of deposition. This step is not mandatory. In simple studies facies classification may reduce to the definition of reservoir and non reservoir rocks (i.e. of rocks that may or may not contain hydrocarbons).
The Reservoir 3D Static Model: lithological or facies modelling
In highly heterogeneous reservoirs the lithological model is built integrating the sedimentological model, a facies classification and a probabilistic approach. Facies can be considered as the basic building blocks of a geological model since geocellular 3D modelling and stochastic
simulation became available.

11
The petrophysical characterization of a reservoir is a quantitative interpretation of well logs and core to determine its main petrophysical properties (porosity, water saturation and permeability)
The Reservoir 3D Static Model: petrophysical modelling
Properties are distributed in the 3D model according to facies classification by assigning a value of each property to the baricenter of each cell
The petrophysical properties control the quantity and the initial distribution of fluids (hydrocarbons in place = reservoir storage capacity) and have an impact on their movement (recoverable reserves = deliverability). They describe the reservoir quality.

Data collected in a well to get information about rocks and fluids
12
Geophysical logs
Cuttings
Cores
Well seismic
Production tests
Fluid
samples
Bagart 1
2100.00
2200.00
2300.00
2400.00
2500.00
2600.00
2700.00
2800.00
2900.00
3000.00
3100.00
3200.00
0.00 10.00 20.00 30.00 40.00 50.00 60.00 70.00 80.00 90.00 100.00
C1/SC
De
pth
mR
T
2100.00
2200.00
2300.00
2400.00
2500.00
2600.00
2700.00
2800.00
2900.00
3000.00
3100.00
3200.00
0 1000 2000 3000 4000 5000 6000 7000 8000 9000 10000
TG & C1 ppm
%C1 C1 ppm
Liner 7 5/8" @ 2153 mRT TOP SILURIAN 2115 mRT
C1/SC 74%
C1/SC
53-55%
CORE 1 2930-2948
CORE 2 2948-2984
MARKER "A" 2308 mRT
top Wenlock 2898 mRT
CORE 3 2984-3014
top Ordoviocian
lev. Alum
C1/SC 72%
top Cambrian
GWD Pressure
measurements WFT
13
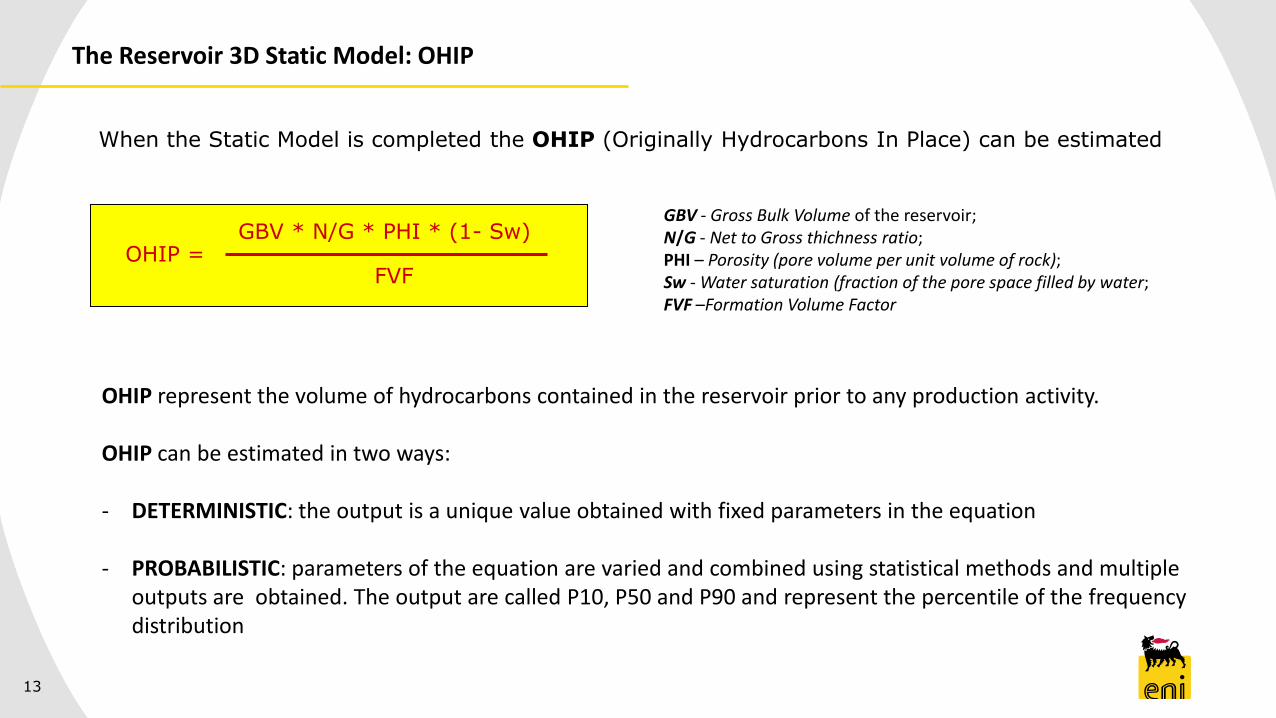
When the Static Model is completed the OHIP (Originally Hydrocarbons In Place) can be estimated
The Reservoir 3D Static Model: OHIP
GBV * N/G * PHI * (1- Sw) OHIP = --------------------------------- FVF
OHIP represent the volume of hydrocarbons contained in the reservoir prior to any production activity. OHIP can be estimated in two ways: - DETERMINISTIC: the output is a unique value obtained with fixed parameters in the equation - PROBABILISTIC: parameters of the equation are varied and combined using statistical methods and multiple
outputs are obtained. The output are called P10, P50 and P90 and represent the percentile of the frequency distribution
GBV - Gross Bulk Volume of the reservoir; N/G - Net to Gross thichness ratio; PHI – Porosity (pore volume per unit volume of rock); Sw - Water saturation (fraction of the pore space filled by water; FVF –Formation Volume Factor

14
The Reservoir Dynamic Simulation
Main target of the reservoir simulation activity is the construction of a numerical model suitable to identify the best actions for maximizing the asset value and supporting relevant decision making processes. The simulation model supports: - the definition, evaluation and selection of the best development scenario - the identification of the most appropriate production optimization interventions - the calculation of the production profiles that will be the basis for the estimation of the relevant recoverable reserves.

Management of the uncertainty: model continuous updating
15
The management of uncertainty and risk is one of the most important issues in the oil and gas industry.
At the beginning of the development phase data available are few and the uncertainty in the model outputs is high. At this time is a common practice to evaluate multiple alternative scenarios for reservoir development and management
As soon as new data are available the model must be updated, new volumetrics and profiles computed and the impact of the new results on the project evaluated.
This can be achieved in a fast and effective way only through the integration of the different disciplines
Stratigraphy, logs & cores
Volumetrics
Seismic interpretation & mapping updates
Prod. profiles
3D framework & property characterization
Well design
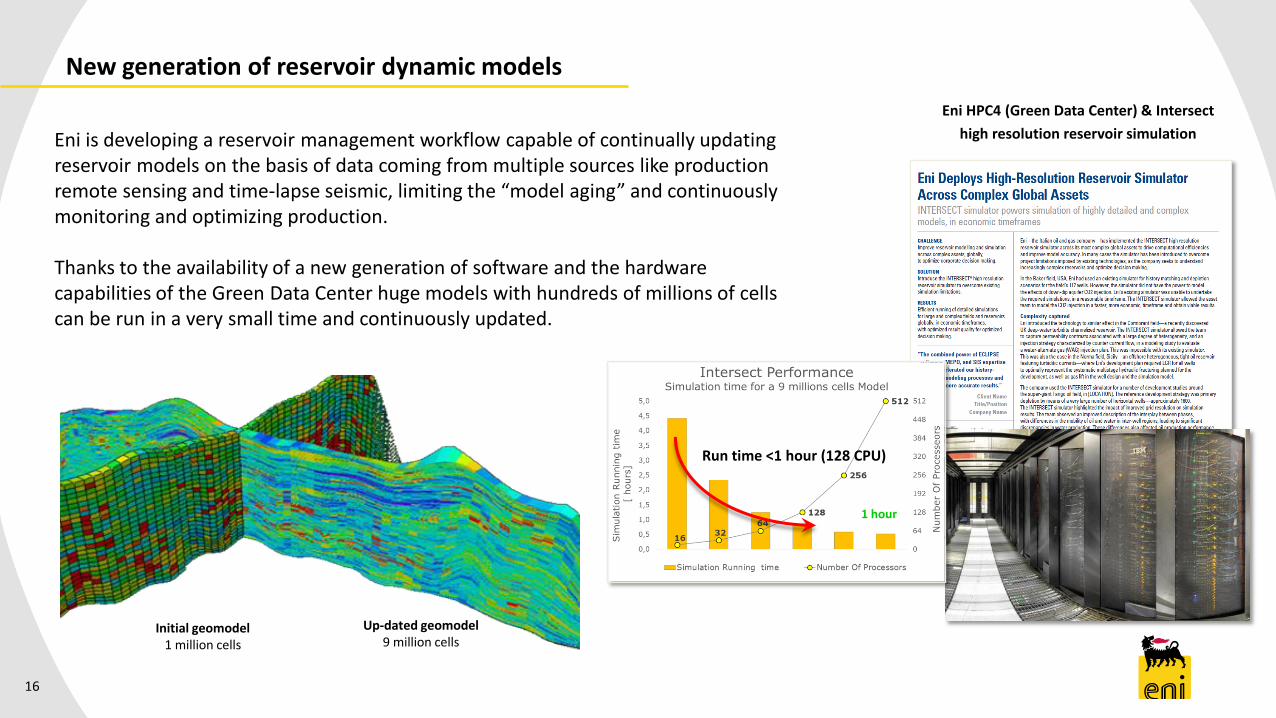
New generation of reservoir dynamic models
16
Eni HPC4 (Green Data Center) & Intersect
high resolution reservoir simulation
eni HPC2 Cluster
Up-dated geomodel 9 million cells
Initial geomodel 1 million cells
Run time <1 hour (128 CPU)
1 hour
Eni is developing a reservoir management workflow capable of continually updating reservoir models on the basis of data coming from multiple sources like production remote sensing and time-lapse seismic, limiting the “model aging” and continuously monitoring and optimizing production. Thanks to the availability of a new generation of software and the hardware capabilities of the Green Data Center huge models with hundreds of millions of cells can be run in a very small time and continuously updated.
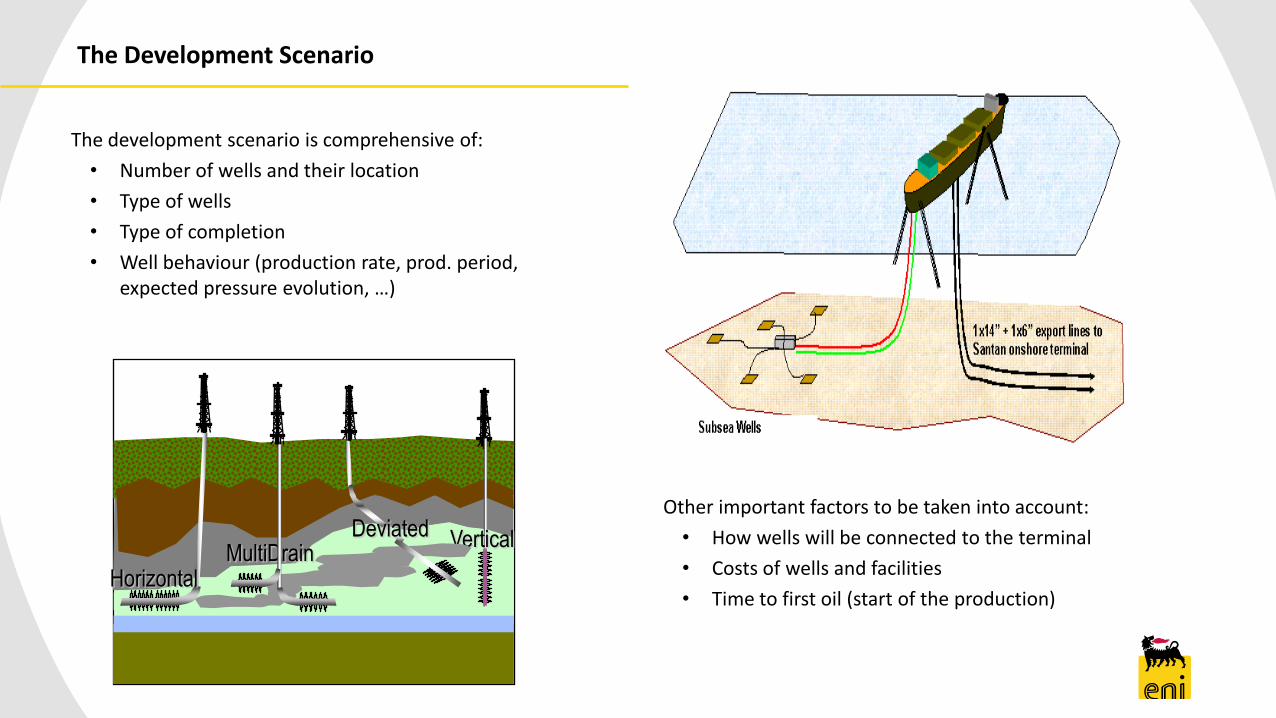
The Development Scenario
The development scenario is comprehensive of:
• Number of wells and their location
• Type of wells
• Type of completion
• Well behaviour (production rate, prod. period, expected pressure evolution, …)
Vertical
Horizontal MultiDrain
Deviated Other important factors to be taken into account:
• How wells will be connected to the terminal
• Costs of wells and facilities
• Time to first oil (start of the production)

Cost of a Well
Daily Rate: 1200 K€
The costs for an offshore well average nearly 10-25 M€
Today, a typical land-based oil or gas well costs about 2-5 M€
19
Costs of a E&P project
Exploration is the cheapest phase of oil industry
Nevertheless exploration budget of a major is comparable to economic balance of a small country.
Exploration activity including a regional study, a 3D seismic survey over 1000 km2, drilling a 3000 m deep well in offshore may need investments of 60-130 M€
A further Exploration-Appraisal campaign (5 years, 2 wells): 100-200 M€
Development project investments usually ranges between many tens and thousands millions of euro.
The investments of small projects (onshore, 1-2 wells to drill, already existing facilities,…) are around 50-100 M€, while complex big projects (offshore/deep offshore, several platforms, tens of wells, new production facilities, …) can have investments of 1-20 B€

20
Development
Oil & Gas Activity: Production Phase
BASIN EVALUATION Regional Studies in order to identify areas with
Hydrocarbon potential
EXPLORATION Licenses Acquisition, Geological Studies, Seismic
Acquisition & Drilling
DEVELOPMENT Development Plan and Drilling
Facilities and Infrastructure Construction
PRODUCTION Reservoir Management, Work-Over,
Abandonment

Oil & Gas Activity: Production Phase
Production in the oil and gas industry is the phase during which hydrocarbons are extracted from an oil or gas field through a set of available wells, connected to a pipeline system (production network) treated and sent to market through pipelines or by ship Production in an oil field can last several years (up to 40), depending on the size of field and how expensive it is to keep the wells and production facilities running.
During that time the field is continuously monitored through a “Reservoir Management and Production Optimization” activity, whose objectives are: - To update and validate the reservoir dynamic model (history
match) and the reservoir management strategy (workover, new production facilities)
- To identify wells/facilities revamping requirements - To define and assess the technical and economical feasibility
of well interventions (change of producing level or of type of completion, matrix stimulation operations)

It is physically impossible to recover and produce all of the oil in the ground.
Reserves are the amount of HC discovered in a field that can be economically produced with the available technology and the defined development scenario.
The ratio of reserves to the total amount of oil in a particular reservoir is called the recovery factor.
RECOVERY FACTOR = RESERVES/OHIP
The recovery factor is amongst the most important parameters that characterize oil and gas reservoirs and it influences many decisions that lead to successful field development plan.
Reserves and Recovery Factor
Over time, technology improved a lot in many countries but with field complexity also increasing, the result is that overall RF has often changed very little.
As an example in 2017 the expected recovery factor for the fields located in the Continental Shelf of UK was 43% almost the same as that estimated in 2004 (42%)

23
World Oil & Gas Reserves
Source: eni_World Oil & Gas Review 2018

24
Oil & Gas Reserves Leaders
Source: eni_World Oil & Gas Review 2018
The world Top Ten
Oil Reserves Holders The world Top Ten
Gas Reserves Holders
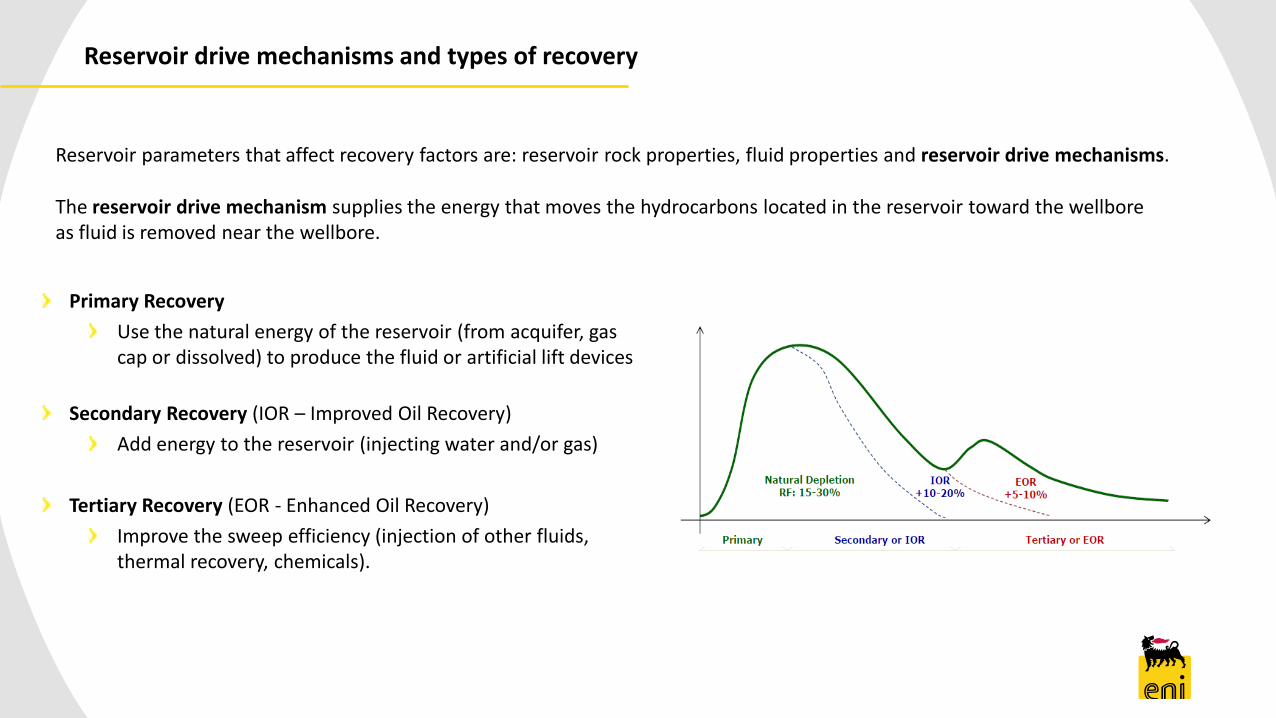
Reservoir drive mechanisms and types of recovery
Reservoir parameters that affect recovery factors are: reservoir rock properties, fluid properties and reservoir drive mechanisms.
The reservoir drive mechanism supplies the energy that moves the hydrocarbons located in the reservoir toward the wellbore as fluid is removed near the wellbore.
Primary Recovery
Use the natural energy of the reservoir (from acquifer, gas cap or dissolved) to produce the fluid or artificial lift devices
Secondary Recovery (IOR – Improved Oil Recovery)
Add energy to the reservoir (injecting water and/or gas)
Tertiary Recovery (EOR - Enhanced Oil Recovery)
Improve the sweep efficiency (injection of other fluids, thermal recovery, chemicals).

0
2500
5000
7500
10000
12500
15000
0.1 1 10 100 1000 10000 100000
Oil viscosity (cp)
Re
se
rvo
ir D
ep
th (
ft)
Steam injectionChemical
Injection
Immiscible
Gas Injection
Miscible
Gas Injection
N2 Miscible
Injection
• EOR methods entail changing the actual
properties of the hydrocarbons
• EOR techniques are used after primary and
secondary recovery or at the initial stage of
production
• There are three main types of EOR, including
thermal recovery, chemical flooding and gas
injection.
Tertiary Recovery: EOR - Enhanced Oil Recovery Techniques
A way to further increase oil production is through the tertiary recovery method or EOR. Although more expensive to employ on a field, EOR can increase production from a well to up to 75% recovery.

Tertiary Recovery: EOR - Enhanced Oil Recovery Techniques
Thermal recovery introduces heat to the reservoir to reduce the viscosity of the oil. First applied in Venezuela in the 1960s
Chemical injection EOR helps to free trapped oil within the reservoir. This method introduces long-chained molecules called polymers into the reservoir to increase the efficiency of waterflooding
Gas injection used as a tertiary method of recovery involves injecting natural gas, nitrogen or carbon dioxide into the reservoir. Carbon dioxide EOR (CO2-EOR) is the method that is gaining the most popularity. While initial CO2-EOR developments used naturally occurring carbon dioxide deposits, technologies have been developed to inject CO2 created by industrial processes

28
CO2 EOR Contributing Mechanisms
Carbon Dioxide is the fluid most commonly used for miscible displacement because:

Field
Discovery
Appraisal
Campaign
Abandonment
Main Phases of Field Exploitation Project Costs & Net Cash Flow
NET
PRESENT
VALUE Development
Further Development
ABANDONMENT
COSTS
ROYALTIES
OPEX CAPEX
MAX FINANCIAL EXPOSURE
PAY OUT TIME
TIME
Production
Pro
d. S
tart
-up
Time to market

30
World Oil & Gas Production
Source: eni_World Oil & Gas Review 2018

31
Oil & Gas Production Leaders
Source: eni_World Oil & Gas Review 2018
The world Top Ten
Oil Producers
The world Top Ten
Gas Producers

32
Decarbonisation and Carbon neutrality
Carbon neutrality, or having a net zero carbon footprint, refers to achieving net zero carbon dioxide emissions. This can be achieved in two ways: - by balancing carbon emissions with carbon removal - eliminating carbon emissions altogether (the transition to a "post-carbon economy").
As the world is moving towards a carbon-neutral future, global fossil fuel demand continues to grow. This challenges the oil & gas industry to meet the increased need for energy while simultaneously reducing overall emissions.
Decarbonisation is the process of reducing the carbon-hydrogen ratio in the energy sources. When referred to the global engagements against climate changes it means all the policies that are/will be implemented to reduce the use of fossil fuels especially those with high carbon dioxide emissions.
Carbon neutrality is used in the context of carbon dioxide-releasing associated with transportation, energy production and industrial processes.

33
The OGCI – Oil and Gas Initiative
Eni is a member of the OGCI (Oil and Gas Climate Initiative) a CEO-led initiative made up of thirteen oil and gas companies (producing about 30% of global oil and gas) that collaborate on actions to reduce greenhouse gas emissions from the oil and gas industry’s operations, while still meeting the world’s energy needs.
OGCI investments are focused on three objectives:

34
Carbon Capture and Storage (CCS)
Carbon capture and storage (CCS) prevents carbon dioxide (CO2) from being released into the atmosphere. The technology involves capturing CO2 produced by large industrial plants, compressing it for transportation and then injecting it deep into a rock formation at a carefully selected and safe site, where it is permanently stored.
The Global CCS Institute is the world’s
leading authority on carbon capture
and storage (CCS) – an international
climate change organisation whose
mission is to accelerate the
deployment of CCS as an imperative
technology in tackling climate change
and providing energy security.
35
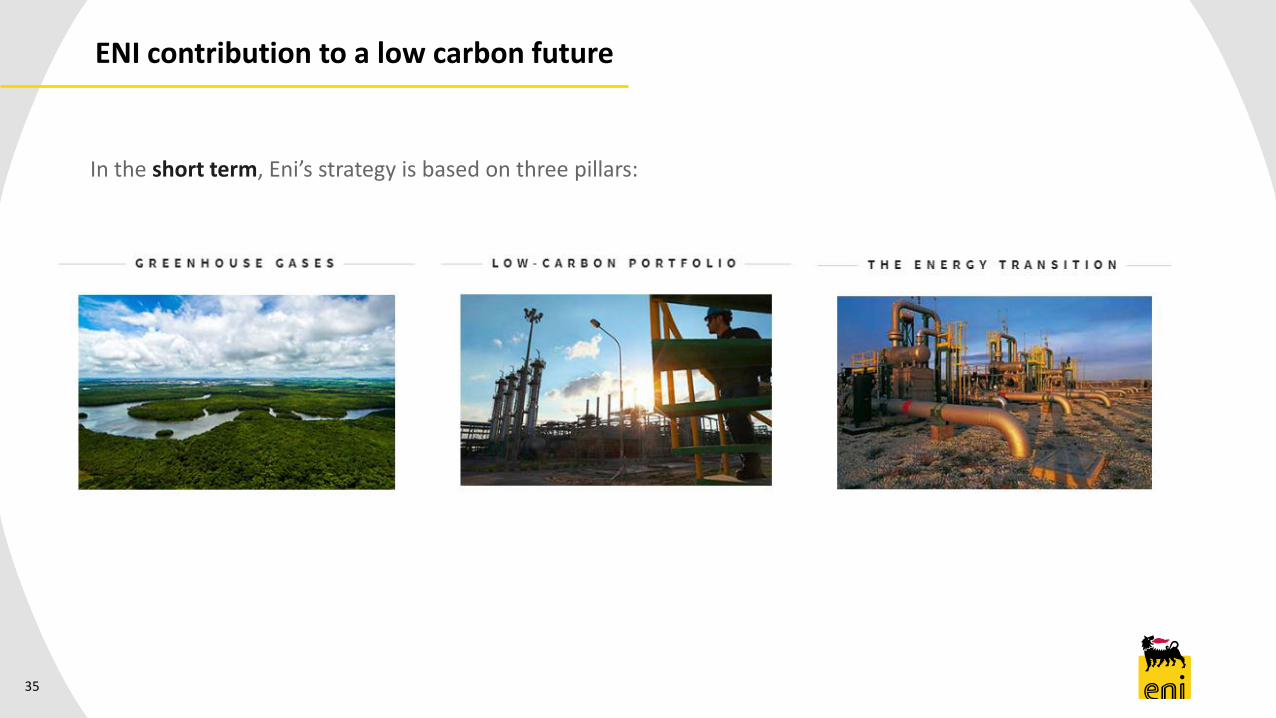
ENI contribution to a low carbon future
In the short term, Eni’s strategy is based on three pillars:

36
ENI contribution to a low carbon future
In the short term, Eni’s strategy is based on:
1. Energy efficiency and direct GHG emissions reduction of operated activities with the aim of reducing upstream emission intensity by 43% compared to 2014 by 2025. This objective will contribute to the target of improving the carbon efficiency index by 2% a year by 2021 compared to 2014, that will be pursued by all Eni business units;

37
ENI contribution to a low carbon future
In the short term, Eni’s strategy is based on:
2. Low carbon and resilient Oil & Gas portfolio: Eni’s hydrocarbon portfolio has a high incidence of natural gas (>50%), a bridge solution to a low-emission future. The main upstream projects underway have an average portfolio break-even at a Brent price of around $25/barrel and are therefore resilient even in low-carbon scenarios

38
ENI contribution to a low carbon future
In the short term, Eni’s strategy is based on:
3. Development of renewable sources and green business with a circular approach: the promotion of renewables aims to reach an installed electrical power of over 1.6 GW by 2022. With regard to green business, the start-up of the Gela biorefinery by 2019 and the completion of the second phase at Venice biorefinery by 2021 are expected.

39
Moving towards a low carbon future

40
«Il futuro è di chi
lo sa immaginare!»
Enrico Mattei
THANK YOU …