the new service economy. development of the u.s. service sector
Post on 20-Dec-2015
215 views
TRANSCRIPT
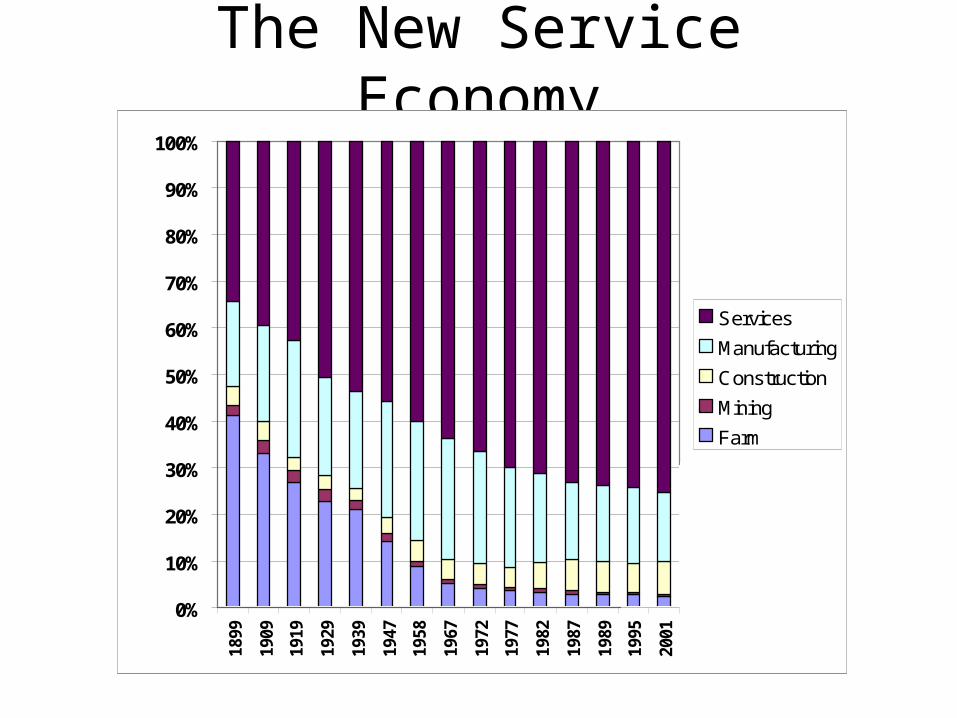
The New Service Economy
0%
10%
20%
30%
40%
50%
60%
70%
80%
90%
100%
1899
1909
1919
1929
1939
1947
1958
1967
1972
1977
1982
1987
1989
1995
2001
Services
Manufacturing
Construction
Mining
Farm
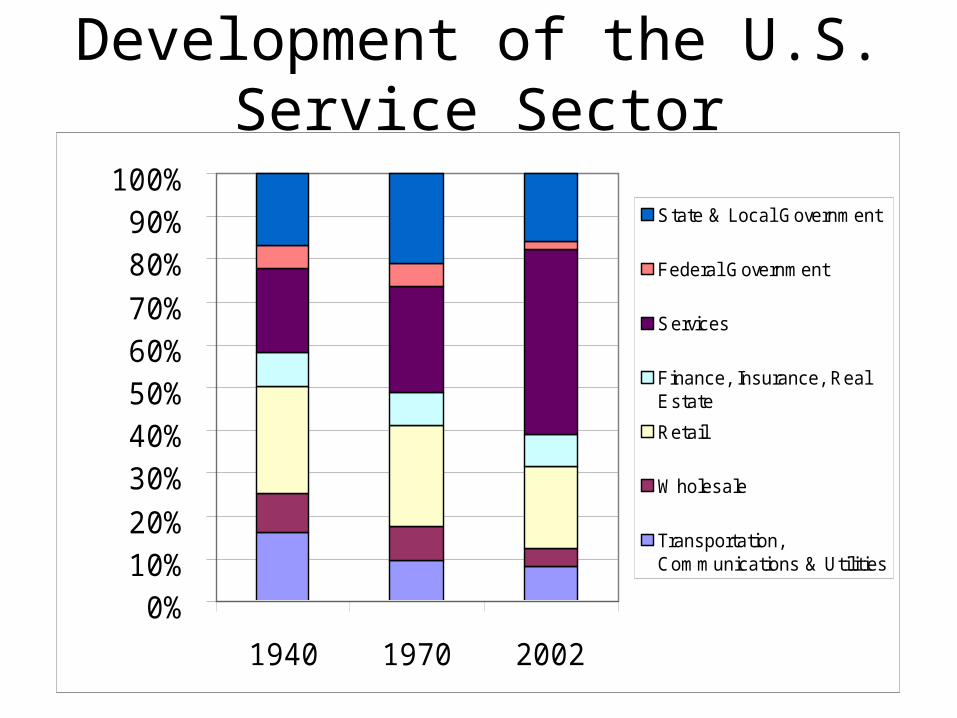
Development of the U.S. Service Sector
0%10%20%
30%40%50%60%70%
80%90%
100%
1940 1970 2002
State & Local Government
Federal Government
Services
Finance, Insurance, RealEstate
Retail
W holesale
Transportation,Communications & Utilities

Decomposition of Services
0%
10%
20%
30%
40%
50%
60%
70%
80%
90%
100%
1940 1970 2002
Consumer Services
Health Services
Producer Services

Producer ServicesWhy the rapid growth?
(1) Growth in intermediate demands
(2) Growth in final demands
(3) Slow productivity improvement (?historic?)
(4) Trade in Services & Import Substitution
An An overview of some key trends, largely drawn from Beyers research.

The Growing Investment In IT
Source:Digital Economy 2003

The Increase in Productivity Growth
Source:DigitalEconomy 2003
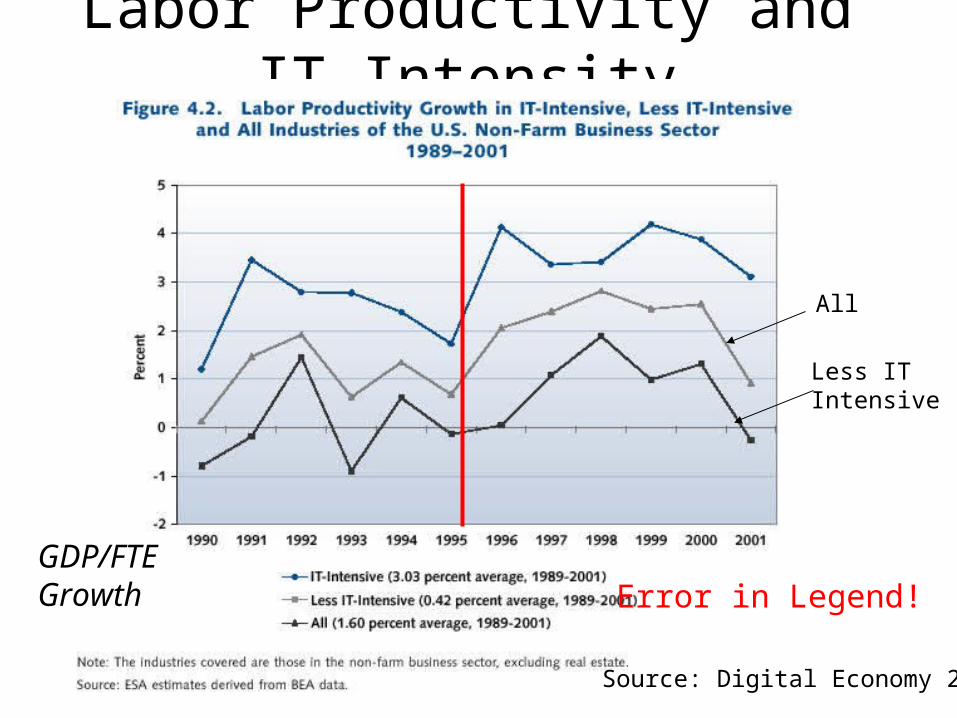
Labor Productivity and IT Intensity
Source: Digital Economy 2003
Error in Legend!
All
Less ITIntensive
GDP/FTEGrowth

Labor Productivity Growth
Source: DigitalEconomy 2003
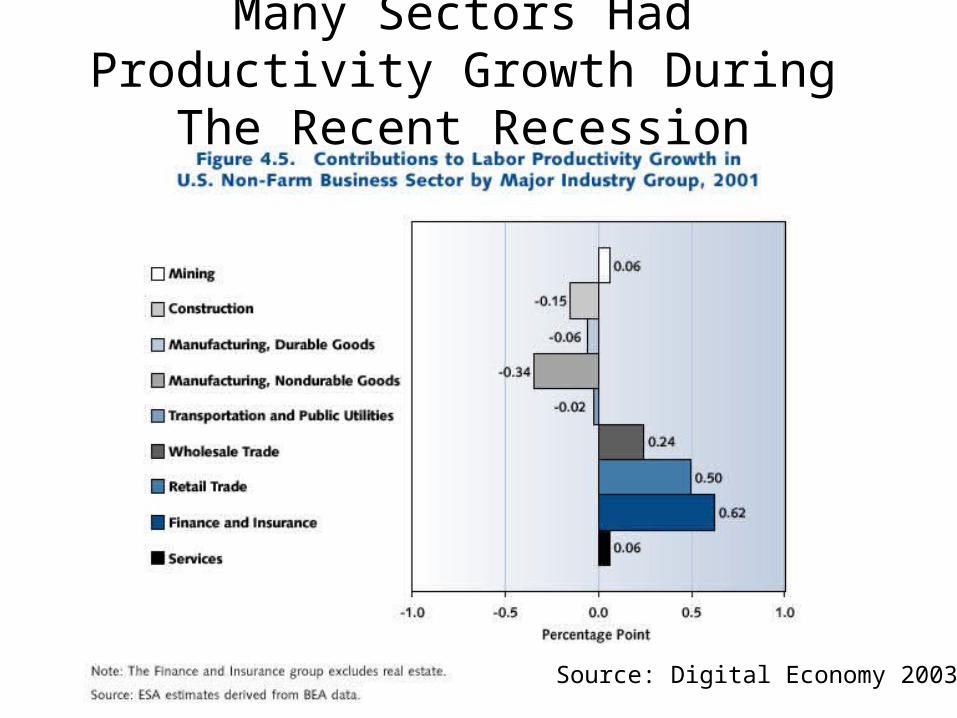
Many Sectors Had Productivity Growth During The Recent Recession
Source: Digital Economy 2003
Beyers Producer Services Research
• Funded by NSF and ERS
• Telephone Interviews with 665 producer service establishments
• Located in Urban and Rural Areas
• Typical Interview lasted about 45 minutes
• Selected findings
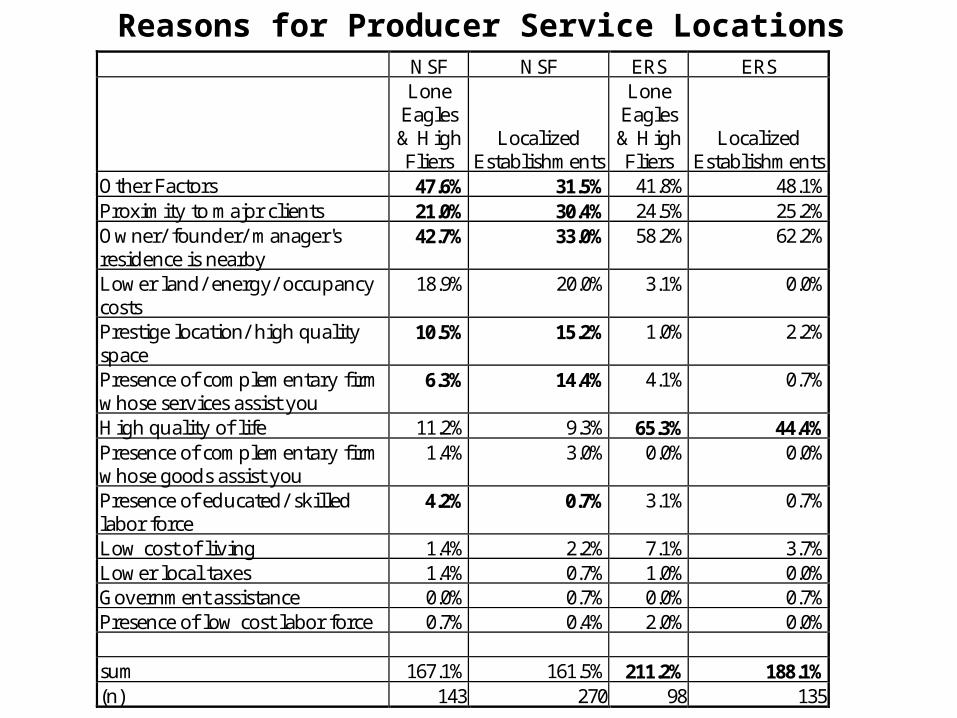
NSF NSF ERS ERSLone
Eagles& HighFliers
LocalizedEstablishments
LoneEagles& HighFliers
LocalizedEstablishments
Other Factors 47.6% 31.5% 41.8% 48.1%Proximity to major clients 21.0% 30.4% 24.5% 25.2%Owner/ founder/ manager'sresidence is nearby
42.7% 33.0% 58.2% 62.2%
Lower land/ energy/ occupancycosts
18.9% 20.0% 3.1% 0.0%
Prestige location/ high qualityspace
10.5% 15.2% 1.0% 2.2%
Presence of complementary firmwhose services assist you
6.3% 14.4% 4.1% 0.7%
High quality of life 11.2% 9.3% 65.3% 44.4%Presence of complementary firmwhose goods assist you
1.4% 3.0% 0.0% 0.0%
Presence of educated/ skilledlabor force
4.2% 0.7% 3.1% 0.7%
Low cost of living 1.4% 2.2% 7.1% 3.7%Lower local taxes 1.4% 0.7% 1.0% 0.0%Government assistance 0.0% 0.7% 0.0% 0.7%Presence of low cost labor force 0.7% 0.4% 2.0% 0.0%
sum 167.1% 161.5% 211.2% 188.1%(n) 143 270 98 135
Reasons for Producer Service Locations
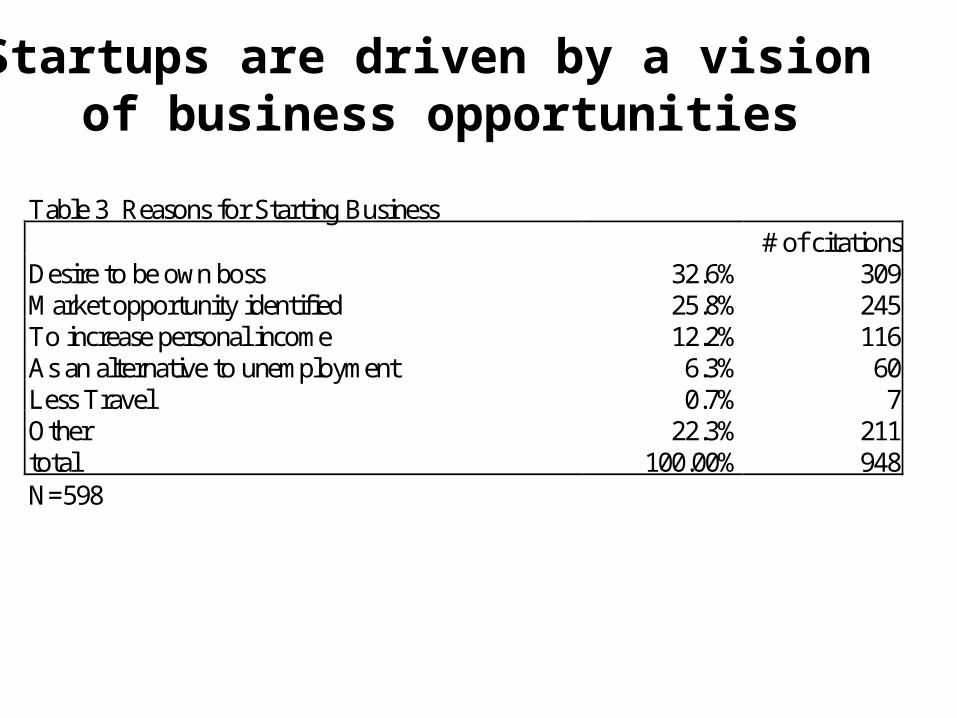
Table 3 Reasons for Starting Business# of citations
Desire to be own boss 32.6% 309Market opportunity identified 25.8% 245To increase personal income 12.2% 116As an alternative to unemployment 6.3% 60Less Travel 0.7% 7Other 22.3% 211total 100.00% 948N=598
Startups are driven by a vision of business opportunities

Table 4 Examples of types of businesses in which the founder wished to pursue a marketopportunityIndustry Service description NicheMisc. BusinessServices
Fire equipment sales companies Consulting to fire equipment industryincluding management seminars for fireequipment management companies
Architecture &Engineering aswell asManagementConsulting
Engineering and scientific consulting Development of non-destructivemethod of constructing engineeringcomponent. Expert witness.
ManagementConsulting
Environmental dispute resolution Facilitation and mediation of policydisputes.
Temporary Help Temporary help company, specialist inlabor relations
Specialization in electric utilities.
ManagementConsulting
Public Relations Agriculture and natural resources;partners have expertise in agriculture.Main competition are large adagencies.
ComputerServices
Applications software forcollege/university and nonprofitorganizations.
Nonprofit foundation software andhigher education software
Niche Examples

Table 6 Percentage of establishments considering factor highly important as a reason forchanging their services.
Why Types of Services Have Changed: Total
Percent ofEstablishments
Citing OneFactor
Percent ofEstablishmentsCiting Multiple
FactorsChange in Market 44.5% 28.3% 52.7%Change in Client Expectations 36.1% 15.2% 45.2%Use of Computers and IT 31.1% 26.1% 31.5%Change in Government Regulations 23.9% 19.6% 21.9%Change in Employee Skills 18.9% 10.9% 20.5%
(Sample size) n=238 n=92 n=146
Most Companies are dynamic in changing their services,driven by changes in IT and a variety of related factors
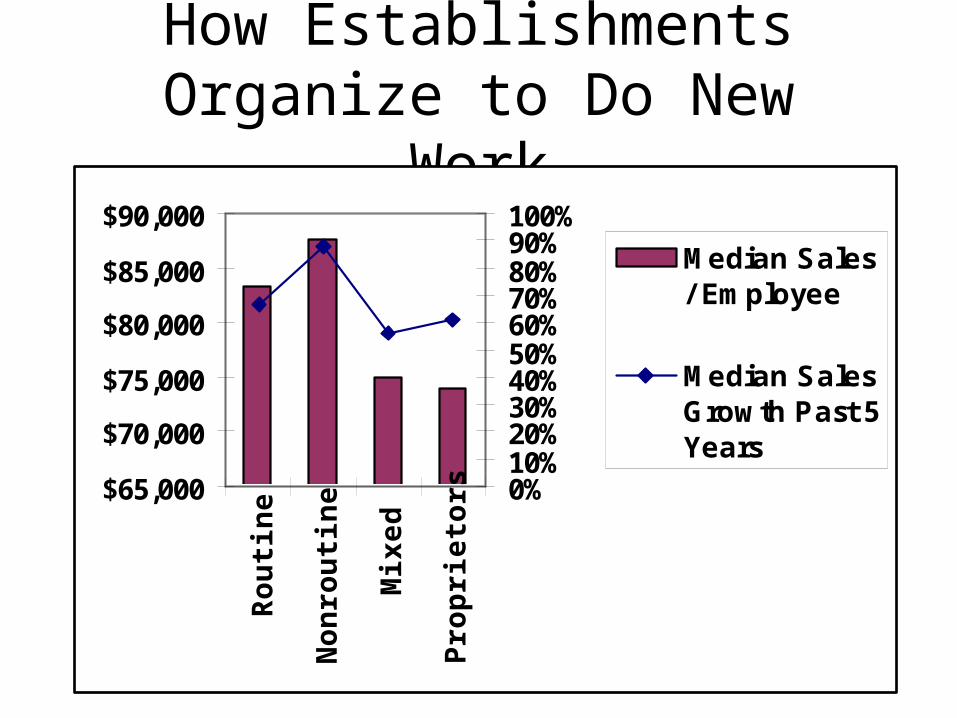
How Establishments Organize to Do New Work
$65,000
$70,000
$75,000
$80,000
$85,000
$90,000
Ro
uti
ne
No
nro
uti
ne
Mix
ed
Pro
pri
eto
rs0%10%20%30%40%50%60%70%80%90%100%
Median Sales/ Employee
Median SalesGrowth Past 5Years

Ansoff’s Box
Presen
tNew
Product
/serv
ice
technolo
gies
Present New
Market type
New
Pre
sent
Mar
ket
geo
grap
hy
A
B
C
9 Strategies beyond A, B, and C
A - no changeB - all changeC - only geog. changes
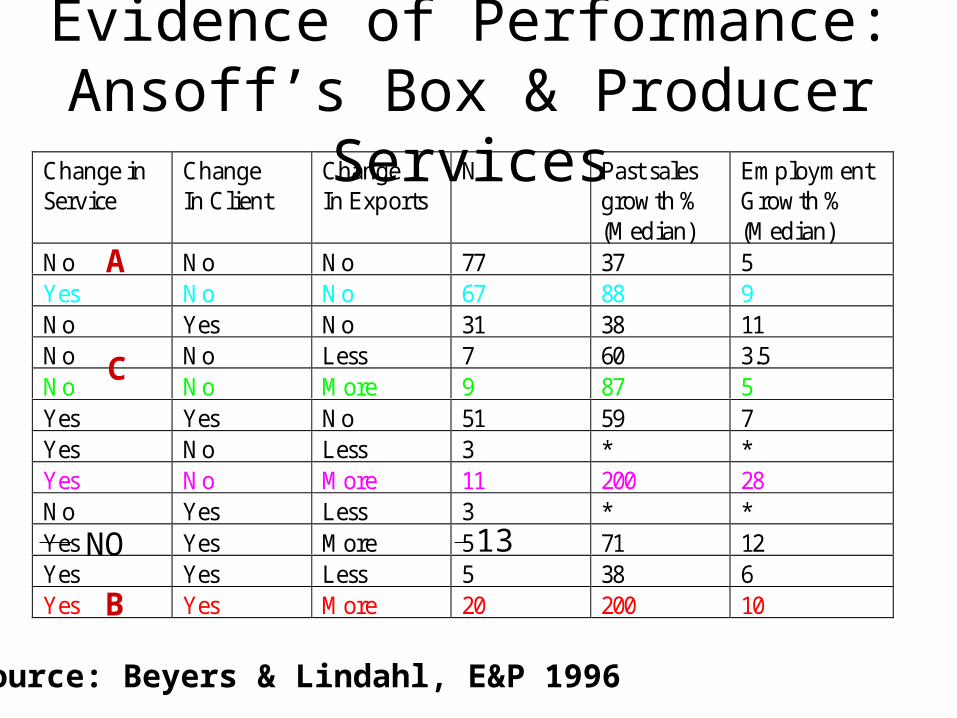
Evidence of Performance: Ansoff’s Box & Producer Services
Source: Beyers & Lindahl, E&P 1996
Change inService
ChangeIn Client
ChangeIn Exports
N Past salesgrowth %(Median)
EmploymentGrowth %(Median)
No No No 77 37 5Yes No No 67 88 9No Yes No 31 38 11No No Less 7 60 3.5No No More 9 87 5Yes Yes No 51 59 7Yes No Less 3 * *Yes No More 11 200 28No Yes Less 3 * *Yes Yes More 5 71 12Yes Yes Less 5 38 6Yes Yes More 20 200 10
A
B
C
NO 13
Demand & Competitive AdvantageDemand:
It is predominantly related to the lack of expertise by clients, by their infrequent need for the service, the need for 3rd party info, and a host of other non-cost related reasons.
Competitive Advantage:
Created by firms pursuing the flip-side of demand forces: Differentiation, specialization, niching, collaboration, use of specialized subcontractors, etc. Not Cost.
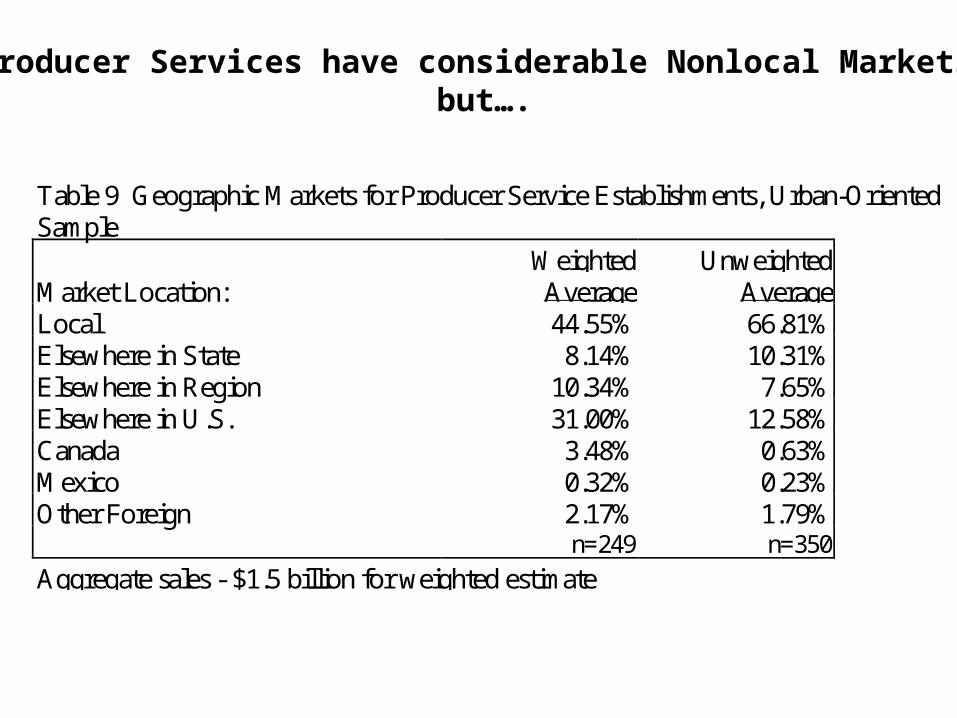
Table 9 Geographic Markets for Producer Service Establishments, Urban-OrientedSample
Market Location:WeightedAverage
UnweightedAverage
Local 44.55% 66.81%Elsewhere in State 8.14% 10.31%Elsewhere in Region 10.34% 7.65%Elsewhere in U.S. 31.00% 12.58%Canada 3.48% 0.63%Mexico 0.32% 0.23%Other Foreign 2.17% 1.79%
n=249 n=350
Aggregate sales - $1.5 billion for weighted estimate
Producer Services have considerable Nonlocal Markets,but….

Figure 3 Frequency of Export Market Percentages
0
20
40
60
80
100
120
140
96
-10
0
86
-95
76
-85
66
-75
56
-65
46
-55
36
-45
26
-35
16
-25
6-1
5
0-5
% Nonlocal Sales
# o
f o
bs
erv
ati
on
s
Rural
Urban
Producer Service Businesses have Bifurcated Markets:They Tend to be Local or Export
Local FirmsLone Eagles & High Fliers
These data are indicative of market orientation of New Economy firms
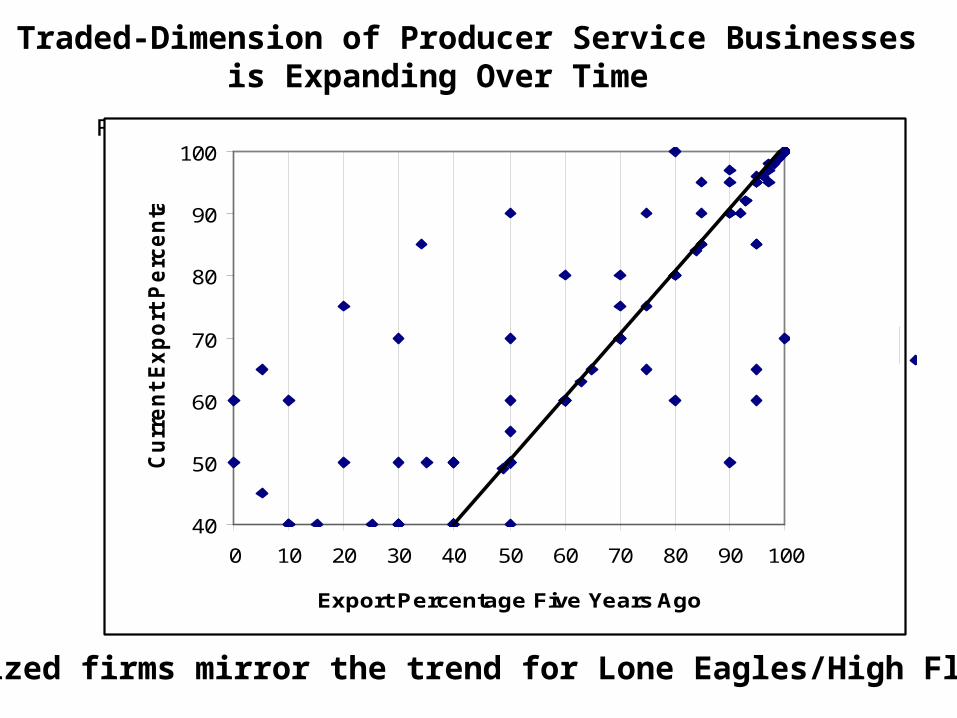
Figure 4 Lone Eagles and High Fliers: Exports Five Years Ago and Exports Today*
40
50
60
70
80
90
100
0 10 20 30 40 50 60 70 80 90 100
Export Percentage Five Years Ago
Cu
rre
nt
Ex
po
rt P
erc
en
tag
e
The Traded-Dimension of Producer Service Businesses is Expanding Over Time
Localized firms mirror the trend for Lone Eagles/High Fliers

Possible Development Sequence

Table 3 Percentage of Establishments Considering Factors to be Highly Important as aMeans of Producing and Delivering Their Services (1)
Current (2)
Increases (3)
Decreases Face to face conversations at clients offices 40.8% 0.6% 2.0% Face to face conversations at establishment office 46.2% 2.0% 2.7% Telephone Conversations 47.1% 2.6% 0.7% Video Conferencing 0.0% 1.1% 0.5% Computer File Transfer - via modem direct 11.7% 14.3% 0.4% - via E mail, internet 6.8% 9.9% Zero via LAN 2.6% 3.2% Zero via WAN 0.8% 1.4% Zero via Mail/Courier 10.5% 11.7% 0.4% Written/Graphical Documents - face to face @ client 36.1% 1.2% 1.0% - face to face @ estab. 28.3% 0.5% 1.6% - mail/courier 39.1% 1.7% 0.7% - Fax 39.4% 24.2% Zero Other: Satellite Uplinks 0.6% 1.1% Zero Other 3.0% 1.1% Zero 76.4% 10% Number of highly important cites/business 3.13
Source: (Beyers 2000)
Face to Face Communication Is Key and is Not Diminishing in Its Importance
Recognition of Producer Services as a Part of the Economic Base
• Historic metro concentration
• Recent rural deconcentration
• Role in “Edge Cities”
• The “New Economy.”
• --Producer Services as a progenitor to the New Economy:
–now multimedia, online retail, .com,–.org, .edu; telemedicine, teleservices, tele?; content providers; media conduits; delivery agents, etc.

Implications for Settlements for the New Economy
? Will this fuel decentralization of work?
? Or, will the power of agglomerations ?continue? To win out?
? What will happen to Edge Cities? Central Cities? What difference does it make where we focus on….Friday Harbor, Roslyn, Enterprise, Driggs, Missoula, Bellevue, Bend,
Beaverton, Darrington, Sun City, Corvallis
New Points?