the new economy: preparing utah for the future · the new economy: preparing utah for the future....
TRANSCRIPT

The New Economy:Preparing Utah for the FutureUtah Intergovernmental Roundtable
Annual Summit
Arthur C. (Christian “Chris”) Nelson, Ph.D., FAICPPresidential Professor & Director
Metropolitan Research CenterUniversity of UtahNovember 4, 2009

America Grows200 million in 1968300 million in 2006400 million in 2034500 million in 2050
America adds 100 million people faster than any other nation except India and
Pakistan – But faster than China.
Source: Arthur C. Nelson, Presidential Professor & Director of Metropolitan Research, University of Utah.
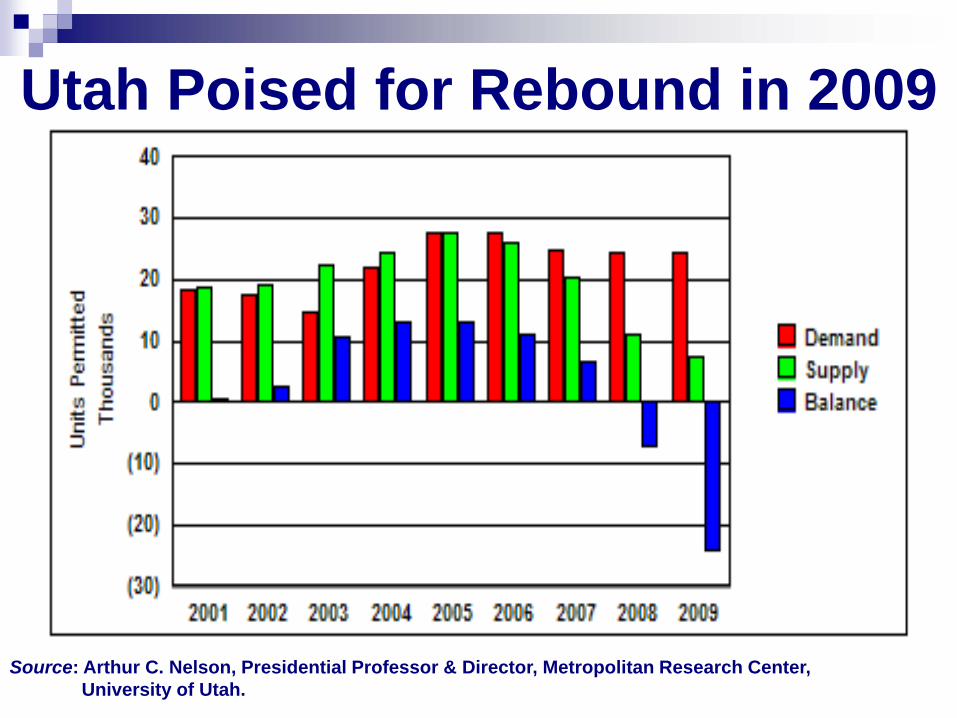
Utah Poised for Rebound in 2009
Source: Arthur C. Nelson, Presidential Professor & Director, Metropolitan Research Center, University of Utah.

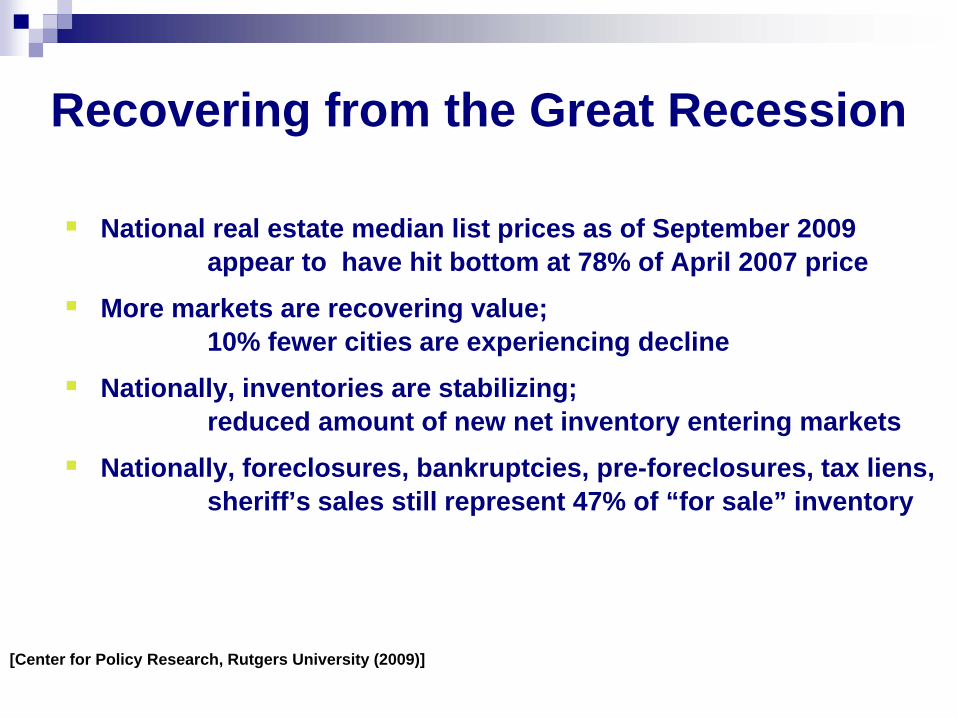
Recovering from the Great Recession
National real estate median list prices as of September 2009 appear to have hit bottom at 78% of April 2007 price
More markets are recovering value; 10% fewer cities are experiencing decline
Nationally, inventories are stabilizing; reduced amount of new net inventory entering markets
Nationally, foreclosures, bankruptcies, pre-foreclosures, tax liens, sheriff’s sales still represent 47% of “for sale” inventory
[Center for Policy Research, Rutgers University (2009)]
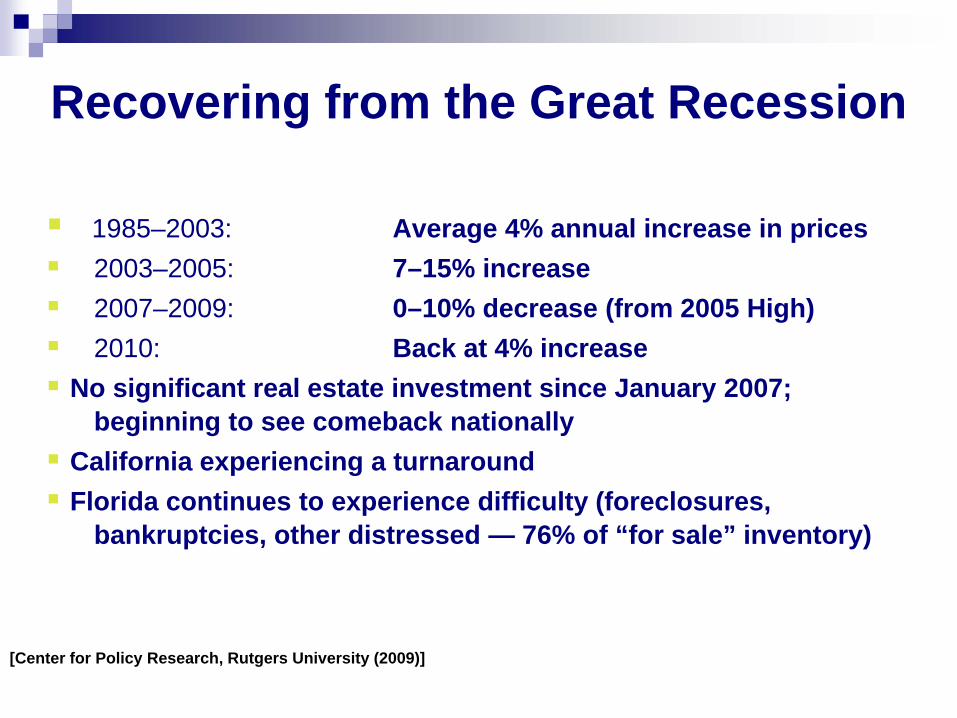
Recovering from the Great Recession
1985–2003: Average 4% annual increase in prices2003–2005: 7–15% increase2007–2009: 0–10% decrease (from 2005 High)2010: Back at 4% increase
No significant real estate investment since January 2007; beginning to see comeback nationally
California experiencing a turnaroundFlorida continues to experience difficulty (foreclosures,
bankruptcies, other distressed — 76% of “for sale” inventory)
[Center for Policy Research, Rutgers University (2009)]

Housing Trends (Nationally) —Shorter TermHousing Starts Multifamily as a Share of Single-Family (%)
2.0M1.8M1.3M0.9M0.5M0.6M
Single-Family Sales1.3M
1.05M0.77M0.48M0.38M0.54M
200520062007200820092010
200520062007200820092010
17.018.623.031.523.616.6
Existing Home Sales6.2M5.7M4.9M4.3M4.3M5.1M
Housing Trends (Nationally) —Longer TermHousing Starts Multifamily as a Share of Single-Family (%)
1.0M
1.8M
2009–2012 = 4.0 million
2013–2017 = 9.0 million
16.5
20.0
[Center for Policy Research, Rutgers University (2009)]

Housing Unit Trends(Region/States)
2008-2040 Growth of Housing Units2008 2040 # % Change
United States 130.0M 186.4M 56.4M 43.4%
Northeast 23.6M 29.2M 5.6M 23.7%
Midwest 30.3M 39.3M 9.0M 29.7%
South 47.5M 72.7M 25.2M 53.0%
West 28.6M 45.2M 16.6M 58.0%
TOP 3 States (# Change) TOP 3 States (% Change)
Name Number % Name Number %
California 6.9M 49.2% Nevada 996K 98.0%
Florida 5.6M 70.5% Utah 819K 92.6%
Texas 5.6M 60.6% Arizona 2.1M 87.4%
— 50% OF HOUSING UNIT GROWTH IN SIX STATES —[Center for Policy Research, Rutgers University (2009)]
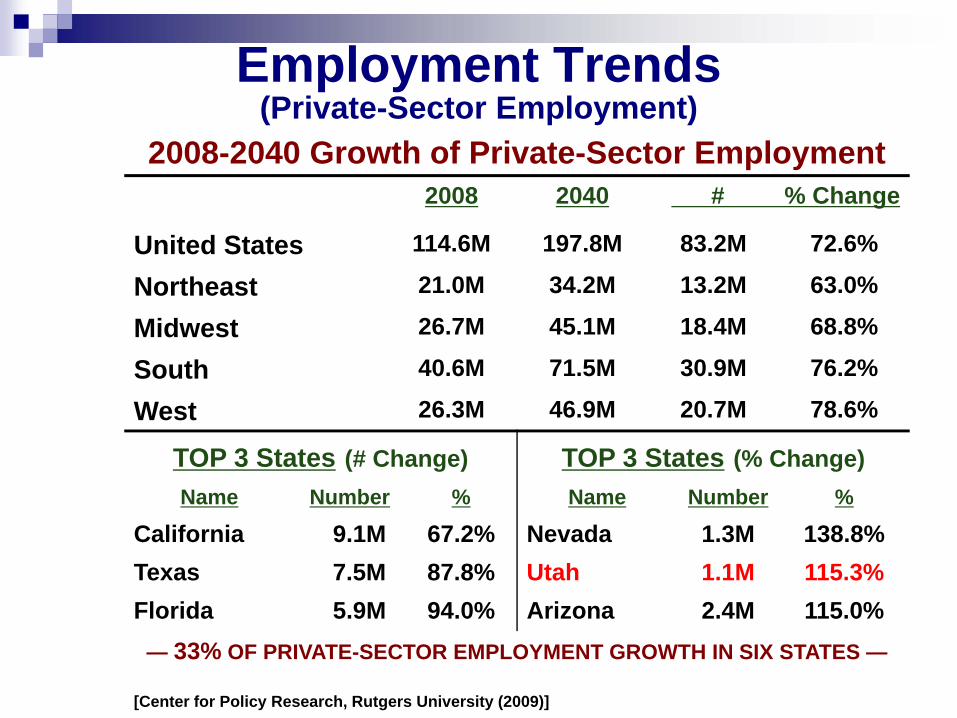
Employment Trends(Private-Sector Employment)
2008-2040 Growth of Private-Sector Employment2008 2040 # % Change
United States 114.6M 197.8M 83.2M 72.6%
Northeast 21.0M 34.2M 13.2M 63.0%
Midwest 26.7M 45.1M 18.4M 68.8%
South 40.6M 71.5M 30.9M 76.2%
West 26.3M 46.9M 20.7M 78.6%
TOP 3 States (# Change) TOP 3 States (% Change)Name Number % Name Number %
California 9.1M 67.2% Nevada 1.3M 138.8%Texas 7.5M 87.8% Utah 1.1M 115.3%Florida 5.9M 94.0% Arizona 2.4M 115.0%
— 33% OF PRIVATE-SECTOR EMPLOYMENT GROWTH IN SIX STATES —
[Center for Policy Research, Rutgers University (2009)]

2040
20402010
332 billionsquare feet
464 billionsquare feet
132 billionsquare feet
155 billionsquare feet
287 billionsquare feet
Source: Data from Arthur C. Nelson, Presidential Professor & Director, Metropolitan Research Center, University of Utah. Image from Architect magazine, premier issue, November 2006.


Population Growth 2005-2040
Area 2005 2040 Change PercentWasatch 2.2M 4.2M 2.0M 90%Utah 2.6M 5.2M 2.6M 100%
Source: Arthur C. Nelson, Presidential Professor & Director, Metropolitan Research Center, University of Utah. Numbers may not add or calculate due to rounding. Figures adapted from 2008 Economic Report to the Governor, Governor’s Office of Planning and Budget.

Residential Units 2005-2040
Area 2005 Growth Replaced Total %’05Wasatch 650k 720k 140k 840k 130%Utah 920k 920k 180k 1.1M 120%
Source: Arthur C. Nelson, Presidential Professor & Director, Metropolitan Research Center, University of Utah. Numbers may not add or calculate due to rounding. Figures based on residential units per capita 2000 adjusted for declining household size, plus loss factor based on census analysis.

Employment Growth 2005-2040
Area 2005 2040 Change PercentWasatch 1.3M 2.5M 1.2M 90%Utah 1.5M 2.9M 1.4M 90%
Source: Arthur C. Nelson, Presidential Professor & Director, Metropolitan Research Center, University of Utah. Numbers may not add or calculate due to rounding. Employment includes full- and part-time jobs as defined by BEA.
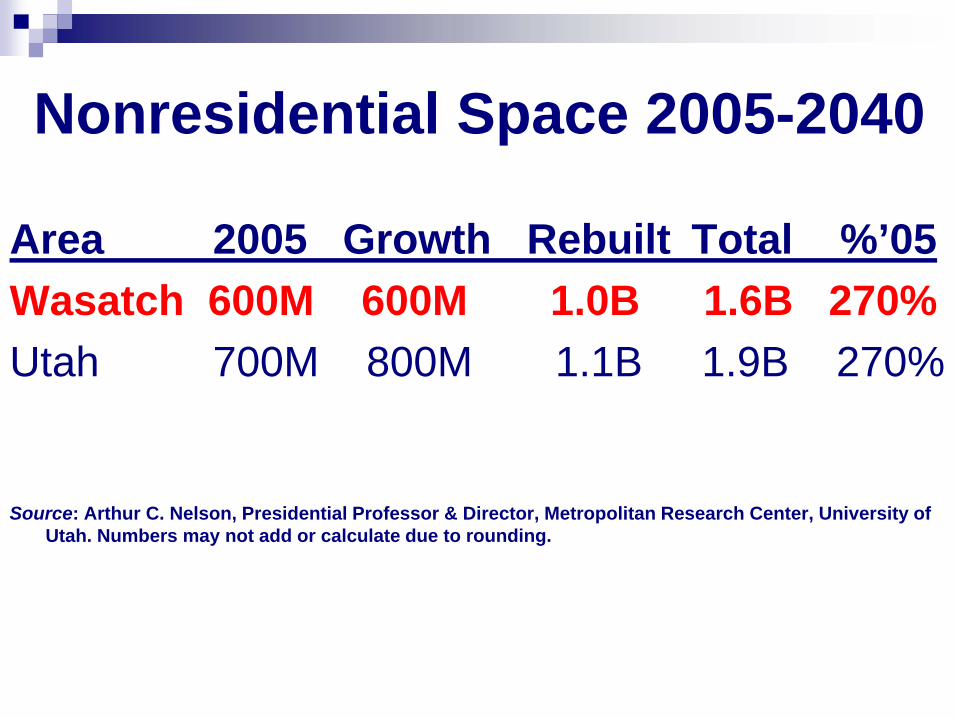
Nonresidential Space 2005-2040
Area 2005 Growth Rebuilt Total %’05Wasatch 600M 600M 1.0B 1.6B 270%Utah 700M 800M 1.1B 1.9B 270%
Source: Arthur C. Nelson, Presidential Professor & Director, Metropolitan Research Center, University of Utah. Numbers may not add or calculate due to rounding.

Bottom Line Construction2005-2040
Residential $350 billionNonresidential $250 billionInfrastructure $100 billionTotal $700 billion
Source: Arthur C. Nelson, Presidential Professor & Director, Metropolitan Research Center, University of Utah.

How Does It Grow?

Households are ChangingHousehold Type 1960 2000 2040US
HH with Children 48% 33% 26%HH without Children 52% 67% 74%Single/Other HH 13% 29% 34%
_________________________________________ UtahHH with Children 47% 38%HH without Children 53% 62%Single/Other HH 18% 22%
Source: Arthur C. Nelson, Presidential Professor & Director, Metropolitan Research Center, University of Utah.

People Turning 65 Each Year[Figures in 000s]
Source: US Census Bureau – 65+ in the United States: 2005; Wan He, Manisha Sengupta, Victoria A. Velkoff, & Kimberly A DeBarros. December 2005.
1000
1500
2000
2500
3000
3500
4000
4500
1950
1955
1960
1965
1970
1975
1980
1985
1990
1995
2000
2005
2010
2015
2020
2025

Share of Growth 2000-2040US HH Type ShareWith children 14%Without children 86%
Single/Other 30%UtahWith children 25%Without children 75%
Single/Other 25%Source: Arthur C. Nelson, Presidential Professor & Director, Metropolitan Research Center, University of Utah.

“New Urbanity” Preferences
Source: National Association of Realtors, American Preference Survey 2004.

New Housing Market RealitiesSub-prime mortgages are historyAlt-A mortgages no moreFHA-like conventional mortgages king“Jumbo” loans expensive and difficultDemand for $1million+ homes has tankedMeaning
Smaller homesSmaller lotsMore renters
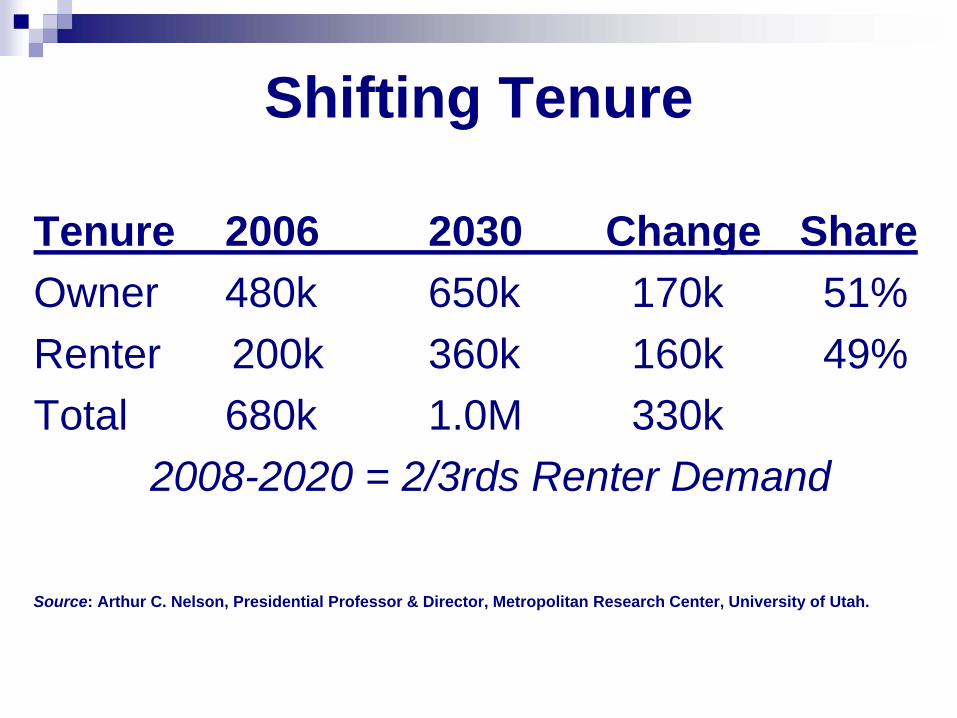
Shifting Tenure
Tenure 2006 2030 Change ShareOwner 480k 650k 170k 51%Renter 200k 360k 160k 49%Total 680k 1.0M 330k
2008-2020 = 2/3rds Renter Demand
Source: Arthur C. Nelson, Presidential Professor & Director, Metropolitan Research Center, University of Utah.
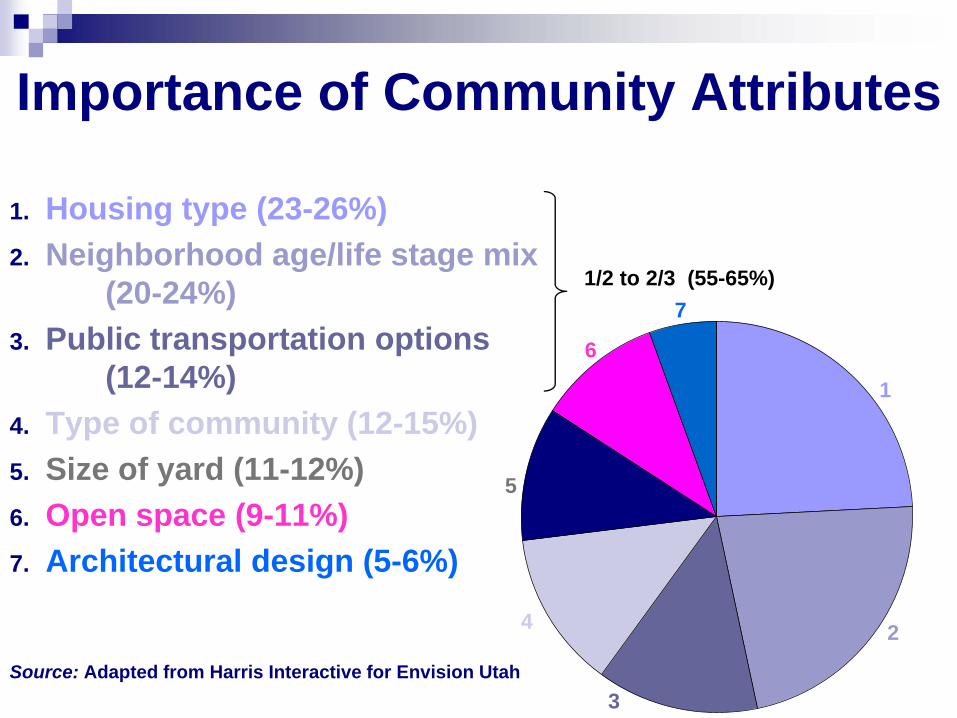
Importance of Community Attributes
1. Housing type (23-26%)2. Neighborhood age/life stage mix
(20-24%)3. Public transportation options
(12-14%)4. Type of community (12-15%)5. Size of yard (11-12%)6. Open space (9-11%)7. Architectural design (5-6%)
Source: Adapted from Harris Interactive for Envision Utah
1
2
3
4
5
6
71/2 to 2/3 (55-65%)

Preferred Community Attributes
Housing type: Mix of single family homes & town homes
Neighborhood age/life stage mix: Mix of ages & stages
Public transportation options: Bus, Rail, TRAX
Type of community: VillageLot size: Variety of lot sizesOpen space: Active & passiveArchitecture: Distinctive
Preferred Combination
of 75% of Utahns
Source: Envision Utah based on Harris Interactive

Core Values = Urbanity
Well-Designed Communities and Core Areas= Density, mixed uses, renewability
Effective Transportation Systems= Density, accessibility, connectivity
Employment and Economy= Density, accessibility, connectivity
Sense of Community= Walkability, life-stage options, connectivity

Sustainability & ResilienceMinimums to be taken seriously:
10,000+ people per square mile.4,000+ occupied residential units per sq. mile.Average of 6,000 jobs per square mile with
centers 3-times this surrounded by areas 1/3rd this – walking, biking, Segway distance
400,000 square feet of retail + service space per square mile but with centers of 2-times this surrounded by areas of 1/2 this.
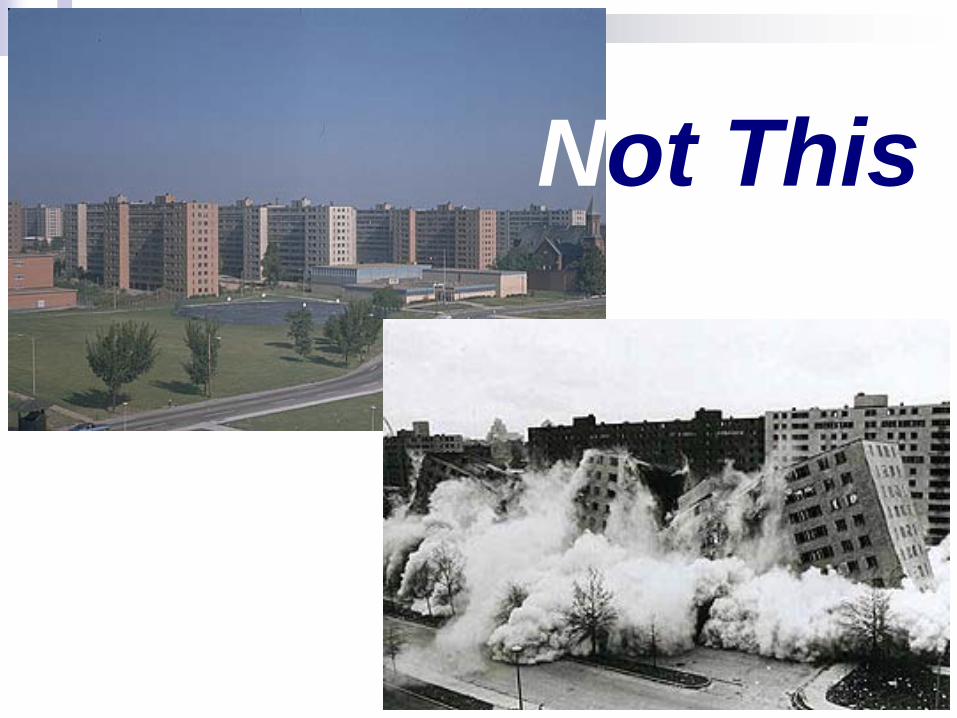
Not This

Day Break = 11,000 people per square mile.

Orenco Station =15,000 per sq.mi
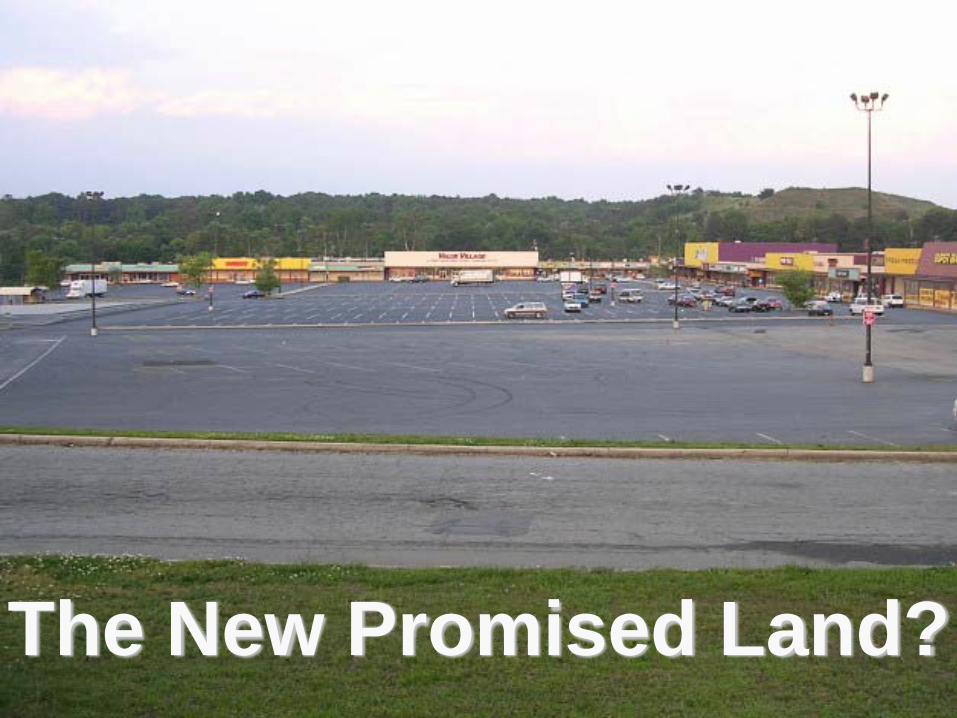
The Opportunity
The New Promised Land?

Tear Up a Parking Lot,Rebuild Paradise
Large, flat and well drainedSingle, profit-motivated ownership
Major infrastructure in place4+ lane highway frontage “transit-ready”
Committed to commercial/mixed useCan turn NIMBYs into YIMBYs
Slide title phrase adapted from Joni Mitchell, Big Yellow Taxi, refrain: “Pave over paradise, put up a parking lot.”

Corridor Opportunities
Station Area
Opportunities
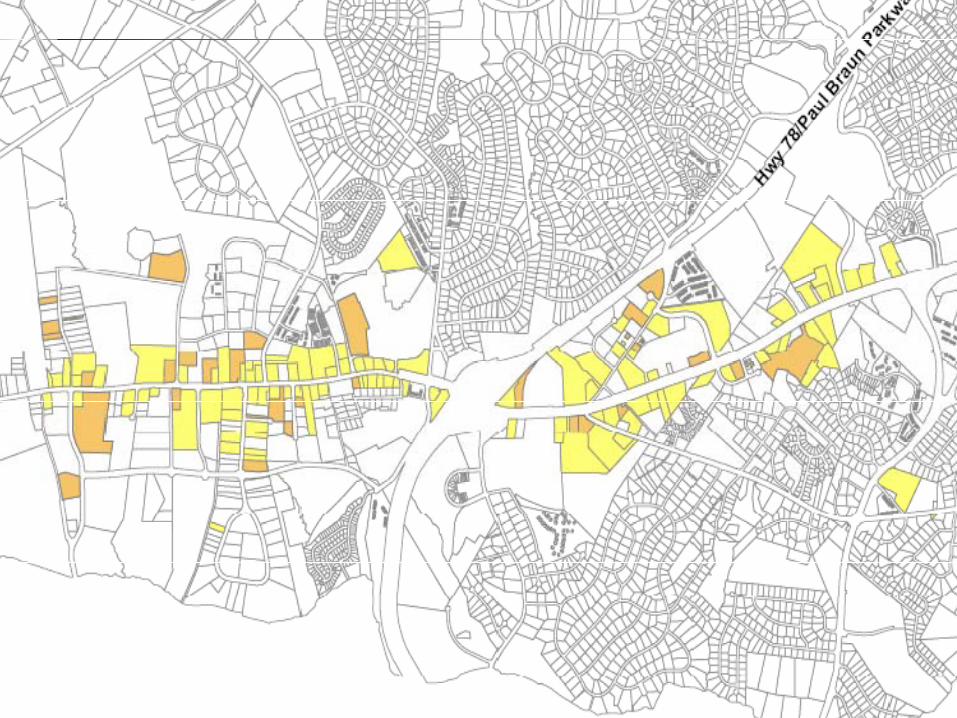


http://www.cnu.org/sites/www.cnu.org/files/R0012614.jpg
The FutureState Street
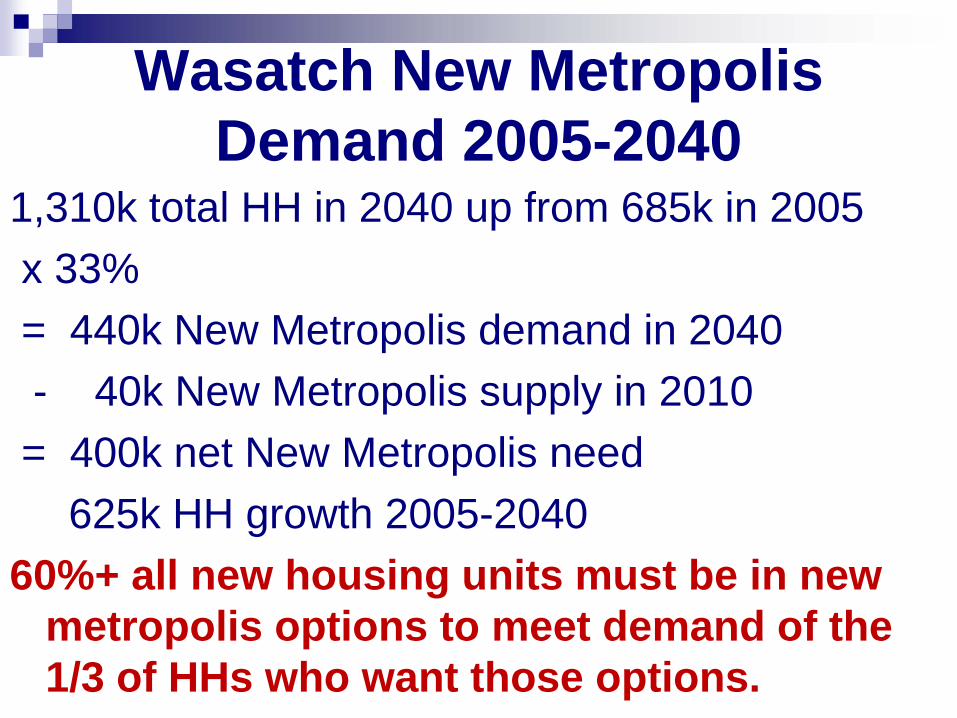
Wasatch New MetropolisDemand 2005-2040
1,310k total HH in 2040 up from 685k in 2005x 33% = 440k New Metropolis demand in 2040- 40k New Metropolis supply in 2010
= 400k net New Metropolis need625k HH growth 2005-2040
60%+ all new housing units must be in new metropolis options to meet demand of the 1/3 of HHs who want those options.

Top Planning Programs

THANK YOU