the new alphatracker indicators seeing the market’s 4 th dimension see what big money is doing in...
TRANSCRIPT

The NEW AlphaTracker IndicatorsSeeing the Market’s 4th Dimension
• See What Big Money is doing in real time• See How Big Money and the Market
has positioned themselves over the past 20-days• Get Pivot Points not at “maybe” levels but
based on the Actual Actions in the Market• Get a Sense of What UOA might be a Hedge vs. Actual Speculation
1

Day trading, short term trading, options trading, and futures trading are extremely risky undertakings. They generally are not appropriate for someone with limited capital, little or no trading experience, and/ or a low tolerance for risk. Never execute a trade unless you can afford to and are prepared to lose your entire investment. All trading operations involve serious risks, and you can lose your entire investment. No trades are recommendations or advice and we cannot be sued for losses of capital. All trades are for educational purposes only. Contact your broker or RIA for execution, margin, and other capital requirements. Everyone watching presentation adheres to ALL disclaimers on www.optionhacker.com and www.keeneonthemarket.com
RISK DISCLAIMER

Following the Money
3
• What drives movement in the market? Different participants:The normal trades – can be retail traders, small funds, large funds trading in small pieces, etc.The big trades – Larger than normal trade sizes, these are people putting a lot of capital down (or closing) at a specific priceThe small trades – Small retail traders, HFTs, Algos, trading a lot but in small volume.
When the big trades come in, it causes the market to move heavily. Algos/HFTs are programmed to look for these trades, retail traders, day traders, and even large funds are looking for these orders coming in, and they will either join the direction or attempt to front run it. The big money is really the directional driver at any given moment.
• What have we been missing??
Big Money has had tools for a long time to hide their large orders. As an example, algos can be used to separate a 1m volume order into multiple smaller trades to attempt to keep the market from running away from the desired price. They could even have a diligent broker spreading their trade out over the course of a day. Or trade in dark pools where eventually the darkpool will come out to the lit-market in some sizable but oddly priced trade.
Another algorithmic tool is used by institutions to get large orders in, this tool takes advantage of temporary dips in liquidity. If Big Money wants to buy large on a low price for the day, they’ll wait for sellers to exhaust themselves then over multiple trades, sweep the remaining sell volume. This creates a defensive line and probable reversal point in the market. (typically seen as hammer bars, morning stars, evening stars, etc on a charting pattern).
At KOTM we follow Unusual Option Activity – large institutional option order flow – but the catch is, we never quite know if they’re using options to hedge a stock position or if they’re using options as a less capital intensive speculation strategy. If we can track the overall stock positioning of the large institutions we can get an edge and have a better sense of an option order being a hedge or speculation.
All of these things are detectable and trackable, but not with traditional charting methods.

Following the Money
4
• The traditional chart: What we can see:• Price
(Open, Close, High, Low)• Time
(Per bar, Over the day)• Volume
(How much per bar period)
What can we read from this?High volume on the opening sell off… so down?
High volume on the opening rally…So up?
High volume on the close… so???
No wonder it’s easy to get chopped up in this market…
Hi Vol Selling?
Hi Vol Buying?
Hi Vol Selling?Hi Vol ???
Hi Vol ???
Price
Time
Volume

Following the Money
5
• Let’s put on the AlphaTracker X-Ray Specs:What we can see:• Price
(Open, Close, High, Low)• Time
(Per bar, Over the day)• Volume
(How much per bar period)• Volume/Trade
(Who’s acting in the market)
Now we can see Tuesday there was large buying but defending the top level of 45.59
As we broke above that Wednesday there was continued buying, but a test of the same level from the top side, a good long entry.
Thursday buyers defended 46.37 as a low level, Friday we retested the same level for another long entry.
Big money was active Tuesday and Thursday, and waited patiently for best entries Wednesday and Friday
Defensive Sellers
Test for Long Entry
Defensive Buyers
Test for Long Entry
Big money Buying Heavily Big money waiting for best long entry
Following the Money
6
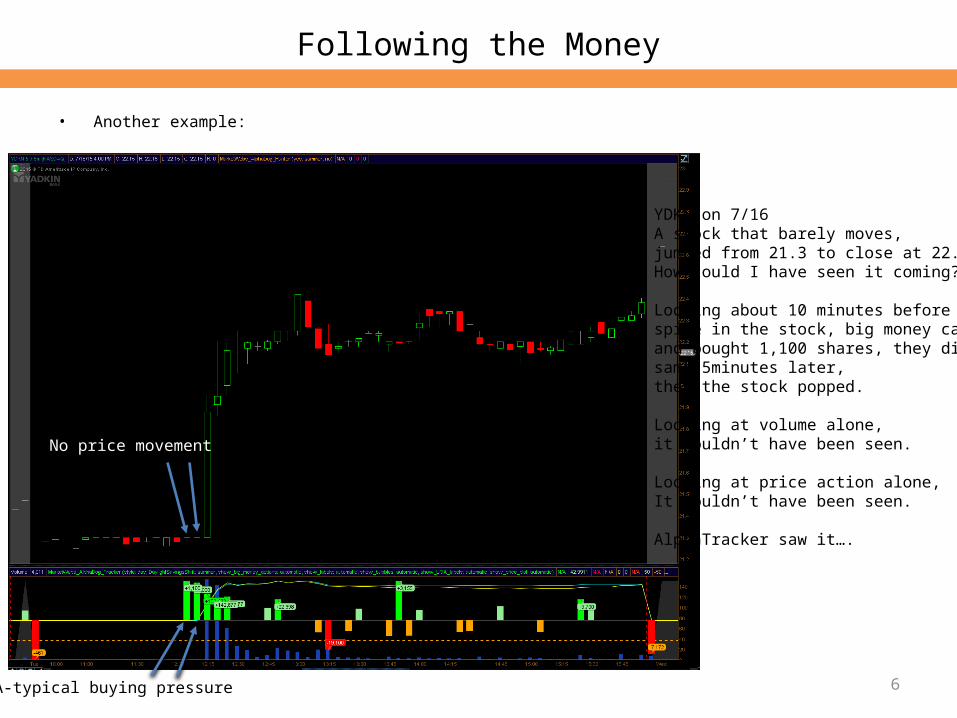
• Another example:
YDKN on 7/16A stock that barely moves, jumped from 21.3 to close at 22.4How could I have seen it coming?
Looking about 10 minutes before the spike in the stock, big money came in and bought 1,100 shares, they did the same 5minutes later, then the stock popped.
Looking at volume alone, it wouldn’t have been seen.
Looking at price action alone,It wouldn’t have been seen.
AlphaTracker saw it….
No price movement
A-typical buying pressure

Following the Money
7
• Another example:Tracking the cumulative positions over past 20-days
GOOGL ahead of earnings
Over the past 20-days we can see that small money has remained considerably long throughout.
Big money and the normal participants (all money) positioned themselves flat into Monday this week.
At the end of the day Tuesday, Big money bought heavily to a 10% long position, then accumulated more on Thursday ahead of the announcement.
They continued to buy Friday even after the large jump in price ending the week 53% long (some profits taken at the end of the day Friday)
Flat into Monday
Big Money Buying
Small Money (retail) Long & Strong

Following the Money
8
• So how does AlphaTracker do this voodoo magic?????Data Mining – Hunting for the statistical outliers to determine what is actually significant in the market (the actions of big money) and what isn’t…

Following the Money
9
• But what is it looking at? Let’s look at some sample data: • This is a random chart of trades and sizes within multiple 5minute time periods
100 1000 80 100100 200 200 60 25 200
100 300 50 100 20 800 600 100 300 1000200 600 300 50 100 900 200 60 100 1000 100 100 100100 100 1000 300 900 50 100 100 300 100 100 20 100 500 100 100 100100 100 100 30 100 50 100 100 100 100 100 50 100 500 100 100 200 100100 10 100 300 100 50 400 100 100 100 20 100 100 100 600 50 700 500 550100 500 100 300 100 50 100 100 500 100 100 500 100 100 20 50 100 900 550500 100 20 100 400 50 100 100 100 100 100 2000 100 200 80 100 100 100 10080 100 100 100 100 50 100 100 100 600 30 100 100 200 100 100 800 100 100
1000 100 100 200 100 50 600 800 900 60 100 100 56 200 100 50 100 100 100100 100 500 200 1000 50 100 100 100 100 100 100 89 1000 100 50 100 645 400100 100 100 200 800 100 100 100 700 100 10 60 2000 1000 100 100 50 100 100500 100 100 200 100 100 100 2000 100 100 100 100 100 1000 100 500 100 50 20 100100 200 100 200 100 100 500 200 100 80 100 100 100 1000 100 750 90 600 20 900100 200 800 200 100 100 5000 200 900 900 50 100 100 2000 100 1000 75 85 20 100100 600 100 200 100 100 500 100 100 100 100 50 100 2000 100 1000 65 87 20 100200 100 100 200 100 100 100 100 300 500 100 100 100 2000 100 1000 80 100 84 100100 100 100 200 100 110 100 100 300 565 100 100 100 50 100 1000 100 100 20 100100 100 100 100 100 100 100 100 100 100 100 100 100 60 100 750 100 100 20 100
6 8 10 12 14 16 18 20 220.00
2000.00
4000.00
6000.00
8000.00
10000.00
12000.00
17 18 16 18 16 18 17 19 20 14 20 16 20 16 17 7 20 19 15 183580 3310 3520 3630 4300 1310 8200 5500 5320 3505 3370 3810 4155 11110 3800 6000 1635 3872 2849 4700
211 184 220 202 269 73 482 289 266 250 169 238 208 694 224 857 82 204 190 261

Following the Money
10
• So how does the AlphaTracker decipher this data?
• Looking at the average trade size during 4 different time periods (regular trading hours, extended trading hours, opening period, closing period) it detects any unusual activity. Then it runs this data through an artificial intelligence algorithm to determine (to the best of its ability) if it’s buying or selling. Then AlphaTracker tracks big money trades and small money trades as separate from normal trades providing an insight into the actions of the market.
• Looking at the GOOGL chart above, we can see an abundance of big money buying (more so than selling) ahead of earnings. It also saw a large defensive play by big money with a buy order of 67k shares before the end of the day just before earnings.

Following the Money
11
• So what do you get with the AlphaTracker Indicators?
• AlphaTracker Lower Study: Two functions in one – Day trading (track the actions of big money on an intra day basis)
Big money buys are represented by green bars – light green for mild, bright green with volume labels for large buysBig money sells are represented by red bars – light red (orange) for mild, bright red with volume labels for large sells.
The blue line represents Big Money’s position, as it rises they are buying, as it falls they are selling.The yellow line represents All Money (the overall market)The Red line represents Small Money(At the end of each day, all three lines are reset to zero)
Big Money Buy
Big Money Sell
Big Money Buying all day
Big Money Selling all day
Following the Money
12
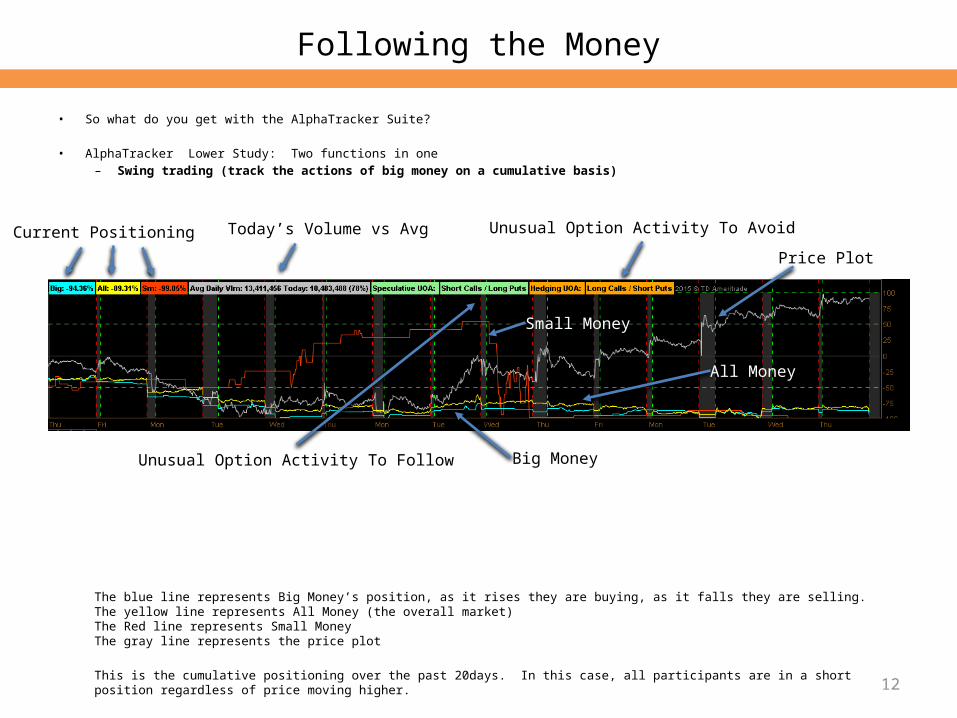
• So what do you get with the AlphaTracker Suite?
• AlphaTracker Lower Study: Two functions in one – Swing trading (track the actions of big money on a cumulative basis)
The blue line represents Big Money’s position, as it rises they are buying, as it falls they are selling.The yellow line represents All Money (the overall market)The Red line represents Small MoneyThe gray line represents the price plot
This is the cumulative positioning over the past 20days. In this case, all participants are in a short position regardless of price moving higher.
Price Plot
Small Money
Big Money
All Money
Today’s Volume vs Avg
Unusual Option Activity To Follow
Unusual Option Activity To AvoidCurrent Positioning

Following the Money
13
• So what do you get with the AlphaTracker Suite?
• AlphaTracker Upper StudySee the Defensive Lines
The Tracker notes defensive selling/buying and draws lines across the chart when it believes they are especially significant, other moments are noted but if price breaks them they do not continue on.These lines act as Pivot Points. Price will either bounce or break them. If they break, price will continue hard in the break’s direction.
Defensive SellingAlphaDog Hunter Establishes Line
Defensive BuyingAlphaDog Hunter Establishes Line
Break Below Level
Bounce At Level

Total Value: $2097 KOTM REGULAR PRICE: $999
Over 70% Discount Today Only!
The AlphaTracker Indicators for ToS:Get the Edge No One Else Has
http://keeneonthemarket.com/alphatracker/
OR CALL 312-261-5581 $299
AlphaTracker Lower: $799 Value• Track the actions of Big Money / All Money / Small Money• Day Trading / Swing Trading & Suggestions about UOA
• AlphaTracker Upper: $499 Value• See where Big Money defends price levels• See new pivot points no one else sees
Works for ALL Equities, ALL Futures, ALL ETFs! BONUS: 2 Hours of Live Mentoring & PowerPoint Slides for Reference: $799 Value
• Learn how best to trade around the actions of Big Money• Learn how to analyze the data to decide for a swing short or long• Learn how to day trade the futures / equities using the actions of big money
Introductory
Special