the nevada housing market: prospects for recovery
TRANSCRIPT
Prepared by
The Nevada Housing Market: Prospects for Recovery
Stephen P. A. Brown, Ph.D., Director Ryan Kennelly, Economic Analyst
Southern Nevada Home Builders Association
February 2013
Prepared for

The Center
for Business
and Economic Research
University of Nevada, Las Vegas
Box 456002 4505 S. Maryland Parkway
Las Vegas, Nevada 89154-6002 (702) 895-3191
[email protected] http://cber.unlv.edu
Copyright ©2013, CBER
The Nevada Housing Market: Prospects for Recovery
2013
E-2
ExecutiveSummaryMuchofthestrainonNevada’seconomyduringtheGreatRecessioncamefromtheburstofthehousingbubble.Whilegrowingtourismandhospitalityhasledtosomeimprovement,Nevadaisbehindamajorityofthecountryinachievingafulleconomicrecovery,mostlytheresultofweakrealestateandconstructionsectors.ThisreportprovidesanoverviewoftheNevadahousingmarket,whereithasbeen,whereitisheaded,andhowcurrentmarketconditionsandbuilderliabilitylawsareaffectingthestrengthoftherecovery.TheNevadahousingmarketisfinallyshowingsignsofrecovery.Homepricesbeganrisingin2012.Followingasix‐yeardecline,buildingpermitsforresidentialconstructionweremorethan50percenthigherin2012thaninthepreviousyear.Despitesignsofrecovery,Nevadahousingconstructionfacesseveralimpediments.Theinventoryofhousesinweakhandsremainsrelativelyhigh.Inaddition,homebuildersinNevadafacehigherregulatorycoststhanarefoundinmostotherareasofthecountry.Chapter40oftheNevadaRevisedStatutes,whichwasconceivedtoprotecthomeownersfromhomedefectscausedbybuilders,hashadunintendedconsequences.Thetermdefectislooselydefined,allowingformanylawsuitsoutsidetheoriginalintentofthelaw.Usingdatafromfourfirms,wefindthatclaimsagainstbuildershaveskyrocketedwhenwewouldexpectthemtobedeclining.Between2000and2012,newhomesalesinNevadadecreasedby86percentwhileconstructiondefectclaimsincreasedby355percent.Since2006,thenumberofclaimspernewhomeinNevadahasbeen38timesthenationalaverage.Mostconstructiondefectcasesaresettledoutsideofcourtbyinsurancecompanies,leadingtohigherpremiumsforbuilders.ThesesettlementcostsareincreasinginNevada,whiledwindlinginotherstates,evenCalifornia.Accordingtoindustrysources,Nevada’spremiumsareabout85percentofCalifornia’s,whereasmorecompetitivewesternstatessuchasArizonaandTexashavepremiumslessthanhalfofCalifornia’s.TheseescalatingcostsarethenpassedontoNevadaconsumersintheformofhigherhomeprices.Inaddition,higherpremiumshaveforcedsmallbuildersoutofthemarketdisproportionally;theyhave340percentmoreshareofthemarketnationallythaninNevada.ArevisionofChapter40wouldaidinaquickerrecoveryfortheNevadahousingmarketandoveralleconomy.Reducedcostswouldleadtoincreasednewhomeconstruction.Everynewhomeconstructedleadsto3.19permanentjobsinNevada.Fora$220,000home,thisgenerates$401,790intotaleconomicactivityinthestate.Afteraboutsixyearsofsliding,SouthernNevadahousingpricesareontherise.Mostconsiderthatagoodsign.Alackofsupplyiscontributingtotherise,andpriceslooksettoincreaseoverthenextfewyearsastheSouthernNevadaeconomyimproves.Nonetheless,theoverhangofpropertyheldinweakhandscoulddampenanyacceleration.Inaddition,theincreaseinclaimsandsettlementcostsmadepossibleunderChapter40maypostponethegainsinconstructionbyaddingtothecostsofnewhomeconstruction.
E-3

TableofContents
1.Introduction..........................................................................................................................................................1
2.WhattheHousingMarketMeanstoNevada’sEconomy...................................................................1
2.1Nevada’sEconomicBase...........................................................................................................................1
2.2QuantifyingtheEconomicImpactofNewHomeConstructioninNevada.........................3
2.2.1RegionalEconomicMultipliers.....................................................................................................3
2.2.2QuantifyingRegionalEconomicEffects......................................................................................5
2.2.3Single‐IndustryMultiplierEffects.................................................................................................7
2.2.4QuantifyingtheEconomicImpactofNewHomeConstructioninNevada..................7
2.3TheHousingCollapseintheWest.........................................................................................................7
3.OutlookfortheNevadaHousingMarket..................................................................................................8
3.1CurrentStatusoftheNevadaHousingMarket...............................................................................9
3.2ProspectsforaHousingMarketRecovery....................................................................................10
3.3TheNevadaHousingMarketRecovery............................................................................................11
4.ObstaclestoRecovery....................................................................................................................................15
4.1ExcessHousingSupply...........................................................................................................................15
4.2Chapter40...................................................................................................................................................16
4.2.1Chapter40Language......................................................................................................................16
4.2.2TheEffectsofChapter40onNevada’sHousingMarket.................................................17
4.2.3WhoPaysforHigherBuildingDefectClaimsinNevada?...............................................20
4.3.3RevisingChapter40andtheNevadaHousingMarketRecovery................................20
5.Conclusions........................................................................................................................................................21
E-4
ListofChartsandTablesChart1:Case‐ShillerHomePriceIndexes..................................................................................................9
Chart2:MedianHomePrices........................................................................................................................10
Chart3:U.S.HousingMarketTightening.................................................................................................11
Chart4:LasVegasMonthsofSupplyandHousePrices....................................................................12
Chart5:NevadaHomeownerswithNegativeEquity.........................................................................13
Chart6:HousingOpportunityIndex..........................................................................................................14
Chart7:LasVegasMonthsofSupplyandHousePrices....................................................................15
Chart8:Closings,Claims,andSettlementCostsinNevada.............................................................17
Chart9:Closings,Claims,andSettlementCostsinCalifornia.........................................................18
Chart10:Closings,Claims,andSettlementCostsinAllOtherStates.............................................19
Chart11:ClaimsperClosing(ratio)..............................................................................................................19
Table1.NevadaandLasVegasLocationQuotients(2011)...............................................................2
Table2.Input‐OutputMatrix...........................................................................................................................5
Table3.EconomicImpactofBuildinga$220,000HomeinNevada..............................................7
Table4.PercentChangeinEmployment....................................................................................................8
Table5.Top10Builders’MarketShare–Nevada................................................................................20
Figure1.OverviewofaRegionalEconomicSystem
E-5
1
TheNevadaHousingMarket:ProspectsforRecovery1.IntroductionFrom2000to2008,Nevada’shousingmarkethadneverbeenbetter.Medianhomepricesincreasedby231percent,andtheeconomyflourishedfromageneralwestwardmovementoftheU.S.populationandeconomy.Afterthehousingbubbleburstthingsbegintolookmuchdifferent.Housingpricesplummeted,andmanyNevadanswereunderwaterintheirmortgages.Employmentfelldramatically,andforeclosureswereatanall‐timehigh.Nevadahaditthebestandthentheworst.Aftermanytoughyears,theNevadahousingmarketisfinallyshowingsignsofrecovery.Homepricesbeganrisingin2012.Followingasix‐yeardecline,buildingpermitsforresidentialconstructionweremorethan50percenthigherin2012thaninthepreviousyear.Despitesignsofrecovery,Nevadahousingconstructionfacesseveralimpediments.Theinventoryofhousesinweakhandsremainsrelativelyhigh.Inaddition,homebuildersinNevadafacehigherregulatorycoststhanarefoundinmostotherareasofthecountry.ThisreportprovidesanoverviewoftheNevadahousingmarket,whereithasbeen,whereitisheaded,andhowcurrentmarketconditionsandbuilderliabilitylawsareaffectingthestrengthoftherecovery.ThenextsectionexamineswhatthehousingmarketmeanstotheNevadaeconomy.Thethirdsectionaddressesthecurrentstatusofthehousingmarketandtheprospectsforafullrecoveryinthehousingmarket.Thefourthsectionaddressestwopotentialbarrierstoafullrecovery—namelyshadowinventoryandChapter40.TheconclusionpullsthesethreadstogethertoaddresstheoutlookfortheNevadahomebuildingmarket.2.WhattheHousingMarketMeanstoNevada’sEconomyWetakethreeapproachestoexaminingwhatthehousingmarketmeanstotheNevadaeconomy.WeconsidertheroleofconstructionandhousinginNevada’seconomicbase.Weuseinput‐outputanalysistoquantifytheimpactofhomebuildingtotheNevadaeconomy.WealsoexaminetheroleofthehousingmarketcollapseontheNevadarecession.2.1Nevada’sEconomicBaseAregion’seconomicbaseisdeterminedbywhichofitssectorsexportgoodsorservicestootherpartsofthecountry.Economiststypicallymeasurethesectorsformingaregion’seconomicbasebyusinglocationquotients.Alocationquotientprovidesinformationabout
E-6
2
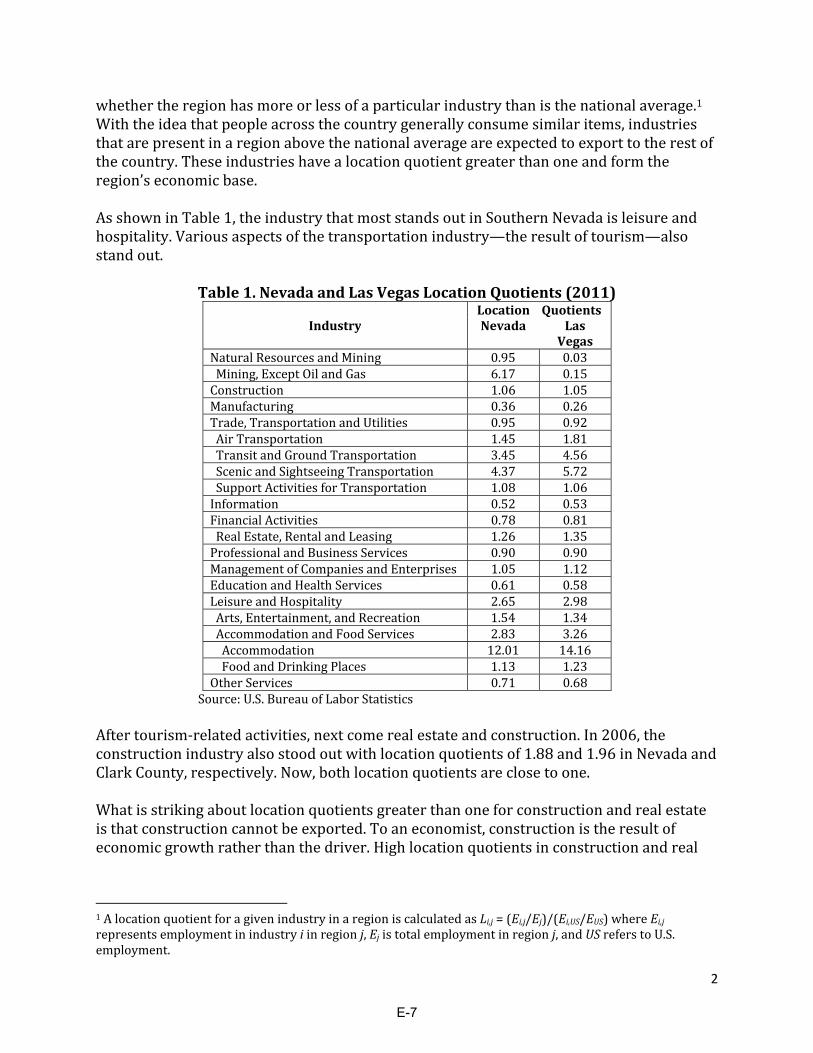
whethertheregionhasmoreorlessofaparticularindustrythanisthenationalaverage.1Withtheideathatpeopleacrossthecountrygenerallyconsumesimilaritems,industriesthatarepresentinaregionabovethenationalaverageareexpectedtoexporttotherestofthecountry.Theseindustrieshavealocationquotientgreaterthanoneandformtheregion’seconomicbase.AsshowninTable1,theindustrythatmoststandsoutinSouthernNevadaisleisureandhospitality.Variousaspectsofthetransportationindustry—theresultoftourism—alsostandout.
Table1.NevadaandLasVegasLocationQuotients(2011)Location Quotients
Industry Nevada LasVegas
NaturalResourcesandMining 0.95 0.03Mining,ExceptOilandGas 6.17 0.15Construction 1.06 1.05Manufacturing 0.36 0.26Trade,TransportationandUtilities 0.95 0.92AirTransportation 1.45 1.81TransitandGroundTransportation 3.45 4.56ScenicandSightseeingTransportation 4.37 5.72SupportActivitiesforTransportation 1.08 1.06Information 0.52 0.53FinancialActivities 0.78 0.81RealEstate,RentalandLeasing 1.26 1.35ProfessionalandBusinessServices 0.90 0.90ManagementofCompaniesandEnterprises 1.05 1.12EducationandHealthServices 0.61 0.58LeisureandHospitality 2.65 2.98Arts,Entertainment,andRecreation 1.54 1.34AccommodationandFoodServices 2.83 3.26Accommodation 12.01 14.16FoodandDrinkingPlaces 1.13 1.23OtherServices 0.71 0.68
Source:U.S.BureauofLaborStatisticsAftertourism‐relatedactivities,nextcomerealestateandconstruction.In2006,theconstructionindustryalsostoodoutwithlocationquotientsof1.88and1.96inNevadaandClarkCounty,respectively.Now,bothlocationquotientsareclosetoone.Whatisstrikingaboutlocationquotientsgreaterthanoneforconstructionandrealestateisthatconstructioncannotbeexported.Toaneconomist,constructionistheresultofeconomicgrowthratherthanthedriver.Highlocationquotientsinconstructionandreal
1AlocationquotientforagivenindustryinaregioniscalculatedasLi,j=(Ei,j/Ej)/(Ei,US/EUS)whereEi,jrepresentsemploymentinindustryiinregionj,Ejistotalemploymentinregionj,andUSreferstoU.S.employment.
E-7

3
estateresultfrombuildingboomsfueledbyrapidpopulationgrowth.Highlocationquotientsforconstructioncanonlybesustainedwhenthepopulationisgrowingrapidly.Overthepast50years,theUnitedStateshasseenageneraltrendofthepopulationandeconomicactivitymovingtotheWest.Theresumptionofthattrend,astheU.S.economyregainsitsfooting,shouldbenefitNevadaconstruction.Aregion’seconomicgrowthislargelyshapedbyitseconomicbase.Thatbaseisdeterminedbywhichoftheregion’ssectorsprovidegoodsorservicestopeoplefromotherpartsofthecountry.ForNevada,leisureandhospitalityandconstructionhavebeenthemostimportantcomponentsoftheeconomicbase.Asatouristdestination,Nevadaprovidesleisureandhospitalityservicestoitsvisitors.Theinclusionofconstructioninthestate’seconomicbasereflectsthestrongpullofpeoplerelocatingtoNevada.MostothersectorsintheNevadaeconomygoalongfortheride.2.2QuantifyingtheEconomicImpactofNewHomeConstructioninNevadaNewhomeconstructionisimportanttotheNevadaeconomy.Asbuildersprocurethesuppliesandlabortobuildanewhouse,theyprovideincomeforothers.Thosebusinessesandindividualsalsopurchasegoodsandservices.Astheprocesscascadesthroughtheeconomytheseadditionalspendingroundscreatemultipliereffects,sothattheconstructionofanew$220,000homeinNevadagenerates$401,790intotaleconomicactivityinthestateand3.19additionaljobs.Theseestimatesreflectmultipliereffects,quantifiedwithaNevadainput‐outputmodel.2.2.1RegionalEconomicMultipliersFigure1illustratesthemajordollarflowsofgoodsandservicesinanyeconomy.Theeconomicbaseforaregionismadeupofthebusinessesthatsellsomeoralloftheirgoodsandservicestobuyersoutsidetheregion.Theflowofproductsintoandoutofaregionisrepresentedbythetwoarrowsintheupperrightportionofthefigure.Toproducethegoodsandservicesfor“export”outsidetheregion,thebasicindustrypurchasesinputsfromoutsidetheregion,laborfromtheresidentsor“households”oftheregion,andinputsfromsupportfirmslocatedwithintheregion.Theflowoflabor,goods,andservicesintheregioniscompletedbyhouseholdsusingtheirearningstopurchasegoodsandservicesfromtheregion’seconomicbaseandsupportingindustries,andbythesupportingfirmspurchasinggoodsandservicesfromhouseholdsandotherindustriesbothwithinthesupportingsectorandfromtheexportsector.Asisevidentfromtheinterrelationshipsshowninthefigure,achangeinanyonesegmentofaregion’seconomyhasreverberationsthroughouttheentireeconomicsystemoftheregion.
E-8

4
Consider,forinstance,theimpactofnewhomeconstructiononeconomicactivityinNevada.Newhomeconstructionplaysasupportingroleinthestatebyprovidingdwellingsforhouseholdsthroughoutthestate.Inturn,thebuilderspurchasegoodsandservicesfromhouseholdsandothersupportfirmsintheregion.Thosefirmsandhouseholdsalsoengageinadditionalspending.Theseadditionalspendingroundscreatethemultipliereffectsthatareaddedtothehomebuilder’sdirectexpenditurestoassessthetotaleconomicimpactonitsregion.Thetotalregionaleconomicimpactofacompany’soperationconsistsofdirect,indirect,andinducedimpacts.Directimpactsaretheexpendituresofthefirmwithintheregion.Theindirectimpactsaretheadditionalroundsofspendingthatresultfromthefirmpurchasinggoodsandservicesfromotherfirmsintheregion.Theinducedimpactsaretheadditionalroundsofhouseholdspendingthatoccurbecausethefirmhiresemployeesandpayssalariesintheregion,andthosehouseholdsbuygoodsandservices.Multipliereffectsarereducedasexpendituresleakfromtheregionthroughimports.Multipliereffectsareinitiatedastheregionisabletoprovideexports.Multipliereffectscanbesustainedovermanyyearsbutaretypicallymeasuredoveraone‐totwo‐yearperiod.Asupportcompany—suchasahomebuilder—alsoprovidesgoodsandservicesthatfacilitatethedirecteconomicactivityofotherfirmswithinitsserviceregion.Thedirecteconomicactivityfacilitatedbyasupportcompanydependsonwhatpercentageofthepurchasingfirms’salesisprovidedbythesupportcompanies.Thetotalregionalimpactof
E-9

5
thefacilitatedeconomicactivity—suchasthebusinessesandresidencessupportedwithelectricpower—includesthedirect,indirect,andinducedeffects.2.2.2QuantifyingRegionalEconomicEffects Toquantifytheregionaleconomiceffectsofchangesinoutputproducedbyaregion’sfirms,economistsuseinput‐outputanalysis.Thestructureofaninput‐outputmodelrelatestheproductionineveryindustrytotheinputsitpurchasesfromotherindustriesandfromhouseholds.Ininput‐outputanalysis,productionineveryindustryisspecified,sothatitsoutputanduseofinputsscaleupordownproportionally.Foraregionaleconomy,therelationshipbetweeneachofthesectorsinaregionwithNindustriescanbedescribedwithaninput‐outputmatrixasshowninTable2.Table2.Input‐OutputMatrix
Input Output I II III … N H
I a11 a12 a13 … a14 a1h II a21 a22 a23 … a24 a2h III a31 a32 a33 … a3n a3h ⋮ ⋮ ⋮ ⋮ ⋮ ⋮ N an1 an2 an3 … ann anh H ah1 ah2 ah3 ahh ahh
Inthematrix,eachaijrepresentsthepurchasesthatindustryjmakesfromindustryiforeach$1ofoutputitproduces,eachahjrepresentsthepurchasesthatindustryjmakesfromhouseholdsforeach$1ofoutputitproduces,eachaihrepresentsthepurchasesthathouseholdsmakefromindustryiforeach$1ofincomereceived,andahhrepresents(unreported)transactionsbetweenhouseholds.Coefficientssuchasthesealsocanbeusedtodeterminethesizeofindustryjthatissupportedbyeach$1ofgoodssuppliedtothatindustrybyindustryi.Forastate,suchasNevada,thatcarriesonextensivetradewithotherregionsofthecountry,someofthepurchasesmadebyfirmsorhouseholdsgotofirmsorhouseholdsoutsidetheregion,andthecoefficientsinanycolumnsumtolessthanone.2Ifthefirstindustryistoproduceenoughoutputtomeetthedemandforeachoftheotherindustriesandhouseholdsinitsregionplustheexportdemandforitsoutput,itsproductionisasfollows:
⋯ ; 2Thesumofcoefficientsacrossarowisdevoidofeconomicmeaning.
E-10
6
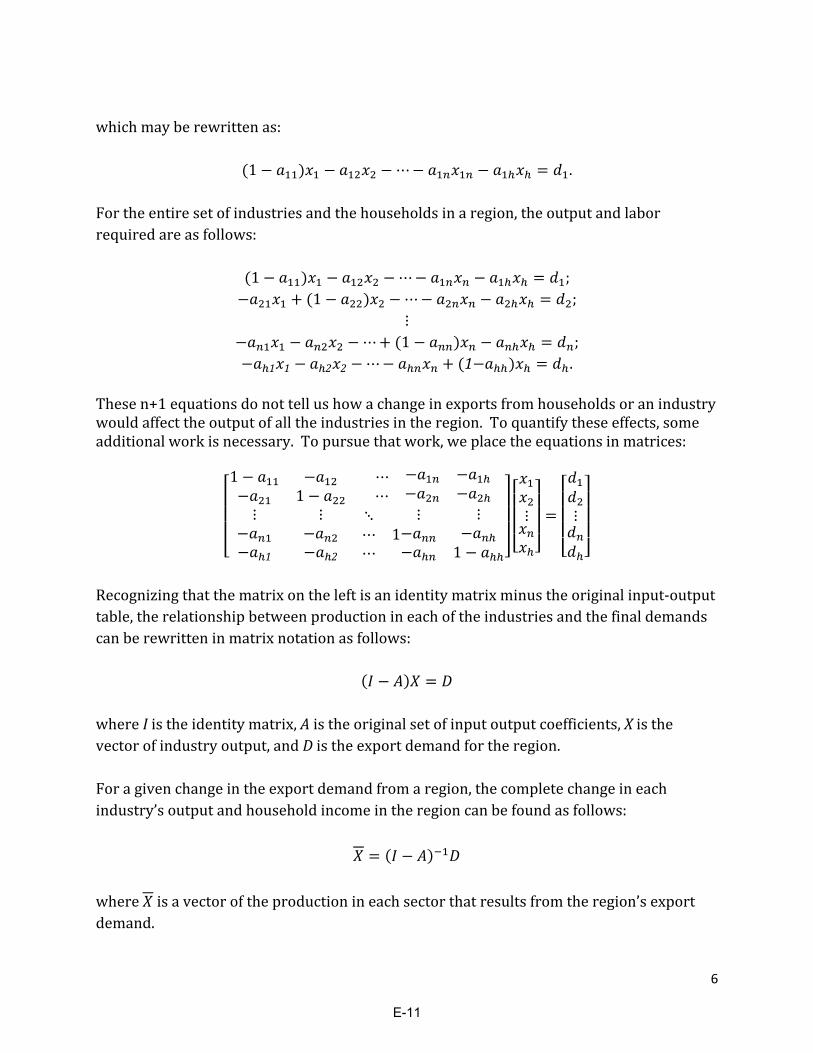
whichmayberewrittenas:
1 ⋯ .Fortheentiresetofindustriesandthehouseholdsinaregion,theoutputandlaborrequiredareasfollows:
1 ⋯ ;1 ⋯ ;
⋮⋯ 1 ;
1 1 2 2 ⋯ 1 .Thesen+1equationsdonottellushowachangeinexportsfromhouseholdsoranindustrywouldaffecttheoutputofalltheindustriesintheregion.Toquantifytheseeffects,someadditionalworkisnecessary.Topursuethatwork,weplacetheequationsinmatrices:
1 ⋯1 ⋯
⋮
1
⋮
2
⋱⋯⋯
1⋮ ⋮
1
⋮ ⋮
Recognizingthatthematrixontheleftisanidentitymatrixminustheoriginalinput‐outputtable,therelationshipbetweenproductionineachoftheindustriesandthefinaldemandscanberewritteninmatrixnotationasfollows:
whereIistheidentitymatrix,Aistheoriginalsetofinputoutputcoefficients,Xisthevectorofindustryoutput,andDistheexportdemandfortheregion.Foragivenchangeintheexportdemandfromaregion,thecompletechangeineachindustry’soutputandhouseholdincomeintheregioncanbefoundasfollows:
where isavectoroftheproductionineachsectorthatresultsfromtheregion’sexportdemand.
E-11

7
2.2.3Single‐IndustryMultiplierEffectsMultipliereffectsforasingleindustryarefoundbyspecifyingachangeintheexogenousdemandforoutputfromthatindustry.Theinput‐outputrelationshipsareusedtoquantifytheadditionalspendingroundsthatyieldincreasedoutputineveryindustry.Thesumofthechangeinfinaldemandplustheadditionaloutputineachindustrythatresultsfromthespendingroundsisdividedbythechangeinfinaldemandtoyieldthemultipliereffect:
/ .
Suchmultiplierscanbeusedtoquantifytheeconomicimpactoffirmsinaparticularindustryorofindividualconstructionprojects.2.2.4QuantifyingtheEconomicImpactofNewHomeConstructioninNevadaToquantifytheeconomicimpactofnewhomeconstructioninNevada,weemployRIMSII,aninput‐outputmodeldevelopedbytheU.S.BureauofEconomicAnalysis.TheRIMSIIinput‐outputmodeltakesintoaccountthenumerouscomplexinteractionsinaneconomythatflowfromtheinitialspendingtocreateindirectandinducedeffects.Themodelallowsustocalculatetheoutput,compensation,andemploymentinNevadathatresultfromtheconstructionandsaleofanewhome.AsshowninTable3,theconstructionofa$220,000homeinNevadagenerates$401,790intotaloutputforNevada,foramultipliereffectof1.83.Thenewhomeconstructionalsogeneratesanincreaseintotallaborcompensationof$120,056and3.19newjobs.Ofthosejobs,1.68arethedirectresultofthenewhome’sconstructionandsale.Largerorsmallerhomebuildingprojectswouldgenerallyyieldresultsthatcanbescaledupordownproportionally. Table3.EconomicImpactofBuildinga$220,000HomeinNevada
OutputLabor
Compensation EmploymentDirectEffects $220,000 $67,736 1.68jobs
TotalEffects $401,790 $120,056 3.19jobs
Multiplier: 1.83 1.77 1.90
2.3TheHousingCollapseintheWestThehousingmarketcollapsewasoneofthemajorcontributorstofallingemploymentintheWest.Inaddition,slownationaleconomicgrowthandhomeownerswithnegative
E-12

8
equitythroughoutthenationslowedthepopulationshiftfromtheNortheastandMidwesttotheWest.Togetherthesefactorsshiftedthewesternstates’economiesfromthefamiliarpositionofleadingeconomicgrowthtotheunfamiliarpositionofleadingthedecline.AsshowninTable4,Nevada’sconstructionsectorhasnotperformednearlyaswellasitsnationalcounterpartsincetheprerecessionpeak.Hadthissectorperformedaswellasitsnationalcounterpartduringtherecessionandrecovery,itwouldaccountforanadditional54,600jobsinNevada.Allowingformultipliereffectsyieldsanadditional52,416jobsstatewide,foratotalofabout107,016.
Table4.PercentChangeinEmployment(PrerecessionPeaktoPresent)
IndustryUnitedStates Nevada
TotalNonfarmEmployment ‐3.02 ‐11.21NaturalResourcesandMining 11.66 35.00Construction ‐28.63* ‐66.33*Manufacturing ‐12.89 ‐24.19Trade,TransportationandPublicUtilities
‐4.38 ‐5.90
InformationServices ‐12.93 ‐16.99FinancialActivities ‐5.52 ‐17.06ProfessionalandBusinessServices 0.02 ‐10.41EducationandHealthServices 9.93 16.29LeisureandHospitality 1.33 ‐4.87OtherPrivateServices ‐2.26 ‐8.82Government ‐1.85 ‐6.50
Source:U.S.BureauofLaborStatisticsandauthors’calculations*Asmeasuredfromownpeakin2006With107,016additionaljobs,Nevada’semploymentwouldbeabout1,255,216,whichisonly2.9percentbelowthestate’sprerecessionpeakemploymentof1,293,100.ThesefiguressuggestthatthedeeprecessionandsloweconomicgrowthinNevadaarelargelytheresultofweaknessinthestate’sconstructionsector.Hadthissectorachievedthesameperformanceasitsnationalcounterpart,Nevadawouldbeseeingastrongereconomicperformance.Hence,wecanattributemuchoftheweaknessoftheNevadaeconomytotheinterruptionofthegreatwestwardmovementcausedbytheU.S.recessionandtotheoverbuildingthatoccurredinNevadaduringthenation’s2000‐07realestateboom.Since2007,Nevada’sconstructionsectorhasbeenhamperedbyslowpopulationgrowthandasizablesurplusofhousingandcommercialspace.3.OutlookfortheNevadaHousingMarketThegoodnewsisthatNevada’seconomyhasbeenimproving,albeitslowly.Asmightbeexpected,muchofthestrengthiscomingfromthetourism,gaming,andhospitalitysectors.Constructioncontinuestoshowsignsofcomingoffthebottom.
E-13

9
ThebadnewsisthattheslowdownintheU.S.economy,theEuropeanrecession,andtheslowdownintheAsianeconomieshavemadethemselvesevidentasslowergrowthintourism,gaming,andhospitality.Nevadacontinuestoseefinancialheadwinds,anditsrealestatemarketshavealongwaytogobeforethestateseesastrongrecoveryinconstruction.AstheU.S.economyacceleratesandeconomicconditionsimproveintheWest,wecanexpecttoseerenewedvigorintheNevadaeconomy.Suchanaccelerationisnotlikelytooccuruntilthesecondhalfof2013.3.1CurrentStatusoftheNevadaHousingMarketAccordingtotheCase‐Shillerindex,housingpricesintheLasVegasmetropolitanareaandtheUnitedStatesbothhitbottominJanuary2012(Chart1).3LasVegashousepriceshaverisenby9.6percentsincethen.U.S.housingpriceshaverisenonly5.4percent.Thebigdifferencewasinthedecline.LasVegashousingpricesfellby61.1percentfromJanuary2007toJanuary2012.Duringthatperiodoftime,U.S.housingpricesfellbyonly32.9percent.Chart1:Case‐ShillerHomePriceIndexes
3TheCase‐Shillerindexisconsideredoneofthebettermeasuresofhousingpricesbecauseitusespricesfromrepeatsales,whichmoreaccuratelycapturesqualitythanamorecommonlyusedmeasure,suchasmedianhomeprices.
E-14

10
AsshowninChart2,thenationwidehousingboomtookLasVegashousingpricesupwardby231.0percentfrom2000to2006.Overthatsameperiod,housingpricesthroughouttheWestroseby91.5percent,andU.S.housingpricesroseby60.0percent.Chart2:MedianHomePrices
Source:NationalAssociationofRealtors
ThedeclineinhousingpricesalsowasdramaticinNevada.Inthirdquarter2012,housingpricesinLasVegaswereaboutwheretheywerein2000.FortheWestasawhole,housingpriceswere35.2percenthigherinthirdquarter2012thanin2000.FortheUnitedStatesasawhole,thecomparablefigurewas33.9percent.Inaddition,medianpricesforexistinghomesinClarkCountydroppedmorethanthosefornewhomesduringthedecline.Theyalsorosemuchmoresharplyinrecentmonths.Pricesfornewhomesaretetheredbyconstructioncosts,butpricesforexistinghomesarenot.3.2ProspectsforaHousingMarketRecoveryThetimingoftherecoveryintheLasVegashousingmarketmatchesthatoftheU.S.housingmarket.TheU.S.housingmarketiscomingintobalance(Chart3).Basedonrecentsales,thecurrenthouseslistedontheU.S.marketprovideonlyabout4.5monthsofsupply,whichiswellbelowthehistoricaverageof6.2months.BackinApril2010,thehomebuyertaxcredittemporarilypushedthesupplyofhousesdownto6.2months.Nothingsimilaris
E-15

11
atworktoday.Weareseeingmarket‐drivendeclinesinthesupplyofhouses,whichsuggestthathomepricesarelikelytocontinuerisingnationwide.Chart3:U.S.HousingMarketTightening
Sources:U.S.CensusBureau;NationalBureauofEconomicResearch3.3TheNevadaHousingMarketRecoveryAlackofavailablesupplyalsoispushinguppricesforsingle‐familyhomesinLasVegas.Forlistedhomes,themonthsofsupplyisdownto5.6(Chart4).Thedeclineiscomingfromalackoflistings.Inaddition,only38.3percentofthelistingsarevacant.PricesbeganrisinginLasVegaswhenthemonthsofsupplyfellbelow6.2.In2006,pricesdidn’tbeginslippinguntilmonthsofsupplyroseabove7.3.Probably,thebuilt‐upmomentumcarriedLasVegashomepricesupwardevenafterexcesssupplieswerebecomingevident.Althoughweareseeingsomegainsinresidentialconstruction,buildersaren’tyetrushingintotheLasVegasmarket.Despiterecentgains,pricesforexistinghomesarebelowconstructioncosts.Pricesforexistinghomesprobablyneedtoriseabout25percentfromcurrentlevelsbeforehomebuyersfindnewhomesmuchmoreattractivethanexistinghomes.
E-16

12
Chart4:LasVegasMonthsofSupplyandHousePrices
Sources:Standard&Poor’s;GreaterLasVegasAssociationofRealtors;ResidentialResources;NationalAssociationofRealtors;CenterforBusinessandEconomicResearch,UNLVManyNevadahomeownersstillhavenegativeequity.Asofsecondquarter2012,58.6percenthadnegativeequity(Chart5).Another5.0percentwereclosetoanegativeequityposition.Thesedevelopmentsrepresentaslightimprovementoverfirstquarter2012.Inthatquarter,61.2percentofthehomeownersinNevadahadnegativeequity,andanother4.9percentwereclosetoanegativeequityposition.Atmorethan2½timesthenationalaverageof22.3percent,Nevadaremainsthestatewiththehighestpercentageofhomeownersinanegativeequityposition.OtherstatesroundingoutthetopsixincludeFlorida,Arizona,Georgia,Michigan,andCaliforniaat42.7percent,39.7percent,35.8percent,32.8percent,and29.0percent,respectively.Atthenationallevel,delinquenciesonrealestateloansarefalling,whichisanindicationthatweareseeingaresolutionofthenationalrealestatecrisis.Theimprovementsareconcentratedincommercialrealestate,however.TherewillhavetobeimprovementsinNevadans’equitybeforeafullrecovery.
E-17

13
Chart5:NevadaHomeownerswithNegativeEquity
Source:CoreLogic®LowhousingpricescanhelpfosterNevada’seconomicrecovery.AccordingtotheHousingOpportunityIndex,whichconsidersbothpriceandincome,LasVegashousingismoreaffordablethanthenationalaverage(Chart6).Inthe1990sandearly2000s,LasVegashadhousingthatwasquiteaffordablebynationalstandards—whichhelpedpropelitsgrowth.By2006,LasVegaslostthatadvantage.Althoughwetendtothinkoflowhousingpricesasindicativeofadepressedmarket,lowhousingpriceswillhelptheNevadaeconomygrow.Affordablehousingisoneoftheprimaryreasonsthatmanylong‐termforecastsshowstrongpopulationgainsfortheregion,someofwhicharedrivenbyprojectedretirements.
E-18

14
Chart6:HousingOpportunityIndex
Source:NationalAssociationofHomeBuilders
E-19

15
4.ObstaclestoRecoveryAlthoughNevada’shousingmarketisbeginningtoshowearlysignsoflife,therearestillpotentialbarrierstoafullrecovery.InthissectionweaddressthoseobstaclesandpossiblesolutionstofurtheraccelerategrowthinthehousingmarketandNevada’seconomy.4.1ExcessHousingSupplyInsection3.3,weexaminedhowalowsupplyofhouseshasdrivenhomepricesupward.ManypeopleremainconcernedaboutashadowinventorythatcontinuestooverhangtheLasVegashousingmarket.FiguresfromClarkCountyComprehensivePlanningplacethemonthsofsupplyofvacanthomes—includinglistedandunlistedhomes—at14.7.Addtothathomesinforeclosureandhomeownerswhoareinarrearsontheirmortgages,andthepotentialmonthsofsupplyareabout20(Chart7).Withbankstakinganorderlyapproachtoforeclosure,however,theseexcesssuppliesseemmorelikelytobedribbledratherthanfloodedontothemarket.Chart7:LasVegasMonthsofSupplyandHousePrices
Sources:Standard&Poor’s;GreaterLasVegasAssociationofRealtors;ResidentialResources;NationalAssociationofRealtors;CenterforBusinessandEconomicResearch,UNLV
E-20
16
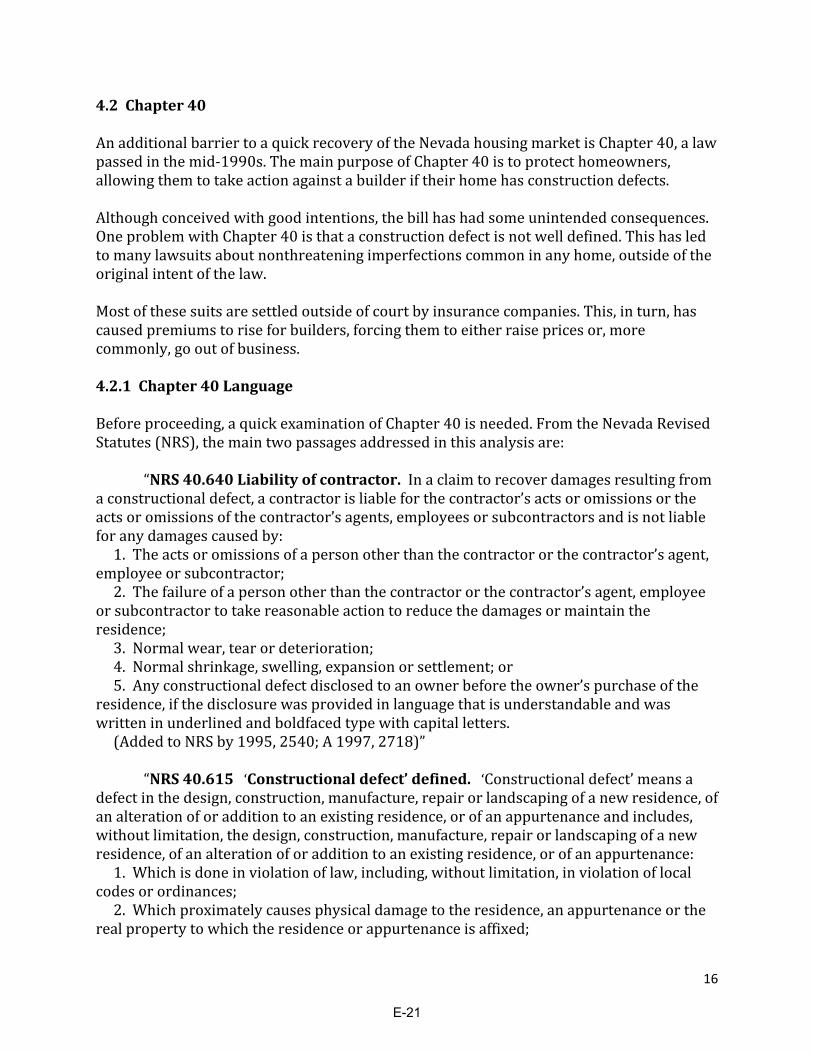
4.2Chapter40AnadditionalbarriertoaquickrecoveryoftheNevadahousingmarketisChapter40,alawpassedinthemid‐1990s.ThemainpurposeofChapter40istoprotecthomeowners,allowingthemtotakeactionagainstabuilderiftheirhomehasconstructiondefects.Althoughconceivedwithgoodintentions,thebillhashadsomeunintendedconsequences.OneproblemwithChapter40isthataconstructiondefectisnotwelldefined.Thishasledtomanylawsuitsaboutnonthreateningimperfectionscommoninanyhome,outsideoftheoriginalintentofthelaw.Mostofthesesuitsaresettledoutsideofcourtbyinsurancecompanies.This,inturn,hascausedpremiumstoriseforbuilders,forcingthemtoeitherraisepricesor,morecommonly,gooutofbusiness.4.2.1Chapter40LanguageBeforeproceeding,aquickexaminationofChapter40isneeded.FromtheNevadaRevisedStatutes(NRS),themaintwopassagesaddressedinthisanalysisare: “NRS40.640Liabilityofcontractor.Inaclaimtorecoverdamagesresultingfromaconstructionaldefect,acontractorisliableforthecontractor’sactsoromissionsortheactsoromissionsofthecontractor’sagents,employeesorsubcontractorsandisnotliableforanydamagescausedby:1.Theactsoromissionsofapersonotherthanthecontractororthecontractor’sagent,employeeorsubcontractor;2.Thefailureofapersonotherthanthecontractororthecontractor’sagent,employeeorsubcontractortotakereasonableactiontoreducethedamagesormaintaintheresidence;3.Normalwear,tearordeterioration;4.Normalshrinkage,swelling,expansionorsettlement;or5.Anyconstructionaldefectdisclosedtoanownerbeforetheowner’spurchaseoftheresidence,ifthedisclosurewasprovidedinlanguagethatisunderstandableandwaswritteninunderlinedandboldfacedtypewithcapitalletters.(AddedtoNRSby1995,2540;A1997,2718)” “NRS40.615‘Constructionaldefect’defined.‘Constructionaldefect’meansadefectinthedesign,construction,manufacture,repairorlandscapingofanewresidence,ofanalterationoforadditiontoanexistingresidence,orofanappurtenanceandincludes,withoutlimitation,thedesign,construction,manufacture,repairorlandscapingofanewresidence,ofanalterationoforadditiontoanexistingresidence,orofanappurtenance:1.Whichisdoneinviolationoflaw,including,withoutlimitation,inviolationoflocalcodesorordinances;2.Whichproximatelycausesphysicaldamagetotheresidence,anappurtenanceortherealpropertytowhichtheresidenceorappurtenanceisaffixed;
E-21

17
3.Whichisnotcompletedinagoodandworkmanlikemannerinaccordancewiththegenerallyacceptedstandardofcareintheindustryforthattypeofdesign,construction,manufacture,repairorlandscaping;or4.Whichpresentsanunreasonableriskofinjurytoapersonorproperty.(AddedtoNRSby1995,2539;A2003,2041)”ThelanguageinwhichaconstructionaldefectisdefinedinNRS40.615,specificallypointnumberthree,allowsforavarietyoflawsuitsoutsidetherealmofactualnegligence.4.2.2TheEffectsofChapter40onNevada’sHousingMarketToillustratetheeffectsofChapter40onNevada’shousingmarket,wecollecteddatafrom2000to2012fromfourdifferentfirms,someofwhichoperateinmultiplestates.Weconcentrateonthreevariables:numberofclosings,numberofclaims,andsettlementcostsonanannualbasis.Tostart,considerthedataforNevadaonly.AsshowninChart8,thenumberofclosingsdroppedby86.0percentinNevadasincethepeak.Inthissametimeperiod,thenumberofclaimsandthecostsofsettlementsincreasedby355.0and80.0percent,respectively.Chart8:Closings,Claims,andSettlementCostsinNevada
E-22

18
ComparethistoCalifornia(Chart9),whichhasalessthanidealhousingmarket.Sincethecollapse,thenumberofclosingswereonadownwardtrend,muchlikeNevada(downby87.0percent),butthatiswherethesimilarityends.UnlikeNevada,inCalifornia,settlementcostshadbeenonadownwardtrend,decreasingby83.0percent,muchlikewewouldexpectwithadwindlingnumberofclosings.Thenumberofclaimswasrelativelyflatoverthetimeperiod.Chart9:Closings,Claims,andSettlementCostsinCalifornia
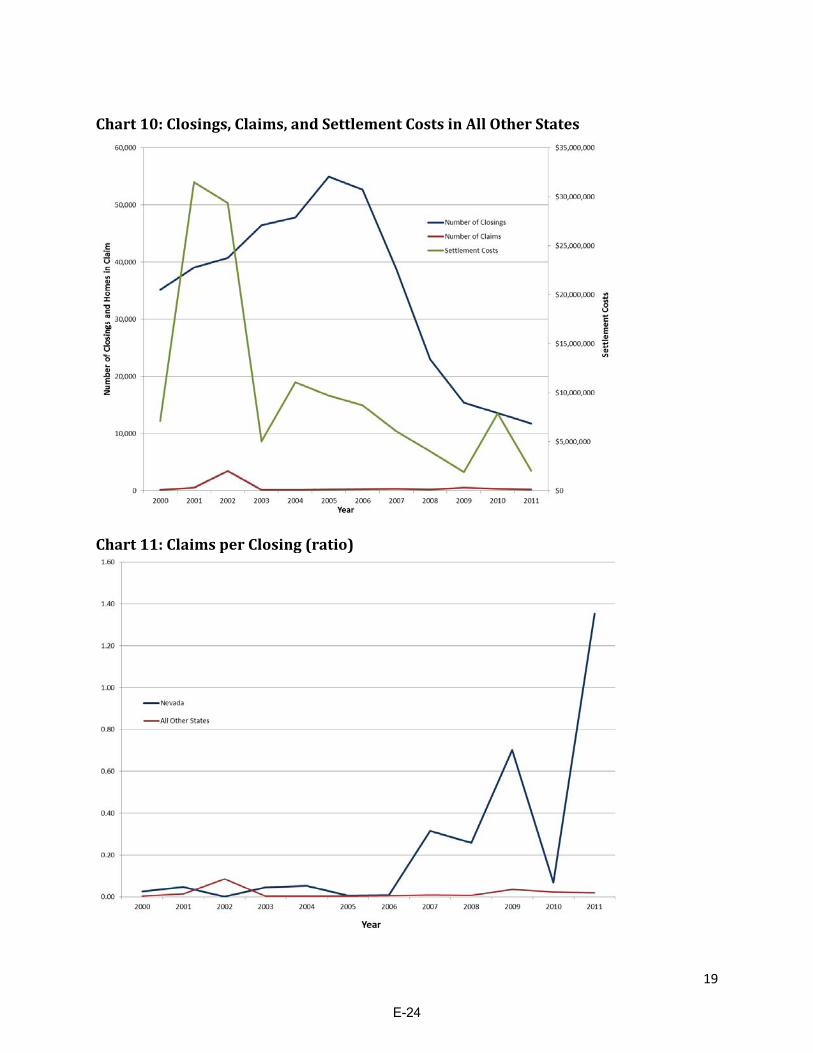
Lastly,Chart10showsthenumberofclosings,thenumberofclaims,andthesettlementcostsforthefirmsforallstatesotherthanNevadaandCalifornia.ThetrendsinthischartaresimilartothoseforCalifornia,withthenumberofclosingsandsettlementcostsdecreasingby79.0percenteach.Thenumberofclaimsissomewhatconstant.InChart11,wepresentthenumberofclaimsperclosinginNevadaversusallotherstates.WecanseethatthenumberofclaimsperclosinginNevadawassignificantlyhigherthaninallotherstatessince2006.NevadaistheonlystatewithalawwrittenlikeChapter40.In2011,thenumberofclaimsperclosingreached1.35inNevada.Fortheaverageofotherstates,thehighestratiowas0.035claimsperclosing.
E-23
19
Chart10:Closings,Claims,andSettlementCostsinAllOtherStates
Chart11:ClaimsperClosing(ratio)
E-24

20
4.2.3WhoPaysforHigherBuildingDefectClaimsinNevada?Asmightbeexpected,increasesinclaimsforbuildingdefectshaveledsomeinsurancecompaniestoexittheNevadahomebuilderliabilitymarket,andthoseremainingtochargemuchhigherpremiums.Accordingtoindustrysources,Nevadapremiumsareabout85percentofCalifornia’s.Inmorecompetitivewesternstates,suchasArizonaandTexas,thepremiumsarelessthan50percentofCalifornia’s.Thesebuilder‐incurredpremiumsarepassedontotheconsumersintheformofhigherpricesfornewhomes.Higherinsurancepremiumsalsomayhavereducedcompetitionamongbuildersbecausemanyofthelargebuildersareabletoselfinsure.From2000to2012,themarketshareclaimedbythetoptenbuildersinNevadarosefrom36.0to78.0percent(Table5).Incontrast,BuilderMagazine’sannual“Builder100”publication,foundthetoptenbuildersintheUnitedStatesaccountedforabout25percentofthemarketin2010and2011.Similareffectshavebeenreportedforsubcontractors.AlackofcompetitionintheNevadahousingmarketlikelymeanshighercoststotheconsumers.Table5:Top10Builders’MarketShare–NevadaYear TotalPermits Top10Builders’Permits MarketShare
1998 20,595 9,216 45%
1999 19,849 9,194 46%
2000 20,410 7,287 36%
2001 21,216 10,521 50%
2002 22,050 12,154 55%
2003 25,213 15,508 62%
2004 32,879 18,816 57%
2005 31,010 19,073 62%
2006 23,219 14,474 62%
2007 14,510 8,040 55%
2008 6,129 4,024 66%
2009 3,850 3,066 80%
2010 4,550 3,363 74%
2011 3,732 2,929 78%
2012 5,027 3,939 78%Source:HomeBuildersResearch4.3.3RevisingChapter40andtheNevadaHousingMarketRecoveryBecauseChapter40hasthedemonstratedeffectofincreasingthepricesthatconsumerspayfornewhomes,itlikelyhasslowedtherecoveryinNevadahomeconstruction,andbyextension,thestate’seconomicgrowth.Withoutrevisionstothelaw,Nevadahomebuilderscouldseecontinuallyrisingclaimsandcosts.Theseescalatingclaimsandsettlementcostsarelikelytoleadtohigherinsurancepremiumsforbuilders,fewerbuildersandhigherpricesforhomes.
E-25

21
Ultimately,areworkedChapter40couldhelpfosterstrongereconomicgrowthinNevadabyreducingthecostsofbuildingnewhomes.Builderliabilityinsurancepremiumswouldbereducedastheprospectsforclaimsarereduced.Insurerswouldreenterthemarket.Withinsurancemorewidelyavailableandatalowercost,smallbuilderswouldbeencouragedtoenterthemarket.Theincreasedcompetitionwoulddrivedownthecostofnewhomeconstruction.5.ConclusionsMuchofthestrainontheNevadaeconomyduringtheGreatRecessioncamefromtheburstofthehousingbubblebecauserealestateandconstructionarebothvitaltothehealthofNevada’seconomy.Whilegrowingtourismandhospitalityhasledtosomeimprovement,Nevadaisbehindamajorityofthecountryinachievingafulleconomicrecovery,mostlytheresultofweakrealestateandconstructionsectors.ThemostrecentdatasuggestthatweareintheearlystagesofahousingmarketrecoveryinNevada.Therealestatemarket,however,hasasubstantialoverhangofresidentialandcommercialproperty.Intheresidentialmarket,littleofthatsupplyisonthemarket.Theresulthasbeenmoderategainsinresidentialrealestateprices.Withtheoverhangonlylikelytobedribbledonthemarketataslowrate,residentialhousingpricescanbeexpectedtocontinuerising.Afteraboutsixyearsofsliding,SouthernNevadahousingpricesareontherise.Mostconsiderthatagoodsign.Alackofsupplyiscontributingtotherise,andpriceslooksettoincreaseoverthenextfewyearsastheSouthernNevadaeconomyimproves.Nonetheless,theoverhangofpropertyheldinweakhandscoulddampenanyacceleration.Inaddition,theincreaseinclaimsandsettlementcostsmadepossibleunderChapter40islikelytopostponethegainsinconstructionbyaddingtothecostsofnewhomeconstruction
E-26

E-27