palestinian economic prospects - world...
TRANSCRIPT

Palestinian Economic Prospects: Gaza Recovery and West Bank Revival
Economic Monitoring Report to the Ad Hoc Liaison Committee June 8, 2009
The World Bank www.worldbank.org/ps

Palestinian Economic Prospects: Gaza Recovery and West Bank Revival
Contents Acronyms ................................................................................................................................ 4
2
5
8
9
9
11
14
14
14
17
21
22
24
25
28
1. Executive Summary ......................................................................................................... 2. Recent Political Events .................................................................................................... 3. Recent Economic Developments .....................................................................................
A. Macroeconomic Outlook ........................................................................................
B. Private Sector Prospects ....................................................................................... 4. Parallel Actions towards Gaza Reconstruction and West Bank Revival.......................
A. Palestinian Authority ............................................................................................
A.1. Fiscal Developments in 2008...................................................................
A.2. Fiscal Outlook for 2009 ...........................................................................
B. Israel......................................................................................................................
B.1. Gaza Closure............................................................................................
B.2. The Implications of Restricting Entry of Cash into Gaza .......................
B.3. West Bank Movement and Access ..........................................................
B.4. Sectoral Implications of Israeli Economic Restrictions...........................
a. Land.................................................................................................. 28
b. Telecommunications ........................................................................ 29
c. Trade................................................................................................. 30
d. Water ................................................................................................ 31
e. Health ............................................................................................... 32
f. Gender .............................................................................................. 32
34
C. Donor Community ................................................................................................

Economic Monitoring Report to the Ad Hoc Liaison Committee
3
39
40
42
12
16
18
35
37
9
20
23
23
26
33
35
5. Concluding Remarks...................................................................................................... Annex 1 Palestinian Authority Expenditures by Function (Commitment Basis) January-
December 2008 ..................................................................................................... References ............................................................................................................................. List of Tables Table 1: Industrial decline in Gaza........................................................................................ Table 2: Palestinian Authority 2008 expenditures by functional and economic classification (commitment basis), percentage share ............................................................ Table 3: Palestinian Authority's external financing requirements, 2009 .............................. Table 4: UN Gaza Flash Appeal............................................................................................ Table 5: Pledges at Gaza Conference, Sharm el-Sheikh, March 2, 2009 ............................. List of Figures Figure 1: Per capita GDP in West Bank and Gaza, 1997-2008 ............................................. Figure 2: Estimated cost of early recovery interventions in Gaza, by sector........................ Figure 3: Monthly number of truckloads entering through Gaza crossings.......................... Figure 4: Weekly total wheat flour stocks at Gaza mills ...................................................... Figure 5: New housing units in settlements, 2001-2008....................................................... Figure 6: Palestinian access to health facilities in West Bank .............................................. Figure 7: Consolidated Appeals Process ...............................................................................

Palestinian Economic Prospects: Gaza Recovery and West Bank Revival
Acronyms AHLC Ad Hoc Liaison Committee CAP Consolidated Appeals Process CPI Consumer Price Index CPA Crossing Point Authority GERRNA Gaza Early Recovery Rapid Needs Assessment GoI Government of Israel IMF International Monetary Fund JSET Joint Supervision Team JWC Joint Water Committee MoF Ministry of Finance MITT Ministry of Information Technologies and Telecommunications M&A Movement and Access NIS New Israeli Shekel NGO Non-governmental organization OQR Office of Quartet Representative OCHA Office for the Coordination of Humanitarian Affairs PA Palestinian Authority PCBS Palestinian Central Bureau of Statistics PIF Palestinian Investment Fund PMA Palestinian Monetary Authority PRDP Palestinian Reform and Development Plan PalTrade Palestinian Trade Center PCNA Post-Conflict Needs Assessment PFM Public Financial Management QIP Quick-Impact Project UN United Nations VoIP Voice over Internet Protocol WB&G West Bank and Gaza
4

Economic Monitoring Report to the Ad Hoc Liaison Committee
5
1. Executive Summary
Budget support remains indispensable to allow the Palestinian Authority to continue to provide basic services -- and is also an appropriate instrument given the PA’s good performance in public sector management. Improvements in security in the West Bank have not yet translated into increases in private sector activities -- and Quick-Impact Projects have not yet delivered tangible results. The large sums of money pledged at the International Conference in Support of the Palestinian Economy for the Reconstruction of Gaza (Sharm El-Sheikh March 2, 2009) have not yet translated into tangible progress towards reconstruction of Gaza due to the extreme closure regime it is under.
1.1 In its report to the September 22, 2008 meeting of the Ad Hoc Liaison Committee (AHLC), the World Bank noted that the Palestinian Authority (PA), Israel, and the international donor community made some progress on the three parallel conditions for Palestinian economic revival, albeit to different degrees: the PA had continued in its path of fiscal and security reform; donors had provided substantial amounts of aid, but the uncertainty of flows made it difficult for the PA to plan its finances; and Israel had announced, and in some cases implemented, a series of steps to remove physical obstacles within the West Bank, which would only have an impact insofar as the number and the scope of the restrictions being addressed were scaled up significantly. 1.2 This report reviews actions taken in these fields since the September 2008 AHLC meeting. The report notes the dramatic impact of Israel’s recent three-week offensive in Gaza and analyzes the variety of recovery and reconstruction schemes being explored by the donor community. We find that these have not yet led to any significant impact on the ground due to the continued closure imposed on Gaza. The devastation in Gaza, coupled with a fluid political environment in both the PA and Israel, has made it necessary for this report to revisit the fundamentals of donor support to the PA in view of the long-term goal of establishing an economically viable Palestinian state independent of external aid. Examination through this lens reveals a fundamentally flawed picture. 1.3 Real GDP growth in 2008 is estimated at about 2 percent, which translates to an almost 1 percent decline in real per capita terms. Recent experience in other countries has shown that economies entering a post-conflict period can expect double-digit rates of growth – at least in the initial years. In some respects, the West Bank economy is better equipped than many post-conflict economies for rapid growth. Among other things, there has been a series of Quick-Impact Projects (QIPs) designed to attract private sector investment and thereby jump-start and catalyze economic activity. The fact that the West Bank economy is dramatically failing to fulfill its potential, even in periods of relative stability in the security situation, only underlines the extent to which economic restrictions are still preventing any real upturn in economic activity.

Palestinian Economic Prospects: Gaza Recovery and West Bank Revival
1.4 Indeed, the post-conflict economic booms in other countries were mostly not hampered by the extreme restrictions facing the Palestinian private sector today. Very few economies have faced such a comprehensive array of obstacles to investment -- not just of physical impediments to movement, but also comprehensive institutional and administrative barriers to economies of scale and natural resources, along with an unclear political horizon and the inability to predictably plan movement of people and goods. This report shows that progress in the relaxation of these restrictions during 2008 has been marginal at best. As a result of the Israeli security regime, the Palestinian economy has hollowed out, with the productive sectors declining and the public sector growing, as more of the population looks to the public sector for employment and assistance in coping with the impact of unemployment. The PA’s wage bill alone is equivalent to 22 percent of GDP1. The result is a growing dependency on donor aid for the prevention of fiscal collapse. In 2008, external aid to the PA amounted to nearly 30 percent of GDP. 1.5 In this policy environment and pending a political resolution to the conflict, aid should be recognized for what it is -- more of a stabilizing measure, slowing down socio-economic decline, than a catalyst for sustainable economic development. Large amounts of donor aid have produced insignificant growth and an increase in economic dependency, despite the consistent improvement in PA governance and security performance described in this report. If this trend is to be reversed, donor funding needs to be accompanied by efforts to improve the environment for private sector growth by reducing the economic restrictions regime. 1.6 Even under the most extreme of circumstances, however, some fundamental truths remain clear and donors should be wary of steps that undermine them. First, fiscal and monetary stability and a functional PA are key to exploiting the economic potential of West Bank and Gaza (WB&G) when it becomes possible and to continuing provision of basic services in the immediate term. Therefore, neglect of PA budget support and bypassing of PA institutions in disbursement of aid is counterproductive, particularly given the PA’s good performance in public financial management (PFM), as shown in this report. This is also true for Gaza, where a number of PA agencies continue to function effectively as donors examine modalities for supporting reconstruction and recovery. 1.7 Second, the strategic goal of an economically viable Palestinian state is achievable only if Gaza and the West Bank are maintained as an integral economic entity. Schemes that attempt to create economic islands in individual West Bank cities or the Gaza Strip are development dead-ends that also have the potential to make the ultimate establishment of an integrated economy more difficult. Indeed, the fragmentation of WB&G’s economic space, both in terms of lack of access to external but also to local markets, makes the development of more advanced forms of division of labor
6
1 International Monetary Fund (IMF). 2009. Macroeconomic and Fiscal Framework for the West Bank and Gaza: Third Review of Progress, Staff Report, February 25, 2009, page 10, footnote 9

Economic Monitoring Report to the Ad Hoc Liaison Committee
7
and integration into external markets impossible2. At best, such schemes may create the illusion that economic prosperity can be de-coupled from a political horizon. 1.8 Third, stand-alone development projects that do not contribute to long-term private sector development and a sustainable economy have limited impact, comparable to cash transfers. At the same time, development projects can only serve as a stimulus if the private sector has the economic freedom to exploit them for growth. Thus, for example, real reconstruction of Gaza – one including some revival of the moribund private sector -- entails not only the opening of the crossings for building materials and cash, but also enabling external trade so that the revitalized private sector can continue to mend and flourish.
2 World Bank. September 2006. West Bank and Gaza Country Economic Memorandum – Growth in West Bank and Gaza: Opportunities and Constraints, Volume I: Main Report.

Palestinian Economic Prospects: Gaza Recovery and West Bank Revival
2. Recent Political Events 2.1 Israel’s military operation in Gaza lasted roughly three weeks (December 27, 2008 – January 18, 2009) and included aerial and naval bombardment, artillery shelling, as well as ground operations. At least 1,314 Palestinians were killed and four times as many wounded (roughly half of whom women and children); more than 100,000 people displaced; over 15,000 homes damaged or destroyed; public infrastructure and utilities, including water, sanitation, electricity, and transportation networks damaged severely; and businesses, factories, and farmland leveled3. During the hostilities, the lives of approximately one million Israelis living within a 40km range from the border of Gaza were disrupted and put under threat as a result of firing of rockets and mortars by Palestinian armed groups. Close to 1,200 sites were struck in southern Israel leading to the death of 3 Israelis and the injury of 1824. In April 2009, in spite of the continued absence of a bilateral ceasefire agreement between Hamas and Israel, Gaza and southern Israel witnessed one of the lowest levels of violence in recent years (two armed Palestinians killed and no injuries or deaths on the Israeli side). This constitutes a significant decrease in Palestinian casualties compared to February and March 20095. 2.2 General elections to the Knesset (Israeli parliament) were held on February 10, 2009, resulting in the Likud party placing second and right-wing parties winning a majority, which in turn led to Likud leader Binyamin Netanyahu becoming Prime Minister. Prime Minister Netanyahu has recently completed visits to Egypt, Jordan, and USA, in which he refrained from expressing support for the principle of two states. Instead, he has made repeated public statements advocating an approach he describes as “economic peace”, i.e. a plan to boost the Palestinian economy and thereby lay the groundwork for future peace talks. Accordingly, Prime Minister Netanyahu has announced that he will lead a high-level committee (including Israel’s finance and defense ministers) that will work on developing the Palestinian economy and improving the quality of life in the West Bank.
8
2.3 Dr. Salam Fayyad was reappointed Prime Minister of the Palestinian Caretaker Government based in Ramallah on May 19, 2009, leading a new 20-member government that includes eight Fatah members. The fifth round of reconciliation talks continues between the Hamas and Fatah movements. The talks are mediated by Egypt and aim at producing a Palestinian unity government that will heal the rift between the West Bank and Gaza. The Palestinian Legislative Council remains inactive, with many members in Israeli jails. Consequently, the Caretaker Government continues to enact legislation by presidential decree after its passage by the Council of Ministers. President Mahmoud Abbas has postponed presidential elections that were due in January 2009 to coincide with parliamentary elections in January 2010.
3 Palestinian Auhority. 2009. The Palestinian National Early Recovery and Reconstruction Plan for Gaza, 2009-10, page 15. 4 According to Magen David Adom, the Israeli national aid society under the International Committee of the Red Cross, as quoted in the January 2009 issue of The Humanitarian Monitor (page 3), Office for the Coordination of Humanitarian Affairs, Occupied Palestinian Territory. 5 April 2009 issue of The Humanitarian Monitor (page 7), Office for the Coordination of Humanitarian Affairs, Occupied Palestinian Territory.

Economic Monitoring Report to the Ad Hoc Liaison Committee
3. Recent Economic Developments
A. Macroeconomic Outlook 3.1 Even before the onset of hostilities in Gaza in late December 2008, the macroeconomic environment in the WB&G had been more difficult than anticipated in the Palestinian Reform and Development Plan (PRDP) for 2008-10. Restrictions in the West Bank continued during 20086, while Gaza’s isolation increased. Moreover, inflation was much higher than anticipated, further eroding real wealth and incomes. Nevertheless, in the West Bank the adverse impact of the above factors on private sector confidence and growth has been tempered by the redeployment of security forces in several cities, as well as prudent expenditure policy that minimized new arrears accumulation. Overall, real GDP growth in 2008 in the WB&G is estimated at about 2 percent, which translates to a decline of almost 1 percent in real per capita terms, resulting in a per capita income of just over US$1,000 in 2008 (see Figure 1). The Gazan economy, already devastated from years of Israeli blockade, was further ravaged by the recent military operation. Consequently, what little growth has occurred, has taken place in the West Bank. On the other hand, the global financial crisis has thus far not had a significant impact on the Palestinian economy (IMF 2009).
Figure 1: Per capita GDP in West Bank and Gaza, 1997-2008
0.00
200.00
400.00
600.00
800.00
1,000.00
1,200.00
1,400.00
1,600.00
1997 1998 1999 2000 2001 2002 2003 2004 2005 2006 2007 2008
US$
in con
stant prices
Source: Palestinian Central Bureau of Statistics and World Bank staff calculations
3.2 Unexpectedly high inflation and fluctuations in the exchange rate have shocked the Palestinian economy. The Consumer Price Index (CPI) increased by 7 percent in the year to December 2008 (from around 1 percent in mid-2007) -- well above the expected 3-4 percent rate projected in the PRDP. The rise was far more pronounced in Gaza (10 percent) than in the West Bank (4.5 percent) and East Jerusalem (6.5 percent) as a result of the blockade on Gaza. The CPI spiked in the first half of the year due to
9
6 Office for the Coordination of Humanitarian Affairs, Occupied Palestinian Territory. May 2009. West Bank Movement and Access Update.

Palestinian Economic Prospects: Gaza Recovery and West Bank Revival
rapidly rising food and fuel costs as well as the massive inflow of liquidity as the PA resumed paying salaries and arrears. In the last part of the year, steeply falling fuel prices and the end of PA arrears payments helped drive prices down somewhat. Given the importance of dollar-denominated sources of income such as a share of remittances and donor assistance, the impact of inflation on real incomes was worsened by the appreciation of the average shekel exchange rate vis-à-vis the dollar by 15 percent in 2008 (IMF 2009). 3.3 Unemployment and poverty have been high, with a marked deterioration in Gaza. The 2008 unemployment rate is estimated at an average of about 40 percent in Gaza and 19 percent in the West Bank, up from an average of 30 and 18 percent, respectively, in 2007. The sharp rise in unemployment in Gaza reflects the tighter blockade compared to 2007. Poverty levels, based on data from a 2007 household survey, are estimated to be much higher in Gaza than in the West Bank, with a poverty rate of 30 percent in Gaza compared to 19 percent in the West Bank7. While data on poverty levels in 2008 are not yet available, Gaza’s humanitarian situation has worsened, especially during the last quarter of 2008, with more severe restrictions on the entry of essential items, including cash (see below for further details). 3.4 The current revised macroeconomic framework is predicated on all parties (Palestinian Authority, Government of Israel, and donors) pro-actively pushing the peace process forward and supporting Palestinian growth-enhancing reforms and institution-building. In particular, the framework assumes that (IMF 2009): a. Notwithstanding the global slowdown, the trade environment will improve (both with
the rest of the world and within the WB&G) due to an easing by Israel of the blockade on Gaza and of restrictions on movement and access in the West Bank. This will lead to a recovery of exports and private investment, enable an acceleration of the public investment program, and allow Gaza’s reconstruction and rehabilitation.
b. The PA will continue its prudent fiscal policy based on a tight expenditure stance.
The expansion of private sector activity will enable a sustained reduction in the budget deficit based on a strict government employment policy and wage restraint, as well as a phasing out of implicit subsidies to cover municipalities’ utility payments. The composition of spending will continue to shift from wages and subsidies, and toward public investment and reconstruction.
c. Donors will provide adequate and timely financial assistance to cover both the
narrowing recurrent budget deficit and expanded public investment and reconstruction needs.
10
7 Palestinian Central Bureau of Statistics, using a consumption poverty measure. The IMF Staff Report of February 25, 2009, Macroeconomic and Fiscal Framework for the West Bank and Gaza: Third Review of Progress, reports income-based poverty rates from the UNRWA July 2008 report Prolonged Crisis in the Occupied Palestinian Territory: Socio-economic Developments in 2007. These rates are far higher, with 80 percent of households in Gaza living below the poverty line and 45 percent in the West Bank.

Economic Monitoring Report to the Ad Hoc Liaison Committee
11
3.5 Under a baseline scenario with the above assumptions and policy expectations, real GDP growth is projected to increase from about 2 percent in 2008 to 5 percent in 2009, 6.5 percent in 2010, and 7.5 percent in 2011. Although trade with Israel could be affected by the global slowdown, WB&G growth prospects are much more strongly influenced by the easing of restrictions. The rise in donor-funded and private sector investments should offset the impact of fiscal consolidation as well as lay the foundations for sustainable growth in the long run. The share of public consumption in GDP is projected to decline by over 7.5 percentage points over 2009-11, making room for a high rate of public investment averaging about 13 percent of GDP during 2009-11, while at the same time reducing reliance on external financing. Reflecting the relaxation of border restrictions, expansion of exports from repressed levels, and strong demand for raw materials and capital, real export and import growth would average 9-10 percent per year during 2009-11 (IMF 2009). 3.6 While the projected recovery may appear impressive, it would still leave living standards below pre-closures levels in 2000. Real GDP is estimated to have declined by a cumulative 13 percent (or a cumulative 34 percent in real per capita terms) since the beginning of the second Intifada in 2000 and the resulting increase in Israeli restrictions on movement and access. Therefore, the income level for the Palestinian economy is well below its potential and even with the assumed relaxation of Israeli restrictions starting in 2009, real income per capita in 2011 would still be about 27 percent below its level in 2000. The rate of unemployment is projected to remain high at 23 percent in 2011, compared to 11 percent in 2000.
B. Private Sector Prospects8 3.7 Investment has shown few signs of recovery during the past year. The Palestinian Central Bureau of Statistics (PCBS) does not publish figures on private investment; however, monetary statistics suggest it is low. Claims on the private sector fell by over 6 percent to approximately $1.4 billion in the first half of 2008. At the same time, private sector deposits rose from $4.1 billion to $5.1 billion leading to net claims on the private sector to decline by over $1 billion. This large withdrawal of liquidity from the economy offset much of the external aid and indicates that in the current environment, few investors are willing to take risks and borrow from the banking system. 3.8 Consistent with the lack of borrowing, industrial output continues to decline. According to PCBS estimates for 2008, manufacturing output was approximately 23 percent lower than its peak in 2005 and nearly 20 percent lower than in 1999. Agricultural output in 2008 was about 55 percent below its peak in 1999. The construction sector has seen little growth in the last four years and is only a third of its size in 1999. Recently, a few large housing construction projects have been announced in the West Bank, including a new planned community north of Ramallah, which will require over $500 million in private investment. If these projects actually come to fruition they would be a large boost to the construction sector and the Palestinian
8 This section draws extensively on the World Bank program document for the “Palestinian Reform and Development Plan Development Policy Grant II” (March 2008).

Palestinian Economic Prospects: Gaza Recovery and West Bank Revival
economy as a whole. Though the WB&G financial system is relatively disconnected from the international system, the recent international financial crisis may negatively affect these housing finance projects. 3.9 The recent military operation in Gaza destroyed a significant amount of the remaining capital stock and resulted in the closure of many enterprises that had been able to continue operating theretofore. Though much of the damage was sustained by already closed businesses, their destruction ensures that they will not be able to quickly recover once conditions improve. In the middle of 2008, during the ceasefire declared by Hamas, the Government of Israel (GoI) increased the amount of goods allowed to enter Gaza and consequently industrial operations increased (see Table 1). However, at the end of the year, the closure regime was once again intensified. A preliminary assessment by the Palestinian Private Sector Coordinating Council estimates that the recent conflict resulted in $140 million in damage to Gaza businesses. Agriculture also suffered tremendous damage: preliminary PA estimates indicate that 17 percent of the total cultivated area was completely destroyed.
Table 1: Industrial decline in Gaza
June 2005
Pre-disengagement
Week 1, July 2007
Nov. 2007
Dec. 2007
March 2008
June 2008
Dec. 2008*
Industrial Working Establishments
3,900 780 250 195 130 90 200
Industrial Employees 35,000 4,200 2000 1,750 1300 860 1900
Exports from Gaza (truckloads)
748 0 0 0 0 0 0
Source: Palestine Trade Center (PalTrade) interviews with local business associations * These figures were gathered prior to the beginning of the Israeli military operation on December 27, 2008. 3.10 The PRDP envisions a dynamic private sector as the engine of economic growth in WB&G. Private sector growth is necessary to provide jobs for the rapidly expanding population and tax revenues to support the Caretaker Government’s programs. The PRDP affirms the Palestinian economy’s enormous potential for future growth and the urgent need for a revival from its current condition, recognizing that political uncertainty, combined with continued settlement expansion, restrictions on movement and trade, and restrictions on access to resources, have strangled investment and stripped the economy of the bulk of its productive capacity. Nonetheless, the PA is developing strategies that encourage productivity and growth in the industrial, agricultural, housing, and tourism sectors and allow the Palestinian economy to develop a diversified export portfolio. To this end, in 2008, the Palestinian Public Private Partnership was established with representatives from the public and private sector. This organization meets regularly to identify needed policy changes and help guide the PA’s private sector strategy.
12

Economic Monitoring Report to the Ad Hoc Liaison Committee
13
3.11 In the near term, the PA is counting on quick-impact initiatives to jumpstart the recovery of the private sector9. Thus, the PRDP calls for the PA to work with the Office of the Quartet Representative (OQR) to implement a series of economic initiatives and Quick-Impact Projects (QIPs). These are designed to attract sustainable private sector investment and provide near-term stimulus and jobs. The impact of the majority of projects is conditioned upon parallel actions by the PA, the GoI, and donors to create the proper environment for Palestinian businesses and investors to flourish. During 2008, on the back of three Palestinian Investment Conferences in Bethlehem, Nablus, and London, a number of large initiatives were launched, amongst others the introduction of a second mobile telephone provider (Wataniya Telecommunications Company), the planning of large new housing projects, and a new housing finance fund. Older initiatives for the construction of several industrial estates across the West Bank (Jericho, Jenin, Tarkumiya, and Bethlehem) were revived. However, in the face of the ongoing economic restrictions imposed by the GoI, most of these projects have not gotten off the ground to date. The restrictions mostly revolve around movement and access, permission for infrastructure in Area C, and the conversion of Area C land into Area A and B10. In addition, although a Frequency Agreement was signed between the PA and GoI to enable the introduction of a second mobile telephone provider in WB&G as of 2009, the frequencies have not been released to date. The latter could have serious consequences for the investment climate, competition in the telecommunications sector, as well as for the PA’s fiscal position due to the potential loss of $354 million in licensing fees.
9 This paragraph draws on inputs from the OQR. 10 See Section 4.B.4.a. “Land” below on the distinction between Area A, B, and C.
Palestinian Economic Prospects: Gaza Recovery and West Bank Revival
4. Parallel Actions towards Gaza Reconstruction and West Bank Revival
A. Palestinian Authority
A.1. Fiscal Developments in 2008 4.1 The Palestinian Authority continued with fiscal consolidation in 2008. Based on the Ministry of Finance (MoF) monthly fiscal reports, the recurrent fiscal deficit on a commitment basis is estimated to have declined to 19 percent of GDP in 2008 from 24 percent of GDP in 2007, reflecting largely expenditure restraint on the wage bill and reduced utility subsidies. The deficit has been lower than envisaged in the 2008 budget on a commitment basis, but somewhat higher on a cash basis due to the front-loading of arrears repayment. Developments in the main budgetary components can be summarized as follows (IMF 2009): a. Total “regular” net revenues grew by about 6 percent in 2008, broadly in line with the
budget. Nontax revenues in 2008 included several revenue items not foreseen in the budget, notably a license fee payment from Wataniya Telecommunications Company of $80 million, and a cash dividend payment from the Palestinian Investment Fund (PIF) of $25 million.
b. On a commitment basis, the 2008 wage bill decreased by 1 percent in nominal terms, or by 11 percent in real terms, given strict controls on the general wage rate and new employment. Cash wage expenditures were about 3 percent higher than in 2007 in real terms, reflecting the clearance of all wage arrears in 2008. While the PRDP envisaged the repayment of about NIS 1 billion in arrears owed to public sector employees in a phased manner during 2008-10, the PA fully repaid these arrears in 2008.
c. Nonwage expenditure commitments were only about 1 percent higher than budgeted, taking into account the higher cost of goods and services and unforeseen pension payments to security personnel. In addition, the PA repaid about NIS 250 million in arrears to the private sector.
d. Net lending (including payments by the central government for utility bills due by consumers, and tax rebates or losses related to the marketing of petroleum products) was 17 percent higher than the budgeted amount, largely reflecting the higher-than-envisaged fuel prices. Nevertheless, it fell by 27 percent from its 2007 level, reflecting implementation of measures to raise utility bill collection rates, notably (i) the requirement of “certificates of utility bill payment” for users of government services; (ii) incentives for municipalities to ensure that consumers’ utility payments are passed on to electricity companies, in addition to a close monitoring of municipalities’ bank accounts; and (iii) installation of prepaid meters in West Bank refugee camps.
4.2 The Ministry of Interior and National Security spent the largest share of the PA 2008 budget (close to one third of total expenditures) followed by the Ministries
14

Economic Monitoring Report to the Ad Hoc Liaison Committee
15
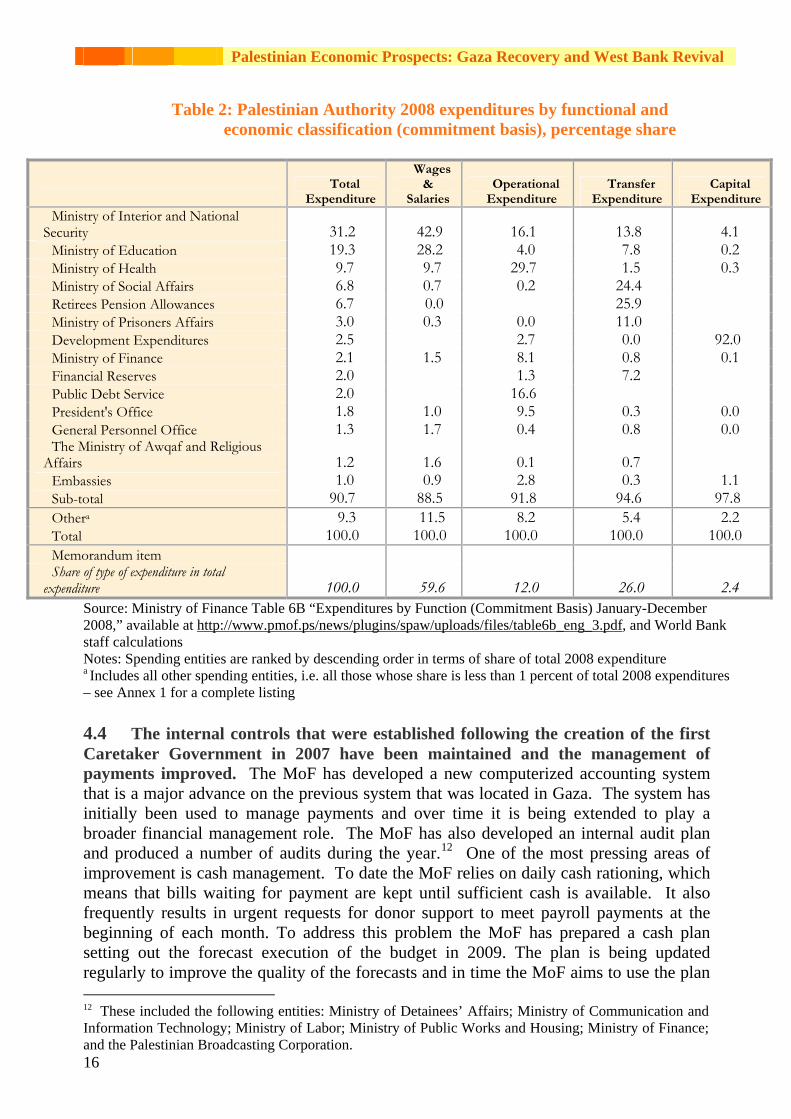
of Education and Health at roughly 20 and 10 percent, respectively11 (see Table 2). These same three ministries also absorbed the largest shares in terms of wage and salary expenditure. Indeed, the Ministry of Interior and National Security spends a relatively large share across all types of expenditure: in addition to 43 percent of salaries, it absorbed fully 16 percent of other recurrent costs, 14 percent of transfer expenditure, and 4 percent of capital expenditure (this may seem small but it is the largest share after the catch-all category of “development expenditures”). The Ministry of Health, on the other hand, spent the largest share of non-wage recurrent expenditures (30 percent) and the Ministry of Social Affairs and retirees’ pension allowances each account alone for one quarter of transfer expenditures. Overall, 60 percent of PA expenditures in 2008 consisted of wages and salaries, followed by transfer expenditures (26 percent), operational expenditures (12 percent) and capital expenditures (2 percent). 4.3 The Palestinian Caretaker Government continued its extensive public financial management (PFM) reform program launched in mid-2007. Initially, the reform program focused on re-establishing the integrity of the government banking arrangements – today, it spans the full range of PFM systems, from budget preparation through to external audit of the final accounts. Indeed, preparing annual budgets in a transparent manner is a key component of the reform program: one of the features in the preparation of the 2008 and 2009 budgets has been an effort to link the budget with the PRDP and gradually introduce a performance focus to budget management. Consistent with this reform, the 2009 budget features a combined presentation of the recurrent and development budgets based on a program structure for each line ministry. In the coming year, the program definitions will be refined to improve the consistency of presentation across ministries, and the alignment with the capabilities of the PA accounting system. This would be a precursor to the eventual introduction of program budgeting for all ministries. The MoF also intends to develop a new economic and administrative budget classification system for use in the 2010 budget. The aim of this initiative is to align economic reporting with international standards and to further clarify responsibility for budget resources.
11 Over 50 percent of the Ministry of Health’s expenditures are in Gaza, and over 20 percent of the expenditures of the Ministry of Education.
Palestinian Economic Prospects: Gaza Recovery and West Bank Revival
Table 2: Palestinian Authority 2008 expenditures by functional and economic classification (commitment basis), percentage share
Total
Expenditure
Wages &
Salaries Operational
Expenditure Transfer
Expenditure Capital
ExpenditureMinistry of Interior and National
Security 31.2- 42.9- 16.1- 13.8- 4.1 Ministry of Education 19.3- 28.2- 4.0 7.8 0.2 Ministry of Health 9.7 9.7 29.7- 1.5 0.3 Ministry of Social Affairs 6.8 0.7 0.2 24.4- Retirees Pension Allowances 6.7 0.0 25.9- Ministry of Prisoners Affairs 3.0 0.3 0.0 11.0- Development Expenditures 2.5 2.7 0.0 92.0- Ministry of Finance 2.1 1.5 8.1 0.8 0.1 Financial Reserves 2.0 1.3 7.2 Public Debt Service 2.0 16.6- President's Office 1.8 1.0 9.5 0.3 0.0 General Personnel Office 1.3 1.7 0.4 0.8 0.0 The Ministry of Awqaf and Religious
Affairs 1.2 1.6 0.1 0.7 Embassies 1.0 0.9 2.8 0.3 1.1 Sub-total 90.7- 88.5- 91.8- 94.6- 97.8- Othera 9.3 11.5 8.2 5.4 2.2 Total 100.0- 100.0- 100.0-- 100.0-- 100.0-- Memorandum item Share of type of expenditure in total
expenditure 100.0- 59.6 12.0 26.0 2.4 Source: Ministry of Finance Table 6B “Expenditures by Function (Commitment Basis) January-December 2008,” available at http://www.pmof.ps/news/plugins/spaw/uploads/files/table6b_eng_3.pdf, and World Bank staff calculations Notes: Spending entities are ranked by descending order in terms of share of total 2008 expenditure a Includes all other spending entities, i.e. all those whose share is less than 1 percent of total 2008 expenditures – see Annex 1 for a complete listing 4.4 The internal controls that were established following the creation of the first Caretaker Government in 2007 have been maintained and the management of payments improved. The MoF has developed a new computerized accounting system that is a major advance on the previous system that was located in Gaza. The system has initially been used to manage payments and over time it is being extended to play a broader financial management role. The MoF has also developed an internal audit plan and produced a number of audits during the year.12 One of the most pressing areas of improvement is cash management. To date the MoF relies on daily cash rationing, which means that bills waiting for payment are kept until sufficient cash is available. It also frequently results in urgent requests for donor support to meet payroll payments at the beginning of each month. To address this problem the MoF has prepared a cash plan setting out the forecast execution of the budget in 2009. The plan is being updated regularly to improve the quality of the forecasts and in time the MoF aims to use the plan
16
12 These included the following entities: Ministry of Detainees’ Affairs; Ministry of Communication and Information Technology; Ministry of Labor; Ministry of Public Works and Housing; Ministry of Finance; and the Palestinian Broadcasting Corporation.

Economic Monitoring Report to the Ad Hoc Liaison Committee
17
to both schedule discretionary activities to align with its cash availability, and provide donors with early information on likely cash shortfalls to assist their planning of budget support. 4.5 Another important component of the PFM system is public procurement, where the PA has drafted a new law, submitted it to the Council of Ministers, with the expectation that it will be passed soon. In the coming two years, the PA will move to enact the supporting regulations for the new law, establish a public procurement unit, initiate standard bidding documents, institute a training program across the government, and take other steps necessary to make the law effective. By the end of the PRDP period, the new procurement law and regulations should be applied by all public sector institutions including local governments and parastatals. 4.6 The preparation of monthly reports during the year along with audited final accounts at year end is an important feature in the PA’s program to strengthen accountability. During 2008, the MoF began posting monthly reports of revenues and expenditures on the internet by the 15th of the following month, and during 2009 these reports will be extended to include information on domestic debt. To provide further assurance on the quality of financial reporting, the final accounts for 2008 will be subject to an external audit by the State Audit and Administrative Control Bureau supported by Norwegian experts.
A.2. Fiscal Outlook for 2009 4.7 The 2009 budget, signed by the President in March 2009, is characterized by a continued reduction in the recurrent deficit and a shift in the composition of expenditure away from wages and subsidies, and toward nonwage and capital spending (see Box 1 for the budget’s key features). The draft budget was completed and sent to the Cabinet prior to the Israeli military operation in Gaza. Estimates have been prepared by the PA on Gaza’s reconstruction and rehabilitation needs (see further below). The PA indicates that these needs will be taken into account in a supplementary budget, but this has not yet been prepared. The 2009 budget allocates an increasing share of its public investment to community projects, which are presumed to be less susceptible to implementation delays due to restrictions on movement and access. In 2008, only about half of the amount budgeted for “development projects” was realized due to the high susceptibility of the planned projects (mostly large infrastructure projects directly managed by aid agencies) to restrictions on movement and access. The 2009 budget envisages a rise in the implementation rate through a focus on community-based projects. 4.8 The PA’s Ministry of Planning coordinated and spearheaded the formulation of Palestinian National Early Recovery and Reconstruction Plan for Gaza 2009-10 (Early Recovery Plan) with line Ministries, other PA bodies, key donors, the private sector, and international and national NGOs. The Plan will be explicitly linked to the key national policy priorities as outlined in the PRDP with the ultimate goal of integrating the reconstruction of Gaza within the PRDP and its planning and budgeting processes. Further analysis of the situation in Gaza will be undertaken in the coming months by

Palestinian Economic Prospects: Gaza Recovery and West Bank Revival
relevant Ministries, in close consultation with UN Agencies, the World Bank, the European Commission, and other partners to refine and develop this plan.
4.9 The 2009 PA budget projects a large recurrent account deficit that will require $1.15 billion in budget support. In addition, the PA estimates that the Israeli siege and military assault on Gaza will increase the demand on the PA’s recurrent budget by an estimated $300 million during 2009 alone to cover emergency shelter, fuel and electricity bills, and medical and social needs (IMF 2009). As a result, the donor community is being asked to support $1.45 billion in budget support and supplementary emergency budget support for Gaza in 2009. In addition, the Early Recovery Plan estimates a total need of $1.32 billion in early recovery and reconstruction interventions in Gaza (see Table 3). It should be noted that the 2009 budget (prior to the events in Gaza) anticipated over $2.8 billion in recurrent expenditure, but more than half of this figure was expected to be financed by domestic revenues, leaving $1.15 billion needed from the donor community. Indeed, the PA’s deficit reduction policies, combined with the front-loading of arrears repayment in 2008, resulted in a substantial reduction in external financing requirements for the original recurrent budget in 2009. As Table 3 shows, the original 2009 budget foresaw a total financing need of $1.65 billion as opposed to the current need of nearly $2.77 billion in the aftermath of the events in Gaza.
Table 3: Palestinian Authority's external financing requirements, 2009
Recurrent budget support
Development projects Total
2007 Paris Conference 1.30 0.60 1.90 Original 2009 budget 1.15 0.50 1.65 Post-Gaza offensive 2009 budget 1.45 1.32 2.77
Source: IMF 2009 and World Bank staff calculations 4.10 The Gaza Early Recovery Rapid Needs Assessment (GERRNA) underlies the above-mentioned Early Recovery Plan and estimates, underpinning both the early recovery projects and the medium-to-longer term reconstruction interventions. Conducted by PA Ministries and Agencies with the support of local and international partners, it uses the situation prior to 27th December 2008 as a baseline but contextualizes it within the experience of Israel’s long and continuing closure of Gaza. The PA states that the goal is not merely to turn the clock back two months, or even to June 2007, but to make a qualitative change to the socio-economic situation in Gaza. The UN Flash Appeal launched in February 2009 addresses the immediate humanitarian needs of the Palestinian people in Gaza, and also includes time critical early recovery interventions. In coordination and agreement with the UN Agencies involved, early recovery projects included in the original Flash Appeal have been expanded and included in the Early Recovery Plan to provide the bridge between short-term relief and medium and longer-term development. Thus, the Early Recovery Plan sets out prioritized early recovery actions and longer-term interventions designed to have a permanent, positive impact on the lives of Gaza’s 1.5 million inhabitants.
18
Economic Monitoring Report to the Ad Hoc Liaison Committee
19
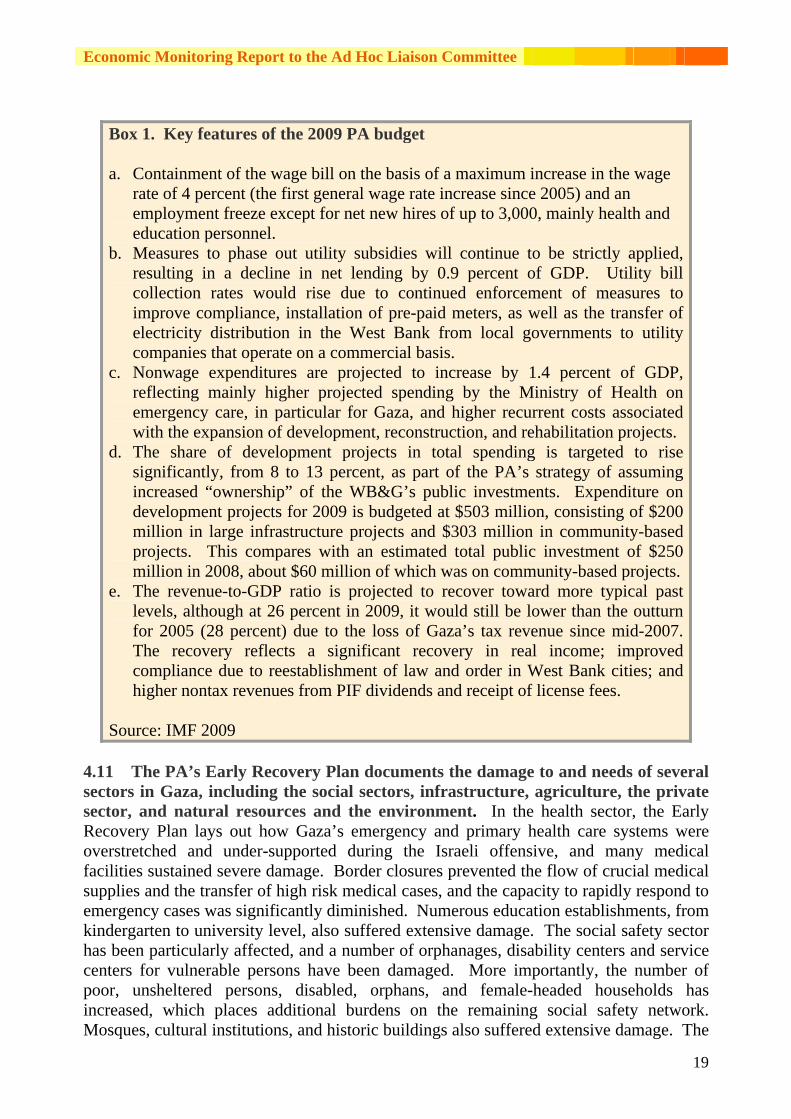
Box 1. Key features of the 2009 PA budget a. Containment of the wage bill on the basis of a maximum increase in the wage
rate of 4 percent (the first general wage rate increase since 2005) and an employment freeze except for net new hires of up to 3,000, mainly health and education personnel.
b. Measures to phase out utility subsidies will continue to be strictly applied, resulting in a decline in net lending by 0.9 percent of GDP. Utility bill collection rates would rise due to continued enforcement of measures to improve compliance, installation of pre-paid meters, as well as the transfer of electricity distribution in the West Bank from local governments to utility companies that operate on a commercial basis.
c. Nonwage expenditures are projected to increase by 1.4 percent of GDP, reflecting mainly higher projected spending by the Ministry of Health on emergency care, in particular for Gaza, and higher recurrent costs associated with the expansion of development, reconstruction, and rehabilitation projects.
d. The share of development projects in total spending is targeted to rise significantly, from 8 to 13 percent, as part of the PA’s strategy of assuming increased “ownership” of the WB&G’s public investments. Expenditure on development projects for 2009 is budgeted at $503 million, consisting of $200 million in large infrastructure projects and $303 million in community-based projects. This compares with an estimated total public investment of $250 million in 2008, about $60 million of which was on community-based projects.
e. The revenue-to-GDP ratio is projected to recover toward more typical past levels, although at 26 percent in 2009, it would still be lower than the outturn for 2005 (28 percent) due to the loss of Gaza’s tax revenue since mid-2007. The recovery reflects a significant recovery in real income; improved compliance due to reestablishment of law and order in West Bank cities; and higher nontax revenues from PIF dividends and receipt of license fees.
Source: IMF 2009
4.11 The PA’s Early Recovery Plan documents the damage to and needs of several sectors in Gaza, including the social sectors, infrastructure, agriculture, the private sector, and natural resources and the environment. In the health sector, the Early Recovery Plan lays out how Gaza’s emergency and primary health care systems were overstretched and under-supported during the Israeli offensive, and many medical facilities sustained severe damage. Border closures prevented the flow of crucial medical supplies and the transfer of high risk medical cases, and the capacity to rapidly respond to emergency cases was significantly diminished. Numerous education establishments, from kindergarten to university level, also suffered extensive damage. The social safety sector has been particularly affected, and a number of orphanages, disability centers and service centers for vulnerable persons have been damaged. More importantly, the number of poor, unsheltered persons, disabled, orphans, and female-headed households has increased, which places additional burdens on the remaining social safety network. Mosques, cultural institutions, and historic buildings also suffered extensive damage. The

Palestinian Economic Prospects: Gaza Recovery and West Bank Revival
Israeli military operation severely impacted the provision of basic services, with extensive disruption caused to water and sanitation networks, energy supplies and facilities, roads and bridges, and the telecommunications system. The agriculture sector was severely affected, with the widespread destruction of cultivated land, greenhouses, livestock and poultry farms, water wells, irrigation networks, and other productive assets. Fragile ground-water resources were severely compromised, particularly from the destruction of the waste-water infrastructure, which released hundreds of thousands of cubic meters of raw sewage into the environment. Figure 2 shows that the PA estimates that needs are greatest in the shelter and housing, agriculture, and social protection and safety nets sectors.
Figure 2: Estimated cost of early recovery interventions in Gaza, by sector
0
50
100
150
200
250
300
350
Transit
ional
shelt
er & ho
using
Agricu
lture
& food
secu
rity
Social
prote
ction
& sa
fety n
ets
Indus
try &
priva
te se
ctor
Transp
ortati
on
Educa
tion
Safety
& secu
rity
Health
& nu
trition
Loca
l auth
oritie
s & pu
blic a
dmini
strati
on
Culture
, heri
tage,
& faith
-base
d ins
titutio
nsWate
r
Energy
Teleco
mmunica
tion
Solid w
aste
manag
emen
t
Wate
r, san
itatio
n, & hy
giene
Civil s
ociet
y & co
mmunity
-base
d orga
nizati
ons
Air poll
ution
Land
, soil
, & bi
odive
rsity
Sector
Estim
ated
cos
t for
ear
ly re
cove
ry in
terv
entio
ns (U
S$ m
illio
ns)
Source: Palestinian Authority. 2009. The Palestinian National Early Recovery and Reconstruction Plan for Gaza 2009-10.
4.12 As mentioned earlier, in the Early Recovery Plan the PA attempts to address immediate needs as well as prepare the ground for medium- to long-term interventions. As a result, several principles guided its formulation and will guide its implementation. These include the notion of “building back better” in order to ensure that early recovery and reconstruction interventions do not simply replicate the conditions prior to the three-week military incursion but that they result in improved and more sustainable standards of living, and opportunities for a better life than before. Another
20

Economic Monitoring Report to the Ad Hoc Liaison Committee
21
guiding principle is the revitalization of the private sector, civil society, and local economy, by facilitating the conditions for local economic development, including employment creation, and building local capacities to ensure that Palestinians in Gaza are not just beneficiaries but actors in the early recovery and reconstruction process. The Early Recovery Plan is therefore designed to promote recovery initiatives by the affected communities and equip them with the resources and tools to be at the forefront of this effort. The private sector and a wide range of civil society organizations will be mobilized as both recipients of assistance and “managers” of early recovery and reconstruction interventions. A third guiding principle relates to promoting equity and broad-based participation from all segments of the Palestinian population, including and particularly from women and vulnerable groups. Throughout the assessment process, particular attention was given to the situation of those who have traditionally been the most vulnerable and disadvantaged, and who have suffered the most during this latest conflict. Finally, efficient coordination and information sharing with stakeholders are key attributes of the Early Recovery Plan, as well as Palestinian ownership of the development process and ensuring that interventions link with, reinforce, and facilitate the PRDP process. 4.13 There are therefore several prerequisites for the success of this ambitious program for Gaza’s reconstruction that are equally applicable to bringing about revival in the West Bank. As well as the international community continuing to offer its cooperation and support, the political situation must be stabilized, and the crossings must be permanently opened for the normal movement of people and goods, in line with previous agreements reached between the PA and Israel. The Palestinian economy in Gaza will only be able to recover after the closure of Gaza is ended and liquidity returns to the financial system. The 2005 Agreement on Movement and Access should serve as the framework for allowing much-needed supplies and expertise into and exports out of both Gaza and the West Bank.
B. Israel 4.14 Intensified since the second Intifada in 2000, Israel’s security-oriented restrictions on movement and access (M&A) of people and goods - both within Palestinian territory and through Israel to the rest of the world - consist of physical impediments (roadblocks, barriers, etc.) as well as permit policies, administrative practices, and informal governance processes. The Palestinian economy, however, cannot recover without an efficient and predictable means of moving goods and people throughout the West Bank and Gaza, across Palestinian borders to Israel and beyond, and between Gaza and the West Bank. At the same time, it is arguably the case that today’s management of the bilateral borders between Israel and the Palestinian territories can be fundamentally improved without compromising Israeli security. What is needed is a systematic attempt to balance security with trade facilitation through the redesign of border crossing facilities, the adoption and monitoring of new management procedures, and the appropriate use of modern security technologies.

Palestinian Economic Prospects: Gaza Recovery and West Bank Revival
B.1. Gaza Closure 4.15 During January and February 2009, a daily average of 127 trucks entered Gaza, which represents a sizeable increase compared to the parallel figures during November and December 2008 (a daily average of 23 and 30 truckloads, respectively), when the closure was intensified. However, February figures remain well below imports in May 2007 (a daily average of 475 truckloads) – one month before the Hamas take-over – and insufficient relative to market needs. The Palestine Trade Center (PalTrade) estimates that in order for any sort of economic revival to begin, exports should resume immediately and a minimum of 850 truckloads of market-triggered imports per day should be allowed entry. Of the total truckloads in February 2009, around 16 carrying medical and other relief supplies entered through the Rafah Crossing (goods entered through the Rafah Crossing in January 2009 for the first time since September 2005). One export – a truckload of cut flowers (nearly 50,000 flowers) was allowed out of Gaza on February 12, 2009 through the Kerem Shalom Crossing – the first time since January 18, 2008. Over 80 percent of truckloads carry food stuffs. Other essential supplies such as construction materials, spare parts for water and wastewater infrastructure, industrial inputs, and livestock continue to be barred from Gaza13. 4.16 The grain conveyor belt at Karni Crossing was opened on 16 days during February 2009, allowing the entry of wheat grain and animal feed into Gaza. The entry of increasing amounts of wheat grain has enabled five out of six mills in Gaza to resume functioning during February 2009, after being forced to shut down during parts of December 2008 and January 2009. However, the level of wheat flour stock recorded, in the last week of February (11,700 metric tons) was well below its level in September 2008 (24,400 metric tons).
22
13 The GoI has stated that many of the restrictions imposed on Gaza relate directly to its efforts to secure the release of Israeli soldier Gilad Shalit, held hostage in Gaza since June 2006.

Economic Monitoring Report to the Ad Hoc Liaison Committee
Figure 3: Monthly number of truckloads entering through Gaza crossings
January 2007 - February 2009
02000400060008000
10000120001400016000
Jan‐07
Feb‐07
Mar‐07
Apr‐07
May‐07
Jun‐07
Jul‐0
7Aug
‐07
Sep‐07
Oct‐07
Nov
‐07
Dec‐07
Jan‐08
Feb‐08
Mar‐08
Apr‐08
May‐08
Jun‐08
Jul‐0
8Aug
‐08
Sep‐08
Oct‐08
Nov
‐08
Dec‐08
Jan‐09
Feb‐09
2007 2008 2009
AlMontar/Karni Sufa Karem Abu Salem/Kerem Shalom
Source: February 2009 issue of The Humanitarian Monitor, Office for the Coordination of Humanitarian Affairs, Occupied Palestinian Territory.
Figure 4: Weekly total wheat flour stocks at Gaza mills
September 2008 - February 2009
24334
17280
12100
14500
8400
6250
2830
180 592
4900
1240010900 11700
1210012100
24400
0
5000
10000
15000
20000
25000
30000
Sep3rd
Sep10th
Sep25th
Oct14th
Oct21st
Oct28th
Nov4th
Nov11st
Nov18th
Nov25th
Dec1st
Dec10th
Jan26th,09
Feb10th
Feb17th
Feb25th
Total stock
Source: February 2009 issue of The Humanitarian Monitor, Office for the Coordination of Humanitarian Affairs, Occupied Palestinian Territory.
23
4.17 In January 2009, Israel reduced the area in which Gaza fishermen can fish from six to three nautical miles from Gaza’s coastline. Under the Oslo Accords, Gaza’s fishing rights extend to 20 nautical miles off the coast. Prior to 2000, Gazans were permitted to fish up to 12 nautical miles from the coast, and the distance was reduced to six miles in 2000, which greatly restricts fishermen’s ability to capture sufficient quantities and types of fish. Thus, today there are about 3,400 fishermen in Gaza as compared to 10,000 in 2000. In 2008, i.e. prior to the latest reduction in fishing

Palestinian Economic Prospects: Gaza Recovery and West Bank Revival
rights, the fishing catch was 3,000 tons while Gaza’s needs are roughly 20,000 tons annually. In February 2009, only 65 tons of fish were caught.
B.2. The Implications of Restricting Entry of Cash into Gaza14 4.18 One of the key challenges for the Palestinian Monetary Authority (PMA) is to maintain the payments system in Gaza while ensuring strong anti-money laundering compliance. On any given day the PMA estimates that the 43 banks in Gaza require around NIS 200 million to meet regular needs. In addition, UNRWA and other international agencies require regular injections of US dollars to fund operations. All imports from Israel to Gaza have to be paid for in cash. Consequently, to maintain the necessary level of shekels, the banking system requires monthly injections of shekels. In the last half of 2008, the PMA estimated that the need was about NIS 100 million however, with the massive requirements for reconstruction, the PA is now suggesting that the banks need closer to NIS 200 million every month. For much of the past year, the GoI has not allowed regular shipments of cash from West Bank banks to their branches in Gaza, creating a shortage of shekel notes. In December 2008 there was another shortage of shekel notes and the banks had to again resort to partial payment and limit the amount of cash withdrawals in a single day. Cash shipments to Gaza are made on an irregular basis and only after strong interventions at the highest political levels. 4.19 The shortage of cash in Gaza has had serious consequences on the real economy. The salaries of the PA - as well as most international organizations including the World Bank - are paid electronically. The lack of cash in the banks has made it extremely difficult for the more than 62,000 PA employees in Gaza to access their salaries and thus more difficult for the PA to maintain its services. The living standards in Gaza have already been depressed by the blockade and the lack of liquidity has added an additional burden by making it difficult for households to purchase what goods are available. The lack of liquidity not only affects the PA employees and their families but also hits households relying on cash transfers by the PA, World Bank, European Union, and UNRWA that are targeted to help the poorest households. 4.20 The lack of bank reserves has reduced the role of banks in Gaza’s economic activity as most transactions have shifted to a cash basis and unregulated channels. The lack of shekels has also led to a partial dollarization of the economy and induced the public to hoard cash, which reduces bank profitability and threatens the confidence in the entire banking system including in the West Bank. The shift away from the formal banking system has reduced the effectiveness of the PMA’s efforts to combat money laundering. It has also strongly benefited groups that have access to cash from outside the banking system and who control the informal non-bank channels.
24
4.21 Another major challenge facing the Palestinian banking system is the threat of losing correspondent relationships with Israeli banks. At the beginning of 2009 two Israeli commercial Banks ended their correspondent relationships with Gaza banks and are now threatening to sever relations with banks in the West Bank. Such an action would severely disrupt trade between the West Bank and Israel and damage the
14 This section draws on inputs from the OQR.

Economic Monitoring Report to the Ad Hoc Liaison Committee
25
profitability of the Palestinian banking system. The cost of banking services would increase because all transactions would need to be denominated in foreign currencies and cleared offshore. It would also divert resources and transactions away from the formal banking sector towards unregulated channels. The PMA is currently working with the Israeli Central Bank to come up with alternative arrangements, possibly with an Israeli state-owned bank.
B.3. West Bank Movement and Access 4.22 Several important developments with respect to internal movement and access within the West Bank took place during February 2009, most of which contributed to the easing of Palestinian movement in specific areas, particularly for vehicles, but preserved and entrenched existing Israeli restrictions and mechanisms of control for the benefit of the security and movement of Israeli settlers15. Checkpoints and obstacles, justified by Israeli authorities since the beginning of the second Intifada (September 2000) as a temporary military response to violent confrontations and attacks on Israeli civilians, are evolving into a more permanent system of control that is steadily reducing the space available for Palestinian growth and movement for the benefit of the increasing Israeli settler population. According to figures published by the Israeli Central Bureau of Statistics, the settlement population grew by 4.7 percent in 2008 compared to a 1.7 percent growth rate for the population inside Israel. Peace Now, an Israeli non-governmental organization that tracks settlement activity, estimates that roughly 40 percent of the new housing units in settlements were east of the Separation Barrier, deep inside the West Bank. In addition to the increase in actual buildings, in 2008 there was an eightfold increase in the number of tenders issued for new construction in settlements (see Figure 5 on trends in new housing units). In February 2009, the GoI announced the approval for building 1,400 new housing units in one settlement and the development of 130 hectares of land in another one. Also in February, a report on a secret database on settlement activity compiled by the Israeli Ministry of Defense was leaked to the Israeli press. The report details how much of the settlement construction was illegal under Israeli law itself since it was done without permits or on privately-held Palestinian land.
15 February 2009 issue of The Humanitarian Monitor, Office for the Coordination of Humanitarian Affairs, Occupied Palestinian Territory.

Palestinian Economic Prospects: Gaza Recovery and West Bank Revival
Figure 5: New housing units in settlements, 2001-2008
1,591 1,560
2,028 1,9881,891
1,524
1,389
1,647
0
500
1,000
1,500
2,000
2,500
2001 2002 2003 2004 2005 2006 2007 2008Year
New
set
tlem
ent h
ousi
ng u
nits
Source: Peace Now Report Summary of Construction in the West Bank 2008 using data from the Israeli Central Bureau of Statistics, available at http://www.peacenow.org.il/data/SIP_STORAGE/files/5/3935.pdf Note: Figure for 2008 is only until September 2008
4.23 The Office for the Coordination of Humanitarian Affairs (OCHA) reports that as of March 2009 there were 634 documented and mapped obstacles blocking internal Palestinian movement and access throughout the West Bank, i.e. comparable to the parallel figure of 630 at the end of the previous reporting period (September 2008)16. In the last part of 2008, the GoI began to take measures to improve movement and access between areas inside the West Bank, thereby easing the flow of Palestinian traffic on some of the access routes into the four main cities of Nablus, Hebron, Tulkarm, and Ramallah. In addition, during the holiday periods, checkpoint hours were extended and many permits were issued for West Bank residents to enter into Israeli controlled areas. The GoI is further allowing a small number of Israeli citizens to enter Jenin and other towns by foot to shop. It is estimated that on some days 200-300 people enter Jenin compared to nearly 10,000 a day before the second Intifada and the resulting closures. Though these moves are welcome they have had little significant impact on private sector activity.
16 Office for the Coordination of Humanitarian Affairs, Occupied Palestinian Territory. May 2009. West Bank Movement and Access Update.
26

Economic Monitoring Report to the Ad Hoc Liaison Committee
27
4.24 Israel has completed six commercial crossing points in the Separation Barrier between Israel and Jerusalem, on one side, and the West Bank, on the other. Once these are fully operational, all traffic between Israel and the West Bank will be forced to move through them. Shipments to or from Palestinian areas will be transferred on a back-to-back basis with all goods scanned. The GoI has stated that once the Separation Barrier is complete and all of the crossing points operational, then they will be able to reduce the internal barriers. However, currently the crossings are almost fully operational but, as noted above, the internal movement restrictions have not been relaxed in a meaningful way. 4.25 Nonetheless, the OQR is focusing on a set of key strategic obstacles to enhanced access and movement in the West Bank, the objective being to significantly open up movement north-south and out to the east17. Since May 2008 there have been a number of steps taken to ease internal movement of Palestinians on the West Bank, most notably around Hebron and on the northern West Bank around Nablus. Around Hebron, two strategic obstacles identified have been opened, thereby significantly improving commercial traffic in the area. Recently, more steps were taken in the area to improve access to Hebron from villages surrounding the city. In the northern West Bank, the August 2008 opening of the Shave Shomron checkpoint has greatly facilitated movement for around 300,000 Palestinians travelling from the northern West Bank into central and southern West Bank and vice versa. In recent months there have also been steps taken to ease access and movement restrictions around Nablus. The measures implemented are positive first steps but their impact remains limited geographically. A much more substantial relaxation of restrictions on movement and access is a key component in the efforts to create a new reality on the ground. The OQR will continue to push for further removal and opening of key obstacles, focusing its efforts in particular on opening the north-south trade corridor and the one going to the east leading to Allenby Bridge in recognition of the crucial link between trade and economic growth in WB&G.
17 This paragraph draws on inputs from the OQR.
Palestinian Economic Prospects: Gaza Recovery and West Bank Revival
B.4. Sectoral Implications of Israeli Economic Restrictions
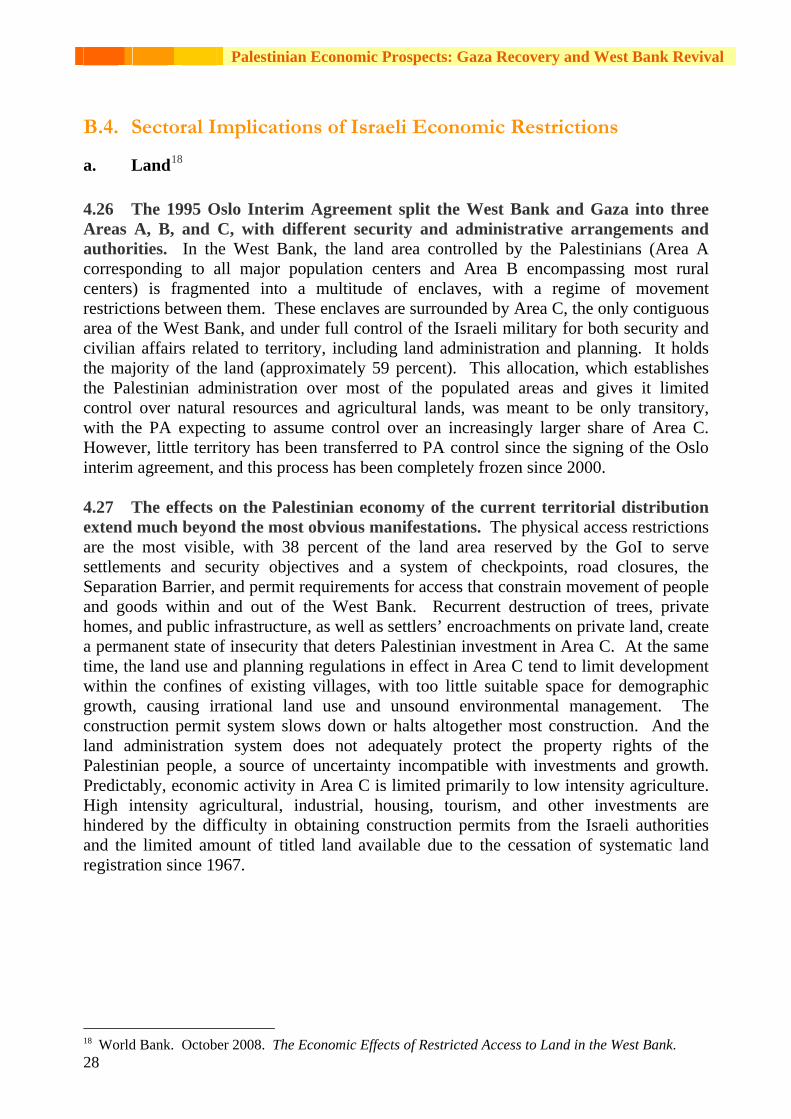
a. Land18 4.26 The 1995 Oslo Interim Agreement split the West Bank and Gaza into three Areas A, B, and C, with different security and administrative arrangements and authorities. In the West Bank, the land area controlled by the Palestinians (Area A corresponding to all major population centers and Area B encompassing most rural centers) is fragmented into a multitude of enclaves, with a regime of movement restrictions between them. These enclaves are surrounded by Area C, the only contiguous area of the West Bank, and under full control of the Israeli military for both security and civilian affairs related to territory, including land administration and planning. It holds the majority of the land (approximately 59 percent). This allocation, which establishes the Palestinian administration over most of the populated areas and gives it limited control over natural resources and agricultural lands, was meant to be only transitory, with the PA expecting to assume control over an increasingly larger share of Area C. However, little territory has been transferred to PA control since the signing of the Oslo interim agreement, and this process has been completely frozen since 2000. 4.27 The effects on the Palestinian economy of the current territorial distribution extend much beyond the most obvious manifestations. The physical access restrictions are the most visible, with 38 percent of the land area reserved by the GoI to serve settlements and security objectives and a system of checkpoints, road closures, the Separation Barrier, and permit requirements for access that constrain movement of people and goods within and out of the West Bank. Recurrent destruction of trees, private homes, and public infrastructure, as well as settlers’ encroachments on private land, create a permanent state of insecurity that deters Palestinian investment in Area C. At the same time, the land use and planning regulations in effect in Area C tend to limit development within the confines of existing villages, with too little suitable space for demographic growth, causing irrational land use and unsound environmental management. The construction permit system slows down or halts altogether most construction. And the land administration system does not adequately protect the property rights of the Palestinian people, a source of uncertainty incompatible with investments and growth. Predictably, economic activity in Area C is limited primarily to low intensity agriculture. High intensity agricultural, industrial, housing, tourism, and other investments are hindered by the difficulty in obtaining construction permits from the Israeli authorities and the limited amount of titled land available due to the cessation of systematic land registration since 1967.
28
18 World Bank. October 2008. The Economic Effects of Restricted Access to Land in the West Bank.

Economic Monitoring Report to the Ad Hoc Liaison Committee
29
b. Telecommunications19 4.28 Despite its tremendous potential for growth, the telecommunications sector continues to be inhibited by the GoI’s lack of allocation of necessary frequencies for the expansion of mobile operations and for Voice over Internet Protocol (VoIP) services, as well as by restrictions on the import of equipment and building of infrastructure to improve and expand both mobile and landline networks. In addition, the sector is characterized by the presence of a private regulated monopoly, unauthorized competition, and overall weak governance and regulation. Increasing competition and efficiency in the telecommunications sector will have far reaching effects throughout the Palestinian economy. It will reduce the cost of doing business in all sectors and help raise government tax revenues. The sector legal framework is defined by the Telecommunications Law 3/1996 and by regulatory provisions under the Oslo Agreement. The Agreement affects the interim relationship between Israeli and Palestinian companies, attributing rights and obligations to Palestinian and Israeli operators in the territory of the WB&G, and defining the role of the Palestinian government in the sector. The PalTel Group, which includes companies in all main sectors of the telecommunications and information technology market, is the dominant operator. Unauthorized competition exists in the mobile market, where Israeli operators, authorized under the Oslo Agreement to offer services to the settlers, cover a large part of the territory of the West Bank. PalTel’s market dominance and the problems related to unauthorized competition could be mitigated by the entry of a second mobile operator. The Ministry of Information Technologies and Telecommunications (MITT) has awarded a mobile license to Wataniya Telecommunications Company. However, the frequencies for Wataniya have not been released. 4.29 The complex nature of the regulatory relationship between the PA and GoI has given rise to several areas of concern. In addition to the unauthorized competition in the mobile market, the PA raises the following main issues: (a) Palestinian operators are compelled to route international communications through a licensed Israeli operator, which increases costs; (b) the lack of direct long-distance connection linking the West Bank with the Gaza Strip; and (c) difficulties in obtaining permits from the Israeli authorities to build infrastructure in large parts of the Palestinian territories.
19 World Bank. January 2008. West Bank and Gaza Telecommunications Sector Note: Introducing Competition in the Palestinian Telecommunications Sector.
Palestinian Economic Prospects: Gaza Recovery and West Bank Revival
c. Trade20 4.30 To access the wider world market, Palestinian enterprises must first face the challenge of moving within the West Bank itself. The numerous Israeli road blocks, closed areas, restricted roads, and growing settlements have cut the Palestinian communities into isolated cantons, raising transportation costs and significantly limiting the ability of Palestinian enterprises to achieve economies of scale. To develop a better understanding of how the current level of internal restrictions affect transportation costs, the World Bank commissioned PalTrade to conduct two rounds of surveys of companies engaged in transport between June and September 2007. The survey results indicate that the restrictions on movement of goods and services in the West Bank have a negative effect on at least three dimensions. First, they increase transport costs directly through higher costs of labor and equipment, and indirectly by increasing transaction costs associated with delays at checkpoints. Second, by reducing trade volumes, they induce low levels of capacity utilization of the current truck fleet, which results in high fixed cost per kilometer. Third, they introduce high levels of uncertainty that prevent Palestinian firms from entering the international market, which demands guaranteed delivery times. 4.31 As discussed above, in addition to the internal movement restrictions, the GoI has recently constructed commercial crossing points in the Separation Barrier that have the potential to become another serious constraint to Palestinian businesses. Once the Barrier is complete, all Palestinian commercial traffic will have to move through the commercial crossings using a back-to-back system similar to the one used for Gaza. Mindful of the delays previously experienced at the Karni Crossing for Gaza, the GoI has stated that it will not allow the crossings to become a bottleneck to trade. To this end, it has established a civilian Crossing Point Authority (CPA) and has committed to expanding the facilities as necessary to ensure that there are no queues at the terminals and that all vehicles will move through the crossing points in 30 to 60 minutes. 4.32 In January 2008 the World Bank commissioned PalTrade to monitor four of the biggest crossings. The monitors have not observed any long queues or the severe corruption previously experienced at Karni Crossing. However, because the other routes out of the West Bank have not been completely closed, many Palestinian shippers are able to avoid the crossings by using Israeli registered trucks. Consequently, the crossings in some areas are currently handling only a part of total traffic between the West Bank and Israel. For example, a study by the Economic Cooperation Foundation in early 2008 found that Tarkumiya, the southern crossing, was handling 15 percent of total traffic in the southern portion of the West Bank, including Hebron. Despite this, the average time to process a shipment out of Palestinian areas is higher than the CPA’s target. Counting the time spent waiting to enter the terminal, in June 2008 the average for all crossings was about two hours. Once the GoI completes the Barrier and completely eliminates the ability of Palestinian shippers to use Israeli licensed trucks, the traffic and the delays at the crossings can be expected to rise. Hence, the establishment of the commercial crossings and the requirement for back-to-back transfers creates yet another hardship for Palestinian businesses, no matter how efficiently the crossings are run. In addition to
30
20 World Bank. December 2008. Palestinian Trade: West Bank Routes.
Economic Monitoring Report to the Ad Hoc Liaison Committee
31
creating delays and uncertainties, the crossings also result in substantial damage to goods when they are cross loaded or manually inspected. The crossings lack the equipment to handle very heavy goods or fragile goods like glass. There are no facilities for cold storage for perishables and the CPA has no plans to establish any. d. Water21 4.33 The Joint Water Committee (JWC) was established under Article 40 of the Oslo Agreement to implement the Oslo Interim Agreement on Water, i.e. oversee management of the shared aquifers and ensure that Palestinians receive the extra water accorded under Article 40. However, the JWC does not function as a “joint” water resource management institution because of fundamental asymmetries, a major underlying problem being the asymmetry of information available to the parties. Thus, under Oslo, Joint Supervision Teams (JSETs) were set up to monitor water extraction, but Palestinians no longer take part, as they were unable to fully execute their role due to the movement and access restrictions. Palestinians were supposed to enter settlements but in practice private guards refused them entry. In addition, they had little freedom to enter Area C where most wells were, so that Palestinians were excluded from most JSET activities. In 2001, 3-4 months after the start of the second Intifada, the Palestinians abandoned their participation in JSETs altogether. The result is asymmetry of information between the partners at the JWC, putting Palestinians in a disadvantaged position for sector planning and management. 4.34 Current project approval rules require a second approval by the Civil Administration if projects touch on Area C, which is the case for almost all wells, water conveyance and wastewater treatment and reuse infrastructure. A number of projects have been approved by the JWC, for which detailed planning permission has then not been granted by the Civil Administration. More recently, the Civil Administration may be proving more responsive, and the Israeli Water Authority has recently proposed a joint meeting with the Civil Administration to examine claims concerning the delay in issuing permits for projects already approved by the JWC. 4.35 Taken together, the operation of the JWC, Civil Administration rules, and movement and access restrictions are so constraining the development of the Palestinian water sector as to stifle economic and social development and undermine prospects of water development for a viable state. Regardless of the original intents and promise of the JWC, the joint water governance mechanisms established under Oslo have in fact downgraded to a project-by-project unmediated permitting negotiation process between unequal parties, which Israeli interests and internal processes can override with no credible recourse for Palestinian needs. Thus, the application of the Oslo joint governance provisions for water, combined with Civil Administration constraints and movement and access restrictions, have not promoted Palestinian access to water resources, have impaired normal development of water usage in agriculture and water supply, and stymied capacity growth for wastewater management and reuse. By not facilitating the normal growth of Palestinian water infrastructure, such mechanisms are containing water usage by Palestinians while enabling water usage for Israeli needs. 21 World Bank. April 2009. Assessment of Restrictions on Palestinian Water Sector Development.

Palestinian Economic Prospects: Gaza Recovery and West Bank Revival
e. Health22 4.36 The WB&G’s health system is fragmented and incoherent, composed of at least 4 parts: the PA’s Ministry of Health and national health service, UNRWA, non-governmental organizations (NGOs), and the private sector. One particular difficulty is that the PA has little control over key determinants of health – land, water, the environment, infrastructure, and human movement. Complementarity between the four main providers of health care has not developed from an attempt to establish a rational and efficient division of labor but has mainly arisen because of the political and economic situation. Closures, segregation, strikes, and impoverishment led to many transfers of patients from one provider to another. Restrictions on movement imposed by multiple checkpoints, barriers to movement, and the Separation Barrier prevent access for patients and medical staff. In July 2007 alone, there were 40 recorded cases of ambulances being denied access to patients in the West Bank. A survey at the end of 2003 found that the number of people needing 1 hour or more to reach an appropriate health facility had increased by ten times in three years. A network of mobile clinics now caters to the needs of people living in remote and isolated localities. Despite substantial funding and efforts made by the Palestinian Ministry of Health to build a Palestinian health system, the obstacles to planned development have proved too great. Restrictions placed by Israel on the free movement of Palestinian goods and labor across borders between the West Bank and Gaza, and within the West Bank, have had damaging effects on the PA’s attempts at system building. f. Gender23 4.37 Recent World Bank analysis shows that prolonged conflict and restrictions on movement and access have imposed a gendered impact on participation in the labor market with further implications for gender relations at the household level. Employment has changed significantly in the WB&G over the last 10 years: men’s employment has declined sharply since 1999 primarily due to the loss of work opportunities in Israel, where approximately 70,000 jobs were lost between 2000 and 200224. By 2007, a man in the West Bank only had a 77 percent chance of being employed compared to 1999. By contrast, Palestinian women’s labor force participation rates (at 15.4 percent, one of the world’s lowest) is today at 118 percent of what it was in 1999. In order to survive, women have ventured out to search for any job, even if low paid and unprotected. Women whose husbands are unemployed have become part of a hidden workforce dedicated to family survival. Faced with diminishing employment opportunities and declining wages, men have retreated from the labor force and the public sphere more broadly, and are struggling with feelings of emasculation and disempowerment. Households interviewed in the context of the World Bank study have reported increased tension within the family as traditional gender roles break down and
32
22 Lancet Series: Health in the Occupied Palestinian Territory, launched in London, UK, March 4, 2009, available at http://www.thelancet.com/series/health-in-the-occupied-palestinian-territory 23 World Bank. Forthcoming 2009. Gender Issues in the West Bank and Gaza: Navigating Occupation and Conflict. 24 Reducing reliance on Palestinian labor was one of the policy responses of the GoI to the second Intifada.

Economic Monitoring Report to the Ad Hoc Liaison Committee
living standards decline. Women of all ages affirm men’s access to employment as a social and economic priority. Finally, donor-funded income generating schemes – often taken up by women – are not considered a replacement for development initiatives that provide dignified work.
Figure 6: Palestinian access to health facilities in West Bank
Source: “Lancet Series: Health in the Occupied Palestinian Territory,” launched in London, UK, March 4, 2009, available at: http://www.thelancet.com/series/health-in-the-occupied-palestinian-territory
33

Palestinian Economic Prospects: Gaza Recovery and West Bank Revival
C. Donor Community 4.38 The Palestinian economy has been sustained by enormous infusions of foreign aid and the recent growth in the West Bank is the direct result of a large increase in such flows combined with increased security. In 2008, budget support alone increased by nearly 80 percent from the 2007 level and at close to $1.8 billion, was equivalent to about 30 percent of GDP. The PA has used the donor largesse to pay salaries and clear arrears to public sector employees and the private sector that had accumulated during 2006 and 2007. The 2009 budget assumes that donors will maintain their high level of budget support and calls for close to $2.8 billion in aid for 2009, taking into account the recovery and reconstruction needs in Gaza.
4.39 In Jerusalem, Ramallah, and Gaza, UN agencies, the European Commission, and the World Bank began to actively cooperate, even before the cease-fires of mid-January 2009, to put in place a framework for coordinated support to the Palestinian Authority which is leading the needs assessment process and developing an effective response to the Gaza crisis. There are three phases to this process: a. An immediate assessment, with a broadly based humanitarian focus, to mobilize
assistance for meeting urgent needs totaling an estimated $610 million. The results of this assessment provided the basis for the Gaza Flash Appeal, launched in Geneva on February 2, 2009.
b. A Gaza Early Recovery Rapid Needs Assessment (GERRNA) was completed to mobilize more broad-based assistance for the Sharm el-Sheikh donors’ conference which took place on March 2, 2009. The GERRNA was designed to jump start recovery and restore the initial conditions for Palestinians in Gaza to re-embark on a sustainable social and economic development track, as presented in the PRDP.
c. A Post-Conflict Needs Assessment (PCNA) will be undertaken, when conditions permit, as foreseen in the September 2008 Joint Declaration on Post-Crisis Assessments and Recovery Planning. This PCNA would provide the analytical underpinnings for longer term reconstruction and development of Gaza.
4.40 The Gaza Flash Appeal was launched in Geneva on February 2, 2009 by John Holmes, the Under Secretary-General for Humanitarian Affairs and Emergency Relief Coordinator. The appeal, which requests $613 million, reflects the outcome of the needs assessments carried out in late January 2009. It includes 106 NGOs and 82 UN projects that respond to the emergency humanitarian and early recovery needs of the people in Gaza. The Flash Appeal comprises the revised Gaza component of the 2009 Consolidated Appeals Process (CAP), of which $209 million is made up of new projects, $270 million are highlighted existing CAP projects for the Gaza Strip, with a budget increase of $134 million for existing highlighted projects, thus totaling $613 million. The new total for CAP 2009 for both Gaza and West Bank is $873 million (see Figure 7). By the end of February 2009, $233 million had been pledged towards projects in the revised 2009 CAP, so that the CAP was 27 percent funded – though some sectors have received little or no donor support, including Agriculture and Protection.
34

Economic Monitoring Report to the Ad Hoc Liaison Committee
Figure 7: Consolidated Appeals Process
Source: United Nations. 2009. Occupied Palestinian Territory Gaza Flash Appeal – 2009 Consolidated Appeal Process, page 2.
Table 4: UN Gaza Flash Appeal
Sector/Cluster Requirements $ Agriculture 29,518,016Cash for Work and Cash Assistance
92,338,376
Coordination and Support Services
29,817,823
Early Recovery 27,475,000Education 46,219,914Food Security and Nutrition
153,525,104
Health 46,262,341Protection 5,515,926Psycho-social and Mental Health
38,375,495
Not yet specified -Shelter and Non-food Items
119,081,180
Water, Sanitation and Hygiene
25,230,954
Total 613,360,129Source: United Nations. 2009. Occupied Palestinian Territory Gaza Flash Appeal – 2009 Consolidated Appeal Process, page 3.
4.41 The International Conference in Support of the Palestinian Economy for the Reconstruction of Gaza took place in Sharm El-Sheikh on March 2, 2009. The event was sponsored by Egypt and co-sponsored by Norway to respond to the early recovery and reconstruction needs of the Palestinians in Gaza in the aftermath of the Israeli military 35

Palestinian Economic Prospects: Gaza Recovery and West Bank Revival
offensive. The conference represented an opportunity for the donor community to demonstrate its support and commitment to the reconstruction process. It was also the occasion for the PA to affirm its leadership in the recovery and reconstruction process and to present its Palestinian National Early Recovery and Reconstruction Plan for Gaza 2009-2010. 4.42 To complement the PA report, the World Bank presented its own report25 with an outline of the various fund-channeling options to support a coordinated response for the recovery and the reconstruction of Gaza. The World Bank report provides a brief overview of the importance of budget support to the PA, the role of PA expenditures in providing services to the people of Gaza, and the various ways of providing budget support (or its equivalent) to the PA. It also describes other Palestinian institutions that have a proven track-record in implementing donor-financed projects in Gaza in water and sanitation, municipal infrastructure, energy, and NGO-based service delivery. Thus, donors who wish to provide support to Gaza through Palestinian institutions other than the PA can choose to work with the Municipal Development and Lending Fund (MDLF) and the NGO Development Center (NDC), for example. On PA implementation capacity in Gaza, the report also provides information on the Palestinian Water Authority (PWA), the Palestinian Energy Authority (PEA), and the Coastal Municipalities Water Utility (CMWU). These institutions have the capacity to implement donor-financed activities in Gaza, provided that the necessary materials are allowed through the crossings. Finally, the report describes a broad array of World Bank-financed projects and multi-donor trust funds that are already operating in Gaza and which could be scaled up quickly with additional donor resources. 4.43 Despite the absence of a formal pledging session, many of the 90 participating countries in the Sharm el-Sheikh Conference made pledges for both the recovery of Gaza and the support of the entire Palestinian economy. Participants pledged an approximate total of US$4.5 billion covering the next two years. They committed themselves to start disbursing these pledges as quickly as possible in order to rapidly impact the daily lives of the Palestinians. Donors’ intentions and efforts have been thwarted, to date, by the closure that continues to be imposed on Gaza and that does not allow the entry of such basic materials as cement, steel, glass, equipment, and spare parts. Table 5 provides a breakdown of the current pledges.
36
25 World Bank. March 2009. Fund Channeling for Early Recovery and Beyond: The World Bank Perspective.

Economic Monitoring Report to the Ad Hoc Liaison Committee
37
Table 5: Pledges at Gaza Conference, Sharm el-Sheikh, March 2, 2009
Country Pledge (USD) Arab Donors Algeria 200,000,000Bahrain 23,000,000Kuwait 200,000,000Lebanon 1,000,000Morocco 15,000,000Qatar 250,000,000Saudi Arabia 1,000,000,000Tunisia 1,300,000United Arab Emirates 174,000,000
Sub-total 1,864,300,000European Donors EU 55,440,000Austria 7,500,000Belgium 50,000,000Cyprus 1,000,000Czech Republic 700,000Denmark 220,000,000Estonia 100,000Finland 50,400,000France 37,800,000Germany 189,000,000Greece 5,000,000Hungary 170,000Ireland 3,250,000Italy 100,000,000Luxembourg 6,260,000Netherlands 170,100,000Portugal 3,000,000Romania 300,000Slovakia 82,000Slovenia 182,700Spain 148,900,000Sweden 78,900,000Turkey 93,000,000UK 30,000,000
Sub-total 1,251,084,700Asian Donors China 2,200,000India 1,000,000Japan 200,000,000Malaysia 100,000Singapore 1,000,000South Korea 15,000,000
Sub-total 219,300,000Other Australia 12,900,000Brazil 10,000,000United States 900,000,000
Sub-total 922,900,000Total 4,257,584,700
Source: Palestine Affairs, Ministry of Foreign Affairs, Egypt Note: Excludes pledges channeled through international organizations

Palestinian Economic Prospects: Gaza Recovery and West Bank Revival
4.44 Several participants emphasized the importance of movement and access for the recovery of Gaza and the improvement of the shattered economy in both the West Bank and Gaza. Accordingly, removing the closure policy on Gaza and the restrictions in the West Bank was deemed a precondition for recovery and reconstruction. Participants agreed on the need for increased coordination in the reconstruction process to maximize the benefits of the pledges and avoid wasteful duplications. Most of the donors also agreed on the use of existing mechanisms, both financial and diplomatic. In this respect, donors believe that the AHLC will continue to play a pivotal role to further coordinate policies and programs. A number of Arab countries expressed their preference to fund individual projects or create new distribution systems for budget support, including through their national funds or the Islamic Development Bank.
38

Economic Monitoring Report to the Ad Hoc Liaison Committee
39
5. Concluding Remarks 5.1 The 2009 PA budget presents a best case scenario and it is proving challenging to reach its targets. The PA is continuing its reforms under the PRDP; however, preliminary first quarter results indicate that its financial position is becoming grave26. This is partially due to the fact that aid was less than expected. But it is also the result of lower domestic revenue and higher expenditures than projected in the 2009 budget27. In addition, the private sector has shown little significant growth. Going forward, it is necessary for the donor community to continue to support the PA’s operations while also providing additional aid for reconstruction in Gaza. The 2009 budget was based on optimistic assumptions of economic growth and high levels of donor support, which may not be attained. Thus, it is equally important that the PA maintain its expenditures within limits that can be supported by available financial resources.
26 The World Bank has just received the PA’s first quarter report and has not yet fully analyzed it. 27 Since the PA budget does not present quarterly projections, this analysis is based upon dividing the annual budget by four. This is slightly misleading because some revenues and expenditures are lumpy and may not occur evenly throughout the year. For example, tax revenues are often higher in the first quarter while non-tax revenues occur at odd intervals, for example when the PA receives license fees from large operations such as the Wataniya Telecommunications Company. However, dividing the budget into quarters still provides a good indication of whether the PA will meet its budget targets.

Annex 1 Palestinian Authority Expenditures by Function
(Commitment Basis) January-December 2008
(in US dollars) -15 Jan-2009 Total
ExpenditureWages & Salaries
Operational Expenses
Transfer Expenditure
Capital Expenditure
Central Administration President's Office 44,766,902 15,094,906 27,927,105 1,731,968 12,924P.L.O. Institutions 19,363,893 16,893,867 2,161,138 308,888 Legislative Council 11,717,133 5,525,152 1,137,055 5,037,497 17,429Ministers' Council 5,533,036 4,296,861 760,340 446,342 29,494Financial and Administrative Control Department 2,417,215 2,021,608 191,035 199,039 5,532General Personnel Office 31,704,855 25,270,940 1,261,002 5,171,629 1,284Palestinian Central Bureau of Statistics 4,066,293 3,445,827 288,123 328,673 3,671Total 119,569,326 72,549,159 33,725,799 13,224,035 70,334Security and Public Order Ministry of Interior and National Security 760,613,747 623,242,486 47,209,913 87,729,502 2,431,846Ministry of Justice 8,413,007 7,497,240 182,060 733,707 Supreme Judicial Council 11,662,257 10,667,743 278,563 715,951 Land Authority 3,501,302 2,644,309 304,416 540,430 12,146Ministry of Local Government 12,602,403 5,355,610 261,154 6,977,734 7,905The Higher Judicial Council 5,261,519 4,444,719 66,904 749,896 Dar AlFatwa and Islamic research 1,111,349 933,580 68,881 108,888 Total 803,165,584 654,785,688 48,371,890 97,556,109 2,451,897Financial Affairs Ministry of Finance 51,224,779 22,170,789 23,728,370 5,281,850 43,771The Ministry of Awqaf and Religious Affairs 28,058,409 23,134,738 265,676 4,657,996Palestinian Water Authority 4,676,270 1,381,727 3,138,425 156,118Retirees Pension Allowances 164,253,857 6,609 164,247,249Public Debt Service 48,705,134 48,705,134Development Expenditures 62,116,657 7,996,973 123,396 53,996,288General Expenditures 5,723,888 4,732,030 821,080 170,778Financial Reserves 49,448,800 3,817,350 45,631,450 Total 414,207,794 46,693,862 92,383,957 220,919,138 54,210,837Foreign Affairs Negotiations Affairs Department 448,458 330,367 76,324 41,767 Embassies 23,183,511 12,423,142 8,236,684 1,872,665 651,020Ministry of Foreign Affairs 9,615,984 8,432,823 559,137 624,023 Total 33,247,952 21,186,333 8,872,145 2,538,455 651,020Economic Development Ministry of National Economy 11,908,971 10,424,008 447,904 1,037,058 Industrial Zones Board 750,668 647,213 38,897 64,558 Specifications and Standards Office 1,370,248 1,187,579 89,007 93,662 General Authority for Investment Promotion 773,923 554,532 162,779 56,612 Ministry of Energy and Natural Resources 4,363,805 1,671,909 1,631,311 182,226 878,360Ministry of Planning 2,421,440 1,856,679 261,817 302,945 Ministry of Public Works and Housing 12,282,841 9,080,853 541,387 2,623,500 37,101Ministry of Agriculture 20,236,479 14,024,724 1,297,689 4,914,066 Environmental Quality Authority 2,654,139 2,402,456 24,250 227,433 Total 56,762,515 41,849,953 4,495,040 9,502,060 915,461

Economic Monitoring Report to the Ad Hoc Liaison Committee
41
Expenditures by Function (Commitment Basis) January-December 2008, continued http://www.pmof.ps/news/plugins/spaw/uploads/files/table6b_eng_3.pdf
(in US dollars) -15 Jan-2009 Total
Expenditure Wages & Salaries
Operational Expenses
Transfer Expenditure
Capital Expenditure
Social Services Ministry of Education 471,428,462 410,393,142 11,717,315 49,223,066 94,939Ministry of Health 237,212,377 140,442,663 86,967,236 9,639,521 162,958Ministry of Social Affairs 164,804,316 9,589,746 515,386 154,699,184 Ministry of Prisoners Affairs 73,802,729 4,154,213 111,551 69,536,965 Ministry of Women's Affairs 1,103,286 879,652 52,202 90,824 80,608Ministry of Labor 9,749,543 7,957,631 207,913 1,536,860 47,139Total 958,100,713 573,417,047 99,571,602 284,726,420 385,643Cultural and Information Services Ministry of Information 2,327,880 1,887,009 228,722 212,149 Palestinian Broadcasting and Satellite Authority 13,256,070 10,172,682 1,912,023 1,171,366 The Palestinian News Agency – WAFA 3,298,651 2,826,119 118,430 354,102 Ministry of Tourism and Antiquities 4,365,076 3,303,146 184,757 876,786 387Ministry of Youth and Sports 8,094,411 6,417,582 972,491 704,339 Ministry of Culture 3,703,253 2,754,091 656,756 292,406 Total 35,045,341 27,360,629 4,073,178 3,611,148 387Transport and Communication service Ministry of Transportation 12,071,315 10,183,466 675,114 1,212,735 Ministry of Communications & Information Technology 6,393,414 5,330,788 374,488 688,138 Total 18,464,729 15,514,254 1,049,602 1,900,873 0Grand Total 2,438,563,953 1,453,356,923 292,543,214 633,978,237 58,685,579
Source: http://www.pmof.ps/news/plugins/spaw/uploads/files/table6b_eng_3.pdf

References International Monetary Fund. 2009. Macroeconomic and Fiscal Framework for the West Bank and Gaza: Third Review of Progress, Staff Report, February 25, 2009. Lancet Series: Health in the Occupied Palestinian Territory, launched in London, UK, March 4, 2009, available at http://www.thelancet.com/series/health-in-the-occupied-palestinian-territory Office for the Coordination of Humanitarian Affairs, Occupied Palestinian Territory. February 2009. The Humanitarian Monitor. Office for the Coordination of Humanitarian Affairs, Occupied Palestinian Territory. April 2009. The Humanitarian Monitor. Office for the Coordination of Humanitarian Affairs, Occupied Palestinian Territory. May 2009. West Bank Movement and Access Update. Palestinian Authority. 2009. The Palestinian National Early Recovery and Reconstruction Plan for Gaza, 2009-10. Peace Now Report Summary of Construction in the West Bank 2008 available at http://www.peacenow.org.il/data/SIP_STORAGE/files/5/3935.pdf United Nations. 2009. Occupied Palestinian Territory Gaza Flash Appeal – 2009 Consolidated Appeal Process. World Bank. September 2006. West Bank and Gaza Country Economic Memorandum – Growth in West Bank and Gaza: Opportunities and Constraints, Volume I: Main Report. World Bank. January 2008. West Bank and Gaza Telecommunications Sector Note: Introducing Competition in the Palestinian Telecommunications Sector. World Bank. October 2008. The Economic Effects of Restricted Access to Land in the West Bank. World Bank. December 2008. Palestinian Trade: West Bank Routes. World Bank. March 2009. Program Document for a Proposed Grant in the Amount of Equivalent to US$40 Million to the Palestine Liberation Organization (for the Benefit of the Palestinian Authority) for a Palestinian Reform and Development Plan Development Policy Grant II in West Bank and Gaza. World Bank. March 2009. Fund Channeling for Early Recovery and Beyond: The World Bank Perspective.

Economic Monitoring Report to the Ad Hoc Liaison Committee
43
World Bank. April 2009. Assessment of Restrictions on Palestinian Water Sector Development.
World Bank. Forthcoming 2009. Gender Issues in the West Bank and Gaza: Navigating Occupation and Conflict.