the need for subsidies in adoption of high efficiency and ... · adoption of high efficiency and...
TRANSCRIPT

The Need for Subsidies in
Adoption of High Efficiency
and Renewable Energy
Heating Systems
Pratik Mukerji
Energy Policy and Economics
Dr. Thomas Rutherford
April 20, 2011

Contents
Introduction 1
Smart Grid and the Energy Market 3
Effect of Government Subsidies on Supply and Demand 6
Ground Source Heat Pump Model 9
Micro Combined Heat and Power Model 15
Discussion and Concluding Remarks 19
Bibliography 21
i

Introduction
Energy Performance of Buildings
In 2010, the European Parliament amended their directive on the energy
performance of buildings, stating that by December 31, 2020, all new buildings
in the European Union (EU) must be “nearly zero-energy buildings.” A nearly
zero-energy building is defined by Directive 2010/31/EU (2010) as “a build-
ing that has very high energy performance.” Since buildings currently account
for approximately 40% of all energy consumption in the EU, improved energy
efficiency in the building sector would reduce overall demand and as a result
increase energy independence in Europe. How are building designers and oper-
ators to achieve this reduction in energy consumption? According to Directive
2010/31/EU (2010), evaluation of energy performance in buildings should in-
clude “factors that play an increasingly important role such as heating and air
conditioning.”
Micro Combined Heat and Power
Micro combined heat and power (mCHP) is one heat generation method
that could play a significant role in nearly zero-energy buildings. Combined
heat and power systems produce both heat and electricity to reach high overall
efficiency (Energy Savings Trust UK, 2011). Coupled with heat storage and
the concept of a Smart Grid, mCHP systems have the potential to lower peak
energy demands and even provide opportunities for building owners to profit
1
2
from their local energy production.
Ground Source Heat Pumps
Excluding methods that make use of ties to the power grid, a ground source
heat pump (GSHP) is another promising heat generation method. GSHP sys-
tems take advantage of the heat engine concept from thermodynamics, drawing
heat stored in the ground at low constant temperatures and transferring it to
the distribution system of a building at a higher temperature. Through this
process, ratios of heating power output to electricity input are achieved far in
excess of 100% (Energy Savings Trust UK, 2011). This raises the question: if
these systems are so efficient, why are they not being implemented everywhere?
The Issue
Like many high performance systems, mCHP and GSHP systems have a
higher initial cost than their traditional heating counterparts and are not suit-
able investments for many building owners. In response, Directive 2010/31/EU
(2010) states that measures need to be taken to encourage investment in high
performance systems, including direct subsidies or grant schemes. Subsidizing
the purchase of high efficiency and renewable energy systems could bridge the
financial gap and promote their adoption by building owners, but how much
money will it take?
The Smart Grid concept and its relationship to future energy markets (par-
ticularly dynamic pricing) will be discussed. Further emphasis will be on the
effects of government subsidies and their contribution towards the adoption of
high efficiency and renewable energy heating technologies.
Smart Grid and the Energy
Market
Smart Grid Benefits
The Smart Grid concept is a complex infrastructure of information and
communication technology combined with improved accessibility and reliability
of the power grid. In this futuristic system, distributed energy resources (DERs)
in the form of local energy production (solar panels, combined heat and power,
etc.) could be easily connected to the grid in large scales. Real time prices based
on energy supply and demand would also be available to all users (NEMA, 2011).
As a result, automated systems may be designed to operate building services to
optimize costs. Services may include heating and cooling, as well as operation
of appliances such as washing machines and dishwashers. All of these services
could be designed to operate in a “Smart” way by planning operation to take
advantage of low price periods and adapting to changes in real time.
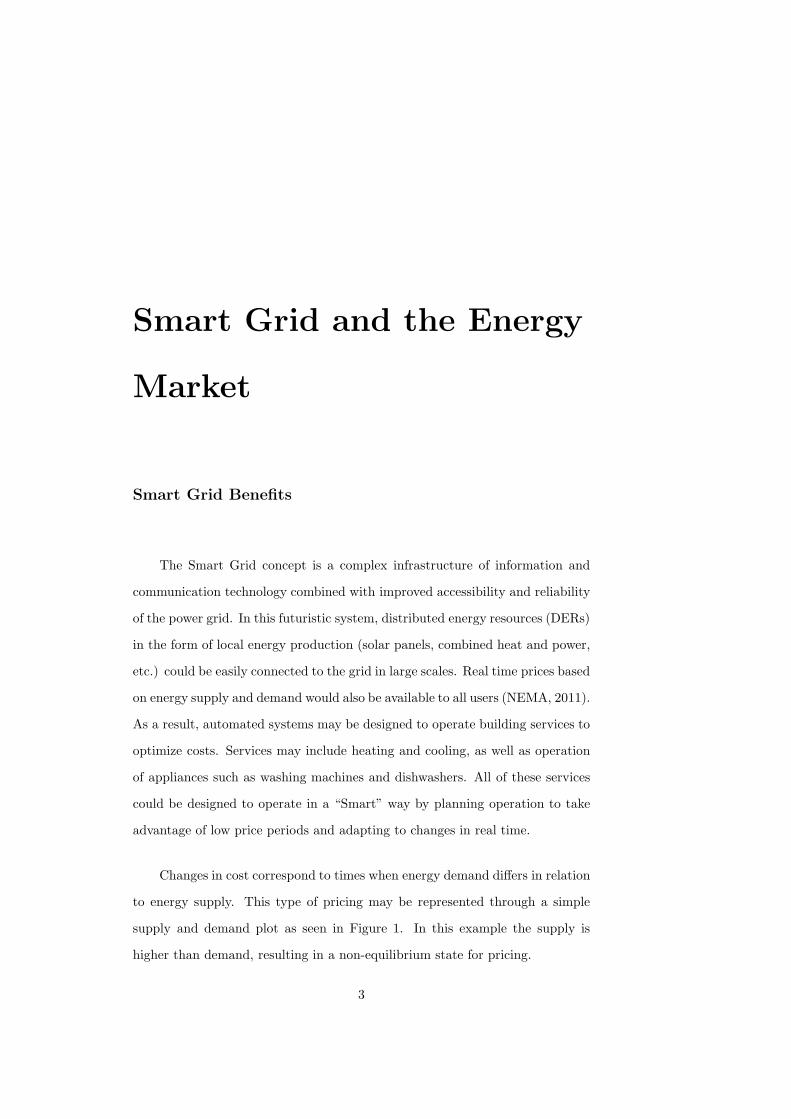
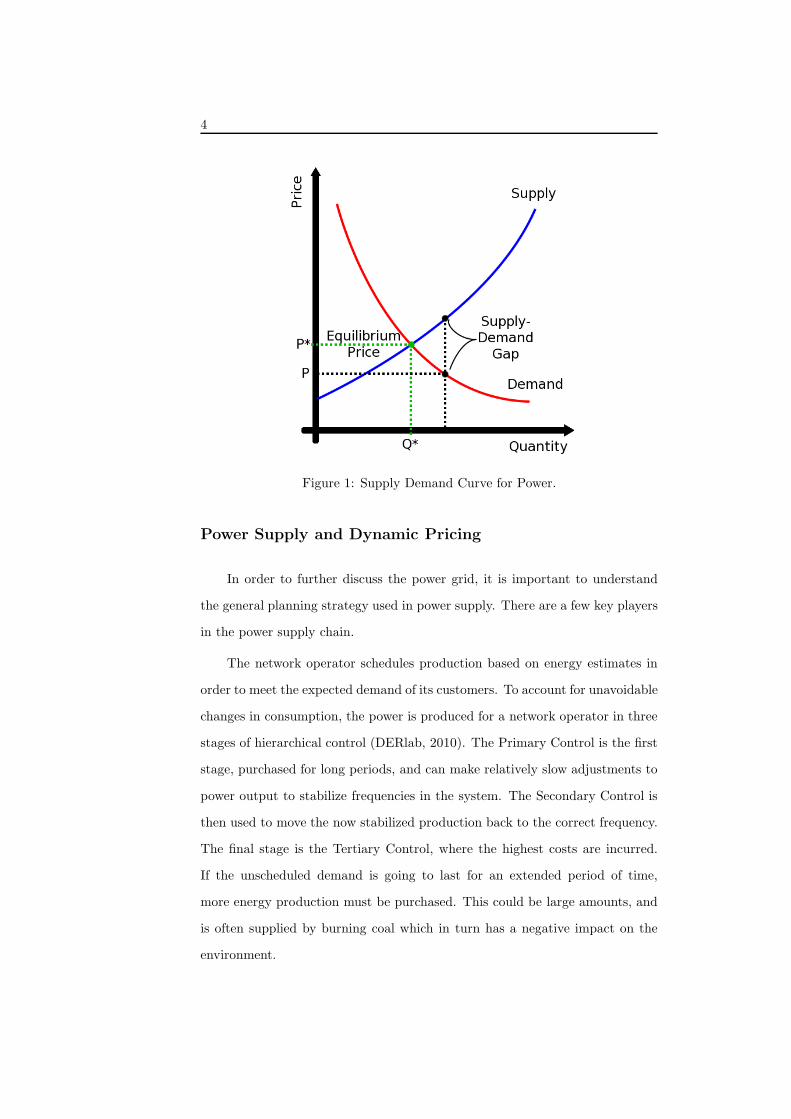
Changes in cost correspond to times when energy demand differs in relation
to energy supply. This type of pricing may be represented through a simple
supply and demand plot as seen in Figure 1. In this example the supply is
higher than demand, resulting in a non-equilibrium state for pricing.
3
4
Figure 1: Supply Demand Curve for Power.
Power Supply and Dynamic Pricing
In order to further discuss the power grid, it is important to understand
the general planning strategy used in power supply. There are a few key players
in the power supply chain.
The network operator schedules production based on energy estimates in
order to meet the expected demand of its customers. To account for unavoidable
changes in consumption, the power is produced for a network operator in three
stages of hierarchical control (DERlab, 2010). The Primary Control is the first
stage, purchased for long periods, and can make relatively slow adjustments to
power output to stabilize frequencies in the system. The Secondary Control is
then used to move the now stabilized production back to the correct frequency.
The final stage is the Tertiary Control, where the highest costs are incurred.
If the unscheduled demand is going to last for an extended period of time,
more energy production must be purchased. This could be large amounts, and
is often supplied by burning coal which in turn has a negative impact on the
environment.

5
Keeping in mind that all the power produced for the network operator
must be either used or dissipated somewhere, and the complications involved in
quickly adjusting power output, one can understand why it is in the interest of
a network operator to adjust energy prices when there is a surplus of supply.
In the opposite case, when there is not enough energy, it makes sense for
energy companies to pay customers to reduce energy consumption and compen-
sate for increased usage by other consumers. This is one of the key interesting
economic factors of a Smart Grid combined with local energy production and
heat storage. Consumers are able to store or produce energy to use during
peak power periods, reducing their consumption from the grid or even supply-
ing power back to the grid to compensate for low supply (NEMA, 2011). In the
process, building owners may even make profit. A simplified version of selling
electricity to the current grid systems is discussed later in the mCHP model.
Effect of Government
Subsidies on Supply and
Demand
Demand Shift
The effect of government subsidies on supply and demand may be viewed
from two perspectives: an upward shift in the demand curve, or a downward
shift in the supply curve. In the case of direct grants offered to consumers
purchasing high efficiency or renewable energy systems, it is more clear to view
this as an upward shift in the demand curve. The upward shift corresponds
to consumers being able to afford products at a higher price with the grant or
subsidy covering the difference (Figures 2-3).
Based on these plots we can see what sort of general effect a subsidy may
have on the market for high efficiency or renewable energy heating systems. At
some cost to the government, the demand for these systems will be increased,
and suppliers will also have increased profits, as seen in Figure 4.
Estimations
The issues that remain are to determine an appropriate representation of
the price of a system (more complex than the initial cost), and an estimate of
6

7
Figure 2: Supply Demand Curve.
Figure 3: Price changes due to subsidies.
how large of a subsidy would be required to make these systems attractive to
building owners. These will be discussed in the sections that follow.

8
Figure 4: Supplier and Consumer gains due to subsidies.

Ground Source Heat Pump
Model
Background
As previously described, a ground source heat pump is a heat generation
system that draws heat from the ground for use in buildings. The system works
by circulating cold water through pipes in the ground (raising the temperature
of the water) and then uses the heat pump to remove heat from the water and
transfer it to the building. The advantage of a GSHP is that instead of creating
the heat from another medium (e.g. natural gas), the heat is only transferred
from one location to another (Energy Savings Trust UK, 2011). The ratio of
heat output to the electrical power used by the heat pump is known as the
Coefficient of Production (COP). Although the COP has a strong dependence
on the temperature of the water and the temperature inside the building, a
conservative COP estimate of 3.5 will be used for our GSHP.
RETScreen Software
The model for the ground source heat pump makes use of the software
program RETScreen (Natural Resources Canada, 2011). RETScreen uses sim-
plified models of heating (and other energy) systems, combined with weather
data and user inputs to simulate energy comparisons among multiple configura-
tions. It is used here to evaluate the typical yearly cost of a GSHP compared to
9
10
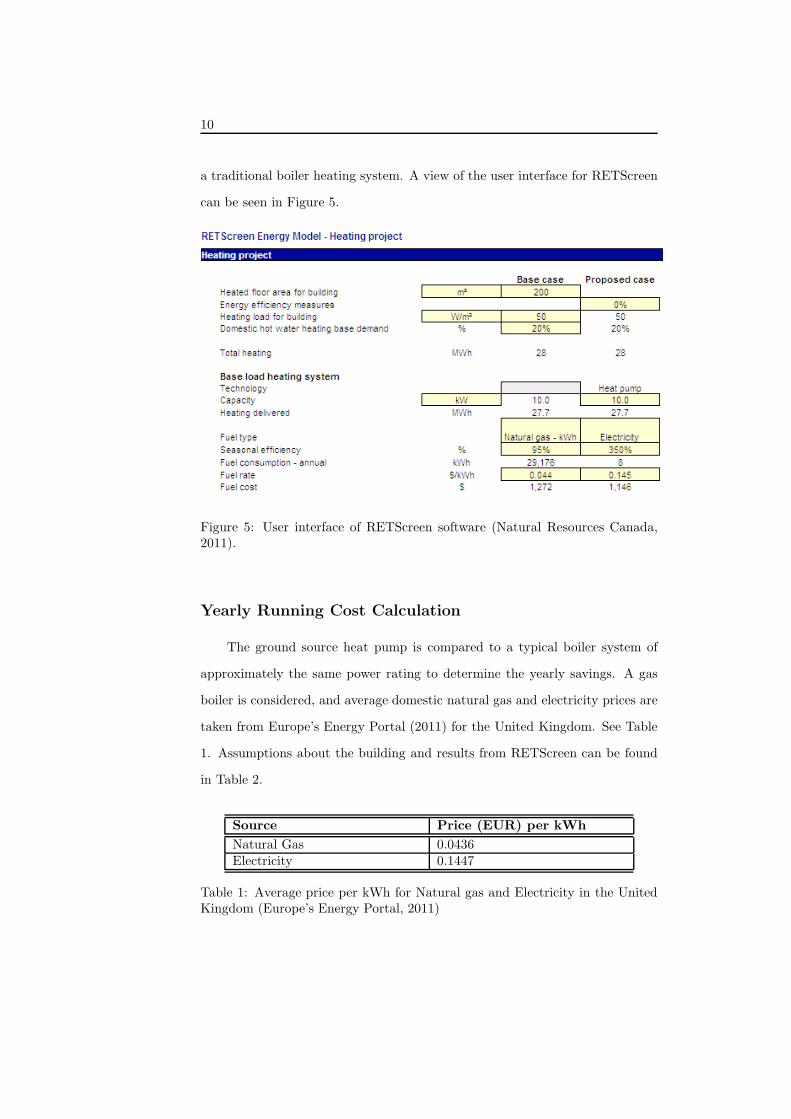
a traditional boiler heating system. A view of the user interface for RETScreen
can be seen in Figure 5.
Figure 5: User interface of RETScreen software (Natural Resources Canada,2011).
Yearly Running Cost Calculation
The ground source heat pump is compared to a typical boiler system of
approximately the same power rating to determine the yearly savings. A gas
boiler is considered, and average domestic natural gas and electricity prices are
taken from Europe’s Energy Portal (2011) for the United Kingdom. See Table
1. Assumptions about the building and results from RETScreen can be found
in Table 2.
Source Price (EUR) per kWh
Natural Gas 0.0436Electricity 0.1447
Table 1: Average price per kWh for Natural gas and Electricity in the UnitedKingdom (Europe’s Energy Portal, 2011)

11
Input Value
Building Floor Area 200m2
Heating Demand 50W/m2
Domestic Hot Water Heating 20%Boiler Seasonal Efficiency 95%Heat Pump average COP 3.5
ResultsBoiler Annual Cost 1272 EURBoiler Annual Energy Usage 29 MWhHeat Pump Annual Cost 1146 EURHeat Pump Annual Energy Usage 8 MWh
Table 2: RETScreen (Natural Resources Canada, 2011) approximated inputsand outputs for GSHP model.
As one can see, given the model assumptions, the annual energy bill for
the boiler is 126 EUR higher than the heat pump. This looks like a reasonable
gain, not only in cost, but also in energy usage with reduction by a factor of
more than 3.5. The missing factor here is initial costs.
Overall Cost Calculation
A typical high efficiency combination boiler system has initial costs of
around 1200 EUR (WhatPrice.co.uk, 2011), whereas a GSHP with installation
(including digging boreholes for the ground heat exchanger) can reach prices in
the range of 10000-20000 EUR (Energy Savings Trust UK, 2011). For a simple
analysis, let the initial cost of a boiler system be 1200 EUR and the initial cost
of a GSHP be 15000 EUR.
Cost(EUR) = 1200(EUR) + x(Years)× 1272(EUR/Year)
= 15000(EUR) + x(Years)× 1146(EUR/Year)
x = 110(Years)
(1)
From this simple calculation we see that after 110 years of operation the

12
overall costs of the two systems would be equal. Since the costs up until this
point are always higher for the GSHP, this result already indicates an unfavor-
able situation. In order to make the calculation more accurate, it is important
to take into account the time value of money (NSGIC, 2006). We would like
to know the period of operation for which the Net Present Value of a typical
boiler is equal to the Net Present Value of the heat pump system. Assuming a
discount factor of 2.6% (NSGIC, 2006) and ignoring the lifetimes of each sys-
tem, one can write the Net Present Value of each system as follows with N as
the total number of years operating.
Net Present Value(EUR) = −1200(EUR)+
N∑
t=1
−1272(EUR)×1
(1 + r)t
= −15000(EUR)+N∑
t=1
−1146(EUR)×1
(1 + r)t
(2)
One can then simplify the geometric sum further, due to the assumption
of constant yearly costs.
N∑
t=1
1
(1 + r)t=
( 11+r
−1
(1+r)n+1 )
1− 11+r
(3)
The following equation then allows us to calculate the time period N at
which they are equal:
N = −
ln(1− rα)
ln(1 + r)
α =−15000− (−1200)
−1272− (−1146)
(4)
As can be seen in Figure 6 below, due to the discounting of future savings
with the GSHP, a point of equality is never reached.
If a subsidy (in this case a direct grant) is introduced at the time of pur-

13
0 100 200 300 400 500 600 700 800 900 10000.8
0.9
1
1.1
1.2
1.3
1.4x 10
4
# of Years
NP
Vbo
iler−
NP
VG
SH
P
Period before gains from GSHP
Figure 6: Difference between Net Present Value of a new boiler system and aGSHP.
chase, the following behavior can be observed: With grants of approximately
9000 EUR and greater, it becomes possible to reach an equilibrium net present
value for the two systems. As can be seen in Figure 7, the initial increments
above 9000 EUR have the largest effect on the equilibrium period, with the
incremental gains reducing as the grant approaches the full value of the GSHP.
Figure 8 shows that with a grant of about 12700 EUR, the equilibrium period
is 10 years.

14
0.8 0.9 1 1.1 1.2 1.3 1.4 1.5
x 104
0
50
100
150
200
250
Value of Grant (EUR)
# of
Yea
rs to
equ
al N
et P
rese
nt V
alue
Period of gains for a given grant size
Figure 7: Relationship between grant value and equilibrium period with respectto net present value of the boiler system and GSHP
9 9.5 10 10.5 11 11.5
−100
−50
0
50
100
# of Years
NP
Vbo
iler−
NP
VG
SH
P
Period before gains from GSHP (Grant 12700 EUR)
Figure 8: Difference between Net Present Value of a new boiler system and aGSHP given a 12700 EUR grant. Gains occur after approximately 10 years.

Micro Combined Heat and
Power Model
Background
Micro-combined heat and power (mCHP) is a high efficiency heat and elec-
tricity generation system, often in the form of a combustion engine. The device
burns fossil fuels such as natural gas in order to generate electricity, with the
byproduct, heat, captured and used by the building heating system (Energy
Savings Trust UK, 2011). This combination produces overall efficiencies of 90%
and higher (WhisperGen, 2011). When combined with heat storage in the form
of hot water storage tanks, a consumer is able to perform load shifting, select-
ing when to turn on the mCHP based on current prices and his own building
demands.
According to Energy Savings Trust UK (2011), typical initial costs for
mCHP systems are 5500 GBP (approximately 6250 EUR [Oanda, 2011]). A
financial incentive also currently exists in some areas such as the UK and Ger-
many called Feed-in Tariffs. Building owners are paid fixed amounts for each
kWh of electricity they generate and a separate amount for each unit of energy
they export to the grid (Energy Savings Trust UK, 2011).
15

16
Yearly Running Cost Calculation
The mCHP model will be compared to a standard natural gas boiler with
a heat demand of 10 kW. The specifications from an example mCHP produced
by WhisperGen (2011) will be used with RETScreen to calculate the energy
usage. In addition, a constant Feed-in Tariff model will be used to calculate the
gains from electricity sales (Energy Savings Trust, 2011). According to Energy
Savings Trust UK (2011) the Feed-in Tariff in the United Kingdom is a total of
13 pence (0.1472 EUR [Oanda, 2011]) per kWh assuming all electricity is sold
to the grid.
Input Value
Building Floor Area 200m2
Heating Demand 50W/m2
Domestic Hot Water Heating 20%Boiler Seasonal Efficiency 95%mCHP Heating Efficiency 82%mCHP Heating to Electricity Output Ratio 10 : 1
ResultsBoiler Annual Cost 1272 EURBoiler Annual Energy Usage 29 MWhmCHP Annual Heating Cost 1474 EURmCHP Annual Energy Usage 33.8 MWhmCHP Annual Heat Delivered 27.7 MWhmCHP Annual Energy Production* 2.77 MWhmCHP Annual Energy Sales* 398 EUR
Table 3: RETScreen (Natural Resources Canada, 2011) approximated inputsand outputs for mCHP model. *Note: Energy production and sales calculatedusing a fixed 10:1 ratio of heat to power output (WhisperGen, 2011), and 0.1472EUR per kWh Feed-in Tariff (Energy Savings Trust UK, 2011).
Overall Cost Calculation
Similar to the calculation for the GSHP, for what period would the Net
Present Value of running a typical boiler in our simple model equal the Net
Present Value of the mCHP system? A discount factor of 2.6% is assumed and
the lifetimes of each system are ignored.

17
Net Present Value(EUR) = −1200(EUR) +
N∑
t=1
−1343(EUR)×1
(1 + r)t
= −6250(EUR) +
N∑
t=1
(
[−1474(EUR) + 0.1472(EUR/kWh)
× 0.1× 27.7(MWh)]×1
(1 + r)t
)
(5)
The key difference here between the GSHP and mCHP is that electricity
produced by the mCHP (proportional to its heat demand) is sold to the grid.
38.6 38.8 39 39.2 39.4 39.6 39.8 40 40.2
−40
−30
−20
−10
0
10
20
30
40
50
60
# of Years
NP
Vbo
iler−
NP
Vm
CH
P
Period before gains from mCHP
Figure 9: Difference between Net Present Value of a new boiler system and anmCHP.
The period of operation before gains are made for the mCHP in Net Present
Value over the boiler system is approximately 40 years (Figure 9). If direct cash
grants during purchase were offered, this period would reduce as seen in Figure
10.

18
0 1000 2000 3000 4000 5000 6000 70000
5
10
15
20
25
30
35
40
Value of Grant (EUR)
# of
Yea
rs to
equ
al N
et P
rese
nt V
alue
Period of gains for a given grant size (mCHP)
Figure 10: Relationship between grant value and equilibrium period with respectto net present value of the boiler system and mCHP.

Discussion and Concluding
Remarks
Discussion of Results
The parameters and inputs used to simulate the two models in this paper
were approximate values taken from various sources. In the following discussion,
it is acknowledged that inaccuracies in these parameters may carry through to
the general findings. Nevertheless, some interesting insights into the economic
feasibility of high energy performance heating systems can be gained.
The most important result found was that when looked at purely from a
cost perspective, the period before building owners would see gains without a
government subsidy were high. In the case of the ground source heat pump, it
was observed to be impossible, and with the micro combined heat and power
system, approximately 40 years. For the GSHP, grants of about 12700 EUR
would bring the period down to approximately 10 years and in the case of the
mCHP, grants of around 3200 EUR would do the same.
From an energy perspective, the situation is more complicated. The mCHP
system (with a heating energy usage of 33.8 MWh and a return of 2.77 MWh to
the grid through electricity generation) had a net energy usage of approximately
31MWh compared to the boiler usage of 29 MWh. Although this seems like an
overall loss, many factors concerning the origin of the electrical energy must be
taken into account. Primary fuels such as oil or natural gas, are actually used
19

20
to produce electricity on the grid, with losses in conversion and transmission
as high as 60% before the usable electricity reaches your home (WhisperGen,
2011). This means that the electricity produced and used locally could avoid
some of this loss. The ground source heat pump energy usage is more than a
factor of 3.5 times lower than that of the boiler system. Even considering the
additional losses in the production and transmission of the electricity used to
run the heat pump, there are large gains in overall energy efficiency.
Extensions and Outlook
In the future, with real time simulations of systems such as micro combined
heat and power, it would be interesting to examine whether gains would be
higher for owners selling electricity to the grid based on real time market prices
or Feed-in Tariffs. According to Energy Savings Trust (2011), the Feed-in Tariffs
for the UK are not guaranteed for an unlimited period, which may suggest that
examining the real time price situation is important.
Current grant programs in countries such as Ireland have also been investi-
gated. According to the Sustainable Energy Authority of Ireland (2011), build-
ing owners may be eligible for grants of approximately 3500 EUR for ground
source heat pump installations. The analysis in this paper shows that this size
of grant is likely not enough, based on cost, to justify selecting a heat pump
system over a traditional boiler system. Research into the methods that govern-
ments use to select grant values, as well as the choice between situation-based
grants (depending on the size of the installations etc.) and fixed grants would
also be of interest to further the discussion.
The dedication of the European Union to promoting high efficiency and
renewable energy systems is admirable. If the EU is able to meet its goal of
nearly zero-energy buildings by 2020, it will be a great accomplishment, but
it is clear that in order to make these changes economically feasible, subsidies
must be created.

Bibliography
1. Directive 2010/31/EU, Volume 53, 18 June 2010, Official Journal of the
European Union, pp 13-35.
2. Energy Savings Trust UK. Micro combined heat and power (micro CHP).
2011. http://www.energysavingtrust.org.uk/Generate-your-own-energy/
Micro-combined-heat-and-power-micro-CHP (accessed April 12, 2011).
3. Energy Savings Trust UK. Ground source heat pumps. 2011. http://
www.energysavingtrust.org.uk/Generate-your-own-energy/Ground-source-heat-pumps
(accessed April 12, 2011).
4. NEMA. What is a Smart Grid and why is it important. 2011. http://
www.nema.org/gov/energy/smartgrid/whatIsSmartGrid.cfm (accessed
April 18, 2011).
5. DERlab. Power System Services Provided by DER Units - Discussion
Paper. 2010-03-10.
6. National Resources Canada. RETScreen (Software). 2011. http://www.
retscreen.net/ang/home.php.
7. Europe’s Energy Portal. Domestic Natural Gas and Electricity Rates.
2011. http://www.energy.eu/#Domestic (accessed on April 8, 2011).
8. WhatPrice.co.uk. Boiler costs including installation, repair and service.
2011. http://www.whatprice.co.uk/plumbing/boiler.html (accessed
on April 19, 2011).
21
22
9. NSGIC. Economic Justification: Measuring Return on Investment (ROI)
and Cost Benefit Analysis (CBA). 2006. Version 1.1, p 2.
10. WhisperGen. WTL1408AC Brochure. 2011. http://www.whispergen.
com/content/library/WTL1408AC_BrochureEng.pdf (accessed April 18,
2011).
11. WhisperGen. Heat and Power Systems: MkV AC Gas fired Specs. 2011.
http://www.whispergen.com/main/achomesspecs_info/ (accessed April
18, 2011).
12. OANDA. Currency Converter. 2011. http://www.oanda.com/currency/
converter/ (accessed April 14, 2011).
13. Energy Savings Trust UK. Feed in tariffs. 2011. http://www.energysavingtrust.
org.uk/Generate-your-own-energy/Sell-your-own-energy/Feed-in-Tariff-scheme
(accessed April 12, 2011).
14. Sustainable Energy Authority of Ireland. Greener Homes Application
Guide. 2011. http://www.seai.ie/Grants/GreenerHomes/Homeowners/
How_to_Apply/Greener_Homes_Application_Guide.pdf (accessed April
19, 2011).