the need for caring in north and central brooklyn the ... the need for caring in north and central...
TRANSCRIPT

1
The Need for Caring in North and Central Brooklyn
The Community Survey
Contents Executive Summary ....................................................................................... 2
INTRODUCTION ........................................................................................... 10
Need for this Study ................................................................................... 10
The Background ........................................................................................ 11
LITERATURE SEARCH ................................................................................... 12
THE COMMUNITIES ...................................................................................... 14
THE SURVEY ................................................................................................ 17
Data Collection and Methodology ................................................................. 18
Training for the Surveyors ....................................................................... 20
The Survey Instrument ........................................................................... 20
Coding of the Open-Ended Questions ........................................................ 21
THE FINDINGS............................................................................................. 21
Population Characteristics .......................................................................... 22
Race, Ethnicity and Country of Origin ........................................................ 22
Other Neighborhood Characteristics .......................................................... 24
Health Care Experience .............................................................................. 25
Access to Care .......................................................................................... 29
Barriers to Care ........................................................................................ 43
Open-Ended Qualitative Questions on the Survey .......................................... 47
Summary and Important Findings .................................................................. 52
Recommendations ........................................................................................ 57
Endnotes .................................................................................................... 59
Judy Wessler, MPH * Mary Li, MPH
Commission on the Public’s Health System
45 Clinton Street, New York, New York 10002
212-246-0803 www.cphsnyc.org

2
Executive Summary
The study, The Need for Caring in North and Central Brooklyn, was undertaken as a
Community Health Needs Assessment to determine needs, barriers, and gaps in
access to health care services in 15 zip codes in this part of Brooklyn. The communities
identified have long been known as medically underserved and in need of more equal
treatment. The communities are: Bushwick, Beford-Stuyvesant, East New York,
Williamsburg, Brownsville and East Flatbush, Crown Heights, Flatbush, Fort Greene.
Other communities included in this study are: Downtown Brooklyn, Gowanus, and
Greenpoint.
The Need for Caring study was undertaken by a partnership of three community
organizations with significant academic back-up. The original goal was to undertake a
survey of 600 community residents and a series of focus groups to capture populations
that would not be part of the survey. Six hundred forty four surveys were completed in
the 15 zip codes. To ensure that the surveyed reflected the community, there were four
screening questions: income and household size, age, and residence in one of the 15
zip codes.
The quantitative part of the survey contains ten demographic questions and 29
questions that address the persons’ health care experience, including access to and
barriers to care. The survey also includes qualitative questions in the form of three
open-ended questions and additional requests for information added to the quantitative
questions. The focus groups bring an additional dimension and focus on the qualitative
findings of this study.
Important Findings:
The population captured in this survey mirrors the general population of the
community in which the 15 zip codes are located in North and Central Brooklyn.
o 39% of the respondents in this survey are foreign-born, and 40% of the
population of Brooklyn is foreign-born.
o Race and Ethnicity -- over 80% of the respondents in the survey are Black
and Latino. The population of Central Brooklyn is 80% Black, including
African Americans and Caribbean/West Indians.
o The income for people who are working in this study appears to be lower
than the median income in the identified zip codes. In the Need for Caring
58 percent (201 of the 300 respondents) indicated an income less than
$30,000 per year. The lowest median income is found in 11237
($23,104). Several of the zip codes had median incomes a little higher
3
than $30,000 per year (11206, 11233, 11216, 11208, 11207). The highest
median incomes are found in: 11201 ($56,293) and 11217 ($49,567).
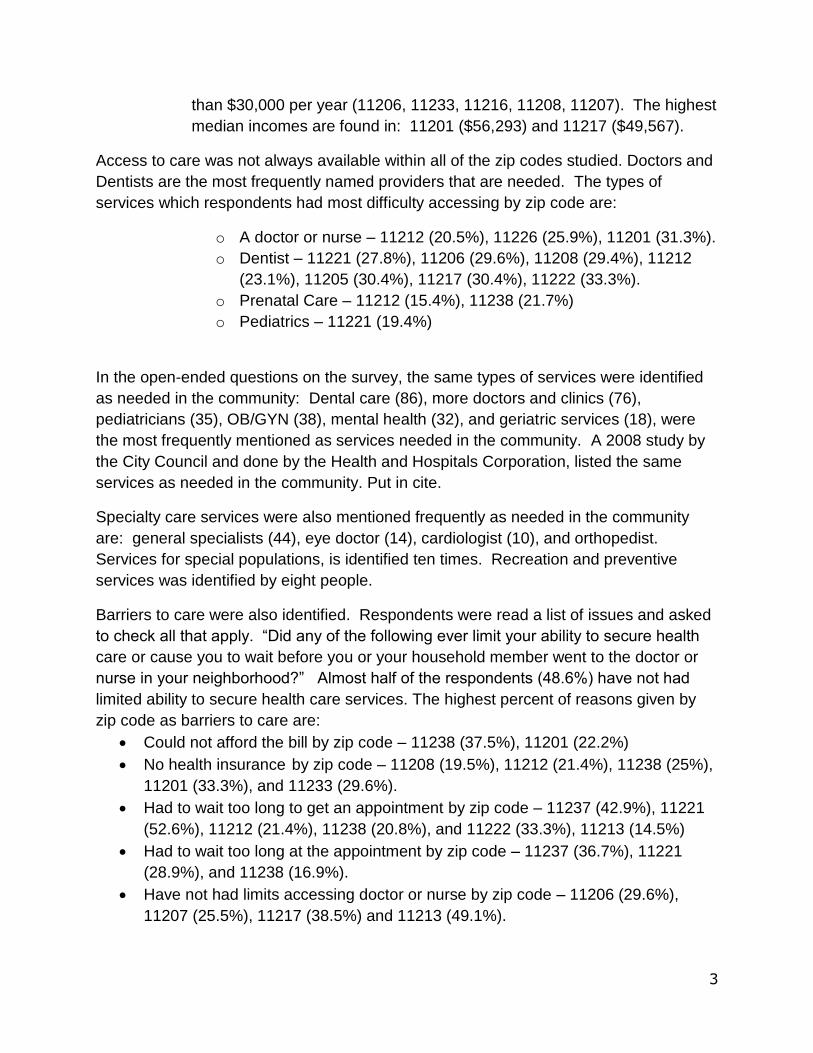
Access to care was not always available within all of the zip codes studied. Doctors and
Dentists are the most frequently named providers that are needed. The types of
services which respondents had most difficulty accessing by zip code are:
o A doctor or nurse – 11212 (20.5%), 11226 (25.9%), 11201 (31.3%).
o Dentist – 11221 (27.8%), 11206 (29.6%), 11208 (29.4%), 11212
(23.1%), 11205 (30.4%), 11217 (30.4%), 11222 (33.3%).
o Prenatal Care – 11212 (15.4%), 11238 (21.7%)
o Pediatrics – 11221 (19.4%)
In the open-ended questions on the survey, the same types of services were identified
as needed in the community: Dental care (86), more doctors and clinics (76),
pediatricians (35), OB/GYN (38), mental health (32), and geriatric services (18), were
the most frequently mentioned as services needed in the community. A 2008 study by
the City Council and done by the Health and Hospitals Corporation, listed the same
services as needed in the community. Put in cite.
Specialty care services were also mentioned frequently as needed in the community
are: general specialists (44), eye doctor (14), cardiologist (10), and orthopedist.
Services for special populations, is identified ten times. Recreation and preventive
services was identified by eight people.
Barriers to care were also identified. Respondents were read a list of issues and asked
to check all that apply. “Did any of the following ever limit your ability to secure health
care or cause you to wait before you or your household member went to the doctor or
nurse in your neighborhood?” Almost half of the respondents (48.6%) have not had
limited ability to secure health care services. The highest percent of reasons given by
zip code as barriers to care are:
Could not afford the bill by zip code – 11238 (37.5%), 11201 (22.2%)
No health insurance by zip code – 11208 (19.5%), 11212 (21.4%), 11238 (25%),
11201 (33.3%), and 11233 (29.6%).
Had to wait too long to get an appointment by zip code – 11237 (42.9%), 11221
(52.6%), 11212 (21.4%), 11238 (20.8%), and 11222 (33.3%), 11213 (14.5%)
Had to wait too long at the appointment by zip code – 11237 (36.7%), 11221
(28.9%), and 11238 (16.9%).
Have not had limits accessing doctor or nurse by zip code – 11206 (29.6%),
11207 (25.5%), 11217 (38.5%) and 11213 (49.1%).

4
Special Findings
Of all of the people with different race and ethnicity cited, African Americans had the
highest number and percent of persons using the emergency room in the last two years,
155, which was 51.5% of the African American respondents. Of this total, the highest
number of visits to the ER by African Americans was found in: 11205 (12), 11207 (17),
11208 (17), 11212 (30 – more than half of those surveyed), 11216 (16), and 11226 (12).
54 of the African American ER users are male, 95 are female. 22 are married, 126 are
not married. 67 are working and 79 are not working. 140 of the 155 African Americans
(90%) have health insurance coverage, 79 are covered by Medicaid. There is high
incidence of illnesses found in the African American population surveyed: 50 have
asthma; 26 have diabetes; 46 have high blood pressure, 23 have bone and joint
problems, 29 have hearing or vision problems, and 19 are depressed.
Pictures of the Communities
To develop the pictures of the communities below, zip codes were combined based on:
contiguous borders; similar populations; and the priority code assigned to them. The
data in each zip code that was collected during the survey and reported in this profile, is
out-of-the-ordinary, and stands out as important information to review and understand.
This information about the communities is from the analysis of the Community Health
Survey – The Need for Caring in North and Central Brooklyn.
The data on median income for these zip codes is for the population of the entire
zip code.
11237 has the lowest median income - $23,104. In 11206, the median income is
somewhat higher at $33,657. In 11221, 11233, and 11216, the median income ranges
from $34,863 to $43,236. In 11205, $32,698 is the median income. In 11238, the
median income is $39,503. In 11207, the median income is $33,657. In 11208, the
median income is $33,657. In 11212, the median income is $44,264. In 11213, the
median income is $39,503. In 11216, the median income is $42,071. The median
income in 11201 is the highest of any of the zip codes, $56,293. In 11217, the median
income is $49,567. In 11222, the median income is $33,578.
Bushwick – 11237 (49 surveyed) – Williamsburg – 11206 (55 surveyed)
Race/Ethnicity/Foreign-born- In 11237, 95.9% self-identified as Latino/Hispanic, with
89.4% foreign-born,
Insurance- 16.3% uninsured
Illnesses – In 11237, 12% Asthma, 30.6% High Blood Pressure, 20.4%
Diabetes, 28.6% Hearing and Vision Problems. In 11206, 36.4% indicated they

5
have none of the health conditions. 34% said they go to a doctor when they
don’t feel well.
Provider type- In 11237, 68.9% receive care in a hospital clinic. In 11206,
73.3% of visits are made to a doctors’ office.
Reason for going for care outside the neighborhood- In 11237, 40% wait too
long to get an appointment. 40% wait too long at an appointment. In 11206,
70.4% of visits outside of the neighborhood are to see a specialist. 33.3% of the
time is for referred care.
Bedford – Stuyvesant – 11221, 11233, 11216. (40, 27, 38 surveyed respectively)
Race/Ethnicity/Foreign-born- More than 50% of population in 11216 is African
American. Large Caribbean/West Indian population in 11216. Latino population
in 11221. 67.5% in 11221 are foreign-born. 40.7% in 11233 are foreign born.
Insurance/Employment- 14.8% are uninsured in 11233, 60.5% in 11216 are not
working. .
Illnesses – 22.5% Asthma in 11221. 18.5% (11233) and 21.1% have
hypertension in 11216. 18.4% have diabetes in 11216. 30% (11221) and 18.4%
(11216) have hearing or vision problems.
Reason for visiting provider – 11233 medical emergency 33.3%.
8.5% had no visits in the neighborhood in 11233.
Provider type – 45.9% in 11221 received care in a hospital clinic. 41.4%
received care in a community health center in 11216.
Reasons for going for care outside the neighborhood – referred to care
33.3% in 11216, 22.2% not satisfied with care in 11216.
Bedford Stuyvesant and Fort Greene – 11205 (64 surveyed) – Prospect Heights –
11238 (27 surveyed)
Employment- in 11205, 46.8% of the respondents are not working
Illnesses- in 11205, 35.9% indicated hypertension. In 11238, 51.9% said they
have none of the conditions named.
Reason for visiting provider- In 12205, 41.7% sent to the doctor because they
were not feeling well.
Provider type- In 12205, 55.2% received their care in a doctors’ office. In 11238,
61.6% received their care in a doctors’ office.
Reasons for going for care outside the neighborhood – In 11205, 58.6% to
see a specialist and 27.6% not satisfied with care in the neighborhood. In 11238,
30% said they were referred for care outside the neighborhood.
East New York – 11207 (50 surveyed) -- Cypress Hills/Clinton Hill -- 11208 (54
surveyed) – Brownsville/East Flatbush – 11212 (53 surveyed)
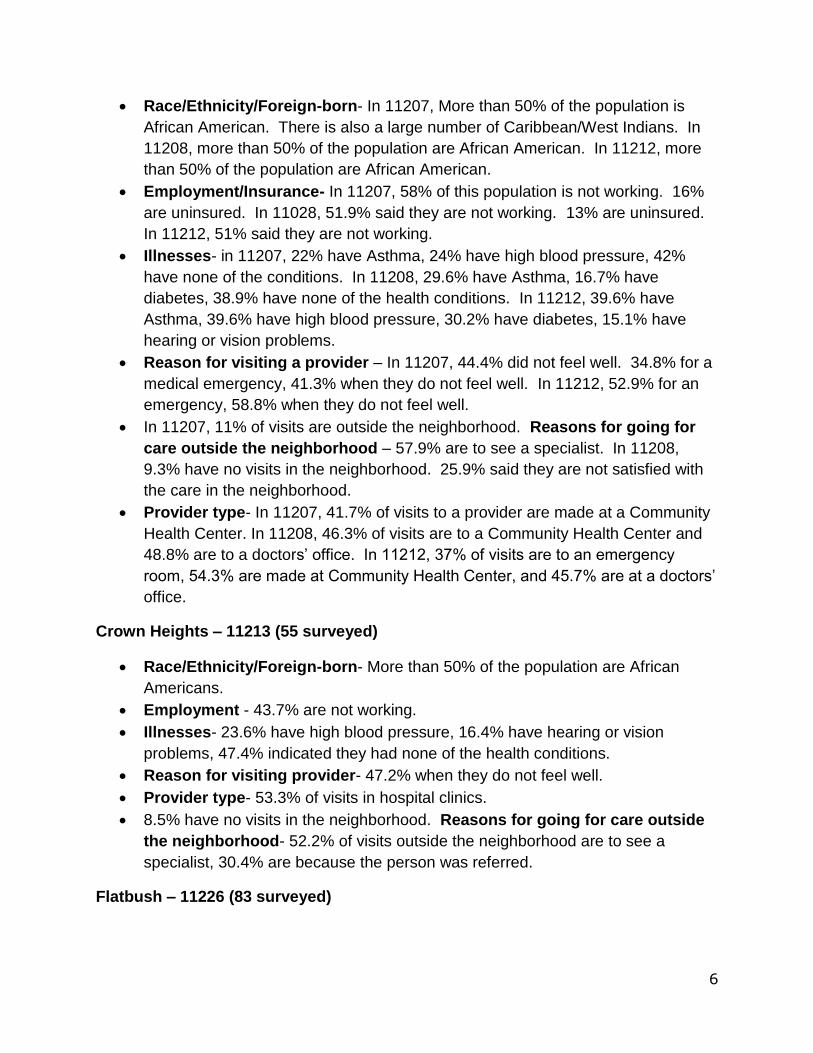
6
Race/Ethnicity/Foreign-born- In 11207, More than 50% of the population is
African American. There is also a large number of Caribbean/West Indians. In
11208, more than 50% of the population are African American. In 11212, more
than 50% of the population are African American.
Employment/Insurance- In 11207, 58% of this population is not working. 16%
are uninsured. In 11028, 51.9% said they are not working. 13% are uninsured.
In 11212, 51% said they are not working.
Illnesses- in 11207, 22% have Asthma, 24% have high blood pressure, 42%
have none of the conditions. In 11208, 29.6% have Asthma, 16.7% have
diabetes, 38.9% have none of the health conditions. In 11212, 39.6% have
Asthma, 39.6% have high blood pressure, 30.2% have diabetes, 15.1% have
hearing or vision problems.
Reason for visiting a provider – In 11207, 44.4% did not feel well. 34.8% for a
medical emergency, 41.3% when they do not feel well. In 11212, 52.9% for an
emergency, 58.8% when they do not feel well.
In 11207, 11% of visits are outside the neighborhood. Reasons for going for
care outside the neighborhood – 57.9% are to see a specialist. In 11208,
9.3% have no visits in the neighborhood. 25.9% said they are not satisfied with
the care in the neighborhood.
Provider type- In 11207, 41.7% of visits to a provider are made at a Community
Health Center. In 11208, 46.3% of visits are to a Community Health Center and
48.8% are to a doctors’ office. In 11212, 37% of visits are to an emergency
room, 54.3% are made at Community Health Center, and 45.7% are at a doctors’
office.
Crown Heights – 11213 (55 surveyed)
Race/Ethnicity/Foreign-born- More than 50% of the population are African
Americans.
Employment - 43.7% are not working.
Illnesses- 23.6% have high blood pressure, 16.4% have hearing or vision
problems, 47.4% indicated they had none of the health conditions.
Reason for visiting provider- 47.2% when they do not feel well.
Provider type- 53.3% of visits in hospital clinics.
8.5% have no visits in the neighborhood. Reasons for going for care outside
the neighborhood- 52.2% of visits outside the neighborhood are to see a
specialist, 30.4% are because the person was referred.
Flatbush – 11226 (83 surveyed)

7
Race/Ethnicity/Foreign-born- There are large numbers of Caribbean/West
Indians. 74.7% of those interviewed are foreign-born.
Insurance- 14.5% of those interviewed are uninsured.
Illnesses- 28.9% have high blood pressure, 22.9% have diabetes, 36.1% have
none of the conditions named.
Reason for visiting provider- 44.6% go to the doctor when they do not feel
well.
Provider type- 57.3% go for care at a doctors’ office.
Downtown Brooklyn – 11201 (18 surveyed) -- Gowanus – 11217 (28 surveyed) –
Greenpoint – 11222 (3 surveyed)
Race/Ethnicity/Foreign-born- In 11217, More than 50% of the population
surveyed are African American. There were many Latinos interviewed. In
11222, of the 3 people interviewed, a number are Latino. In 11201, 61.1% are
foreign-born. 13 of the 18 people surveyed in 11201 self-identified as
Arab/Middle Eastern.
Employment/Insurance- In 11201, 72.2% are not working. 22.2% are
uninsured. In 11217, 46.8% are not working, and 21.4% are uninsured.
Illnesses- In 11201, 50% indicated they have none of the conditions named. In
11217, 35.7% have high blood pressure. 35.7% have none of the conditions
named.
Provider type- In 11217, 42.9% go for care in a hospital clinics, 50% go for care
in a doctors’ office. In 11222, 66.7% visit a Community Health Center for their
care.
In 11217, 10.2% made no visits in their neighborhood.
Recommendations
The information gathered from the 644 community residents in the North and Central
Brooklyn communities provides important directions for moving forward in providing
services and coordinating efforts to improve health and living conditions. The target of
this survey was lower-income residents so the recommendations we make may not be
applicable to the whole community, but does address needs of the population not
necessarily well-served now by the health system.
The 15 zip codes targeted for this survey differ from other communities, and from each
other in many respects. In preparing to survey within these zip codes, priority was given
to those areas with: over 50% of residents Medicaid and uninsured, the least number of

8
Full Time Equivalent primary care providers per 1,000 population, the highest percent of
African American and Latino residents, and those identified in another study as “Hot
Spots.” The highest need communities were defined as: Bushwick, Bedford-
Stuyvesant, East New York, Williamsburg, Brownsville, Crown Height, Clinton Hills and
Cypress Hills, Flatbush, Prospect Heights, and Fort Greene. The analysis of the
surveys show that these communities have important health care access and health
care needs. Particular services needed were identified by survey respondents in some
zip codes, however this does not mean that other zip codes have sufficient amount of
these services.
Our recommendations, based on this survey, are:
Focused attention on particular illnesses and communities in order to target
services where they are most needed.
o Asthma, Diabetes, and Hypertension were identified as prevalent
conditions and often the reason for a visit to the Emergency Room.
These conditions can be treated on an outpatient basis, when
comprehensive, continuous primary care is available to residents.
Targeting of additional services to many of the community, is important
and in particular to Bushwick (11237), East New York (11207), and
Cypress Hills (11208).
The highest prevalence of Asthma is found in a cluster of neighborhoods:
Brownsville (11212), Cypress Hills (11208), East New York (11207), and
Bushwick (11237). Medical care alone cannot ameliorate this condition. We
recommend the need for an air quality study and identification of triggers in
ambient air in these neighborhoods, with a plan to address this problem.
There is a need for more primary care practitioners that accept public health
insurance, particularly in Brownsville and East Flatbush (11212), Flatbush
(11226), and Arabic-speaking doctors who accept public health insurance in
11201. We recommend a coordinated campaign to reach out to, and work with,
practitioners in these and other zip codes to encourage doctors and clinics to
accept public health insurance and broaden the numbers of managed care
companies that they contract with since almost all Medicaid patients are now
required to be enrolled in managed care. With the introduction of the Affordable
Care Act’s increase in primary care reimbursement, there may be more
receptivity to this campaign.
Other primary care practitioners in short supply and mentioned as needed are
OB/GYN and pediatricians. Prenatal care is needed in Brownsville and Flatbush
(11212), and Prospect Heights (11238). Pediatricians are needed in Bedford-
Stuyvesant and Bushwick (11211).

9
Dental care was the most often cited service not available, but needed in North
and Central Brooklyn communities. Considering our knowledge of how important
proper care of the mouth is to better health status, this should be a priority for
action and resources. These services are particularly needed in: Bedford-
Stuyvesant and Bushwick (11211), Williamsburg (11206), Cypress Hills (11208),
Brownsville and East Flatbush (11212), Bedford Stuyvesant and Fort Greene
(11205), Gowanus (11217), and Greenpoint (11222).
The finding of high use of Emergency Room services by African American
residents and persons insured by Medicaid requires special attention. One way
of addressing this problem is to ensure that primary care services are available in
the community and that the hours of operation of these services address
people’s work, school, or other schedules. Another way to address this problem
is to interview and work with community residents to help in defining a message
and means of conveying the message, to encourage use of alternative services.
The problem has been well-documented in this and other studies, but the
process of figuring out ground-level solutions is still elusive. Special attention
should be paid to: Brownsville and East Flatbush (11212), Cypress Hills (11208),
East New York (11207), and Bushwick (11237).
Two major barriers to accessing care identified by many of the respondents are:
too long a wait to get an appointment and too long a wait at the appointment.
One recommendation to address these access barriers is a coordinated effort
amongst providers in the community to share provider resources and ensure that
services are available where they are needed, and where people go for care.
To ensure that culturally and linguistically competent information is available in
the communities it would be helpful to develop a coordinated network of health
care providers, social service providers, and community-based organizations to
ensure that they are working together to assist community residents.

10
“Brooklyn faces daunting population health challenges. High rates of chronic
disease are exacting a human and economic toll.”
“Community health care needs and health care resources vary widely
by neighborhood. Disparities in health status are also associated with
poverty, race and ethnicity.”1
THE NEED FOR CARING IN NORTH AND CENTRAL BROOKLYN
INTRODUCTION
Need for this Study
The study, The Need for Caring in North and Central Brooklyn, was undertaken as a
Community Health Needs Assessment to determine needs, barriers, and gaps in
access to health care services in 15 zip codes in this part of Brooklyn. The communities
identified have long been known as medically underserved and in need of more equal
treatment. The communities are: Bushwick, Beford-Stuyvesant, East New York,
Williamsburg, Brownsville and East Flatbush, Crown Heights, Flatbush, Fort Greene.
Other communities included in this study are: Downtown Brooklyn, Gowanus, and
Greenpoint.
This study was undertaken by community-based organizations to document health
needs in the community. At the same time, a national consultant, Navigant worked on a
review of hospital finances and market strategies in order to propose recommendations
for the two hospitals involved – Interfaith Medical Center and The Brooklyn Hospital
Center. Other communities around the state are similarly challenged and could use this
study – The Need for Caring in North and Central Brooklyn -- as a model of the way to
document the needs and gaps in care and services in their neighborhoods.
The health care system in North and Central Brooklyn is under challenge to change by
an official state study recommending mergers, closings, and reductions in beds. These
communities have long been recognized as medically underserved, where poverty and
illnesses are intertwined. Residents are often medically uninsured or rely on public
health insurance coverage to pay for their health care services. This leads to financial
challenges for the health care providers serving these communities. Past, and current,
studies have shown problems with access to, and gaps in care and services, and the
need for expansion of access to distinct services identified by community residents in
their neighborhoods.

11
The intent of this research is to directly influence the proposed merger (and any
decisions about structural changes to Brooklyn’s healthcare system), by highlighting the
health needs of the community. The research was funded by the New York State
Health Department, Brooklyn Hospital, and the Foundation at Interfaith Hospital.
The Background
The financial fragility of hospitals in North and Central Brooklyn was acknowledged in
2011 and made the subject of a special Task Force set up by the New York State
Commissioner of Health, Dr. Nirav Shah. The five-member Task Force – the Health
Systems Redesign: Brooklyn Working Group (the Berger group) – was charged with
reviewing five hospitals in the community, and making recommendations about their
future. They were to assess the strengths and weaknesses of Brooklyn Hospitals and
the health care system. This Task Force, a part of the Medicaid Redesign Team (MRT),
was appointed by the newly elected Governor, Andrew Cuomo.2 The initial goal of the
MRT was to make recommendations on how to reduce the state’s share of the Medicaid
budget, by $2.3 billion. The second phase of the work of the MRT was a series of work
groups charged with recommending health system redesign, the Berger Brooklyn
committee was a part of this phase.
The need for health services in North and Central Brooklyn is long-recognized. At the
same time that the Berger Group initiated its work, State Senate Minority Leader John
Sampson and Borough President Marty Markowitz formed a Brooklyn-based Work
Group (Sampson Group) to develop recommendations. 3 Contrary to the membership
of the Berger group, the membership of this group was Brooklyn focused, including
health care providers, unions, community-based organizations, and advocacy groups.
Although it did not make any specific recommendations about the five vulnerable
hospitals, the Sampson group developed an important frame work for designing the
health system. (Appendix 1).
The Berger group held two public hearings, visited all of the hospitals in Brooklyn, and
contracted with experts to analyze financial and other data. The Berger Group report
and recommendations were sweeping and raised concerns about continued services in
underserved communities. The specific recommendations for the hospitals included:4
merging Interfaith and Wyckoff with Brooklyn Hospital which was designated to
take the lead;
merging Brookdale Hospital with Kingsbrook Jewish which was designated to
take the lead;
closing the hospital services at Downstate University Hospital and merging these
services into the Long Island College Hospital which had been merged with
Downstate; and

12
closing Kingsboro State Psychiatric Hospital and shifting the patients and
services to a hospital in Staten Island.
closing 1,200 hospital beds.
In addition, the Berger report recommended the availability of Health Care Efficiency
and Affordability Law (HEAL) to assist in accomplishing these actions. HEAL dollars are
federal and state funds distributed through a competitive process through the State
Health Department, and generally used for capital projects.
These recommendations mobilized community, union, and elected officials into action.
One of the outcomes of the Berger recommendations was the development of a
Community Health Work Group to plan with Brooklyn, Interfaith, and Wyckoff Hospitals.
Wyckoff Hospital, with a new administration, chose not to participate in this planning
effort. The membership of this group includes: Interfaith and Brooklyn Hospitals,
Community Health Centers, community organizations, and the three partners of The
Need for Caring – Brooklyn Perinatal Network (BPN), Commission on the Public’s
Health System (CPHS), and New York Lawyers for the Public Interest (NYLPI). With
state funding, The Brooklyn Hospital Center contracted with Navigant Consulting to
gather data and guide the hospitals through restructuring proposals.
Members of the Save Our Safety Net – Campaign (SOS-C),5 who had been involved in
the Sampson/Markowitz Task Force work, were invited to join the Community Health
Working Group by Senator Sampson. These groups were asked to indicate community
needs to which they responded that they would need to go out and talk with community
residents in order to identify with them, their needs. Under the leadership of the
Brooklyn Perinatal Network, a proposal for funding was developed and submitted. The
Community Health Needs Assessment, to do the surveying and focus groups, was
developed and funded by the State Health Department, the foundation at Interfaith
Hospital, and The Brooklyn Hospital Center.
The agreement by the three partners in this assessment – BPN, CPHS, and NYLPI –
was to develop a survey instrument, define the zip codes of interest, develop focus
groups of populations that would be missed in the survey, and contract with an
academic center to assist and advise the partners on ways to make study valid. The
CUNY Institute for Health Equity (CIHE) became the academic partner in this effort.
LITERATURE SEARCH Community Health Needs Assessment is defined by the National Institute for Clinical
Excellence (NICE) as: “a systematic method for reviewing the health issues facing a
population, leading to agreed priorities and resource allocation that will improve health
and reduce inequalities.”6 Although some CHNA definitions place more emphasis on

13
the data collection and analysis, while others on the implementation and policy
development – the commonality remains in the emphasis on community engagement in
the design, data collection, analysis, and interpretation of the assessment.
To conduct the Community Health Needs Assessment (CHNA), a Community Based
Participatory Approach (CBPR) was employed. Community-engaged approaches to
research, like CBPR, have the potential to reduce and/or eliminate racial and ethnic
health disparities.7 CBPR can be defined as:
“(A) a collaborative research approach that is designed to ensure and
establish structures for participation by communities affected by the
issue being studied, representatives of organizations, and researchers in all
aspects of the research process to improve health and well-being
through taking action, including social change.8
CBPR can help bridge the gap between researcher and community stakeholders in
meaningful ways. For example, CBPR helps to address the lack of trust of community
members may have. The lack of trust challenge is of particular concern for our study as
the literature shows that trust within partnerships is paramount, particularly within the
African-American community, which is “more likely than the majority population to
believe that health research holds personal risk and that full disclosure is not afforded
minority populations.9 In addition, building trust is also important for reducing health
disparities, which can “be addressed [when] culturally relevant, trustworthy approaches
are employed.”10
Part of the impetus for undertaking the Community Health Needs Assessment is the
concern with the impact of potential closing of safety net facilities, or the merger of
hospitals that leads to reductions of services in medically underserved communities.
The three hospitals whose catchment areas are the major focus of this study can all be
defined as safety-net hospitals, based on a definition in the “Berger” report.11
“1. Is situated in and serve a high need community, often characteristically by
poverty, public health challenges, low levels of educational attainment, and other
psychological demands, like drug and alcohol abuse and inadequate housing;
2. Fulfills otherwise unmet health care needs in a community;
3. Serves a high volume of Medicaid and medically indigent patients;
4. Serves comparatively few commercially-insured patients;
5. Is typically located in a federally-designated Medically Underserved Area
(MUA) or Health Professional Shortage Area (HPSA);
6. Principally provides core medical and surgical services, such as obstetrics,
pediatrics, and internal medicine, and behavioral health services.”12
The literature shows that having nearby safety-net resources, in particular hospital
emergency departments and public hospitals had positive effects on service utilization

14
and access to care for the uninsured.13 The literature also suggests that although all
patients are impacted when safety net hospitals are closed, Medicaid and uninsured
patients may experience a greater impact because it is more difficult for them to find an
acceptable alternative facility where they can get care.14
To date, the professional literature is inconclusive with regards to the impact of hospital
mergers on patient care. The vast majority of the literature focuses on the financial and
management impacts rather than quality of care.15 There is very little professional
literature that looks at the impact of mergers of safety net facilities in medically
underserved communities. There are however, media reports about the untoward
impact of the merger of the Catholic hospitals in New York City into one management
and governance structure. In an effort to be more efficient, all Catholic Hospitals in New
York City in 1999 were merged as the St. Vincent Catholic Medical Center.
The merger, in addition to the flagship St. Vincent’s in Manhattan, included: Bayley
Seton and St. Vincent’s on Staten Island; Mary Immaculate, St. John’s and St. Joseph’s
in Queens; St. Mary’s in Bedford Stuyvesant in Brooklyn, and a facility in Westchester.16
All of these hospitals were sold or closed, and all, except for St. Vincent’s in Manhattan,
were located in medically underserved communities. In court papers filed for
bankruptcy of the entire system, there was documentation of incompetent leadership as
well as millions of dollars spent and wasted on a management company hired as turn-
around consultants. A law suit filed against the company accused them of padding their
bills, and paying for expenses such as membership in a private university club, opera
tickets, and hundreds of dinners in Manhattan restaurants.17
More directly related to the current review, St. Mary’s Hospital in Bedford-Stuyvesant
closed in 2004, and was the third of the St. Vincent Catholic Medical Center hospitals to
close in one year.18 The closing also meant the eventual closing of all but one of the
seven community health centers the hospital operated along with several WIC centers,
leaving an already underserved community with even fewer services.
THE COMMUNITIES North and Central Brooklyn have long been recognized as medically underserved
communities. Poverty is concentrated in the north central neighborhoods of Brooklyn19
where greater than 30 percent of the population in 2000 lived in poverty. The area also
had the highest mortality rates overall. Several of the zip codes have up to 41% of the
residents who have been told they have high blood pressure by a medical provider.20 In
the same survey, three of the Central Brooklyn neighborhoods reported not getting
needed medical care in the past year (14.7% - 19.7%). Another indicator of poverty is
seen in the percent of Uninsured and Medicaid population at greater than 50%21. The

15
map in Appendix 2 outlines the communities targeted for The Need for Caring. The
following zip codes are identified with greater than 50%: 11237 (68.5%), 11221
(60.1%), 11233 (60.1%), 11207 (58.3%), 11206 (50.9%), 11216 (60.1%), 11208
(58.3%), and 11222 (50.9%).
A large percent of the residents of North and Central Brooklyn, are people of color and
immigrants, larger percent than the population of the city itself. The African American
population is 25.1% of the city, and the Latino population is 27.5% of the city. In Central
Brooklyn, the Black and Latino population is close to 80%. The zip codes with the
highest percent of residents who are people of color are: 11237, 11221, 11233, 11207,
11212, 11216, 11213, 11208, 11238, and 11205.
Prevention Quality Indicators (PQI) measure inpatient hospital visits that might have
been avoided or treated through better preventative care. Communities in the northeast
section of Brooklyn have the highest PQI rates.22 Statewide four percent of admissions
are potentially preventable. In Brooklyn the following hospitals in 2009, exceeded the
four percent mark (in order of highest percent to lowest): Long Island College, SUNY
Downstate, Kingsbrook Jewish, Wyckoff, and Brooklyn Hospitals. Emergency
Department use in Brooklyn is not much different than the rest of the city or the state for
Not Emergency category, and emergent but primary care treatable.
The Brooklyn Healthcare Improvement Project (B-HIP) provided important information
on the use of Emergency Room services in North and Central Brooklyn, overlapping
almost the same zip codes as used in The Need for Caring23. The Need for Caring
study complements the B-HIP study as it interviews residents in the community as
opposed to the Emergency Room. In the B-HIP, patients and staff were interviewed in
the Emergency Rooms of the 6 hospitals participating in the project. In addition,
canvassers were hired to locate provider sites within the community and to estimate the
numbers of health care providers available in the selected zip codes. The B-HIP) study
concluded that : “There appears to be a shortage of quality, accessible primary care
throughout much of the study area coupled with challenges to full utilization of existing
PCP’s.”24 The zip codes identified as having a shortage of Primary Care FTE to 1500
population are: 11237, 11221, 11233, 11207, 11206, and 11212.25
The B-HIP also identified communities which were labeled “Hot Spots” which are
described as being densely populated “with the highest average annual rates of ACSC
hospital discharges and ED utilization in the study area along with high incidence of
chronic diseases.”26 ACSC is defined as Ambulatory Care Sensitive Conditions that
could have been treated on an outpatient basis. ED is the Emergency Department.
The three communities that contain census tracts identified as Hot Spots are:
Brownsville/East New York (11212 and 11207), Crown Heights North/Bedford

16
Stuyvesant (11213, 11216, 11233), and Bushwick/Stuyvesant Heights (11221, 11237,
and 11206)27.
The federally designated Health Professional Shortage Areas (HPSA)28 are located in
these communities: Bedford-Stuyvesant, Bushwick, East New York, and Williamsburg.
There are population groups within communities that are also HPSA designated: low-
income residents in Crown Heights.
The “Berger” report identifies the number of visits for Medicaid fee-for-service
beneficiaries and managed care enrollees in 2009. The zip codes in which Medicaid
patients made the fewest visits (up to 5.5 per year) are identified as: 11216; 11233;
11207; 11212; 11225; 1226; and 11203.29 The reason(s) for the lower number of visits
per person were not identified.
Two studies in 200630, identified Primary Care Shortage areas in the city and the state.
The entire North Eastern and Central Brooklyn neighborhoods were designated as
Physician Shortage Areas. In a ranking of counties in one study (Lager) Brooklyn was
rated the second worst county in a provider ranking based on a number of variables –
only the Bronx was rated worse. In a 2008 report,31 that targeted communities in the
city in need of primary care service expansion, telephone surveys were done and street
surveying was accomplished by community-based organizations. The eight targeted zip
codes in Brooklyn overlapped with the targeted zip codes in The Need for Caring:
11206, 11237, and 11221; 11233, 11212, 11207, and 11208; 11226.
The top five barriers identified to seeing a doctor in the respondents’ neighborhood, in
the 2008 study, as we will see described throughout The Need for Caring, are very
similar to those raised by the people surveyed in this report:
Had to wait too long in the waiting room
Needed an appointment sooner than the appointment time offered
Doctor or nurse did not spend enough time with us
Doctor or nurse did not listen carefully enough
Could not afford to pay the bill.32 In The Need for Caring, 11.8% of respondents could not afford the bill; 17.4% had to wait too long to get an appointment, and 12.4% had to wait too long at the appointment. These concerns received the highest number of responses.
“Late hours for working people.”33
“Doctors office that can open long hours for working people.”
“Health services even if you cannot pay.”

17
In addition, in the same study, respondents were asked to name the category of provider they had the most difficulty in accessing in their community. The responses are consistent with the responses in The Need for Caring described throughout this report:
Dentist
Doctor or nurse you go to for your basic health care needs
Pediatrician/baby doctor
Prenatal care/mid-wife/obstetrician/gynecologist
Mental health counselor.34 In The Need for Caring, 86 people cited the need for more dentists; 76 cited the need for more doctors/clinics; 35 the need for more pediatricians; 38 the need for more OB/GYN’s; and 32 for mental health counselors. These were the most frequently cited primary services that were needed in the community, along with geriatric services (18). It does not appear as if these deficits have as yet been addressed. In The Need for Caring, the same issues were identified.
THE SURVEY Six hundred forty four people were surveyed in fifteen North and Central Brooklyn zip
codes. In recognition that there are differences among and between the zip codes in
this study, each of the zip codes was placed in priority order based on: the percent of
Medicaid beneficiaries and uninsured residents; the number of Full Time Equivalent
primary care providers per 1,500 population,35 race and ethnicity,36 and BHIP identified
Hot Spots.37 (Appendix 3)
The Priority 1 zip codes have over 50% of Medicaid and uninsured, the least number of
Full Time Equivalent primary care providers, the highest percent of African American
and Latino residents, and were identified in the BHIP Hot Spots, and included:
Priority 1 zip codes
11237 Bushwick (49 people surveyed)
11221 Bedford-Stuyvesant (40)
11233 Bedford-Stuyvesant (27)
11207 East New York (50)
11206 Williamsburg (55)
11212 Brownsville and East Flatbush (53)
The Priority 2 zip codes are similar to Priority 1 zip codes, but with slightly lower
indicator levels, and included:
Priority 2 zip codes

18
11216 Bedford-Stuyvesant (38)
11213 Crown Heights (55)
11208 Clinton Hills and Cypress Hills (54)
11226 Flatbush (83)
11238 Prospect Heights (27)
11205 Bedford Stuyvesant and Fort Greene (64)
The Priority 3 zip codes exhibited the lowest indicator levels, and included:
Priority 3 zip codes
11201 Downtown Brooklyn (18)
11217 Gowanus (27)
11222 Greenpoint (3)
This report will describe the overall findings from the 644 surveys. For purposes of
reporting on what was found in the zip codes (found in Appendix 3), the zip codes were
grouped based on: common characteristics and populations; contiguous borders; and
priority grouping. In 11226, the borders were not contiguous with other zip codes, so
the findings are reported solely for that one zip code.
As the surveys were being administered, the populations that were not interviewed
were identified and targeted for the focus groups, e.g. males, people with disabilities,
etc.
Data Collection and Methodology
The hospitals and community health centers participating in the Community Health
Work Group (CHWG) identified their primary service catchment areas, so that 14 of the
targeted zip codes were identified in this way. In addition, the Community Health Needs
Assessment (CHNA) concept and work plan was presented to a special Brooklyn
meeting of the SOS-C, which was attended by providers, unions, community-based
organizations, and community residents. During that meeting, the targeted zip codes
were discussed and a strong case was made for one additional zip code, not
contiguous, but with similar populations and health problems. The 15th zip code –
11226 in Flatbush -- was incorporated into the study. It should be noted that the
Navigant consultant study being prepared under contract with the hospitals, only

19
included the zip codes identified in the hospital catchment areas. There is however
much overlap with the zip codes targeted in the BHIP study38.
Survey Monkey was used for this survey for easier data collection and analysis. The
survey was to be administered on iPads for ease of data input. The survey questions
and format were developed by BPN and CPHS, then reviewed and approved by all
members of the partnership. The survey instruments for two former studies that these
organizations had been involved with were used as a guide for question development.39
With expert assistance from the CUNY Institute for Health Equity (CIHE), targeting
within the zip codes was accomplished through recommendations of types of locations
to do the surveying, as well as, screening questions that eliminated from consideration
populations that were not targeted, e.g., less than 18 years of age; zip code of
residence; and income and family size based on the income guidelines developed by
the New York City Housing Authority (NYCHA). These income guidelines were used
rather than federal poverty levels, because they more accurately reflect the income
needed to live in a high cost city.
Community-based organizations were identified by BPN to do the surveying; as groups
that were located in, trusted by the residents, and reflected the composition, language,
and culture of the communities in which the surveys were being administered. The
community-based organizations that participated in the survey are: Arab American
Family Support Center; Brooklyn Perinatal Network; Caribbean Women’s Health
Association; East New York D&TC; Fort Greene SNAP; Make the Road New York; New
Dimensions in Care; New York Communities for Change; Progressive Community
Center for Children & Families; and United Jewish Organizations of Williamsburg. This
way of surveying has been shown to improve the response and the willingness of
participants to share information.
Ethnic minorities and immigrant populations are less likely to engage in research than
their white counterparts.40 This may be in part, due to barriers in reaching linguistically
and culturally isolated communities, and also the long-standing mistrust between
researchers and minority communities.41 By partnering with community-based
organizations, many studies have seen improved rates of survey participation.42
Additionally, the findings from CBO-led surveys at times identified missing data or
provided more thorough findings than standard survey methods.43
The literature goes on to mention that the training and hiring surveyors from the
assessed community can achieve the following results: (1) potential respondent more
likely to participate in an interview conducted by someone from the area; (2) enhanced
data quality due to greater trust; (3) local interviewers set the time tone for community-
based nature of the research and intervention that would follow; and (4) provide
employment for the community.44
20
Training for the Surveyors
Two training sessions were held for the surveyors on how to administer the survey.
Five of the surveyor organizations used I-Pads for the survey, the other five
administered the survey on paper and then transferred the data to the Survey Monkey.
The organizations that chose to administer the survey on paper identified the need to
protect their staff in high crime areas, so they opted to do the survey on paper and
transfer the data to the Survey Monkey. During the training sessions, several
organizations raised concerns about the wording and the order of the questions. These
concerns led to several changes in the survey.
Also, during the training session, the participants were asked to pair up and test the
survey with their partner, so one person asked the questions of their partner. This was
done to test the understandability of the instrument, the understandability of the
questions, and the time needed to complete the survey. For most of the participants the
survey took between 15 and 20 minutes to administer. The survey was pre-tested in
this way. After several adjustments, the survey instrument was pre-tested in the
community, and some additional adjustments were made, particularly in the questions in
which there were skip patterns.
The surveying organizations were instructed to offer incentives worth no more than $10.
The organizations were allowed to choose what those incentives would be, e.g., $10 in
cash, a $10 MetroCard. The person being interviewed was not initially told what the
incentive would be for participating in the survey.
The Survey Instrument
The survey instrument (Appendix 4) contains four screening questions: zip code; age
group; number of people living in household; and household income. If a person did
not meet the criteria set by the screening questions, they were thanked and did not
complete the survey. There are 10 demographic questions including: born in the United
States; how long lived in the neighborhood; marital status; how many people live in the
household; employment/unemployment status; race and ethnicity.
The next set of 29 questions center around the persons’ health care experience. The
three final questions are totally open-ended, and ask what services are missing from
your neighborhood; if you had the power what changes would you make in the health
system; and anything else that the person chose to share. The closed questions
probed for the satisfaction level of services within the persons’ neighborhood; the
reasons for going for care outside their neighborhood; whether, and what kind of, health
insurance the person and members of the household have; if health services have been
used in the last two years; if there were visits to an emergency room in the last two
years, and the reason(s) for this visit; the type of health care provider where the person
receives his/her care; the specific provider; the length of time needed to arrive at their

21
place of care, the mode of transportation; and barriers that they encountered when
going for health care services. Many of these questions contained additional open-
ended space to list reasons for their response, or place of care.
A subset of questions asked if the person, or any member of their household, had
particular listed illnesses or a disability. If they responded affirmatively to any of these
questions, they were also asked: if there was a disability, what type of accommodation
they received; if they were able to receive care for this disability or illness; what type of
provider they went to for this treatment; and if they were satisfied with the care they
received.
Coding of the Open-Ended Questions
The responses to the three open-ended questions were reviewed by the same person
several times. Patterns of answers were reviewed, so that categories of responses
could be identified. For consistency, each of the responses was placed by the same
person in a category that best represented what was being shared. The responses
were placed in a category, and where the category answers grew large, they were sub-
categorized. The categories of responses fell into two “buckets”: the type of services
people felt was missing from the community and/or would like to see in the community;
and general access and barriers identified.
For question #27, people were asked specifically: “Are there any medical or health-
related services you think your neighborhood needs more of? If so, what are the
services?” Question #28 asked for a more general response of: “If given the power for
one day, what changes would you make in the medical care system?” Question #29
was added to ensure that if the previous questions had not addressed the respondents’
particular concern, “Is there was anything else to tell us about their family’s health care,
or health care services in your neighborhood?” In spite of the different thrusts of these
questions, the responses to each of the questions fit into the major themes identified.
In addition, the direct quotes from respondents that were typical, poignant, or illustrative
of a problem or solution, were identified and will be reported. These quotes will be
reported in italics.
“The struggles and predicaments of low income families and children in poverty is a
never ending story. We struggle with bad eating habits, lower birth weight infants. We
need farmers markets, whole foods, fruit stands, vitamins, dental care, etc.”
THE FINDINGS – Drawing a picture of the surveyed population

22
The survey instrument was administered by community-based organizations to
community residents in 15 zip codes in North and Central Brooklyn.
This process produced 644 completed surveys. Seventy nine invalid surveys were
eliminated because the person being interviewed did not meet the screening criteria, or
because of insufficient information.
Population Characteristics
Age. A majority of the respondents, 352 or 54.7%, were between the ages of 26-35 and
36-50.
Household. A large majority of the respondents, 521 or 80.9%, lived in households
with one to four people. The surveyors were instructed to ask the question as
households rather than family, in order to ascertain how many people were living in one
dwelling. Of the people living in these households, respondents said that 468 are
children and 640 are adults.
o Twenty nine percent of the respondents lived in two-person households
o Twenty three percent of the respondents lived in three-person households.
o Only 93 respondents, 14.4% lived in households of 5-6 people.
o An even smaller number of people, 27, lived in larger households of 7-10
people.
Household income and household size were two of the screening questions that
used broad categories for reporting income, so that the data for this question is
not precise. A later question about income was asked of a subset of the
respondents who indicated they are working.
Gender. A very large majority, almost two-thirds, of the respondents identified as
women – 424, 65.8%. Recognizing the need for male voices, two focus groups were
organized to gather more information from men.
Race, Ethnicity and Country of Origin
Race: The zip codes surveyed are largely communities of color, in Central Brooklyn
over 80% of the population is Black, including African Americans and Caribbean/West
Indians. Of the respondents in this survey:
o 285 people (44.3%) self-identified as African American,
o 162 people (25.3%) self-identified as Caribbean/West Indian,
o 6 people self-identified as Asian/Pacific Islander,
o 22 people self-identified as Arab/Middle Eastern,
o 21 people self-identified as Mixed race/ethnicity,

23
o 88 people (13.7) identified as White.
More than two-thirds of the respondents 482 (74.8%), identified as persons of color.
For 88 (13.7%) of the respondents there was no answer. Latinos could identify in any
race.
Seven of the zip codes have over 50% African American respondents: 11207
and 11208, East New York and Cypress Hills; 11212, Brownsville; 11238,
Prospect Heights; 11217, Gowanus; 11216, Bedford-Stuyvesant; 11213, Crown
Heights.
Large numbers of Caribbean/West Indian respondents were interviewed from
11207, East New York; 11226, Flatbush; 11233, Bedford-Stuyvesant; and 11213,
Crown Heights.
Numbers of White respondents were interviewed from 11206, Williamsburg;
11205, Fort Greene; and 11222, Greenpoint.
Asian/Pacific Islanders were interviewed from 11208, 11226, 11238, and 11213.
Arab/Middle Eastern respondents were interviewed from 11201 (46.4%),
Downtown Brooklyn; 11237, Bushwick; 11206, Williamsburg; 11208, East New
York; 11226, Flatbush; 11233 and 11216, Bedford-Stuyvesant; and 11212,
Brownsville. (Appendix 5)
Latino/Hispanic: One hundred thirty five (21%) identified as Latino/Hispanic. Latinos
can identify with any race. The highest percent of Latinos are found in 11237 (95.9%)
and 11221 (77.5%) and are where the highest percent of respondents did not indicate
race. Many Latino/Hispanic respondents (who can be of any race) were interviewed in
large numbers in 11237, 11221, 11217, and 11222. (Appendix 6)
Foreign-born: Two hundred fifty three of the respondents, 39.3%, identified as foreign
born. This is consistent with the population of New York City and the borough of
Brooklyn. One hundred thirty seven identified Caribbean countries; 85 identified Latin
and South American countries of birth. The countries of origin are consistent with the
populations living in the zip codes. Nine respondents, born in Puerto Rico, identified as
foreign born even though they are U.S. citizens.
The highest percent of persons born outside of the U.S. are found in: 11237
(89.4%), 11221 (67.5%), 11226 (74.7%), 11201 (61.1%), and 11223 (40.7%).
(Appendix 7)

24
Language: Four hundred eighty nine people responded that they were comfortable
speaking about their health care in English; 87 said Spanish; 28 said Creole; 22 said
Arabic; 14 said Yiddish; 2 said French; and 1 said Hungarian.
Other Neighborhood Characteristics
Years in Neighborhood: Two hundred eighty seven respondents (44.6%) have lived in
their neighborhood for more than 10 years; 94 (14.6%) have lived there for five to 10
years, and 90 (14.0%) have lived there for three to five years. Although there are
changes in the populations in all of these communities, this sample shows a stable
living situation.
Marital Status: When asked about their marital status, 339 people (52.6%) indicated
that they are single and 175 (27.2%) indicated that they are married. Others indicated
that they were living with someone, divorced or widowed.
Employment Status:

25
When asked about employment status, only 164 respondents (25.5%) indicated that
they were employed. Two hundred eighty three (43.4%) said they were not working.
The zip codes in which over 40% of the respondents indicated that they were not
working/no are: 11207 (58%); 11208 (51.9%); 11212 (51.0%); 11205 (46.8%);
11217 (46.8%); 11201 (72.2); 11216 (60.5%); and 11213 (43.7%). (Appendix 8)
o The high numbers of respondents indicating they are not working could be
a function of interviewing during the day time hours, and finding people
who don’t work or who are retired.
Income/Earnings: Respondents that indicated that they are working were asked
a follow-up question about their earnings. Three hundred nine people indicated
personal income. Almost 58 percent (201) of the 342 who responded indicated
an income of less than $30,000, and 36.6% had incomes less than $20,000 a
year. The incomes in The Need for Caring are generally lower than incomes
found in the community profiles done by the Center for the Study of Brooklyn.
The median household incomes ranged from $23,104 (Bushwick 11237) to
$56,293 (Downtown Brooklyn 11201).
Health Care Experience
Health Care Decisions. Respondents were asked who in the household makes health
care decisions for you and your household. Of the 616 responses to this question, 457
(74.2%) persons said they made the health care decisions for themselves and their
households.
Health Insurance. Do you and those living in your household have health
insurance, including Medicaid?
o Four hundred sixty three (71.3%) said that all members of the household
have health insurance,
o 77 (12.6%) said that some have insurance,
o 76 (11.8%) said that no one in the household has health insurance.
o Twenty two people (3.4%) said don’t know/not sure, and
o 6 people (.9%) did not answer this question.
Fourteen percent of all respondents have no health insurance. The highest
numbers of uninsured residents reside in zip codes 11237 (16.3%), 11207

26
(16.0%), 11208 (13.0%), 11226 (14.5%), 11217 (21.4%), 11201 (22.2%), 11233
(14.8%). (Appendix 9)
Type of Health Insurance
The majority of respondents, 338 (52.4%), and 301 members of their household
(46.7%), are covered by income-eligible public health insurance – Medicaid, Child
Health Plus, and Family Health Plus. Approximately one million of the 2.5 million
Brooklyn residents are covered by public health insurance. Fourteen percent of the
respondents indicated they have no health insurance. 129 respondents have private
coverage, and 94 household members have private coverage.
You Household
Public insurance
o Medicaid 284 210

27
o Child Health Plus 7 58
o Family Health Plus 47 33
Other health insurance coverage:
o Medicare 57 19
o Your employer 82 48
o Someone else’s employer 42 41
o Plan that someone else buys 5 5
o Military/TriCare/VA 3 1
o Self-pay 19 15
o Not have health insurance 51 23
o Don’t know/not sure 17 36
o No answer 40 23
o Some other source 48
Health Conditions

28
“Are there any health related services that my community needs more of? Yes of
course especially in low income neighborhoods; HIV, STD testing and prevention
services more information on how to prevent diseases. Also services preventing cancer
health issues as in obesity. More sickle cell foundation treatments for sickle cell
patients curse for the sickle cell. Two of my sisters are dealing with the sickle cell
disease, they get very sick.”
Do you or members of your household have any of the following health
conditions? The respondents surveyed were asked to respond to a list of illnesses or
disability that they or a household member has (check all that apply).
o Asthma 128 19.9%
o Dental problems 86 13.4%
o Diabetes 101 15.7%
o Overweight/obesity 57 8.9%
o High blood pressure/Hypertension 160 24.8%
o Bone, joint, or muscle problems 70 10.9%
o Heart illness or disease, stroke 35 5.4%
o Physical disability 25 3.9%
o Hearing or vision problems 98 15.2%
o Depression, anxiety, other mental 53 8.2%
o Attention or behavior problems 21 3.3%
o None of the above 229 35.6%
o No answer 19 3.0%
o Other – please specify 34
Amongst the list of other conditions cited are: Sickle Cell, Alzheimer,
Autism, Lupus, Cancer, and allergies.
The most often cited medical conditions are hypertension, asthma, diabetes, and
hearing or vision problems, as reported by zip code:
Asthma was cited most often in: 11237 (12%), 11221 (22.5%), 11207 (22%),
11208 (29.6), 11212 (39.6)
High blood pressure/hypertension was cited most often in: 11237 (30.6%),
11207 (24%), 11212 (39.6%), 11226 (28.9%), 11205 (35.9%), 11217 (35.7%),
11233 (18.5%), 11216 (21.1%), and 11213 (23.6%).
Diabetes was cited most often in: 11237 (20.4), 11208 (16.7%), 11212 (30.2%),
11226 (22.9%), and 11216 (18.4%)

29
Hearing or vision problems were cited most often in: 11237 (28.6%), 11221
(30%), 11212 (15.1%), 11216 (18.4%), and 11213 (16.4%).
None of the above was the response from 229 (35.6%) of the respondents. The
highest percent of this response is found in: 11206 (36.4%), 11207 (42%),
11208 (38.9%), 11226 (36.1%), 11238 (51.9%), 11217 (35.7%), 11201 (50%),
11233 (48.1%), and 11213 (47.3%).
See subset questions on page 31, for the responses to follow-up questions for those
surveyed that indicated one or more conditions in response to the question above.
Access to Care
In the last two years, have you or members of your household gone to a health
care provider? (If yes, why? If no, why?) Responses: 568 (88.8%) said yes and 72
(11.3%) said no. There were 63 individual responses with reasons when people said
no, which are categorized and included:
o No insurance 15
o Not sick/no need 23
o Not tried 2
o Time issues 4
o Been incarcerated 1
Five zip codes have higher numbers of people who had not seen a provider in the last two years: 11205 (25.0%), 11201 (27.8%), 11217 (21.4%), 11208 ((14.8%), and 11216 (13.2%). (Appendix 10)
If yes have visited a health care provider in the last two year, reasons given for
visiting a provider in the last two years (88.8%), by zip code:
o Medical emergency – 11237 (33.3%), 11208 (34.8%), 11212 (52.9%), and
11233 (33.3%).
o Needed a medical test – 11221 (38.9%), 11206 (34%), and 11212
(45.1%).
o Didn’t feel well – 11206 (34%), 11207 (44.4%), 11208 (41.3%), 11212
(58.8%), 11226 (44.6%), 11205 (41.7%), and 11213 (47.2%).
o Regular Check-up – all zip codes above 50%. (Appendix 11)
Have you and your household members been able to get regular check-ups when
you are healthy? 536 respondents (83.2%) said yes; 87 respondents (13.5%) said no;

30
and for 21 respondents (3.3%) there was no answer.
Care in the Neighborhood
“More affordable clinic put more clinics in our neighborhood. Low income communities
need more educational services, preventing obesity because obesity is affecting our
communities.”
“There needs to be more of everything so you don’t have to go out of the
neighborhood.”
“The neighborhood needs a community low income based clinic for the
underpriveledged (sic) with working hours between Monday and Saturday.”
“Put a health clinic in 11223, more pharmacies. I would re-open St. Mary’s.”
Care in the neighborhood
In the last two years, have you and your household members’ visits to a doctor or
nurse been in your neighborhood? This question was included because there have

31
been concerns raised about a lack of services in many of the North and Central
Brooklyn communities. Almost 20% of all of respondents’ made all visits outside their
neighborhood. Less than 40% of respondents had all visits in their neighborhood; 32%
of respondents’ visits were in part in their neighborhood; and 18.3% had no visits in their
neighborhood.
o All 250 38.8%
o 75% 88 13.7%
o 50% 68 10.6%
o 25% 56 8.7%
o None 118 18.3%
o Not been to a doctor 25 3.9%
o Don’t know/not sure 26 4.0%
o No answer 13 2.0%
One hundred eighteen respondents indicated that none of their visits had been to a provider in their neighborhood in the last two years. Of the 118 responses, the zip codes with the highest percent of respondents not using services in their neighborhood are: 11207 (11%), 11208 (9.3%), 11213 (8.5%), 11217 (10.2%), and 11233 (8.5%).
For the 118 None responses to the question about visits in the neighborhood, the next
three questions were skipped because they were about care in the persons’
neighborhood.
What kind of place is it in your neighborhood? (check all that apply) The totals add
to more than the number of respondents, as people indicated more than one source of
care.
o Doctors or nurses office 241 46.5%
o Traditional healer 5 1.0%
o Community health center 153 29.5%
o Hospital clinic 171 33.0%
o Emergency Room 77 14.9%
o Another kind of place 3 .6%
o Don’t know 6 1.2%
o No answer 34 6.6%
In zip code 11237, 68.9% of the respondents get their care in a hospital clinic; in
zip code 11221, 45.9% receive their care in a hospital clinic; 42.9% in zip code
11217; and 53.3% in 11213.

32
In zip code 11212, 37% of respondents indicated they get their care in a hospital
ER.
The respondents in the following zip codes indicated high usage of community
health centers/clinics: 11207 (41.7%), 11208 (46.3%), 11212 (54.3%), 11222
(66.7%), and 11216 (41.4%).
The respondents in the following zip codes indicated high usage of private
doctors’ offices: 11206 (73.3%), 11208 (48.8%), 11212 (45.7%), 11226 (57.3%),
11238 (61.1%), 11205 (55.2%), and 11217 (50%). (Appendix 12)
Please provide a specific name of the facility where you go for care in your
neighborhood. Not all named are located in North and Central Brooklyn.
o Five hospitals outside of Brooklyn (7 responses)
o Six community health centers in Brooklyn (17 responses)
o One HHC Diagnostic and Treatment Center (4 responses)
o Private doctor (31 responses)
o Other types of providers (22 responses)
o Seven North and Central Brooklyn Hospitals (150 responses)
o Brookdale 37
o Brooklyn 27
o Downstate 6
o Interfaith 16
o Kings County 16
o Woodhull 31
o Wyckoff 17
How long does it take you and members of your household to get to care in your
neighborhood? Four hundred nine of the 528 responses (77.4%) to this question
traveled for 30 minutes or less to get to care in their neighborhood.
o Less than 10 minutes 148 28.0%
o 10-30 minutes 261 49.4%
o 30 minutes to an hour 59 11.2%
o Over an hour 11 2.1%
o Do not know/not sure 15 2.8%
o No answer 34 6.4%
How do you get there? (in your neighborhood) (check all that apply)
o Walk 244 47.4%
o Drive 65 12.6%
o Subway 78 15.1%
o Bus 191 37.1%

33
o Cab 67 13.0%
o Car Service 23 4.5%
o No answer 36 7.0%
o Other 24
There were 24 other responses, including: 2 by bike, 4 by Access-A-Ride, 4 by
Ambulette, 11 by ambulance, 1 by wheel chair, and 1 by motorcycle.
Convenience of Care
“I wish I have a clinic close to my home because I have three little children I travel with
all of them to the doctor office.”
Where would it be most convenient for you and members of your household to
get care? Of 644 responses, more than 85% of respondents said it would be more
convenient to receive care near where they live.
o Near where I live 548 85.1%
o Near where I work 40 6.2%
34
o Don’t know/not sure 25 3.9%
o No answer 31 4.8%
o Some other place (34 listed), including five who said they wanted a safe,
clean, comfortable place.
The zip codes in which more than 90% of the respondents indicated their
preference for receiving care in their neighborhood: 11201 (100%), 11205
(92%); 11212 (91%); 11221 (93%).
The zip codes in which the lowest number of respondents indicated a preference
for care in their neighborhood: 11217 (64%) and 29% where they work; 67% in
11222 (of three responses); 11208 (74%).
Care Outside the Neighborhood
“I have to travel with my children to get medical care because I don’t speak English.”
“I feel so depressed now, no job, no health insurance, no medication, and there is no
mental health doctor who will understand me and help me in this area.”
“I am very happy with the health care that my children receive, but I would like to have
that kind of services in my neighborhood.”

35
From this list, respond “yes” to any reason that applies to why you or members
of your household have gone to a doctor or nurse outside of your neighborhood.
For this question, respondents were read a list and asked to identify any reason that
applies to why they or members of their household have gone to a doctor or nurse
outside their neighborhood. The most frequently cited reasons for going outside the
neighborhood are: specialist outside neighborhood (43%) which indicates a choice, and
referred or assigned doctor in another neighborhood (24.6%) which suggests there was
no choice.
o I get care from a specialist outside my neighborhood 117 43.0%
o Could not afford a doctor or nurse found in neighborhood 15 5.5%
o Was referred or assigned a doctor in another neighborhood 67 24.6%
o Not satisfied with doctor found in my neighborhood 40 14.7%
o Does not speak my language 6 2.2%
o Does not make me feel comfortable 21 7.7%
o Had to wait too long to get an appointment 32 11.8%
o Had to wait too long to be seen at an appointment 29 10.7%
o Doctor found in neighborhood didn’t take insurance 19 7.0%
o Schedule conflict between myself and doctor 13 4.8%
o Facility could not accommodate my disability 5 1.8%

36
o Don’t know/not sure 17 6.3%
o No answer 69 25.4%
o Other, please specify 74
Other please specify – there were 74 responses – reported are those where
there is more than one similar response:
Going there before I moved 10
Emergency 5
Vet that goes to the V.A. 4
Didn’t go to any doctor 4
Go to private doctor 3
Customer service poor 2
Doctor in another neighborhood 2
Go near to work 2
If get care from a specialist outside the neighborhood, what kind of specialist,
the most often-cited specialists are dental, general doctor, OB/GYN, cardiologist,
and general doctor:
Allergist 1
Asthma treatment 1
Cardiologist 8
Dental 12
Dermatologist 1
Eye doctor 8
Endocrinologist 5
Eye doctor 6
Gastroenterologist 4
General doctor 11
Gynecologist/OB 19
Dermatologist 7
Neurologist 6
Orthopedist 6
Pediatrician 5
Physical therapy 2
Podiatrist 7
Psychiatry/Psychology/Counseling 7
Rheumatologist 3
Surgeon 3
Urologist 5
The break-down by zip code of highest number of reasons given for going for
care outside of the neighborhood are:

37
o I get care from a specialist outside my neighborhood – 11206 (70.4%),
11207 (57.9%), 11205 (58.6%), 11213 (52.2%).
o Was referred or assigned a doctor in another neighborhood -- 11206
(33.3%), 11238 (30%), 11216 (33.3%), 12213 (30.4%)
o Not satisfied with doctor found in my neighborhood – 11206 (22.2%),
11208 (25.9%), and 11205 (27.6%),
o Had to wait too long to get an appointment – 11237 (40%), and 11221
(30%)
o Had to wait too long to be seen at an appointment -- 11237 (40%), and
11221 (30%)
What kind of place is it outside your neighborhood? The highest percent of
responses is: private doctor, 116 (37.4%), and hospital clinic, 72 (23.2%)
o Private doctors office 116 37.4%
o Traditional healer 1 .3%
o Community health clinic or health center 43 13.9%
o Clinic in a hospital 72 23.2%
o Emergency Room 19 6.1%
o Another kind of place 7 2.3%
o Don’t know/not sure 7 2.3%
o No answer 45 14.5%
Please provide a specific name of the facility where you go for your care – 125
o Ten hospitals outside of Brooklyn (21 responses)
o One community health center in Brooklyn (1 response)
o Private doctor (19 responses)
o Other types of providers (20 responses)
o Three other hospitals in Brooklyn (6 responses)
o Eight North and Central Brooklyn Hospitals (26 responses)
o Brookdale 1
o Brooklyn 11
o Downstate 3
o Interfaith 3
o Kings County 4
o Kingsbrook 1
o Woodhull 1
o Wyckoff 2

38
Of the respondents who visited the ten hospitals outside of Brooklyn: 3 from
11205, 1 from 11206, 2 from 11207, 1 from 11208, 2 from 11212, 1 from 11213,
1 from 11216, 3 from 11217, 1 from 11221, 2 from 11226, and 3 from 11237.
How long does it take you to get to the provider outside your neighborhood?
Unlike the travel time in the respondents neighborhood, the travel took longer – 47.7%
of respondents said it took from 30 minutes to an hour.
o Less than 30 minutes 77 25.5%
o 30 minutes to 1 hour 138 47.7%
o 1-2 hours 38 12.8%
o More than 2 hours 3 1.0%
o No answer 46 15.2%
How do you travel to the provider outside your neighborhood? (check all that
apply)
o Walk 30 9.9%
o Drive 58 19.2%
o Subway 130 43.0%
o Bus 91 30.1%
o Cab 36 11.9%
o Car Service 26 8.6%
o No answer 42 13.9%
o Other (please specify) 13

39
Emergency Room Usage
“More emergency rooms; they are closing many local hospitals. We also need a dental
emergency room.”
“To keep open the remaining hospitals in the neighborhood.”
Have you or members of your household been to an Emergency Room within the
last two years? In 11212, 11.3% of the respondents had visited the ER. In 11216,
12% of the respondents had visited the ER. For all of the other zip codes, less than
10% of the respondents had visited the ER in the last two years.
o Yes 301 46.8%
o No 292 45.4%
o Don’t know/not sure 13 2.0%
o No answer 37 5.8%

40
If yes, how often? Of the 301 respondents who had visited the Emergency
Room in the last two years, 220 respondents identified have often they had used
the Emergency Room. The largest number of responses indicated four times or
less visits to the Emergency Room (182, 82.7%).
o Once 75
o Once to twice 2
o Twice 57
o Three times 23
o Three to four times 2
o Four times 23
o Four to five times 2
o Five times 5
o Six times 2
o Five to ten times 2
o Eight times 1
o Ten times 1
o Fifteen times 2
o Monthly 1
o Every two months 2
o Every three months 1
o Every six months 1
o Once a year 7
o Twice a year 3
o Other 4
If yes, what was the reason that you or your family went to the Emergency
Room? There were 295 responses written in, with the highest number of visits
for asthma (28.9%), and High blood pressure (27.6%). Both of these conditions
can often be treated on an outpatient basis if care is available in the community.
Type of health insurance coverage appears to have an impact on ER usage. Of
the 301 respondents who indicated they had used the Emergency Room in the
last two years, the highest percent usage of ER visits by insurance coverage
was: Medicaid (50.3%), insurance by employer (13.9%), Medicare (10%), and
no health insurance/self-pay (10.4%).
The highest percent of respondents who used the ER by zip code are located in:
11226 (12%), 11212 (11.3%), and 11207 (8.6%).

41
Of all of the people with different race and ethnicity cited, African Americans had
the highest number and percent of persons using the emergency room in the last
two years, 155, which was 51.5% of the African American respondents. Of this
total, the highest number of visits to the ER by African Americans was found in:
11205 (12), 11207 (17), 11208 (17), 11212 (30 – more than half of those
surveyed), 11216 (16), and 11226 (12). (Appendix 13)
54 of the African American ER users are male, 95 are female. 22 are married,
126 are not married. 67 are working and 79 are not working. 140 of the 155
African Americans (90%) have health insurance coverage.
Subset questions on Access to Care
In order to ascertain additional information from respondents who indicated a particular
illness or disability, a series of follow-up questions was asked. Only those who
answered in the affirmative to an identified condition(s) were asked the next four
questions: accommodations for the disabled, getting treatment for all these conditions;
where treatment is received; and satisfaction with services.
What types of accommodations are made for people with disabilities: no answer
(8) and wheel chair (1). There were seven other responses, including Access – A –
Ride, transport to private practice, and physical and occupational therapy.
Do you get treatment for all of these conditions: all the time 155 (36.8%), most of
the time 85 (20.2%), sometimes 83 (19.7%), few times 28 (6.7%), never 26 (6.2%), and
no answer 44 (10.5%).
Where do you and your household members get treatment -- check all that apply:
o Doctors office 201 48.0%
o Health center 96 22.9%
o Hospital clinic 135 32.2%
o Emergency Room 70 16.7%
o Not get treatment 12 2.9%
o Don’t know/No answer 35 8.3%
Several reports have suggested that a high percentage of Brooklyn residents travel to
Manhattan for their care. Of the 137 respondents who responded to this subset
question, only 12 Respondents (8.7%) visited hospitals outside of Brooklyn.
Three community health centers were named (4 responses)
Two HHC Diagnostic and Treatment Centers were named (3 responses)
Private doctors named (23 responses)
Seven North and Central Brooklyn Hospitals were named (95 responses)

42
Brookdale 9
Brooklyn 19
Downstate 5
Interfaith 7
Kings County 14
Woodhull 27
Wyckoff 14
Are you or members of your family satisfied with this care (if receiving services)?
Seventy eight percent of respondents were very or somewhat satisfied with the care.
Only 8.8% were somewhat dissatisfied or dissatisfied with the care they received.
Another 2.4% are not receiving any care.
o Very satisfied 171 40.6%
o Somewhat satisfied 159 37.8%
o No opinion 17 4.0%
o Somewhat dissatisfied 15 3.6%
o Dissatisfied 22 5.2%
o Am not receiving care 10 2.4%
o No answer 27 6.4%
Forty respondents gave reasons when asked to say why they were not satisfied. Ten
respondents indicated a problem with the waiting time; 3 had health insurance
problems; two said it was too expensive; one said ‘no good doctors’; one said no
communication; one said no specialists; and one cited the language barrier. Some of
the direct quotes from respondents stand out:
“Son with developmental delays only gets therapy at school and he also needs it at
home.”
“Because I don’t think my child is getting the best treatment for his condition.”
“Western medicine is inaccessible to people of lower income.”
“Lack of service offered in a low income neighborhood.”
“Sometimes hospital/clinic staff assume we have Medicaid because of our skin color.”
End of Subset

43
Barriers to Care
“More clinics to avoid emergency room”
“More clinics to cut down on wait time.”
In the last 2 years, did you or any of your family ever have difficulty getting
access to any of the following health care providers in your neighborhood?
Respondents were read a list and asked to identify all that apply. “In the last two years,
did you or any members of your household ever have difficulty getting access to any of
the following health care providers in your neighborhood?” 43% of respondents had no
difficulty getting access to providers in their neighborhood. But the most often cited
access problems: 13% had difficulty in seeing a doctor for basic care, 18.1% to see a
dentist, and 5.9% to see a Mid-wife, OB/GYN.
o A doctor or nurse you go to for basic health care 75 13.0%
o Dentist 104 18.1%
o Mental health counselor 21 3.6%
o Traditional healer 3 .5%

44
o Drug Counselor 4 .7%
o Prenatal Care/mid-wife/OB/GYN 34 5.9%
o Pediatrician/baby doctor 24 4.2%
o Family planning services 16 2.8%
o Any other providers 17 3.0%
o Have not had trouble getting access 248 43.1%
o No answer 99 17.2%
“If I was given the power for day the changes I would make would be focusing on good
mental health. It helps us enjoy life and cope with problems. It offers a feeling of well
being and inner strength. It determines how we take care of our bodies by eating right
and exercising.”
The types of services which respondents had difficulty accessing by zip code are:
o A doctor or nurse – 11212 (20.5%), 11226 (25.9%), 11201 (31.3%).
o Dentist – 11221 (27.8%), 11206 (29.6%), 11208 (29.4%), 11212 (23.1%),
11205 (30.4%), 11217 (30.4%), 11222 (33.3%).
o Prenatal Care – 11212 (15.4%), 11238 (21.7%)
o Pediatrics – 11221 (19.4%)
If yes, please tell us what happened (141 responses), for those who responded
yes to the question of difficulty in access to care. Those cited by more than one
person are listed here:
o No insurance 12
o The don’t take my insurance 8
o Needed dental care 5
o Did not have car fare 3
o Don’t have health problems 5
o Hours of service 6
o Can’t get care right away 2
o Not enough special needs doctors 2
o No services in area 2
o There were 34 other responses each listed by one person.
Did any of the following ever limit your ability to secure health care or cause you
to wait before you or your household member went to the doctor or nurse in your
neighborhood? Respondents were read a list of issues and asked to check all that
apply. 182 respondents (30.1%) indicated that they had no barriers in access to care
based on this list. 112 respondents (18.5%) have not had limits in accessing a doctor or

45
nurse. Taken together, almost half of the respondents (48.6%) have not had limited
ability to secure health care services.
o Could not afford the bill 71 11.8%
o Insurance did not pay for what was needed 59 9.8%
o No health insurance 95 15.7%
o Health plan problem 48 7.9%
o Could not find a doctor that took your insurance 41 6.8%
o Did not know how to find a doctor or a nurse 12 2.0%
o Did not know how to make an appointment 16 2.6%
o Did not have a doctor or nurses phone number 6 1.0%
o They were hard to reach by phone 20 3.3%
o They did not return your phone call 24 4.0%
o Had to wait too long to get an appointment 105 17.4%
o Had to wait too long at the appointment 75 12.4%
o Did not speak my language 21 3.5%
o Did not make me feel comfortable 28 4.6%
o Cannot miss work or school 31 5.1%
o Hours of service are a problem 24 4.0%
o Couldn’t find a doctor or translator spoke language 10 1.7%
o Transportation problems 13 2.2%
o Took too long to get there 5 .8%
o Did not know where to go 9 1.5%
o Did not like the care received 27 4.5%
o The facility was not accessible 6 1.0%
o Have not had limits accessing doctor or nurse 112 18.5%
o None 182 30.1%
o Other (please specify) 31
“There are health services in my area. Long Island College Hospital is not too far, but I
have no health insurance to use it.”
“Waiting period is too long, more staff, always short staffed.”
“ Health clinic for myself and my children with Arabic speaking doctors; travel far with
my children.”
“The doctors need to care about the patients. Speak to them personally and the office
staff should be polite.”
“Accessible rides to doctors and visiting service. Make services more affordable for the
working class and don’t discriminate when they don’t have co-payments. They still

46
need health services done.”
Barriers by zip code
Could not afford the bill by zip code – 11238 (37.5%), 11201 (22.2%)
No health insurance by zip code – 11208 (19.5%), 11212 (21.4%), 11238 (25%),
11201 (33.3%), and 11233 (29.6%).
Had to wait too long to get an appointment by zip code – 11237 (42.9%), 11221
(52.6%), 11212 (21.4%), 11238 (20.8%), and 11222 (33.3%), 11213 (14.5%)
Had to wait too long at the appointment by zip code – 11237 (36.7%), 11221
(28.9%), and 11238 (16.9%).
Have not had limits accessing doctor or nurse by zip code – 11206 (29.6%),
11207 (25.5%), 11217 (38.5%) and 11213 (49.1%).
Access to medications
In the last 12 months, have you or your family members been able to receive all of
the prescription medications needed?
o Yes 486 76.4%
o No 77 12.1%
o Did not need medication 31 4.9%
o Do not know/not sure 22 3.5%
o No answer 20 3.1%
If the answer was no to the question about receiving prescription
medications check all that apply. The most frequent responses were: costs
too much (38.7%), no health insurance (40.6%), and health plan problems
(22.6%).
o Costs too much 41 38.7%
o No health insurance 43 40.6%
o Health plan problems 24 22.6%
o Can’t find doctor who accepts health insurance 7 6.6%
o Cannot miss work 5 4.7%
o Hours of service 2 1.9%
o Not available in area 6 5.7%
o Not know where to go 3 2.8%
o Not like the service 3 2.8%
o No answer 28 26.4%

47
Open-Ended Qualitative Questions on the Survey
This survey contains three open-ended questions that are not tied to another question
and do not request an explanation of additional information about that question. In
other surveys, at times the picture drawn by respondents is rosy and that everything is
OK, however when asked directly for their opinion, problems are more likely to be
expressed45. This survey asks the respondent many times to respond in their own
words, so that the answers to the questions below appear to corroborate the other
responses.
The responses from these three questions were used in two ways: to identify direct
quotes that contribute to the overall information provided in this survey; and to
categorize the responses so that there is also a count of the prevalence of similar
responses. The categories chosen were identified based on the purpose of the survey:
a community health needs assessment of the North and Central Brooklyn communities
to gather information from residents about what they think of health services in their
neighborhoods and what they perceive is missing or more is needed. After a reading of
the responses to these questions, with the assessment as the focus, the categories
were selected. The chosen quotes and the proposed categories were sent to the health
assessment partnership organizations for their review.
# 27. Are there any medical or health-related services you think your
neighborhood needs more of? If so, what are the services?
Community Health: Some of the quotes from respondents address the overall need for
services and for changes in the neighborhood that promote healthier living.
“Convenient physical access to grocery stores and other retailers that sell a variety
of foods. More clinics/dental offices.”
“Better time service and more organized clinic appointed visits for patients and
staff members that are knowledgeable.”
“More parks and pools to swim.”
“More mother father classes for young men and woman with children.”
“Every service that provides for the communities general health needs.”

48
“Need youth health programs; get youth off of the corner and into a productive
environment.”
On specific services:
“Dental services that accepts more different types of Medicaid, drug services that
could provide addicts rehab and also more clinics for youth treatment.”
“Wish there were more options for men.”
“More services for children with special needs.”
The most frequently mentioned as services needed in the community: Dental care (86),
more doctors and clinics (76), pediatricians (35), OB/GYN (38), mental health (32), and
geriatric services (18). As well, the theme of the need for more of these services was
repeated in the other two open-ended questions.
The specialty care services mentioned most frequently as needed in the community are:
general specialists (44), eye doctor (14), cardiologist (10), and orthopedist. Services for
special populations, is identified ten times. Recreation and preventive services was
identified by eight people.
Barriers to care that were identified included: culture and language (8), hours of service
(8), problems with attitude of providers (8), and waiting time (7).
Additional issues that were raised included: costs (32), insurance problems (21), quality
(16), and lack of information (12).
“Better communication between patient and doctor (language barriers).”
“More doctors because I have to wait too long to be seen.”
“More convenient for seniors that don’t have access to ambulant.”
“More services to educate people about access to medical care.”
“Medical transportation by local organizations that the community trusts. This
would also create jobs.”

49
#28 If you were given the power for one day, what changes would you make in
the medical care system that you feel would make it work better for you, your
family, and for people in your community?
“Allow uninsured to receive health care, never denied.”
“A better system to expedite visits.”
“Easier to obtain health, more system communications between doctors and
files.”
“No distortion of the diagnosis that will inhibit recovery for possible quality of life.”
“Hire doctors too crowded.”
“I live in Bed-Stuy and they do not make you feel comfortable. You have to wait
too long. The doctors treat you as if you are just another number.”
“I don’t have health insurance. I think the uninsured should be seen and not
made to feel inferior.”
“Bring services closer to your home and more readily available and have
appointments dates set up to accommodate the client needs at time of need
instead if months down the year. Waiting time should not take a half a day.”
“Cover everything: eliminate co-pays; all services under one roof; reduce wait
times. Better customer service; more time with patients; clearer explanation of
diagnoses, illnesses, procedures.”
“Reduce infant mortality, make schools healthier. I’ll get rid of all drugs or any
harmful narcotic. Better food less hybrid. Eliminate all fast food restaurants.”
The above quotes are the types of statements that respondents expressed in response
to this question. Access and coverage statements were predominant.
The responses to this question were more related to issues of access and barriers than
the responses to question #27. However, there was also indication of the need for
particular kinds of services, including: more doctors and clinics (54), dental (13), and
geriatric services (13).
Barriers to care and access concerns were identified by more than half of the
respondents to this survey. Some of the barriers included: waiting time (31), culture
and language differences (23), attitude problems (23), and hours of service (9). Other

50
related problems include: costs (26), quality (22), insurance problems (14), and lack of
information (14). In addition, systems change issues (17) got attention, along with the
need to do more to teach/educate (16), and focus on the social determinants of health
(10), including food and recreation.
Access to care and coverage was most often cited in response to this question. The
responses included:
Care more accessible and available 81
Universal access to health care 40
Free universal coverage 52
Free care 47
Equal treatment 10
There are many quotes from respondents that cover these issues, just a few of them will
be listed here:
“Faster doctor visits, less wait times.”
“For doctors to make house call and come see you as needed.”
“Make services more cleaner and more professional also more organized. Try to
get more people in better healthy by building organizations to get more people
medical care on track.”
“Late hours for working people. Doctors should look at the whole person, not
only what you tell them. They should ask questions. Maybe there are other
issues. Make mandatory to remind patients of needed exams and vaccinations
for children.”
“Bring services closer to home. Doctors should spend enough time with patient
to really understand the problem.”
“Increase the allowed income for middle class to be eligible for Medicaid.”
“I will give everyone a good health service and will make everybody can qualify
for Medicaid.”
“I make the services more readily available for everyone including people without
immigration status.”

51
“I will bring more Spanish doctors from Latin America! They know us better and
we would have a better communication and understanding!”
#29 Is there anything you would like to tell us about you and your family’s health
care, or health care services in your neighborhood? (For example: Do your
children get good medical care? If not, what are the reasons?)
The responses to this question were mostly more personal and/or general. A large
number of respondents (70) indicated that they were satisfied with their health care, but
this applied mainly to the care received by their children. The wording of the example in
this question directed people toward talking about their children’s medical care. It is not
clear if respondents would have answered the same way in talking about their own care.
There were again many negative comments about care in the community.
“The health care services are garbage. There should be more home visits by
doctors.”
“More language access for those doesn’t speak English or more Hispanic
doctors.”
“People in my neighborhood do not know there are resources, and we cannot
find private practices, only clinics and facilities, and there we cannot get personal
care.”
“Better doctor office so individual groups like my 19 year older brother can go
and be comfortable.”
“My child has good medical care but mines isn’t really too good, once I got a
certain age my Medicaid was shut off. I am still trying to build it back up.”
“We need environmental testing in the area. There have been lots of
contaminations in the area and residential buildings were built on top of them.
Kids are being diagnosed with cancer and asthma, etc., at a higher rate as a
result.”
“Doctors office hours are limited it is very difficult for my daughter to help me with
my wife.”

52
“I spent all day at the doctor office and it create problem with my job.”
“Not too bad, could be a little better. They’re closing hospitals in our area.
They’re closing Downstate and we don’t want that at all.”
“Our community has a lot of health issues because we do not have good doctors
and don’t get a proper diagnosis, etc. Doctors don’t spend much time with
patients therefore missing important facts regarding the health of patients.”
“Providers should bring service in my community based on our needs.”
“The area is not safe or healthy for our children.”
“The care we get is alright but would like to see the same doctor all the time.”
There is concern expressed in response to this question for more doctors/clinics (17)
and dental care (8).
Most of the access and barrier question responses reflect the answers to the other
open-ended questions. Under barriers: culture/language (8), waiting time (12), attitude
problems (10). Also cited in these responses are: insurance problems (15), costs (19),
quality (31), and lack of information (14).
Summary and Important Findings
The goal of this survey was to target, screen, and interview community residents in an
effort to, as closely as possible, mirror the population in the 15 zip codes in North and
Central Brooklyn communities. For example, 39% of the respondents in this survey are
foreign-born compared to 40% of Brooklyn residents. Over 80% of the respondents in
this survey are Black (African American and Caribbean/West Indian) and Latino and the
Central Brooklyn population is 80% Black. Fourteen percent of the respondents have
no health insurance. Over 52 % of the respondents are covered by income-eligible
public health insurance – Medicaid, Family Health Plus, and Child Health Plus.
This study targeted respondents with lower incomes based on family size, using the
New York City Housing Authority (NYCHA) guidelines. Therefore the income of
respondents in this study, who are working, appears to be lower than the median
income in the identified zip codes. In the Need for Caring 58 percent (201 of the 300
working respondents) indicated an income less than $30,000 per year. The lowest

53
median income is found in 11237 ($23,104). Several of the zip codes had median
incomes a little higher than $30,000 per year (11206, 11233, 11216, 11208, 11207).
The highest median incomes are found in: 11201 ($56,293) and 11217 ($49,567).
The overall goal of The Need for Caring in North and Central Brooklyn, was to
document health care needs, gaps in services and barriers to care.
The most often reported illnesses/health conditions are: high blood
pressure/hypertension (24.8%); asthma (19.9%); diabetes (15.7%); and hearing or
vision problems (15.2%). All of the conditions are amenable to preventive and primary
care services, when these services are available. These illnesses were not evenly
distributed among the different zip codes. 11237 showed high prevalence of each of
the conditions. 11207 showed high prevalence for two of the conditions – asthma and
high blood pressure. 11208 had high prevalence for two of the conditions – asthma and
diabetes.
o Asthma was cited most often in: 11237 (12.1%); 11221 (22.5%); 11207
(22%); 11208 (29.6%); and 11212 (39.6%)
o High blood pressure/hypertension was cited most often in: 11237
(30.6%), 11207 (24%), 11212 (39.6%), 11226 (28.9%), 11205 (35.9%),
11217 (35.7%), 11233 (18.5%), 11216 (21.1%), and 11213 (23.6%).
o Diabetes was cited most often in: 11237 (20.4), 11208 (16.7%), 11212
(30.2%), 11226 (22.9%), and 11216 (18.4%)
o Hearing or vision problems were cited most often in: 11237 (28.6%),
11221 (30%), 11212 (15.1%), 11216 (18.4%), and 11213 (16.4%).
Eighty five percent of respondents said that it would be most convenient to receive
care in their neighborhood. But many residents did not receive all of their care in their
neighborhood, for a variety of reasons.
Access to care was not always available within all of the zip codes studied.
Respondents were asked, and shared the types of services they felt were missing from
their community. Doctors and Dentists are the most frequently named providers that
are needed. The types of services which respondents had most difficulty accessing by
zip code are:
o A doctor or nurse – 11212 (20.5%), 11226 (25.9%), 11201 (31.3%).
o Dentist – 11221 (27.8%), 11206 (29.6%), 11208 (29.4%), 11212
(23.1%), 11205 (30.4%), 11217 (30.4%), 11222 (33.3%).
o Prenatal Care – 11212 (15.4%), 11238 (21.7%)
o Pediatrics – 11221 (19.4%)

54
In the open-ended questions on the survey, the same types of services were identified
as needed in the community: Dental care (86), more doctors and clinics (76),
pediatricians (35), OB/GYN (38), mental health (32), and geriatric services (18), were
the most frequently mentioned as services needed in the community. A 2008 study by
the City Council, prepared by the Health and Hospitals Corporation in conjunction with a
community task force, in which respondents were surveyed in some of the same zip
codes, listed the same services as needed in the community.46
Specialty care services that were mentioned frequently as needed in the community
are: general specialists (44), eye doctor (14), cardiologist (10), and orthopedist.
Services for special populations, is identified ten times. Recreation and preventive
services was identified by eight people.
Barriers to care were also identified. Respondents were read a list of issues and
asked to check all that apply. “Did any of the following ever limit your ability to secure
health care or cause you to wait before you or your household member went to the
doctor or nurse in your neighborhood?” Of particular concern is the large number of
responses that indicated the respondents had to wait too long to get an appointment,
detailed below by zip code. Cost of care and lack of health insurance were also raised
as problems. Almost half of the respondents (48.6%) have not had limited ability to
secure health care services. The highest percent of reasons given by zip code as
barriers to care are:
Could not afford the bill, by zip code – 11238 (37.5%), 11201 (22.2%)
No health insurance, by zip code – 11208 (19.5%), 11212 (21.4%), 11238 (25%),
11201 (33.3%), and 11233 (29.6%).
Had to wait too long to get an appointment by zip code – 11237 (42.9%), 11221
(52.6%), 11212 (21.4%), 11238 (20.8%), and 11222 (33.3%), 11213 (14.5%)
Had to wait too long at the appointment by zip code – 11237 (36.7%), 11221
(28.9%), and 11238 (16.9%).
Have not had limits accessing doctor or nurse, by zip code – 11206 (29.6%),
11207 (25.5%), 11217 (38.5%) and 11213 (49.1%).
In two of the three open-ended questions, barriers to care were frequently raised, and
the responses were more qualitative in nature than found in the rest of the survey
responses. Concerns that were not captured in the closed-ended questions, were cited
in these responses. It is not unusual for respondents to disclose more information when
not constricted by multiple choice questions. Often barriers cited in response to both
questions are: costs, insurance problems, quality, and lack of information. Other
important barriers that were raised by respondents included: culture and language
differences, hours of service, problems with attitude of providers, and waiting times.

55
Care outside the neighborhood is of major concern. Since an overwhelming majority
of respondents (85%) said that it would be more convenient to receive care in their
neighborhood, it is important to understand why people go for care outside of this
neighborhood. In detail above, we showed the responses to question of what types of
services respondents had difficulty accessing, and broke it down by zip code: a doctor
or a nurse, dentist, OB/GYN, and pediatrician. In addition, we showed the types of
barriers that respondents faced in accessing care, and broke this information down by
zip code. Taken together, the responses to these questions could be one source in
understanding why respondents go outside of their neighborhood for care.
The break-down by zip code of highest number of reasons given for going for care
outside of the neighborhood are:
o I get care from a specialist outside my neighborhood – 11206 (70.4%),
11207 (57.9%), 11205 (58.6%), 11213 (52.2%).
o Was referred or assigned a doctor in another neighborhood -- 11206
(33.3%), 11238 (30%), 11216 (33.3%), 12213 (30.4%)
o Not satisfied with doctor found in my neighborhood – 11206 (22.2%),
11208 (25.9%), and 11205 (27.6%),
o Had to wait too long to get an appointment – 11237 (40%), and 11221
(30%)
o Had to wait too long to be seen at an appointment -- 11237 (40%), and
11221 (30%)
Emergency Room use is an important component, of the health care delivery system
in medically underserved communities. There are many health conditions that could be
treated on an outpatient basis in the community if there is access to services. This
study is complementary to a study prepared by the Brooklyn Health Improvement
Project (B-HIP), in which residents from almost the same zip codes were interviewed in
the Emergency Room. Another important aspect of the B-HIP study was the
identification of what as labeled “Hot Spots” in the neighborhoods.47 Using SPARCS
data, the project was able to identify problems of health care usage in three distinct
areas that had the highest number of hospital discharges for conditions that could be
treated in the community (ACSC).48 The top “Hot Spots”, reported in census tracts, are
located in Brownsville/East New York (11212, 11207); Crown Heights/North Bedford
Stuyvesant (11213); and Bushwick/Stuyvesant Heights (11237, 11233). There is some
overlap with our study, in that the zip codes with the heaviest usage of the ER are:
11226, 11216, 11212, and 11207.
Of the 644 respondents to the survey, 301 (46.8%) indicated that they or a member of
their household had been to an Emergency Room in the last two years. Of this number,
220 identified how often they had visited the Emergency Room; most of the responses

56
were four or less visits to the Emergency Room in the last two years (182, 82.7%).
When asked to identify the reason for the Emergency Room visit, 28.9% indicated
asthma, and 27.6% said high blood pressure. Acute phases of these chronic conditions
need urgent treatment, but preventive and ongoing, continuous, comprehensive care
can mitigate the need for emergency treatment.
Some troubling patterns in the use of emergency care from the survey were noted. Of
all of the people with different race and ethnicity cited, African Americans had the
highest number and percent of persons using the emergency room in the last two years,
155, which was 51.5% of the African American respondents. Of this total, the highest
number of visits to the ER by African Americans was found in: 11205 (12), 11207 (17),
11208 (17), 11212 (30 – more than half of those surveyed), 11216 (16), and 11226 (12).
54 of the African American ER users are male, 95 are female. 22 are married, 126 are
not married. 67 are working and 79 are not working. 140 of the 155 African Americans
(90%) have health insurance coverage, 79 are covered by Medicaid. There is high
incidence of illnesses found in the African American population surveyed: 50 have
asthma; 26 have diabetes; 46 have high blood pressure, 23 have bone and joint
problems, 29 have hearing or vision problems, and 19 are depressed.
Another important finding in this study is that type of health insurance coverage appears
to have an impact on ER usage. Typically, it is believed that the uninsured heavily use
ER for services. In this study, of the 301 respondents who indicated they had used the
ER in the last two years, the highest percentage usage of ER visits by insurance
coverage was: Medicaid (50.3%), insurance by employer (13.9%), Medicare (10%),
and no health insurance/self pay (10.4%).

57
Recommendations The information gathered from the 644 community residents in the North and Central
Brooklyn communities provides important directions for moving forward in providing
services and coordinating efforts to improve health and living conditions. The target of
this survey was lower-income residents so the recommendations we make may not be
applicable to the whole community, but does address needs of the population not
necessarily well-served now by the health system.
The 15 zip codes targeted for this survey differ from other communities, and from each
other in many respects. In preparing to survey within these zip codes, priority was given
to those areas with: over 50% of residents Medicaid and uninsured, the least number of
Full Time Equivalent primary care providers per 1,000 population, the highest percent of
African American and Latino residents, and those identified in another study as “Hot
Spots.” The highest need communities were defined as: Bushwick, Bedford-
Stuyvesant, East New York, Williamsburg, Brownsville, Crown Height, Clinton Hills and
Cypress Hills, Flatbush, Prospect Heights, and Fort Greene. The analysis of the
surveys show that these communities have important health care access and health
care needs. Particular services needed were identified by survey respondents in some
zip codes, however this does not mean that other zip codes have sufficient amount of
these services.
Our recommendations, based on this survey, are:
Focused attention on particular illnesses and communities in order to target
services where they are most needed.
o Asthma, Diabetes, and Hypertension were identified as prevalent
conditions and often the reason for a visit to the Emergency Room.
These conditions can be treated on an outpatient basis, when
comprehensive, continuous primary care is available to residents.
Targeting of additional services to many of the community, is important
and in particular to Bushwick (11237), East New York (11207), and
Cypress Hills (11208).
The highest prevalence of Asthma is found in a cluster of neighborhoods:
Brownsville (11212), Cypress Hills (11208), East New York (11207), and
Bushwick (11237). Medical care alone cannot ameliorate this condition. We
recommend the need for an air quality study and identification of triggers in
ambient air in these neighborhoods, with a plan to address this problem.
There is a need for more primary care practitioners that accept public health
insurance, particularly in Brownsville and East Flatbush (11212), Flatbush
(11226), and Arabic-speaking doctors who accept public health insurance in

58
11201. We recommend a coordinated campaign to reach out to, and work with,
practitioners in these and other zip codes to encourage doctors and clinics to
accept public health insurance and broaden the numbers of managed care
companies that they contract with since almost all Medicaid patients are now
required to be enrolled in managed care. With the introduction of the Affordable
Care Act’s increase in primary care reimbursement, there may be more
receptivity to this campaign.
Other primary care practitioners in short supply and mentioned as needed are
OB/GYN and pediatricians. Prenatal care is needed in Brownsville and Flatbush
(11212), and Prospect Heights (11238). Pediatricians are needed in Bedford-
Stuyvesant and Bushwick (11211).
Dental care was the most often cited service not available, but needed in North
and Central Brooklyn communities. Considering our knowledge of how important
proper care of the mouth is to better health status, this should be a priority for
action and resources. These services are particularly needed in: Bedford-
Stuyvesant and Bushwick (11211), Williamsburg (11206), Cypress Hills (11208),
Brownsville and East Flatbush (11212), Bedford Stuyvesant and Fort Greene
(11205), Gowanus (11217), and Greenpoint (11222).
The finding of high use of Emergency Room services by African American
residents and persons insured by Medicaid requires special attention. One way
of addressing this problem is to ensure that primary care services are available in
the community and that the hours of operation of these services address
people’s work, school, or other schedules. Another way to address this problem
is to interview and work with community residents to help in defining a message
and means of conveying the message, to encourage use of alternative services.
The problem has been well-documented in this and other studies, but the
process of figuring out ground-level solutions is still elusive. Special attention
should be paid to: Brownsville and East Flatbush (11212), Cypress Hills (11208),
East New York (11207), and Bushwick (11237).
Two major barriers to accessing care identified by many of the respondents are:
too long a wait to get an appointment and too long a wait at the appointment.
One recommendation to address these access barriers is a coordinated effort
amongst providers in the community to share provider resources and ensure that
services are available where they are needed, and where people go for care.
To ensure that culturally and linguistically competent information is available in
the communities it would be helpful to develop a coordinated network of health
care providers, social service providers, and community-based organizations to
ensure that they are working together to assist community residents.

59
Endnotes 1 Stephen Berger. At the Brink of Transformation: Restructuring the Healthcare Delivery
System in Brooklyn. Page 5. Workgroup Findings: Brooklyn Health Care.
http://www.health.ny.gov/health_care/medicaid/redesign/docs/brooklyn_mrt_final_report
2 The Governor’s Medicaid Reform Task Force.
http://www.governor.ny.gov/press/01052011medicaid
3 Creating a Vision for Brooklyn’s Health Care System: A report of the Brooklyn Healthcare
Working Group.
http://www.nysenate.gov/files/pdfs/Creating%20a%20Vision%20for%20Brooklyns%20Heal
th%20Care%20System%20A%20Report%20of%20the%20Brooklyn%20Healthcare%20Wor
king%20Group.doc
4 Berger, ibid
5 The Save Our Safety Net –Campaign, a coalition of community and labor, was organized in
2006 when an official State Commission was appointed by the then-Governor Pataki to
perform a review for hospital closings. SOS-C organized a campaign to ensure that if
hospitals were to be closed, they would not be closed in low-income, community-based,
immigrant and communities of color. www.soscny.wordpress.com
6 National Institute for Clinical Excellence (2005) Health Needs Assessment: A Practical
Guide. London
7 Wallerstein, N., & Duran, B. (2010). Community-Based Participatory Research
Contributions to Intervention Research: The Intersection of Science and Practice to
Improve Health Equity. American Journal of Public Health. 100-S1. S40-546.
8 Viswanathan, M. Ammerman, A. Eng, E, et al. (2004 Aug.) Community-Based
Participatory Research: Assessing the Evidence: Summary. In. AHRQ Evidence Report
Summaries. Rockville (MD); Agency for Healthcare Research and Quality. 1998-2005. 99.
9 Parrill, R. Kennedy, B.R., (2011). Partnerships for Health in the African American
Community: Moving Toward Community-Based Participatory Research. Journal of Cultural
Diversity. 18(4), 150-154.
10 Ibid, Parrill
11 Berger ibid: page 41.
12 Berger, ibid
13 Lee Rivers Mobley, et al. (2012) The Effects of Safety Net Hospital Closures And
Conversions on Patient Travel Distance to Hospital Services. Health Services Research.
47.1pt1 129-150.
14 Ibid. Mobley
15 Richman, BD. (2007). Antitrust and Nonprofit Hospital Mergers: A Return to Basics.
University of Pennsylvania Law

60
16 Anemona Hartocolis. “The Decline of St. Vincent’s Hospital. New York Times. February
10, 2010
http://www.nytimes.com/2010/02/03/nyregion/03vincents.html?pagewanted=all&_r=0
17 Hartocolis. Ibid
18 Marc Santora. “St. Mary’s Hospital in Brooklyn Is to Close After Years of Losses. New
York Times. June 4, 2005.
www://http:Travel.nytimes.com/2005/06/04/nyregion/04hospital.html
19 New York Medicaid Redesign Health System Redesign Brooklyn Work Group, Power Point
presentation by Rick Cook, NYS Department of Health, July 28, 2011.
http://www.health.ny.gov/health_care/medicaid/redesign/docs/2011-07
28_brooklyn_work_group_presentation.ppt
20 Ibid, Cook, citing the NYC Department of Health and Mental Hygiene. Community Health
Survey. A Self Reported Telephone Survey, 2009.
21 Center for Study of Brooklyn http://www.brooklyn.cuny.edu/pub/departments/csb/
22 Ibid, Cook Power Point presentation. Source: SPARCS 2010.
23 Wong, Grace, Fyfe, Dorothy. Brooklyn Healthcare Improvement Project. Final Report:
Making the Connection to Care in Northern and Central Brooklyn. SUNY Downstate, New
York. August 8, 2012. Twelve of the zip codes in both studies overlapped: 11206, 11237,
11217, 11238, 11216, 11213, 11226, 11212, 11207, 11208, 11233, and 11221. The B-HIP
study also covered 11210 and 11227. The Need for Caring also covered: 11222, 11211,
11205, and 11201. http://www.downstate.edu/bhip/pdf/B-HIP-Final-Report.pdf
24 Wong, B-HIP, page 5.
25 Wong, B-HIP
26 Wong, B-HIP, page 7
27 Source: Center for Health Workforce Studies, October 2011. http://chws.albany.edu/
28 http://bhpr.hrsa.gov/shortage/hpsas/designationcriteria/designationcriteria.html
29 Berger, page 76, source not identified.
30 Lager, Nancy, Green, Donna, Kim, Victor and Deborah Zahn. A Primary Care Capacity
Shortage in New York City & The Potential Impact of Hospital Closures. Primary Care
Development Corporation and the New York City Health and Hospitals Corporation.
September 2006. And Rosenbaum, Sara, Shin, Peter, and Perez Trevino Whittington,
Ramona. Laying the Foundation. Health System Reform in New York State and the Primary
Care Imperative. June 2006.
31 Primary Care Initiative Community Health Assessment. Final Report. Health & Hospitals
Corporation. August 21, 2008. New York
http://council.nyc.gov/downloads/pdf/PCI%20Final%20Report.pdf

61
32 Ibid.
33 Quotations in italics are respondents answers to The Need for Caring Open-Ended
Questions.
34 Ibid.
35 BHIP study cite
36 Center for Brooklyn study
37 BHIP
38 BHIP
39 CPHS Child Health Initiatives survey Voices from the Community. CPHS. 2008. New York
http://www.cphsnyc.org/cphs/reports/december_2008-_voices_from_the_c/ and HHC
survey, ibid
40 Giuliano AR, Mokuau R, Hughes N, et al. (2000) Participation of minorities in cancer
research: the influence of structural, cultural, and linguistic factors. Ann Epidemiol. 10(8
Suppl):522-534. and Wendler D, Kington R, Madans J, et al. Are racial and ethnic
minorities less willing to participate in health research? (2006) PLoS Med. 3(2):e19.
41 Nyguen GT, et al. Surveying Linguistically Challenged Southeast Asian American
Population Use of a Community-Partnered Methodology. Journal of Health Care for the Poor
and Underserved. (August 2011) Vol.22:3 pp. 1101-1114. and Moreno J. Lessons learned a
half-century of experimenting on humans.(1999) Humanist. 59:9-15.
42 Patel V, Rajpathat S, Karasz. (2012) Bangladeshi Immigrants in New York City: A
Community-Based Health Needs Assessment Of A Hard To Reach Population. Journal of
Immigrant And Minority Health. 14.5:767-773. and
Martinez IL, Carter-Pokras O. (2006) Addressing Health Issues and Barriers to Health in a
Heterogeneous Latino Community. Journal of Healthcare for the Poor and Underserved.
17(4):899-909.
43 Ibid Nyguen
44 Schulz A, Parker EA, Israel, BA, et al. (1998) Conducting a participatory community-
based survey for a community health intervention on Detroit’s East Side. J Public Health
Manag Pract. 4:10-24.
45 CPHS. Ibid. 2008.
46 Health and Hospitals Corporation, ibid.
47 B-HIP, ibid.
48 B-HIP, ibid. page 29.