the ned-2 forest ecosystem management … ned-2 forest ecosystem management dss: the integration of...
TRANSCRIPT

THE NED-2 FOREST ECOSYSTEM MANAGEMENT DSS:
THE INTEGRATION OF A WILDLIFE MODEL FOR THE SOUTHEAST, THE GOAL
ANALYSIS AGENT AND THE REPORT GENERATION AGENT
by
SARAH WITZIG
(Under the Direction of Donald Nute)
ABSTRACT
NED-2 is a decision support system for forest ecosystem management developed by the
USDA Forest Service and the Artificial Intelligence Center at the University of Georgia. NED-2
provides a tool for resource management by running goal-driven process analyses using future
condition rules. The six resource management categories supported are Ecology, Health, Timber,
Visual, Water, and Wildlife. This thesis addresses the design and implementation of a Wildlife
Model for NED-2 that extends the former wildlife model to the entire eastern part of the United
States. The goal analysis and report generation components are documented in terms of
functionality and with regard to the integration of the Southeastern Wildlife Model.
INDEX WORDS: Decision Support System, NED-2, ecosystem management, agent, blackboard architecture, goal analysis, wildlife model, wildlife habitat, report generation, hypertext representation, Prolog, Forest Management, knowledge base

THE NED-2 FOREST ECOSYSTEM MANAGEMENT DSS:
THE INTEGRATION OF A WILDLIFE MODEL FOR THE SOUTHEAST, THE GOAL
ANALYSIS AGENT AND THE REPORT GENERATION AGENT
by
SARAH WITZIG
Vordiplom, The University of Koblenz, Germany, 2002
A Thesis Submitted to the Graduate Faculty of The University of Georgia in Partial
Fulfillment of the Requirements for the Degree
MASTER OF SCIENCE
ATHENS, GEORGIA
2004

© 2004
Sarah Witzig
All Rights Reserved

THE NED-2 FOREST ECOSYSTEM MANAGEMENT DSS:
THE INTEGRATION OF A WILDLIFE MODEL FOR THE SOUTHEAST, THE GOAL
ANALYSIS AGENT AND THE REPORT GENERATION AGENT
by
SARAH WITZIG
Major Professor: Donald Nute
Committee: Walter D. Potter Brahm Verma
Electronic Version Approved:
Maureen Grasso Dean of the Graduate School The University of Georgia December 2004

iv
ACKNOWLEDGEMENTS
I thank Dr. Donald Nute for the support, concern and advice during my course work, my
assistantship work and my thesis writing. I thank Dr. Walter D. Potter and Dr. Brahm Verma for
their interest, for their guidance, and for serving on my committee.
I thank Mike Rauscher, Scott Thomasma, Mark Twery, and Pete Knopp for their help and close
collaboration during my work for NED-2. Thanks to Mayukh, Fred and Astrid for their time and
effort to help me understand the NED-2 software when I was new in the project. Thanks to Cy
and Zhiyuan for their cooperation during our NED-2 teamwork.
Thanks to the DAAD, the AI Center and the USDA Forest Service for funding my graduate
education.
Thanks to the AI students for making long stressful exam periods fun and livable.
Thanks to my roommates Jen, Lindsey, and Miranda for introducing me to the American way of
life.
Special thanks to my friends in Germany, my friends in Athens, my parents and my sister for
their support and care.

v
TABLE OF CONTENTS
Page
ACKNOWLEDGEMENTS......................................................................................................... iv
LIST OF TABLES......................................................................................................................vii
LIST OF FIGURES ...................................................................................................................viii
CHAPTER
1 INTRODUCTION ............................................................................................... 1
2 A BRIEF REVIEW OF THE NED-2 DECISION SUPPORT SYSTEM ............ 4
3 GOAL ANALYSIS IN NED-2 ............................................................................ 8
3.1 DESIRED FUTURE CONDITION RULES ................................................ 10
3.2 THE “FUZZY” BACKWARD CHAINING INFERENCE ENGINE ......... 11
3.3 TIMBER GOAL ANALYSIS....................................................................... 14
3.4 THE WILDLIFE MODEL FOR THE NORTHEAST ................................. 17
4 THE WILDLIFE MODEL FOR THE SOUTHEAST........................................ 19
4.1 KNOWLEDGE ACQUISITION .................................................................. 19
4.2 THE FOREST TYPES IN THE SOUTHEAST ........................................... 27
4.3 THE RULE WRITER PROGRAM .............................................................. 31
4.4 INTEGRATION INTO NED-2 .................................................................... 37
5 REPORT GENERATION .................................................................................. 42
5.1 GENERATING REPORTS........................................................................... 42

vi
5.2 THE REPORT GENERATION AGENTS ................................................... 45
5.3 GOAL ANALYSIS REPORT GENERATION............................................ 50
5.4 THE WILDLIFE GOAL ANALYSIS REPORTS........................................ 55
6 THE WILDLIFE MODEL IN APPLICATION ................................................. 58
7 FUTURE WORK................................................................................................ 59
BIBLIOGRAPHY....................................................................................................................... 61
APPENDICES
A FUZZIFICATION OF THE DESIRED FUTURE CONDITIONS............................ 64
B NED-2 VARIABLE DOCUMENTATIONS.............................................................. 67
C TIMBER ANALYSIS REPORT................................................................................. 72
D NED-2 FOREST TYPES............................................................................................ 74
E GOAL ANALYSIS REPORTS FOR WILDLIFE...................................................... 76
F WILDLIFE MODEL FOR GAME SPECIES: WILD TURKEY HABITAT............. 84
G FUTURE VARIABLES IN NED-2............................................................................ 88

vii
LIST OF TABLES
TABLE 3-1: “FUZZIFICATION” OF THE TIMBER MANAGEMENT UNIT GOALS........ 16

viii
LIST OF FIGURES
Figure 2-1: The NED-2 Home Screen ..................................................................................... 5
Figure 3-1: The Goal Selection Screen.................................................................................... 9
Figure 4-1: Process Map: Development of the NED-2 Wildlife Model for the Southeast.... 28
Figure 4-2: Process Map: Development of the NED-2 Forest Types in the Southeast ......... 30
Figure 4-3: The NED-2 Goal Ranges Program ..................................................................... 40
Figure 5-1: The Report Selection Screen............................................................................... 43
Figure 5-2: The Report Selection Dialog............................................................................... 44
Figure 5-3: Interacting Report Generation Agents ................................................................ 46
Figure 5-4: The Report Writer Agent .................................................................................... 49
Figure 5-5: The Goal Analysis Report Generation – Old Design.......................................... 51
Figure 5-6: The Analysis Report Agent................................................................................. 52
Figure 5-7: The Goal Analysis Report Generation – New Design ........................................ 53
Figure 5-8: The Goal Report Agent....................................................................................... 54

1
CHAPTER 1
INTRODUCTION
Wildlife habitat management is necessary for several reasons. Controlling wildlife habitat
might prevent particular disturbances from endangering species in critical stages of development,
like early life stages, rutting or migration (Oil and Gas Commission Website 2004). Loss of
habitat for endangered species like the burrowing owl can be illegal and punished with fines and
imprisonment (The Santa Cruz Predatory Bird Research Group 2004). The existence of wildlife
in a forest might improve the aesthetic, recreational, and economic value. It might attract
naturalists and birdwatchers (Hamel 1992:10). Above all, wildlife has a significant impact on the
health of our ecosystem and improper management of this resource can have far reaching effects
(Wilson 1995:2).
For example, little animals like salamanders can influence the productivity of a whole
forest. Salamanders are inconspicuous and become active mostly during the night. Even though
salamanders are small creatures that are difficult to spot, the biomass of salamanders is equal to
the biomass of mice and shrews. Additionally, the phosphorus levels and protein content in their
tissue is higher than those of birds and mammals, and they are an essential food supply for
carnivores. A significant drop in salamander occurrence could influence the rate of nutrient
cycles and change forest productivity (Wilson 1995:1).

2
The decision support system NED-2 provides a tool for managing and enhancing wildlife
habitat by running goal-driven process analyses using future condition rules to specify the
desired habitat. The results of the analyses are output in HTML format.
This is not the only resource management that NED-2 provides. The user can pick between
six different goal categories and get decision support for each of them. The categories supported
are Ecology, Health, Timber, Visual, Water, and Wildlife. Additional components in the
software support different steps in the decision process for optimal forest ecosystem
management.
This thesis discusses the background knowledge, research, and implementation of the
Southeastern Wildlife Model. This involves the understanding and modification of NED-2’s goal
analysis functionality and the redesign and implementation of its goal analysis reporting module.
The following paragraph gives an outline for this work.
Chapter 2 is a short introduction to the software NED-2, its architecture and components. It
also refers to more comprehensive publications on the individual components. Chapter 3
provides background for goal analysis in NED-2. Special focus is given to Timber Goal Analysis
and the inference engine. The main objective of this thesis is presented in Chapter 4, which
discusses the development of a Wildlife Model for the southeastern United States and its
integration with the existing wildlife goals for the northeast. Topics analyzed are knowledge
acquisition, knowledge base development, and system integration. Chapter 5 describes how the
results are reported in HTML pages. It also explains which processes are involved in the
generation of reports and how the report agents interact with the goal analysis. Here, the
generation of the southeastern wildlife reports is discussed in detail. Chapter 6 opens a
discussion on how users might apply the software to their domain, which questions will arise,

3
and how to draw the most out of the user’s feedback. The actual user evaluation will start by
releasing NED-2 beta at the end of October 2004. This document concludes with Chapter 7,
suggesting improvements, alternatives, future work, and planned extensions.
Seven Appendices provide the documents used and built during the development. Source
code, the current NED-2 version, and related documents are available on a CD available from the
Artificial Intelligence Center, University of Georgia, Athens, GA 30602.

4
CHAPTER 2
A BRIEF REVIEW OF THE NED-2 DECISION SUPPORT SYSTEM
The NED-2 Decision Support System for ecosystem management is being developed by
the USDA Forest Service in close collaboration with faculty and students from the Artificial
Intelligence Center at the University of Georgia under the supervision of Dr. Donald Nute and
Dr. Walter D. Potter.
NED is an acronym for Northeast Decision Model, a decision process for managing
forested land in the Northeast of the United States. While the name remains, the software’s
application area has been extended to the entire eastern part of the United States.
The purpose of the software is to combine several tools for ecosystem management into a
single application. The integration of many existing systems under a single interface provides
land managers with a convenient and successful decision process program that helps to manage
data and goals, analyses, and predicts.
Currently, the interface is divided into three main functions:
1. Management and Analysis of Inventory data
2. Planning, through goal formulation, treatment definition, treatment plan development,
and simulation.
3. Reporting of results of Analysis using hypertext documents, a geographic information
system (GIS), and tabular representations.
5
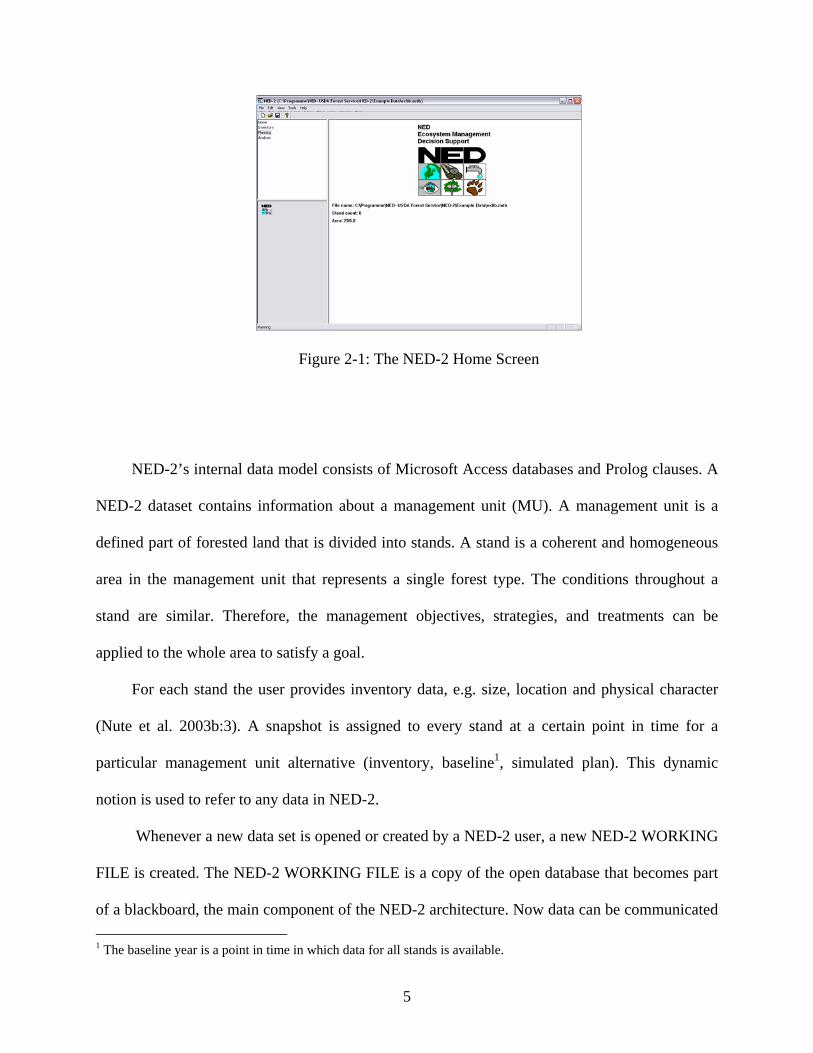
Figure 2-1: The NED-2 Home Screen
NED-2’s internal data model consists of Microsoft Access databases and Prolog clauses. A
NED-2 dataset contains information about a management unit (MU). A management unit is a
defined part of forested land that is divided into stands. A stand is a coherent and homogeneous
area in the management unit that represents a single forest type. The conditions throughout a
stand are similar. Therefore, the management objectives, strategies, and treatments can be
applied to the whole area to satisfy a goal.
For each stand the user provides inventory data, e.g. size, location and physical character
(Nute et al. 2003b:3). A snapshot is assigned to every stand at a certain point in time for a
particular management unit alternative (inventory, baseline1, simulated plan). This dynamic
notion is used to refer to any data in NED-2.
Whenever a new data set is opened or created by a NED-2 user, a new NED-2 WORKING
FILE is created. The NED-2 WORKING FILE is a copy of the open database that becomes part
of a blackboard, the main component of the NED-2 architecture. Now data can be communicated 1 The baseline year is a point in time in which data for all stands is available.

6
through the blackboard. Other databases, incorporated into the system hold additional
information about goals, reports, variables and species.
NED-2 is a modular, multi-agent system. Each agent is defined by a domain control
module (DCM) that performs one task in the decision process. The blackboard and the agents are
implemented in Prolog. The interface agent executes C++ functions to display the program’s
screens2. The agents are semi-autonomous and communicate by placing facts and requests on the
blackboard.
Data dictionary files store metaknowledge about the databases and their relations. This
metaknowledge helps to integrate the data from the databases into the blackboard. To get data
from the blackboard an agent calls the predicate known/1 that handles the access of facts from
the database, facts that have been derived from existing facts and previously asserted Prolog
facts. Maier (2002) describes the processes involved in the agent-blackboard communication.
In case of a third-party component the agent would be a wrapper for existing software. The
design of the NED-2 architecture allows adding new models and components very easily without
extensive knowledge about other already-existing agents. The agents do not know anything
about the other agents in the system. The one-place predicate request/1 represents the current
plan of action and takes a list of requests as argument. If an agent identifies a request on the
blackboard for a task it was designed to fulfill, it performs the task, places potentially new
information on the blackboard and erases the request from the blackboard . From a programmer
perspective this means the agents reacts to the first element in the list of requests, erases the old
plan from the blackboard and puts the rest of the plan (without the first request) back on the
blackboard.
2 Additional DLLs (Dynamic Link Libraries) are called by agents for calculations on inventory and for reports.

7
More details about the architecture, ontology, individual models, and agents are given in
Nute et al. (2003a). A user perspective and case studies can be found in Twery et al. (2003).
Insight into the functionality and implementation of the simulator is given in “The NED Forest
Management DSS: The Integration of Growth and Yield Models” by Astrid Glende (Glende
2004). Routh (2004) discusses the NED-2 fire risk model and the integration of GIS into the
system.

8
CHAPTER 3
GOAL ANALYSIS IN NED-2
The NED-2 decision process is initiated through two steps: data entry and goal selection.
The other components of the software are organized with respect to the goal selection. To
achieve and maintain selected goals, the user evaluates the current data, develops and simulates
alternative courses of actions, and analyzes these. These tasks are accomplished by the
simulation agent, the report agent, and integrated visualization tools.
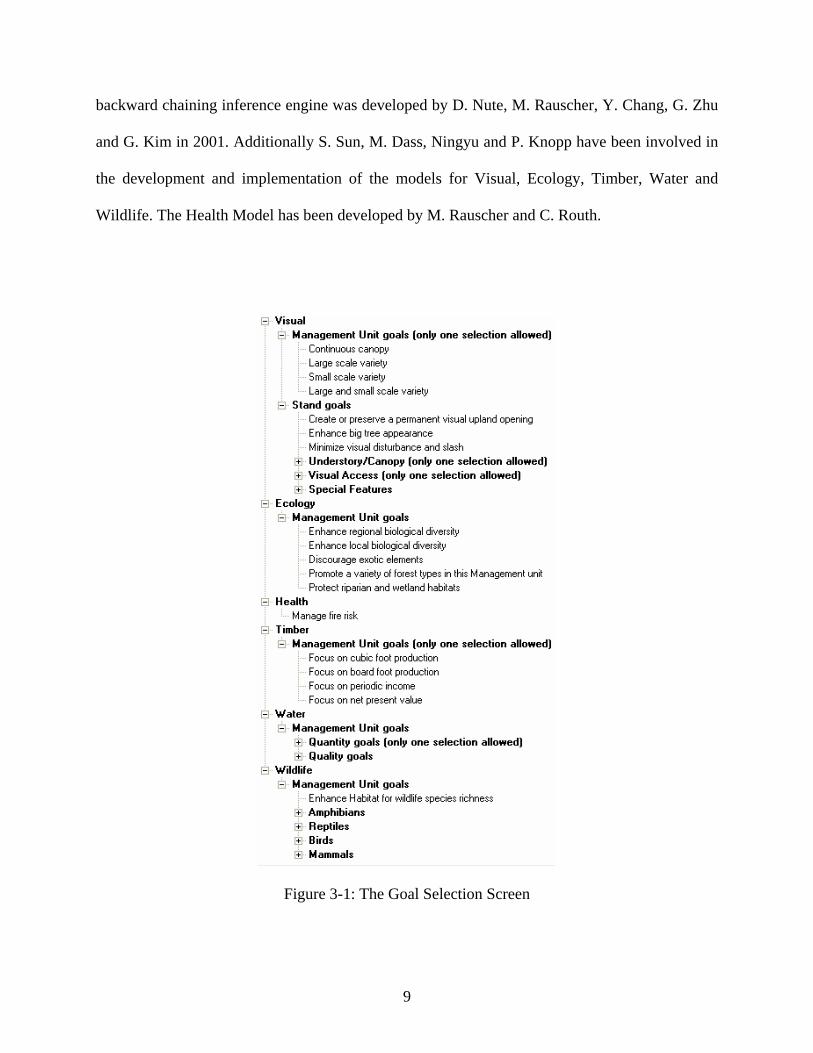
Currently, NED-2 offers six different goal categories: Visual, Ecology, Health, Timber,
Water, and Wildlife. The land manager picks predefined goals from the goal selection screen in
the interface (Figure 3-1) and organizes them into goal sets. Then the user can request analysis
and reports on the picked goals for developed plans to determine the right course of management
action.
Goal analysis is based on six different models, one for each category. A model is a
knowledge base of Prolog rules that has been developed by the NED-2 team. The goal analysis
agent calls a “fuzzy” backward chaining inference engine that evaluates the rules for output.
Goal analysis takes place on two levels: the stand level and the management unit level.
Currently, only the goal category Visual contains stand level goals; all other goals are
management unit level goals.
The following paragraphs describe the general format of the goal analysis rules, the Timber
Model, and the Wildlife Model for the Northeast and the inference engine. The “fuzzy”
9
backward chaining inference engine was developed by D. Nute, M. Rauscher, Y. Chang, G. Zhu
and G. Kim in 2001. Additionally S. Sun, M. Dass, Ningyu and P. Knopp have been involved in
the development and implementation of the models for Visual, Ecology, Timber, Water and
Wildlife. The Health Model has been developed by M. Rauscher and C. Routh.
Figure 3-1: The Goal Selection Screen
10
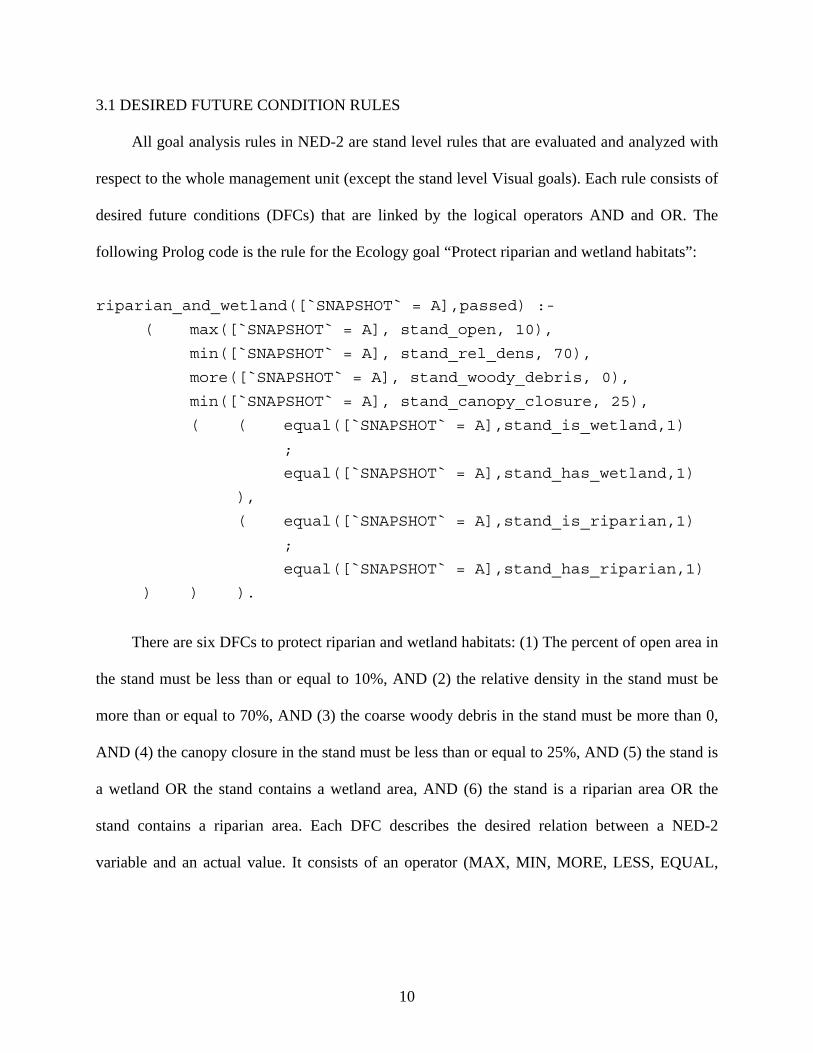
3.1 DESIRED FUTURE CONDITION RULES
All goal analysis rules in NED-2 are stand level rules that are evaluated and analyzed with
respect to the whole management unit (except the stand level Visual goals). Each rule consists of
desired future conditions (DFCs) that are linked by the logical operators AND and OR. The
following Prolog code is the rule for the Ecology goal “Protect riparian and wetland habitats”:
riparian_and_wetland([`SNAPSHOT` = A],passed) :-
( max([`SNAPSHOT` = A], stand_open, 10),
min([`SNAPSHOT` = A], stand_rel_dens, 70),
more([`SNAPSHOT` = A], stand_woody_debris, 0),
min([`SNAPSHOT` = A], stand_canopy_closure, 25),
( ( equal([`SNAPSHOT` = A],stand_is_wetland,1)
;
equal([`SNAPSHOT` = A],stand_has_wetland,1)
),
( equal([`SNAPSHOT` = A],stand_is_riparian,1)
;
equal([`SNAPSHOT` = A],stand_has_riparian,1)
) ) ).
There are six DFCs to protect riparian and wetland habitats: (1) The percent of open area in
the stand must be less than or equal to 10%, AND (2) the relative density in the stand must be
more than or equal to 70%, AND (3) the coarse woody debris in the stand must be more than 0,
AND (4) the canopy closure in the stand must be less than or equal to 25%, AND (5) the stand is
a wetland OR the stand contains a wetland area, AND (6) the stand is a riparian area OR the
stand contains a riparian area. Each DFC describes the desired relation between a NED-2
variable and an actual value. It consists of an operator (MAX, MIN, MORE, LESS, EQUAL,
11
IN_RANGE, MEMBER_OF, HAVE), an object (that is instantiated to a snapshot), a NED-2
variable, and a target value3.
3.2 THE “FUZZY” BACKWARD CHAINING INFERENCE ENGINE
In this section I describe the “fuzzy” inference engine in NED-2. This information serves as
a background for the following chapters. The code for the inference engine can be found in the
file nedcf.dut located in the Utilities folder in NED-2.
The DFC rules are evaluated by a “fuzzy” backward chaining inference engine.4 Each rule
is evaluated on a stand level for a single snapshot. If the selected goal is a management unit goal,
the rule is evaluated for each stand and the management unit results are summarized in the goal
analysis report. The Timber goal analysis applies a more complicated process to the evaluated
stand level rules to conclude a management unit goal (see 3.3). If the goal is a stand level goal,
the user is asked to pick a subset of stands which will be evaluated and reported on.
As seen in the previous section, each DFC describes a target value that an actual value
should meet. In a lot of cases, experts differ about these values. It is simply not possible to
determine the exact maximum or minimum value of any particular variable that a stand must
meet to provide habitat for a given species. This is handled in NED-2 by treating minimum and
maximum target values for DFCs as fuzzy. Therefore, the goals are evaluated with a “fuzzy”
inference engine in the following manner: If the actual (or simulated) value of a DFC is bigger
than 110% of a minimum target value, the DFC fully satisfies. If the actual value is between
100% and 110% of the minimum target value, the DFC minimally satisfies. If the actual value is
3 The exceptions are the HAM type in the Northeastern Wildlife Model and the prescription type in the Timber rules. DFCs for the these variables are evaluated by an additional set of DFC rules. 4 We use scare-quotes around „fuzzy“ here because the NED-2 inference engine does not implement the familiar version of fuzzy reasoning developed by Zadeh and others, but instead uses another method for representing the fuzziness of the target values represented in NED-2 rules.

12
between 90% and 100% of the minimum target value, the DFC nearly satisfies. If the target is
less than 90% of the minimum target value, the DFC fails. These conditions are reversed where
the target value for a DFC represents a maximum value required to provide habitat for a species.
Accordingly, each condition is assigned a “fuzzy” confidence factor (CF):
• fully satisfied CF = 1.0
• minimally satisfied CF = 0.6
• nearly satisfied CF = 0.4
• failed CF = 0.0
Once the individual DFC confidence factor has been determined, the whole rule can be
inferred: For two AND related DFCs the minimum of the two is the output confidence factor.
For two OR related DFCs the maximum of the two is the output confidence factor. Accordingly,
the goal status for a snapshot is represented by the returned confidence factor: CF 1.0 means the
goal fully passes, CF 0.6 means the goal minimally passes, CF 0.4 means the goal nearly passes
and CF 0.0 means the goal completely fails.
Looking at the process from the programmer’s view, each “fuzzy” rule is a Prolog
predicate of the following structure:
rule(nedcf,Environment,RuleName,Treshold,Rule,String).
The first argument nedcf indicates that the rule is to be used with the NED-2 “fuzzy”
inference engine. The Environment variable determines a rule environment which decides
which rules are considered for evaluation. Usually, the Environment variable is instantiated to

13
the atom stand_analysis. The only exception is the Timber analysis for which the rule is
picked based on an environment, represented by a prescription forest type.
Each rule has a RuleName and a Threshold. The Threshold determines the
maximum confidence factor that a rule can return after evaluation. Usually, this Threshold is
equal to 1.0, because the goal can maximally fully pass the rule. The Wildlife Model for the
Southeast is the exception. There can be up to three rules for one species habitat goal. One rule
could describe optimal habitat for a species. A second rule could describe suitable habitat for a
species. A third rule could describe marginal habitat for a species. Depending on the level of
habitat the threshold is set for each rule: The rule for optimal habitat has a threshold of 1.0 (fully
satisfied), the rule for suitable habitat has a threshold of 0.6 (minimally satisfied) and the rule for
marginal habitat has a threshold of 0.4 (nearly satisfied).
The fifth argument of rule/5, here called Rule, is the rule body. An example has been
shown in section 3.1. The last argument is a rule description String.
The “fuzzy” inference engine is a backward chainer, picking the rule according to the goal
before evaluating it. It is called through the following predicate:
call_NEDCF_backward_chainer(Goals,Environment,Threshold,List).
Here, Goals is a list of goals that are to be analyzed. Environment designates the
environment in which the goal will be evaluated. The Environment instantiates to the
environment variable in the nedcf rule. The Threshold in the call to the backward chainer
must be met before the output of the goal analysis is recorded on the blackboard. List specifies
if only one rule per goal should be evaluated or if all matching rules should be considered. Also,
one can choose if the output information should be stored in a trace document (additionally to on
14
the blackboard). Tracing is only used for development and will be turned off in the release
version of NED-2.
The backward chainer fuzzifies each DFC and infers a goal status for the given snapshot.
Details on how the individual DFCs are fuzzified are given in Appendix A. Finally, the
information is stored on the blackboard with the fact/4 predicate:
fact(Pred(Object,Goal),RuleName,CF,TimeStamp)
3.3 TIMBER GOAL ANALYSIS
In the usual case, goal analysis happens on a stand level and a summary of the stand-level
results are reported for the whole management unit. There is no detailed management unit level
analysis. If 100% of the management unit area has fully passed the goal, the management unit
passes the goal. If 100% of the management unit area fails the goal, the management unit fails
the goal. In all other cases, the management unit goal status is called not fully and the user needs
to look at the stand level information to draw any conclusions.
Timber goal analysis is the exception to this pattern of goal analysis. It applies a more
complicated system that takes the management unit goal evaluation into consideration. There are
two conditions that must be satisfied to pass a Timber goal:
1. The management unit must have balanced size classes.
2. 65% of the management unit area must pass the stand level Timber goal.
Size classes in NED-2 is a variable classifying each stand into one of five size classes
according to the medial dbh within a stand. There are five size classes: regeneration, sapling,
pole, small sawtimber, and large sawtimber. The NED-2 documentation of the variable with
details on its calculation can be found in APPENDIX B. To test for the first condition, the size

15
class for every stand needs to be looked up in the database. Then, the size classes are tallied to
the whole management unit according to the area of each stand. A management unit is defined to
have balanced size classes if it has 5-15% of the management unit area in the size class
regeneration, 35-50% of the management unit area in the size class sapling or pole, 25-40% in
the size class small sawtimber, and 10-20% in the size class large sawtimber.
For the second condition the Timber stand goal analysis for the selected goal needs to be
performed. There are several Timber rules for one goal, each corresponding to a different
prescription type. A prescription type is an assignment of NED-2 forest types to a vegetation
type that the Timber Model refers to. There are ten prescription types defined in NED-2:
• spruce-hardwoods
• spruce-fir
• white pine
• hemlock-hardwoods
• Appalachian hardwoods
• aspen-birch
• Allegheny hardwoods
• northern hardwoods
• oak-northern hardwoods
• oak-hickory
The prescription types are defined by nedcf rules in the Timber knowledge base. For the
stand goal analysis we want to pick the Timber rule with the prescription type of the stand.
Hence, the Timber goal analysis agent calls the inference engine on the nedcf prescription type
rules. Then, it consults the blackboard to see which prescription type succeeded for the stand and
passes the prescription type to the inference engine as the Environment variable for the actual

16
Timber goal. Following, the inference engine will know which rule to pick and the “fuzzy” goal
analysis is executed. After performing the stand analysis, the stand goal status is tallied to the
management unit according to its area. The management unit passes the second condition if 65%
of the management unit area passes the goal status. Again, this process is fuzzified. The output is
chosen according to the following table:
Table 3-1: “Fuzzification” of Timber Management Unit Goals
If more than 110% of the target value (equivalent to more than 71.5%) of the management
unit area satisfies the stand level goals with CF 1.0, then the management unit level goal fully
passes. Else, if more than 65% (which is 100% of the target value) of the management unit area
satisfies the stand level goals with at least CF 0.6, then the management unit level goal
minimally passes. Else, if more than 58.5% (90% of the target value) of the management unit

17
area satisfies the stand level goals with at least CF 0.4, then the management unit level goal
nearly passes. In all other cases, the management unit goal fails with CF 0.0.
The management unit goal analysis is performed by the Timber goal report agent that
displays the information in an HTML report or places the results of the analysis on the
blackboard where the GIS agent can access it, depending on the kind of display the user has
requested. APPENDIX C shows an example for a Timber goal analysis report.
3.4 THE WILDLIFE MODEL FOR THE NORTHEAST
This section gives a short overview of the Northeastern Wildlife Model in NED-2 that has
been implemented by Shulei Sun and Donald Nute (Sun 2001) and is based upon the wildlife
habitat assessment matrix HAMMOD by Cleveland et al. (1998). The Northeastern Wildlife
Model served as an example for the development of the Southeastern Wildlife Model.
All goal analysis is based on a set of nedcf rules that are stored in individual knowledge
bases. The wildlife rules for the Northeast have the same structure as described in section 3.1.
For each of the 223 species there exists exactly one habitat rule. The species are grouped into
four categories: amphibians, reptiles, birds, and mammals. All rules are stored in one knowledge
base called wild_dfc.kb.
Part of the rule is a DFC called stand_ham_type. The predicate name refers to the
HAMMOD table which is the source habitat matrix for building the Wildlife Model for the
Northeast (Sun 2001:18). The stand_ham_type DFCs are evaluated by a set of nedcf rules.
Similar to the prescription types for the Timber goal analysis, each HAM type is assigned a
subset of forest types. An example is the HAM type white pine:
rule(nedcf,forest_type,hamft_white_pine,1,

18
(stand_ham_type( [`SNAPSHOT` = A], 'white pine' ) :-
member_of( [`SNAPSHOT` = A], stand_forest_type,
[pine, 'other softwoods', 'PINUS', 'PIBA2', 'PIRE', 'PIRI',
'PIST', 'PITA'])),
[`HAM Forest Type is a variable used by the rules in`,
`the wild_DFC.kb. This rule identifies stand that`,
`provide Wildlife habitat of the White Pine forest
type.`]).

19
CHAPTER 4
THE WILDLIFE MODEL FOR THE SOUTHEAST
4.1 KNOWLEDGE ACQUISITION
The most challenging task of developing the Wildlife Model for the Southeast has been the
knowledge acquisition. Three main source categories have been identified that provide the core
knowledge for the model:
1. literature references
2. habitat matrices and species lists in electronic format
3. expert knowledge
Gathering the sources, understanding the terminology, and studying the literature
references were the first steps in the knowledge acquisition. The Land Manager’s Guide to the
Birds of the South by Paul Hamel (1992) and the Land Manager’s Guide to the Amphibians and
Reptiles of the South by Dr. Lawrence A. Wilson (1995) come with habitat matrices, showing
which habitat condition is necessary for each species and providing information for each species
about abundance status, description, distribution, primary habitat, special requirements, breeding
habitat, wintering habitat, reproduction, food habitat, management suggestions, and additional
references. Initially, unstructured interviews with Dr. Nute and the rest of the NED-2 team
supported the overall understanding and outline of the research aim.
Since experts have the most in depth knowledge of the domain, the next step in acquiring
the knowledge consisted of structured interviews with wildlife experts. Consultation with experts

20
was mainly aimed at identifying the essential habitat requirements for the species and discussing
measurements in the habitat variables.5 During a meeting with wildlife expert Linda Thomasma,
we discussed the habitat matrices for the birds, reptiles, and amphibians. Margaret Griep is a
wildlife expert working on overseeing the wildlife habitat books published by the Nature
Conservancy (Hamel 1992 and Wilson 1995). She is also working on a version of the mammals
book that has not yet been published. She provided the data from the books in electronic format.
This was essential for building an automated rule writer. During a phone interview, Margaret
Griep assisted with questions on variables. The forestry experts of the NED-2 team helped with
translating habitat conditions into NED-2 variables, identifying variables that were not yet in the
system, and general decision-making.
The following essential expert knowledge that influenced the design of the knowledge
bases was gained through the research:
A. The Habitat Matrices
a. Domain Knowledge
The matrices provide habitat information for the species on the assumption that
• the correct vegetation type and successional stage is present.
• the rule is applied within the range where the species occurs (Wilson 1995:3).
A vegetation type is defined by the plant species that are dominant for some management
unit. In NED-2 we use the term forest type where each forest type is defined by the
presence of specific tree species within a forest. The birds books define 23 different
5 For example, canopy closure is a habitat condition for several birds, amphibians, and reptiles. Canopy closure is a NED-2 variable that represents the relation of relative density and stems per unit area. Canopy closure within a stand is measured in percentage. Deciding on a measurement for the variable canopy closure means defining how much percent canopy closure is required in a stand to provide optimal habitat for a species.

21
vegetation types, and the reptiles and amphibians books define 27 types. Some of the types
in the two books overlap.
The successional stages represent different stages and maturity of the tree species in a
forest over time. NED-2 represents successional stages by assigning to each stand a size
class that is calculated by the medial dbh in the stand. The following size classes are
possible: regeneration, sapling, pole, small sawtimber and large sawtimber.
The range of a species are the states or areas the species occurs in.
b. Design Decisions
The vegetation types need to be translated into the NED-2 forest types. Most of the forest
types in the Southeastern United States are not yet represented in the NED-2 system.
Therefore, new forest types need to be developed and each vegetation type in the matrices
needs to be assigned to a forest type (see 4.2). Vegetation types that do not represent
forests, like spartina and cave dwelling, and species that only have habitat in these
vegetation types need to be filtered out. The vegetation type can be represented by a
desired future condition in the rule using the member_of predicate (see APPENDIX A):
member_of(Object,forest_type,ForestTypeList)
Accordingly, the main assumption that the forest type habitat needs to be established is
satisfied. The rule can only pass, if the member_of DFC succeeds.
The successional stages need to be mapped to the size class values of NED-2. The
successional stages habitat conditions are weighted with O, S and M. O stands for optimal
habitat, S stands for suitable habitat, and M for marginal habitat. The habitat levels
represent the frequency and the numbers in which the species occur. To represent these

22
relations, up to three rules might be generated per species: one rule might represent optimal
habitat, one rule might represent suitable habitat and one rule might represent marginal
habitat. By setting the Threshold in the rules to 1.0, 0.6 and 0.4 the different habitat
levels are represented. Accordingly, only the rule with optimal habitat can maximally be
fully satisfied. The rule with suitable habitat can maximally be minimally satisfied and the
rule with marginal habitat can maximally be nearly satisfied. The size class value itself is
represented by a member_of DFC:
member_of(Object,stand_size_class,SizeClassList)
Again, the rule can only pass if the member_of DFC is satisfied. However, if so, it can
only pass with the maximum habitat level set in the rule.
To ensure that a rule is applied within the species’ range, only the species that occur in the
current management unit state are displayed on the goal selection screen.
B. The Bird Matrices
a. Domain Knowledge
The bird habitat information is divided up into wintering and breeding habitat. The
following habitat categories are listed:
i. vegetation type
ii. successional stages
iii. substrate utilization
iv. vegetation layer
v. specific requirements
vi. standing, flowing water and water quality

23
vii. minimal tract size
b. Design Decisions
Breeding and wintering habitat for birds are divided into two rule sets: One rule set for
breeding and one rule set for wintering. The difference in the breeding and wintering
habitat for one single species might be very significant, especially for migrating birds.
There is no other possibility to capture a decent habitat analysis without one or the other.
The first two habitat categories for the birds vegetation type and successional stages have
been discussed in the previous paragraph in detail.
The substrate utilization and vegetation layers have been filtered out of the rules for the
following reasons. The substrate utilization habitat conditions are bare soil and leaf litter.
The vegetation layers listed are herbs, shrubs, midstory and overstory. According to the
wildlife experts, in most cases these variables are not habitat conditions in the sense that
their non-existence would endanger the habitat for the species. Secondly, the use of these
variables is strongly dependent on the vegetation type that the habitat is tested on. This
relation is not represented in the matrix. Therefore, the information given by these two
categories is not reliable and cannot be used as DFCs in the rules. Nevertheless, it is
additional information that the user might need for his management actions. For this
reason, the information is stored in an additional predicate
species_uses(+Goal,+WinterorBreeding,+BARESOIL,+LEAFLITTER,
+HERB,+SHRUB,+MIDST,+OVERSTR,+TRACTSIZE).
This way, the information can be easily read by the report agent and output as additional
information for the user.
24
The specific requirements are important habitat conditions and are AND relations in the
rules. The translation of the conditions into NED-2 variables and the measurements for the
variables were coordinated with the experts.
Standing, flowing water, and water quality represent essential information that cannot be
ignored. Standing water is represented by the NED-2 variables that record permanent
ponds, vernal ponds, temporary ponds, and wetland areas. Flowing water is represented by
NED-2 variables that record streams and riparian areas. There are no variables in NED-2
that account for water quality. Therefore, three new boolean variables are in planning: fresh
water present in a stand; brackish water present in a stand and salt water present in a stand.
Together with other variables that need to be added to the system within the scope of the
Wildlife Model, these variables are still under development and have not been added to the
system yet. The DFCs for the three variables are implemented in the rules already, but
commented out for the time being. As a temporary solution these variables are not
considered in the rules, but written out in the report in a similar manner as the variables of
the predicate species_uses/9.
The minimal tract size is essential information for bird habitat. For example, the red-
shouldered hawk has a home range for breeding of only one square kilometer. However,
the tract size, measuring the area it uses - among others for food supply - is about 500 acres
(Stravers et al. 1994). Area sensitive birds can be easily chased away by a clear-cut on
adjacent stands or similar management actions. As the NED-2 goal analysis happens on a
stand level, there is no way to take the minimal tract size into account when developing the
rules. Hence, the minimal tract size is added as an argument to the predicate
species_uses/9 and the user will be informed about the importance of the variable.

25
All DFCs are necessary habitat conditions and will be AND related, except for the case that
multiple NED-2 variables represent the same condition.
C. The Amphibians and Reptiles Matrices
a. Domain Knowledge
The following habitat categories are listed for amphibians and reptiles:
i. forest types
ii. successional stages
iii. physiographic features
iv. specific requirements
v. aquatic vegetation
b. Design Decisions
The first two habitat categories for the amphibians and reptiles are forest types and
successional stages. These were discussed above.
The physiographic features describe forest environments, like swamps, lakes and
marshes, used by the species for different activities, e.g. breeding. Usually, not every
physiographic requirement is needed to provide habitat for a species. In addition, the NED-
2 variables might not be as specific as the habitat conditions in the habitat matrices. One
NED-2 variable might describe two or three conditions in the matrices. Therefore, the
physiographic features are OR relations in the rules.
The specific requirements have a much stronger impact on the habitat. Each entry in this
category needs the land manager’s attention. Hence, the specific requirements must be
AND related in the rules.
26
Finally, aquatic vegetation is a very important variable for amphibians and reptiles. Since
NED-2 does not represent aquatic vegetation to the extend needed for the amphibians and
reptiles, a new variable, called stand_aquatic_vegetation is in planning. Similar
to the other variables, it has not yet been added to the system, and is currently displayed in
the reports in an additional paragraph.
D. Mammal Matrices
a. Domain Knowledge
The following habitat categories are listed for mammals:
i. terrestrial habitat and subterranean habitat
ii. special habitat factors
iii. aquatic habitat
b. Design Decisions
The terrestrial habitat and subterranean habitat is represented by the land cover type
variable in NED-2. APPENDIX B documents the NED-2 variable stand_cover_type
(NED-2 ID for land cover type). As all the terrestrial habitat and subterranean habitat
conditions are represented by the same variable that can take only one value for each stand,
the conditions must be OR related.
The importance of special habitat in the mammals’ matrices is equivalent to the
importance of specific requirements in the birds, amphibians, and reptiles matrices.
Therefore, the DFCs are AND relations.
Aquatic habitat is represented by several NED-2 variables. Again, more than one entry is
represented by the same variable as NED-2 is less specific than the habitat matrices and
again the conditions must be OR related.
27
The mammals’ habitat matrices do not distinguish between optimal, suitable, and
marginal habitat. Therefore, all mammal rules are weighted with a Threshold of 1.0.
This summarizes the significant expert knowledge behind the development of the
knowledge bases. The individual translations of habitat conditions into NED-2 variables can be
reviewed in the documentation of the rule writer program (see companion CD).
Once the expert knowledge was gathered, the knowledge bases needed to be generated (see
section 4.3) and used by the system (see section 4.4).
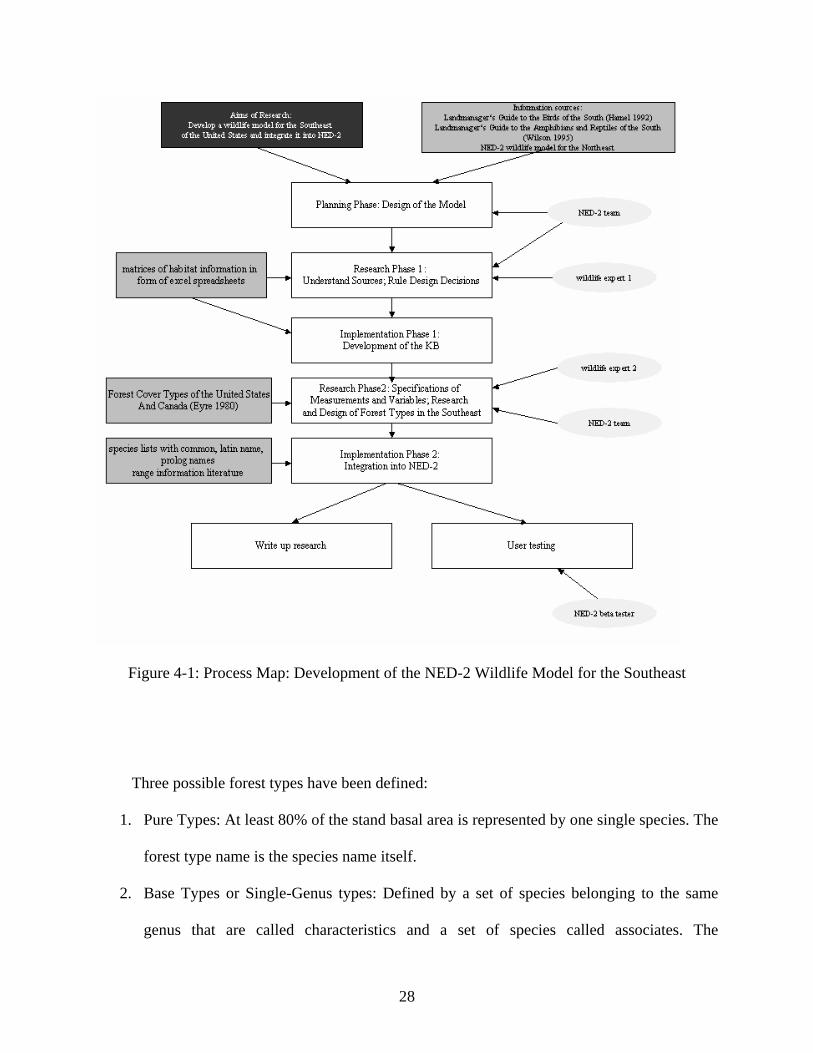
Figure 4-1 is a process map of how knowledge for the Southeastern Wildlife Model was
acquired, analyzed, and modeled. It demonstrates the relation between the different steps that
have been covered in this subchapter.
4.2 THE FOREST TYPES IN THE SOUTHEAST
The extension of the wildlife resource management in NED-2 to the Southeast involved the
development of a new set of forest types. Up to this point NED-2 defined 27 forest types for the
Northeast.
David A. Marquis, Mark Twery, and Peter Kollasch developed an algorithm that generates
the forest types for NED-2 with the following objectives: (1) The forest type should be
calculated by the computer from the stand inventory data only. (2) A set of forest types need to
be determined, so that almost every stand in the Northeast could be classified (Marquis et al.
1997).
28
Figure 4-1: Process Map: Development of the NED-2 Wildlife Model for the Southeast
Three possible forest types have been defined:
1. Pure Types: At least 80% of the stand basal area is represented by one single species. The
forest type name is the species name itself.
2. Base Types or Single-Genus types: Defined by a set of species belonging to the same
genus that are called characteristics and a set of species called associates. The

29
characteristic species represent at least 50% of the stand basal area. The characteristic and
the associated species together represent at least 65% of the stand basal area. The forest
type name usually indicates the characteristic species genus.
3. Mixed Types: Types that represent mixed-species forest types. Defined by characteristics
and associates.
a. Characteristic species represent at least 50% of the stand basal area. Associate
species and characteristic species together represent at least 65% of the stand
basal area.
b. Characteristics consists of two forest types. Then, each forest type must represent
at least 25% of the stand basal area. Characteristics and associates represent at
least 65% of the stand basal area.
Species that occur as a characteristic species of one type cannot be in the characteristic list
of a second type. However, any defined forest type can be a characteristic for any other forest
type.
Stands can only have a forest type assigned if they satisfy the size class sapling or higher.
According to this algorithm Mark Twery, who is one of the original designers of the forest
type algorithm, assisted in developing 13 base types and seven mixed types for the Southeast.
Also, seven of the Northeastern forest types were modified during this process. Figure 4-2
visualizes the development steps in a process map.
The starting point was to build a list of vegetation types that provide habitat for the wildlife
species (Hamel 1992 and Wilson 1995). Non-forested vegetation types, like spartina and cave
dwelling, have been filtered out as the NED-2 focus is on forest ecosystem management. The
vegetation types come with a translation into SAF types (forest cover type descriptions by the

30
Figure 4-2: Process map: Development of NED-2 Forest Types in the Southeast
Society of American Foresters.) The SAF types are defined by characteristic and associated
species, similar to the forest types in NED-2 (Eyre 1980). Research on the SAF types helped to
prepare a list of the required vegetation types, their characteristic and their associated species.
In a final meeting with the forestry expert Mark Twery, the types were regrouped and
pooled. The resulting list consists of 20 new southeastern forest types. The final step was the
integration into the system by Scott Thomasma, the C++ interface programmer and NED-2
database administrator.
Once the development of the new forest types had been wrapped up, the results could be
used in the development of the wildlife knowledge base.

31
As the forest types had been developed directly from the vegetation cover types, a list
translating the wildlife vegetation types into NED-2 forest types was prepared. The Wildlife
Model for the Northeast uses the HAM rules to map the NED-2 forest types to the required types
in the model. By using the translation list for implementing the rule writer, the additional step of
designing rules similar to the HAM rules was not required.
APPENDIX D gives a list of all the current NED-2 forest types, including the newly
developed forest types in the Southeast. Research papers used and documents prepared during
the research of the forest types have been added to the companion CD. The list of NED-2 forest
types is still being revised by the NED-2 forestry experts and will be updated soon.
4.3 THE RULE WRITER PROGRAM
The extension of NED-2 with the Southeastern Wildlife Model added 405 new wildlife
species to the system. This does not include the species that already existed in the NED-2
Wildlife Model for the Northeast and that got extended with a second habitat rule for the
Southeast. The bird rules come in two rule sets: one for breeding and one for wintering. The
extensive number of rules makes it impractical to develop the rules by hand. Hence, a rule writer
was created. Once the generation of the rules was automated, it was simple to make
modifications to the rules due to design decisions or implementation issues.
All files discussed in this section can be found on the companion CD. Due to the length of
the files the data was not added as an appendix, but is available in electronic format.
The input into the rule writer are Excel files that store the habitat matrices. The bird
matrices are stored in four Excel files: SPFTABL1.XLS, SPFTABL2.XLS, SPFTABL3.XLS,
32
SPFTABL4.XLS. Each matrix stores the species habitat information for a set of vegetation types.
Therefore, if a species occurs in several vegetation types, it has entries in the different files.
The reptiles and amphibians matrices are stored in two files: FORTYPE.XLS and
HABFEAT.XLS. The first matrix stores the forest type information for all species, the second
matrix stores all other habitat data.
The mammals matrices come with three files: terr_subterr_habitats.xls,
special_hab_factors.xls and aquatic_habitats.xls. The files list the different subcategories of
habitat conditions for all species.
Each of the three species groups (birds, amphibians and reptiles, mammals) required the
implementation of an individual rule writer due to differences in
1. format and count of input files
2. spelling of the used variables
3. interpretations of variables and measurements for different species groups
4. the output of the rules (breeding and wintering for birds; optimal, suitable and marginal
habitat for birds and for amphibians and reptiles)
Of course, the main structure of the programs could be reused and modified according to
the differences.
The following elements are the same for all three rule writers:
1. A species_meta_data.pl program uses the DDE (Dynamic Data Exchange) interface of
LPA Prolog to link with the application Excel (Shalfield 2002). It reads in the data of the
Excel files and generates a temporary file with the available habitat knowledge in
intermediate format.

33
2. A species_rules.pl program reads the metaknowledge bases and writes the rules into an
output file that generates the knowledge base. The birds_rules.pl program generates two
output files: one for breeding rules and one for wintering rules.
3. Each species_rules.pl program implements
a. the writing of the general rule structure.
b. the conversion of the species name to a Prolog atom.
c. a check for optimal, suitable, or marginal habitat and the setting of the correct
Threshold.
d. the generation of a RuleName that is the concatenation of the atom ‘wi_’ for
wildlife, if applicable the atom ‘opt_’, ‘sui_’ or ‘mar_’, indicating the habitat
level of a rule, and the species Prolog atom.
e. the division between rules for the Northeast, the Southeast, breeding and
wintering habitat. The rule conclusion predicates are named as follows:
• habitat_available is the existing predicate for the Northeastern
Wildlife Model.
• south_habitat_available is the new predicate for the
Southeastern Wildlife Model. This applies to the mammals, amphibians
and reptiles.
• breed_habitat_available and
winter_habitat_available are the predicates used for the bird
species rules.
Originally, the Environment variable was planned to indicate the model
analyzed. This would allow the goal analysis agent to pick the rule according to a
model stated in the Environment for evaluation. But the report agent would

34
have no way of knowing which results on the blackboard belong to which model
as the Environment variable is not stored on the blackboard by the inference
engine. Therefore, the rule predicate was used to indicate the difference.
f. the AND and OR relation that has been defined during the knowledge acquisition.
g. the mapping of the habitat condition from the matrices to the DFC.
h. the generation of a rule description string.
The bird_rules.pl program also outputs the species_uses/9 predicate discussed in
the previous section.
An example for a rule structure written by the rule generator for Ringed Salamander is
given in the following:
% rule structure for optimal habitat for ringed salamander
% threshold variable is set to 1.0 due to optimal habitat
rule(nedcf,stand_analysis,wi_opt_ringed_salamander,1,
% rule applies to Southeastern Model
(south_habitat_available(
[`SNAPSHOT`=A,species(ringed_salamander)],passed ) :-
% the following DFCs must be met
member_of([`SNAPSHOT`= A],stand_forest_type,['appalachian
hardwoods','bottomland hardwoods','loblolly pine-shortleaf
pine','mesic mixed pine-hardwoods']),
member_of([`SNAPSHOT`= A],stand_size_class,['large
sawtimber','small sawtimber']),
( equal( [`SNAPSHOT`= A],stand_has_wetland,1);
equal( [`SNAPSHOT`= A],stand_is_wetland,1);

35
equal( [`SNAPSHOT`= A],stand_perm_ponds,1);
equal( [`SNAPSHOT`= A],stand_temp_ponds,1);
more( [`SNAPSHOT`= A],stand_wetland,0)
),
more( [`SNAPSHOT` = A],stand_canopy_closure, 25),
% moist soil is one of the variables not added to NED-2, yet
% the DFC is commented out, but recorded in the report
% equal( [`SNAPSHOT` = A],stand_moist_soil,1),
more( [`SNAPSHOT` = A],stand_litter, 0),
more( [`SNAPSHOT` = A],stand_woody_debris,0)),
% a rule description string is the last argument
[`This rule determines a degree of confidence that a snapshot
of`,`a stand provides habitat for Ringed Salamander. `]).
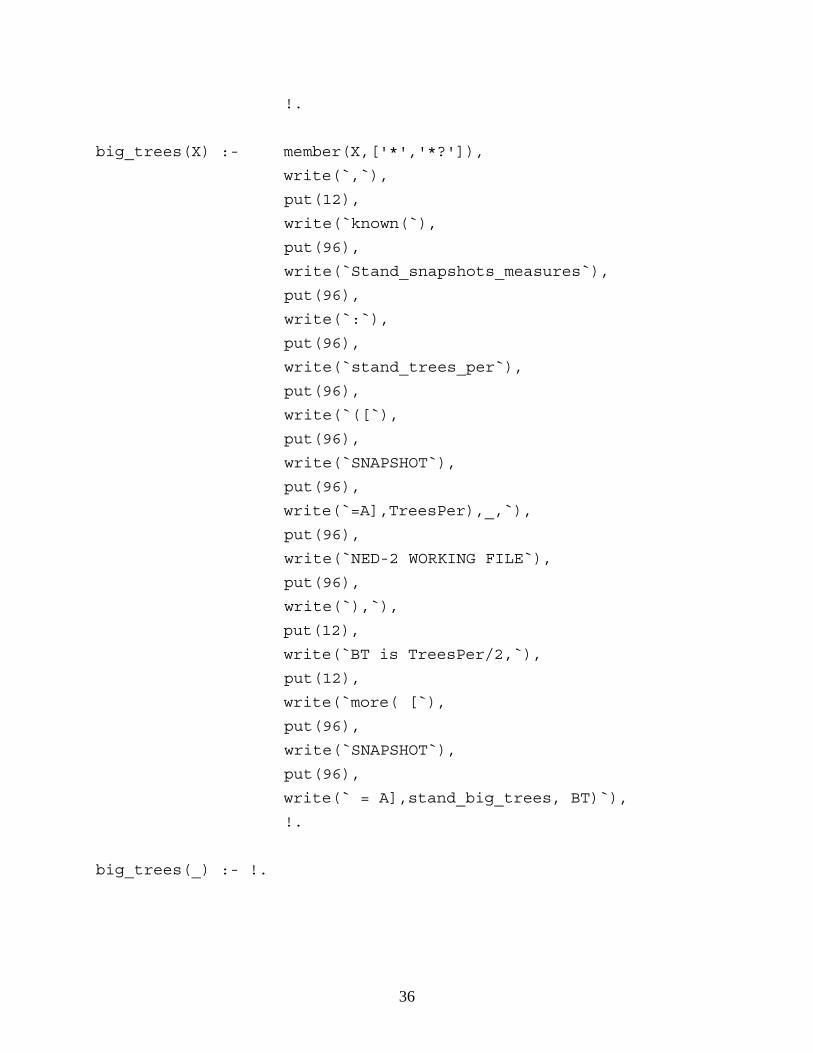
The following code extract from the bird_rules.pl program explains how the habitat
conditions are mapped to the individual DFCs:
% big_trees/1
% for nesting, perching, foraging and any combination of these,
% one big tree is enough to satisfy the requirement
% else, for all requirements (* and *?) more than or
% equal to 50% of the trees in the stand should be big trees
big_trees(X) :- member(X,['N','P','F','FP','NP']),
write(`,`),put(12),
write(`min([`),
put(96),
write(`SNAPSHOT`),
put(96),
write(` = A],stand_big_trees, 1)`),
36
!.
big_trees(X) :- member(X,['*','*?']),
write(`,`),
put(12),
write(`known(`),
put(96),
write(`Stand_snapshots_measures`),
put(96),
write(`:`),
put(96),
write(`stand_trees_per`),
put(96),
write(`([`),
put(96),
write(`SNAPSHOT`),
put(96),
write(`=A],TreesPer),_,`),
put(96),
write(`NED-2 WORKING FILE`),
put(96),
write(`),`),
put(12),
write(`BT is TreesPer/2,`),
put(12),
write(`more( [`),
put(96),
write(`SNAPSHOT`),
put(96),
write(` = A],stand_big_trees, BT)`),
!.
big_trees(_) :- !.

37
Big trees are a necessary habitat condition for birds. If big trees are needed for nesting,
perching, and foraging, one big tree in a stand satisfies the condition. Otherwise at least 50% of
the trees in the stand should be big trees. The first predicate defines the case in which one big
tree is needed in a stand. It checks if the entry in the habitat matrices is equal to ‘N’ for nesting,
‘P’ for perching, ‘F’ for foraging, ‘FP’ for foraging and perching or ‘NP’ for nesting and
perching. In this case it writes out a DFC with the following structure:
min([`SNAPSHOT`=A],stand_big_trees,1)
This indicates that one or more big trees in the stand satisfy the condition. If the first
predicate fails, the second predicate checks if big trees are needed for all kinds of requirements
(‘*’ or ‘*?’ entry). Then it outputs the following DFC structure:
known(`Stand_snapshots_measures`:``stand_trees_per`(
[`SNAPSHOT`=A],TreesPer),_,`NED-2 WORKING FILE`),
BT is TreesPer/2,
min([`SNAPSHOT`=A],stand_big_trees, BT),
The first two lines use the known/3 predicate to access the database and get the number of
trees in the stand. This number is divided by two to get the count of 50% of the trees in the stand.
Then the min relation checks if this or a higher number of trees are big trees.
4.4 INTEGRATION INTO NED-2
Integration into NED-2 was the final step in the development process. Several design
decision had to be made. Two problems were raised during the integration of the Southeastern
Wildlife Model. First, several possibilities for determining which wildlife species are loaded into

38
the goal selection screen were elaborated. Loading all species of the two models in the goal
selection screen allows the user to pick any species. This would include the species that do not
occur in the management unit according to the species ranges. Also, species with rules in two
models can be picked. The latter results in the second problem: the goal analysis agent would not
know which model to apply.
Loading species of one model at a time, determined either by the management unit state
(the southeastern states apply the Southeastern Wildlife Model; the northeastern states apply the
Northeastern Wildlife Model) or by loading species based on a user selected model would be one
alternative. Then the goal analysis agent would have exact information about which model to use
to evaluate a habitat goal. For the first approach each state needs to be assigned to a model. As
the models overlap for some states, this assignment becomes problematic. Even though our
forest experts compromised on an assignment without any overlap, one problem remains: the
user can still select species for a management unit state that do not occur in the state according to
its range data.
The final solution added a range column to the goals database. For each species the range
information was entered into the system. Hence, only the subset of species that actually occur in
the management unit state is loaded into the goal selection pane. If no state is entered the user is
asked to enter a state. If he does not enter a state no wildlife species will be loaded.
On the request of the forestry experts to get all possible information for a target species into
the report, the goal analysis agent was implemented to evaluate all rules found for a species, i.e.
rules from both models. Then, the report displays the different results with information about the
applied models. It is up to the user to decide which rule evaluation is suitable.
39
The following list summarizes the steps taken in integrating the Wildlife Model for the
Southeast:
1. Preparation of the species lists with common names, Latin names and Prolog names.
2. Identification of species in both models and decision-making on common spelling. This
involved modifying some rules in the Northeastern Wildlife Model.
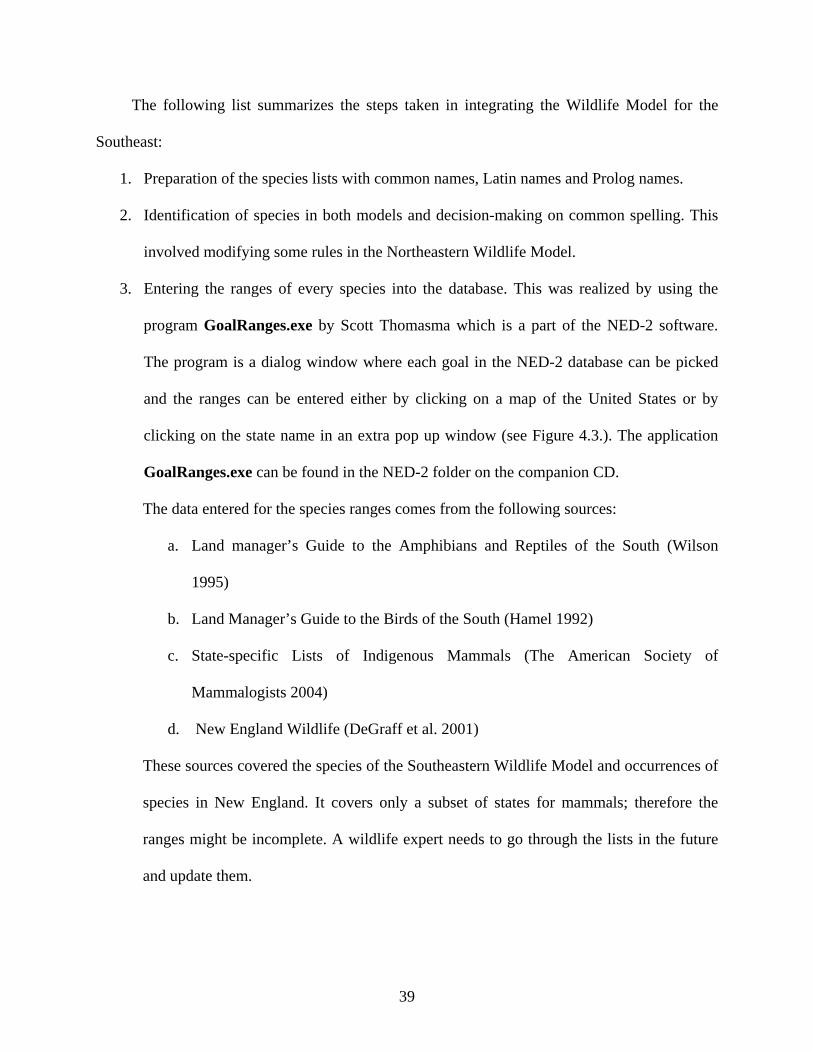
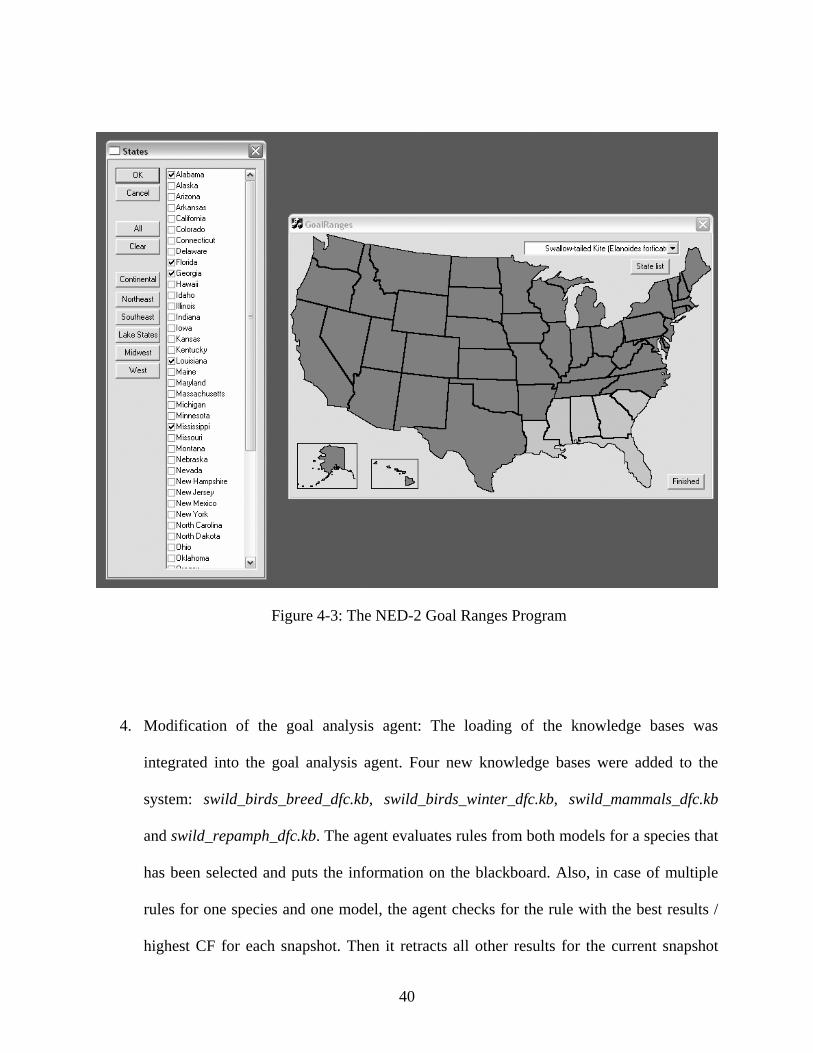
3. Entering the ranges of every species into the database. This was realized by using the
program GoalRanges.exe by Scott Thomasma which is a part of the NED-2 software.
The program is a dialog window where each goal in the NED-2 database can be picked
and the ranges can be entered either by clicking on a map of the United States or by
clicking on the state name in an extra pop up window (see Figure 4.3.). The application
GoalRanges.exe can be found in the NED-2 folder on the companion CD.
The data entered for the species ranges comes from the following sources:
a. Land manager’s Guide to the Amphibians and Reptiles of the South (Wilson
1995)
b. Land Manager’s Guide to the Birds of the South (Hamel 1992)
c. State-specific Lists of Indigenous Mammals (The American Society of
Mammalogists 2004)
d. New England Wildlife (DeGraff et al. 2001)
These sources covered the species of the Southeastern Wildlife Model and occurrences of
species in New England. It covers only a subset of states for mammals; therefore the
ranges might be incomplete. A wildlife expert needs to go through the lists in the future
and update them.
40
Figure 4-3: The NED-2 Goal Ranges Program
4. Modification of the goal analysis agent: The loading of the knowledge bases was
integrated into the goal analysis agent. Four new knowledge bases were added to the
system: swild_birds_breed_dfc.kb, swild_birds_winter_dfc.kb, swild_mammals_dfc.kb
and swild_repamph_dfc.kb. The agent evaluates rules from both models for a species that
has been selected and puts the information on the blackboard. Also, in case of multiple
rules for one species and one model, the agent checks for the rule with the best results /
highest CF for each snapshot. Then it retracts all other results for the current snapshot

41
from the blackboard. Multiple rules for one species and model are rules that represent
different habitat levels (optimal, suitable and marginal). Hence, the report agent does not
need to filter out the best result later. The inference engine stores the RuleName with
the rule result on the blackboard, so that the report agent will have exact information on
which rule has been used.
5. Implementation of wildlife reports (see Chapter 5).

42
CHAPTER 5
REPORT GENERATION
5.1 GENERATING REPORTS
In NED-2, one way to look at the data entered, analyzed, and simulated is by generating a
set of reports. There are three groups of reports:
1. Plan Comparison Reports
2. Management Unit Level Reports
3. Stand Level Reports
There are seven plan comparison reports, a total of 23 management unit level reports and
29 stand level reports in NED-2. Report generation is carried out by three different agents: the
planning agent, the report analyzer agent, and the report writer agent.
The management unit level reports include the goal analysis reports. Additionally, to the
usual report generation, the goal analysis reports require the goal analysis to be executed. This
adds two more agents to the process: the goal analysis agent and the goal report agent. How the
agents interact with each other will be demonstrated later in this chapter.
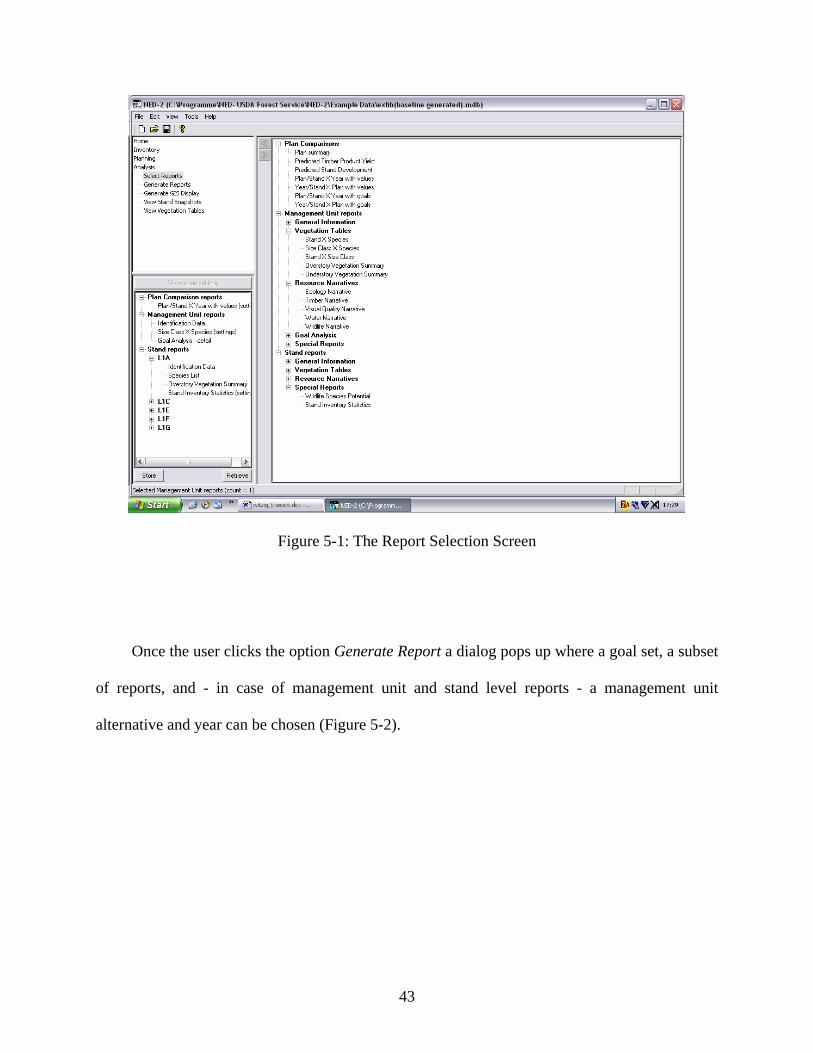
To generate a report the user picks one of the reports in the report selection screen (Figure
5-1).
43
Figure 5-1: The Report Selection Screen
Once the user clicks the option Generate Report a dialog pops up where a goal set, a subset
of reports, and - in case of management unit and stand level reports - a management unit
alternative and year can be chosen (Figure 5-2).

44
Figure 5-2: The Report Selection Dialog
45
Before the system starts the report generation, the user has the option to chose a destination
folder for the reports. The default folder is the Reports folder in NED-2 with the following
structure:
Reports/Management Unit Name/Management Unit Alternative – Year
Once the reports have been generated, the report writer agent opens the default browser
with the main HTML pages consisting of two frames: a table of contents and the activate report.
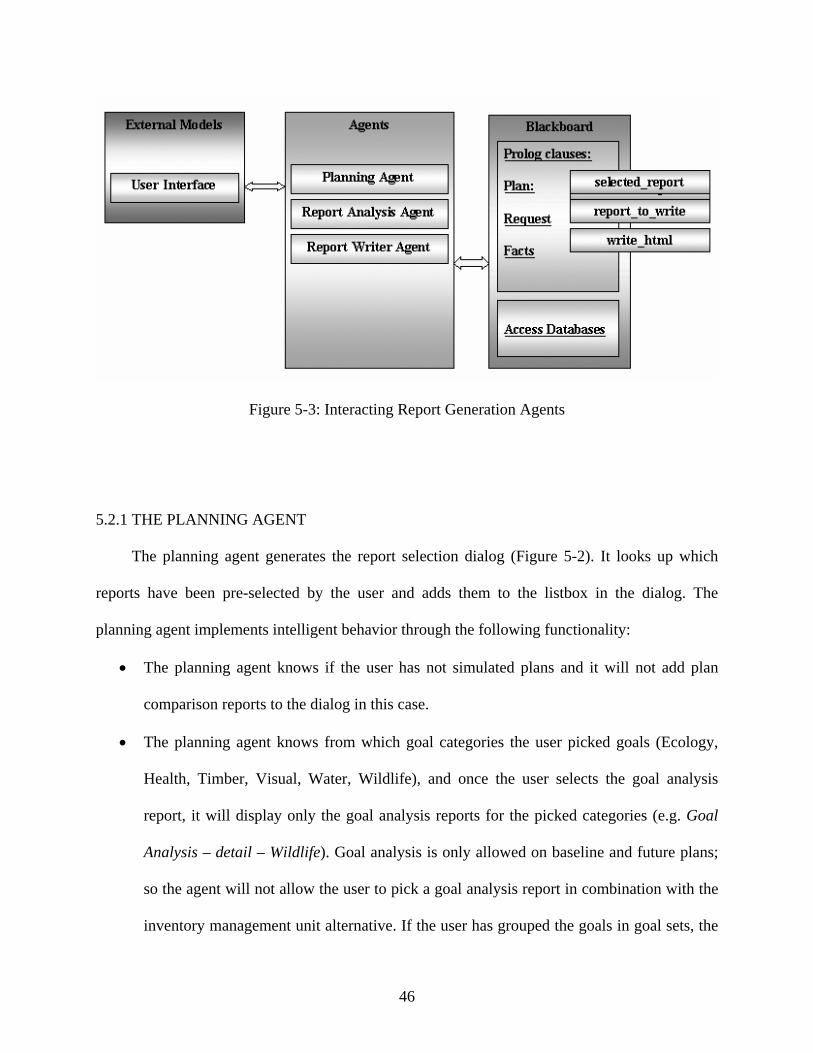
5.2 THE REPORT GENERATION AGENTS
Each of the three report generation agents performs a different subtask in the report
generation process. Once a user has picked a set of plans, the planning agent generates a plan to
be put on the blackboard that outlines the steps for the report generation. With the
selected_report request the planning agent communicates which reports have been selected. The
last element of the plan is called write_html and takes care of generating the table of contents and
opening up the web browser. The report analysis agent responds to the selected_report request
and calls the appropriate predicates to generate the report data. Then, it outputs a request on the
blackboard for the report to be written (report_to_write). The Report Writer Agent has two
tasks: (1) It reacts to the request report_to_write for writing a selected report and (2) generates
the main page with the table of contents (write_html request). The following diagram visualizes
this process:
46
Figure 5-3: Interacting Report Generation Agents
5.2.1 THE PLANNING AGENT
The planning agent generates the report selection dialog (Figure 5-2). It looks up which
reports have been pre-selected by the user and adds them to the listbox in the dialog. The
planning agent implements intelligent behavior through the following functionality:
• The planning agent knows if the user has not simulated plans and it will not add plan
comparison reports to the dialog in this case.
• The planning agent knows from which goal categories the user picked goals (Ecology,
Health, Timber, Visual, Water, Wildlife), and once the user selects the goal analysis
report, it will display only the goal analysis reports for the picked categories (e.g. Goal
Analysis – detail – Wildlife). Goal analysis is only allowed on baseline and future plans;
so the agent will not allow the user to pick a goal analysis report in combination with the
inventory management unit alternative. If the user has grouped the goals in goal sets, the

47
user can select a goal set from the corresponding combobox. Again, the planning agent
knows which of the selected goals and their categories belong to the selected goal set and
will display only those reports in the listbox. If a user changes the goal set, the planning
agent updates the listbox.
• The planning agent knows if only inventory data is available, if baseline data has been
generated, or if plans have been simulated. In the case of plans it knows the year for
which the plan has been simulated. According to this information it allows the user to
pick a management unit alternative and a year.
• The planning agent has the same intelligence as the report writer agent to parse
specification strings that specify a report. Specification strings store details that a user
selected when choosing the report and are written in parenthesis behind the report in the
listbox.
• The planning agent filters out stand level reports for which no data has been simulated.
This is essential if plans are simulated for selected stands only.
• The planning agent knows which folder the reports are written to and offers a default
folder. It ensures that the reports are written to the correct folder and warns the user about
overwriting reports.
After the user has selected a set of reports and a destination folder, the planning agent
generates requests of the following structure:
selected_report([+ID,+STAND,+REPORT_ID,+SPECS,+VIEW])
The ID is a display rank according to which each report is generated and displayed. The
STAND is the picked stand for a stand level report and –1 for a management unit level or plan
48
comparison report. The REPORT_ID is the Prolog name of the report, the SPECS are the
specifications for a report and the VIEW is a list of snapshots representing the management unit
alternative and year picked. For plan comparison reports this is a list of all snapshots
representing the baseline and simulated plans. In case of a goal analysis report, the planning
agent adds a request for goal analysis on the blackboard.
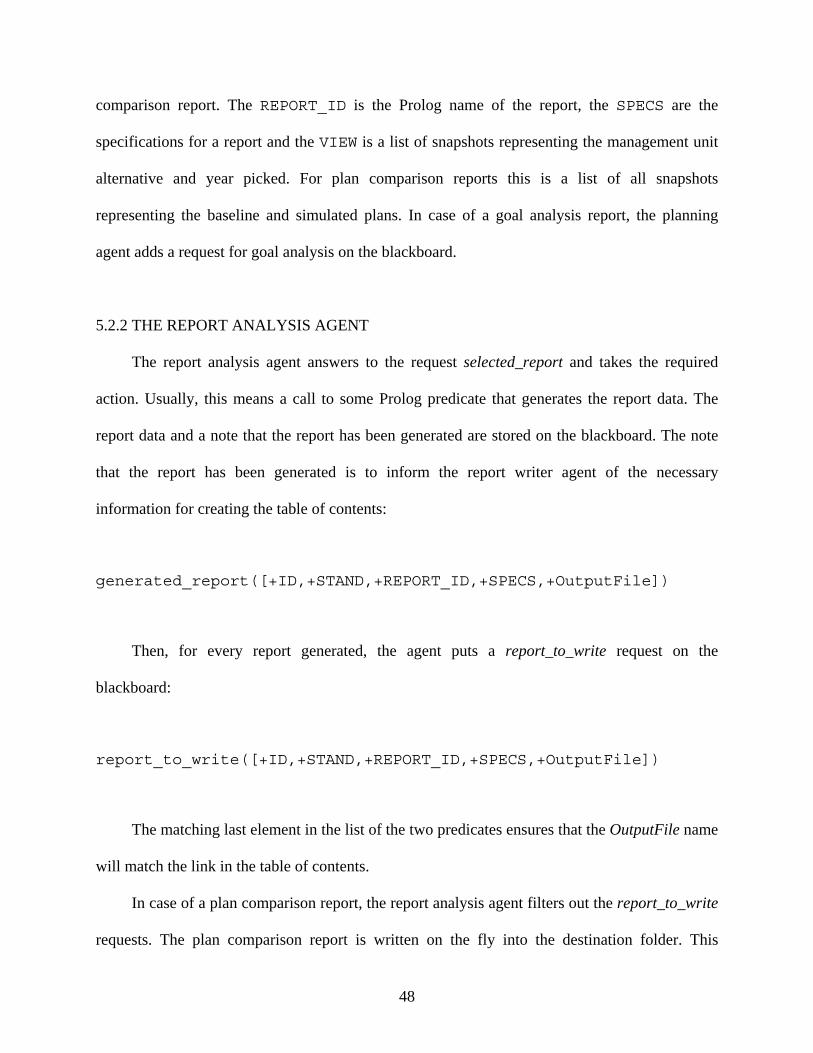
5.2.2 THE REPORT ANALYSIS AGENT
The report analysis agent answers to the request selected_report and takes the required
action. Usually, this means a call to some Prolog predicate that generates the report data. The
report data and a note that the report has been generated are stored on the blackboard. The note
that the report has been generated is to inform the report writer agent of the necessary
information for creating the table of contents:
generated_report([+ID,+STAND,+REPORT_ID,+SPECS,+OutputFile])
Then, for every report generated, the agent puts a report_to_write request on the
blackboard:
report_to_write([+ID,+STAND,+REPORT_ID,+SPECS,+OutputFile])
The matching last element in the list of the two predicates ensures that the OutputFile name
will match the link in the table of contents.
In case of a plan comparison report, the report analysis agent filters out the report_to_write
requests. The plan comparison report is written on the fly into the destination folder. This
49
modification had to be made while testing the plan comparison reports on the dataset
JordanCreek.mdb. The dataset consist of 500 stands which generated strings too large to be
stored. Accordingly the information was written to the output file immediately.
The goal analysis reports used to be generated by a separate agent, called analysis report
agent. Now, goal analysis report generation has been adapted to use the report analyzer agent
(see 5.3).
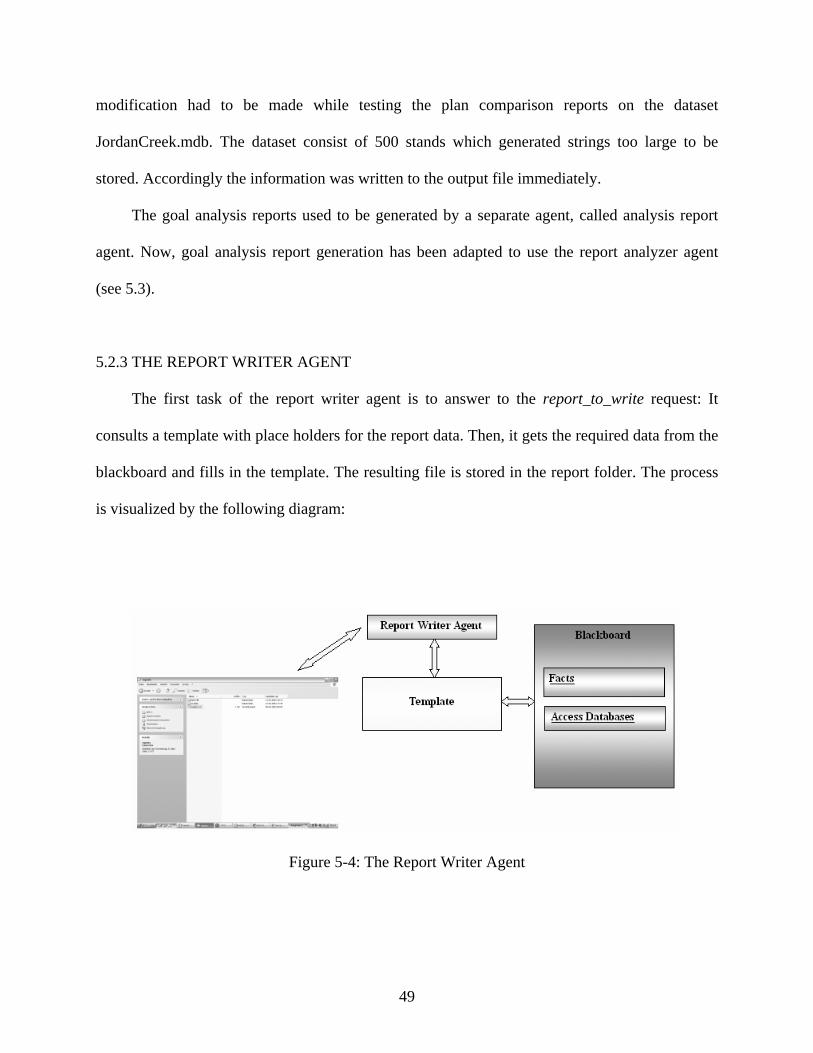
5.2.3 THE REPORT WRITER AGENT
The first task of the report writer agent is to answer to the report_to_write request: It
consults a template with place holders for the report data. Then, it gets the required data from the
blackboard and fills in the template. The resulting file is stored in the report folder. The process
is visualized by the following diagram:
Figure 5-4: The Report Writer Agent
50
The second task of the report writer agent is to generate and open up the table of contents
in the default browser. This happens in reply to the write_html request.
5.3 GOAL ANALYSIS REPORT GENERATION
The goal analysis reports are considered to be the exception in the report generation
process. Usually, the reports consist of several interlinked hypertext documents. The goal
analysis report generation has recently been revised.
5.3.1 THE OLD DESIGN AND ITS DOWNSIDES
The forest manager used to have two options to generate goal analysis reports: management
unit goal analysis reports and stand level goal analysis reports.
If the report planning agent detected a goal analysis report, it would get all selected goals
from the blackboard and add an individual goal report for each goal in the report selection
listbox. Then the user could choose a subset of the goal analysis reports to be generated. For
every selected goal analysis report, the report planning agent put a goal analysis request on the
blackboard. To generate the report, the planning agent created a request directed to a separate
agent, called the analysis report agent.
The goal analysis agent would respond to the request and perform the analysis. Afterwards,
the analysis report agent would create the corresponding report. The agent used to look up which
management unit level reports and stand level reports had been selected and build one
summarizing goal analysis report interlinked with the selected reports.
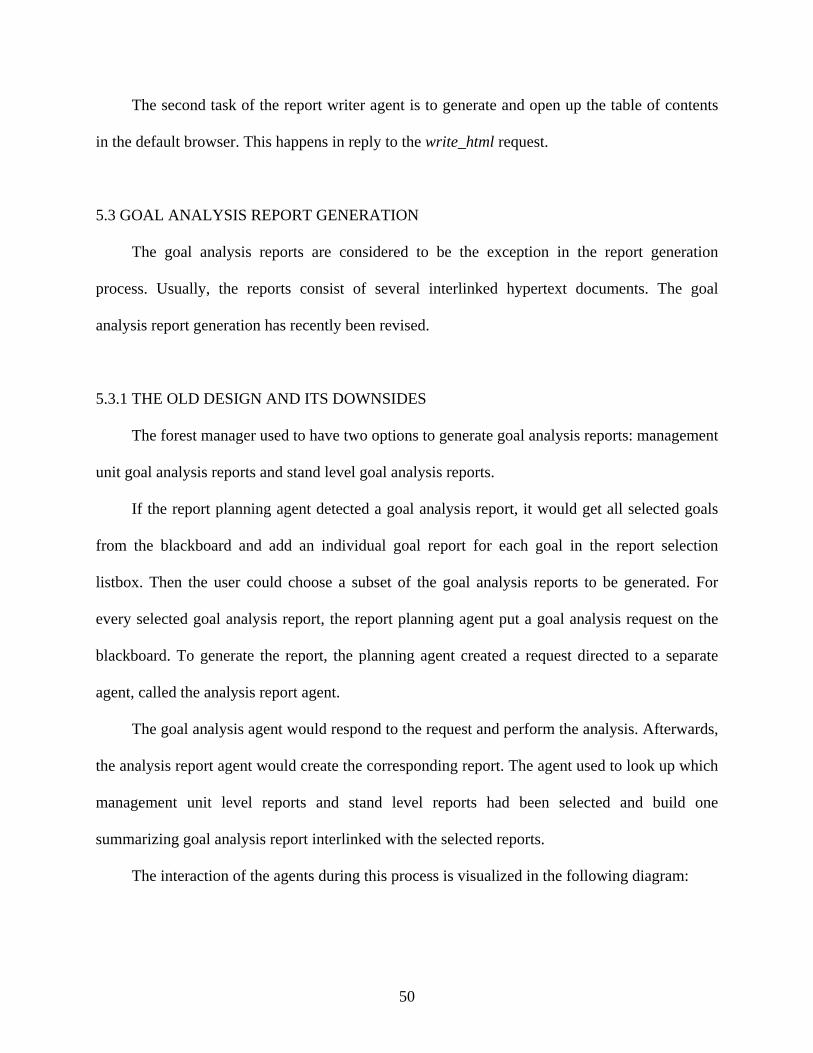
The interaction of the agents during this process is visualized in the following diagram:
51
Figure 5-5: The Goal Analysis Report Generation – Old Design
The process of outputting the goal analysis report by the analysis report agent and the
report structure is illustrated in Figure 5-6.
Two problems occurred with this design. From the programming point of view, goal
analysis report generation represents an exception to the usual report generation process. The
planning agent needs to handle this exception when building the plan. Also, the efficient design
of using a template to generate the reports has not been considered in the process.
From the report design perspective this implementation is also inefficient. All six goal
categories are generalized into one goal analysis report generation routine. The recently
implemented Health Model does not fit into this generalization. The Health Model required a
report of a completely different format. The Timber report has its own definition for how to
evaluate a management unit goal (see 3.3). Hence, it needed to be designed individually as well.

52
Figure 5-6: The Analysis Report Agent
Finally, the integration of the Southeastern Wildlife Model required a redesign of the
Wildlife reports. Rather than handling all these reports as exceptions, a new structure for
generating the goal analysis reports was favored.
5.3.2 THE NEW DESIGN
The two main objectives for the redesign of the goal analysis agents were (1) to use the
report generation agents and templates to generate the main report pages and (2) to separate the
goal analysis reports from each other according to their goal categories.
The following diagram illustrates the new design:

53
Figure 5-7: The Goal Analysis Report Generation – New Design
The analysis report agent has been removed from the system. The user picks only the goal
analysis report on a management unit level. The stand level information has been replaced by an
additional table in the management unit level report.
The report planning agent looks up which goal categories have been selected and then adds
the corresponding report to the listbox in the report selection dialog:
1. Goal Analysis for Wildlife
2. Goal Analysis for Timber
3. Goal Analysis for Ecology
4. Goal Analysis for Visual
5. Goal Analysis for Health
6. Goal Analysis for Water

54
Each of the reports is treated individually. First, the report analyzer agent and the report
writer agent generate a top level report by applying a template. For the Health and the Timber
reports the process is finished here. The Health report is a one page report only. The Timber
report applies to one single goal since only one Timber goal can be selected for a management
unit.
The top level reports for the other goal categories have links to the individual goal pages.
These individual goal pages are generated by a new agent: the goal report agent. Each of the
categories implements its own goal report agent. When generating the links on the top level
report, the report analyzer agent leaves a request for each goal on the blackboard. Now, the goal
report agent can answer to the request and output the individual goal report.
The process is visualized in the following diagram:
Figure 5-8: The Goal Report Agent

55
5.4 THE WILDLIFE GOAL ANALYSIS REPORTS
The Wildlife goal analysis reports display the data from the two wildlife models. The top
level page displays the following information:
1. List of Wildlife goals chosen
2. Summary Analysis Table: including all selected Wildlife goals, their management unit
goal status, the number of stands in the management unit, and how many stands fully
satisfied, minimally satisfied, nearly satisfied, and failed the goal.
3. Stand Summary Table: including the goal status for every goal and stand (the goal status
is indicated by an icon.)
APPENDIX E shows an example for a top level Wildlife report.
All possible goals are displayed in the tables. In the case of a species that has rules in both
models, the table gets two entries: one for the Southeastern Wildlife Model and one for the
Northeastern Wildlife Model. Also, if a bird from the Southeastern Model is picked it might get
up to two entries: one for breeding habitat and one for wintering habitat. The goals in the tables
are linked with the individual goal reports.
The individual goal reports for the Northeast and the Southeast have the same basic
structure:
1. An introduction explains the model and the report.
2. Conditions for the rules associated with this goal are displayed.
3. DFC table: listing all DFCs and their actual value. The stand in the table is colored
according to its status: fully satisfied is green, minimally satisfied is blue, nearly satisfied
is orange, and failed is red6.
6 The colors might have to be revised in the future to consider red-green and similar color blindness.

56
4. Summary Analysis: Information for the goal and the management unit in terms of
number of stands and management unit area.
The Southeastern Wildlife Model adds a paragraph at the end of each report. This
paragraph describes the habitat conditions the species uses, but which are not essential in the
goal evaluation or which have no equivalent NED-2 variable yet.
The Southeastern Wildlife Model also needs to consider the case of multiple rules applied
to one goal. If a species has more than one rule, i.e. a rule for optimal habitat, a rule for suitable
habitat, and a rule for marginal habitat, it can happen that different snapshots are evaluated by
different rules. For every snapshot the goal analysis agent puts the best outcome with the
corresponding rule on the blackboard. Then, the goal report agent informs the user about which
rule has been applied for which stand.
APPENDIX E shows two example reports from the Southeastern Wildlife Model for the
Gray Myotis and the Evening Grosbeak, generated on the NED-2 test dataset exlib.mdb for the
baseline year. The original HTML reports can be reviewed on the companion CD.
To get the goal status information, the report generation agents and the goal report agents
use the predicate fact/4 that is stored on the blackboard:
fact(+RulePred,+CF,+RuleName,+TimeStamp)
The RulePred is the rule conclusion predicate with the snapshot and species information
as arguments, e.g.

57
breed_habitat_available([`SNAPSHOT`=6,species(turkey_vulture)],
passed).
The CF is the output from the “fuzzy” inference engine after the goal analysis. The
RuleName is the name of the rule that helps identifying the correct rule for the rule parser (in
the case of multiple rules for one species). The last argument is a time stamp.
The rule parser recognizes the rules and outputs them in a more readable format for the
user. Also, it parses the list of DFCs used in the rules to be used in the DFC table.

58
CHAPTER 6
THE WILDLIFE MODEL IN APPLICATION
Feedback from the user will be essential to improve and extend the system. Concerning the
Wildlife Model, the following questions will be particularly interesting.
Observing how the user applies NED-2 and the information gained through the system will
help to improve the model. Currently, we assume that a user performs goal analysis on a current
year and on a year in the future for which a plan is generated. By comparing the current and the
future year, the user can draw conclusions on management actions.
Using the model in terms of finding the correct management action according to goals
might not be the only possible application for the system. During the development of the
Wildlife Model for the Southeast, the concern was raised that the data represents goals for
providing habitat for a species, not goals for the presence of a species. Contrariwise, plantations
that did not qualify for wild turkey habitat, have been found to be crammed full of wild turkeys.
So the Wildlife Model in application will stimulate the research in determining habitat for the
species and will test the assumptions and underlying logic on which wildlife researchers base
their habitat knowledge.
59
CHAPTER 7
FUTURE WORK
This chapter suggests extensions and future work on the resource management components
of NED-2.
Currently, the resource management goals are restricted to six categories. This list might be
extended by other models. However, to ensure that a user can pick the goal he really wants to
select, the user would need the possibility to define his own goals. By providing an interface that
allows the user to generate DFC rules and knowledge bases, new goals could be defined and old
goals could be redefined based on the user’s expert knowledge and area-specific data. Obviously,
this would involve major revisions in the NED-2 system.
A more urgent extension would be the development of a management unit level goal
analysis that is adjusted to each goal category. Except for a few Visual stand level goals, NED-2
offers the evaluation of management unit goals. For most of the goals a bigger area like a whole
management unit is more likely to pass a goal than an individual stand. The Timber goal analysis
executes a management level goal analysis (on the results of the stand level goal analysis): A
management unit level goal is defined by (1) balanced size classes in the management unit and
(2) 65% of the area of the management unit satisfies the stand level goal analysis. The other goal
categories do not implement such a management unit analysis. They just report a management
unit to pass (fail) a goal if 100% of the management unit area passes (fails) the stand level goal.
In any other case the management unit goal status is called not fully. The available sources do not

60
provide a management unit level goal analysis for the Wildlife Model. Experts need to define
what such an analysis might look like. The minimal tract size in the bird habitat matrices might
be considered in the process.
The next planned extension is a Wildlife Model for the Michigan area. The program
MIWild developed by the DNR (Department of Natural Resources) in Michigan will be used to
develop the background knowledge.
Also planned for the near future is a model for game species. The model could apply a
more detailed rule system to give a better habitat analysis. Such specific rules need to be
researched, but a starting point could be the wild turkey habitat rules developed by Craig Harper
at the University of Tennessee at Knoxville (see APPENDIX F).
Under development is the addition of ten new variables to NED-2 in the scope of the new
Wildlife Model. The new variables have been discussed during the development of the Wildlife
Model, but agreement about the specifications has not been reached. The knowledge bases for
the Wildlife species do implement these variables. For the time being the variables have been
commented out of the code. The user is informed about their importance in the reports.
APPENDIX G lists the variables under construction for future reference.

61
BIBLIOGRAPHY
Cleveland, H.M.; Finley, J.C. (1998). Assessing Forest Wildlife diversity in Pennsylvania.
Northern Journal of Applied Forestry. Volume 15, Number 2: 77-85.
DeGraff, Richard M.; Yamasaki, Mariko (2001). New England Wildlife. University Press of New
England. Hanover.
Epimistic Website (2004). Knowledge Acquisition. Retrieved September 20, 2004 from:
http://www.epistemics.co.uk/.
Eyre, F. H., Editor (1980). Forest Cover Types of the United States and Canada. Society of
American Foresters. Washington. DC.
Glende, Astrid (2004) The NED-2 Forest Ecosystem Management DSS: The Integration of
Growth and Yield Models. Master Thesis. Artificial Intelligence Center. University of
Georgia. Athens. GA.
Hamel, Paul B. (1992). Land Manager’s Guide to the Birds of the South. The Nature
Conservancy. Chapel Hill. North Carolina.
Maier, F.W. (2002). Notes on a Blackboard: Recent work on NED-2. Master Thesis, Artificial
Intelligence Center, University of Georgia, Athens, GA.
Marquis, David A.; Twery, Mark; Kollasch, Pete (1997). Forest Types in the Northeast.

62
Nute, D.; Potter, W. D.; Cheng, Z.; Dass, M.; Glende, A.; Knopp, P.; Maier, F.; Rauscher, H. M.;
Routh, C.; Thomasma, S.; Twery, M.; Uchiyama, H.; Wang, J.; Witzig, S. (2003a). Adding
New Agents and Models to the NED-2 Forest Management System.
Nute, D.; Potter, W. D.; Dass, M.; Glende, A.; Knopp, P.; Maier, F.; Rauscher, M. H.;
Thomasma, S.; Twery, M.; Uchiyama, H.; Wang, J. (2003b). An Agent Architecture for an
Integrated Forest Ecosystem Management Decision Support System. Proceedings: The
2003 IUFRO International Conference on Decision Support for Multiple Purpose Forestry,
Vienna, Austria, April 2003.
Oil and Gas Commission Website (2004). Fish and Wildlife Timing Windows for Oil and Gas
Exploration and Development in Northeast British Columbia. Retrieved September 20,
2004 from: http://www.ogc.gov.bc.ca/arb/arb_print.asp?aoid=93.
Routh, Cy (2004). The NED-2 Forest Ecosystem Management DSS: The Integration of wildfire
risk and GIS agents. Master Thesis, Artificial Intelligence Center, University of Georgia,
Athens, GA.
Shalfield, Rebecca (2002). LPA Win-Prolog 4.300 User Guide.
Stravers, Jon W.; McKay, Kelly J. (1994). Status of the red-shouldered hawk within the upper
Mississippi river valley and management guidelines for nesting habitat. Midwest Raptor
Research Fund. U.S. Fish and Wildlife Service. Upper Mississippi River National Wildlife
and Fish refuge. Refuge Complex Office. Wiona. Mn. Retrieved September 20, 2004 from:
http://www.mvr.usace.army.mil/forestry/Publications/RSH%20management%20guidelines
%20for%20nesting%20habitat.doc.
Sun, Shulei (2001). Wildlife Habitat Management in NED-2. Master Thesis. Artificial
Intelligence Center, University of Georgia, Athens, GA.

63
The Santa Cruz Predatory Bird Research Group (2004). Section 3 – Legal Status. Long Marine
Lab. University of California. Santa Cruz. Retrieved September 20, 2004 from:
http://www2.ucsc.edu/scpbrg/section3.htm.
Twery, M. J.; Knopp, P. D.; Thomasma, S. A.; Rauscher, M. H.; Nute, D. E.; Potter, W. D.;
Maier, F.; Wang, J.; Dass, M.; Uchiyama, H.; Glende, A.; Hoffman, R. E. (2003). NED-2:
A decision support system for integrated forest ecosystem management. Proceedings: The
2003 IUFRO International Conference on Decision Support for Multiple Purpose Forestry,
Vienna, Austria, April 2003.
Wilson, Dr. Lawrence A. (1995). Land Manager’s Guide to the Amphibians and Reptiles in the
South. The Nature Conservancy. Southeastern Region. Chapel Hill. North Carolina.
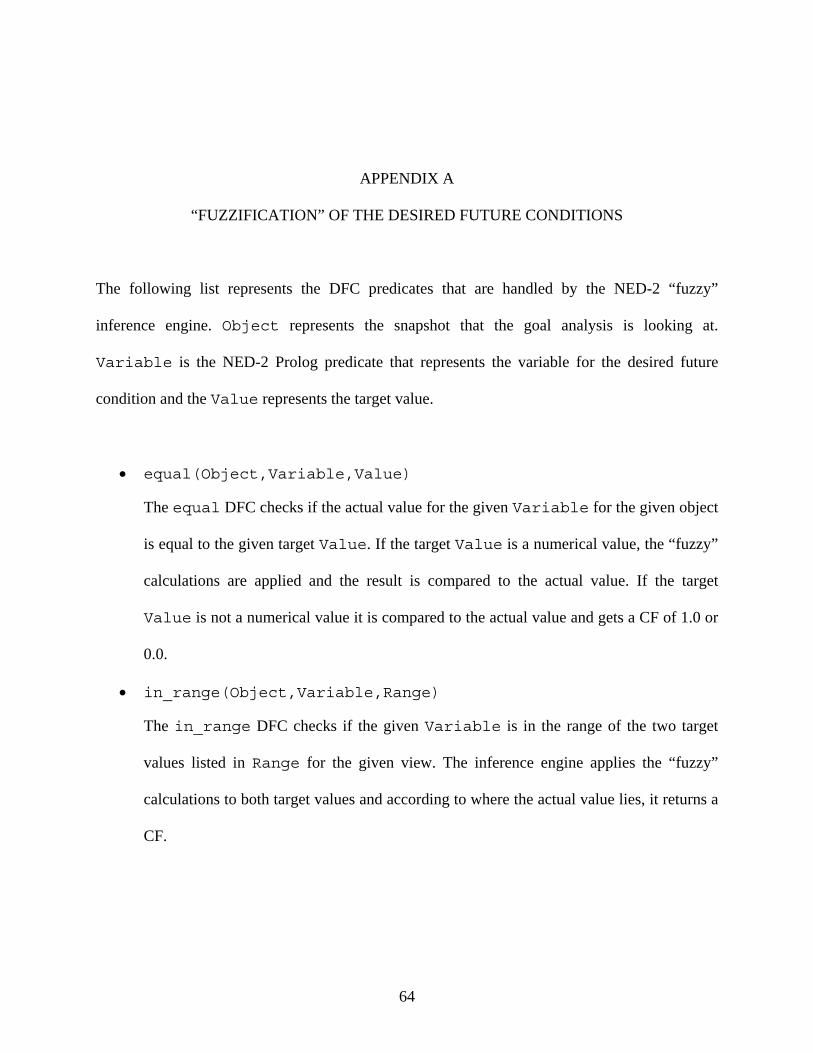
64
APPENDIX A
“FUZZIFICATION” OF THE DESIRED FUTURE CONDITIONS
The following list represents the DFC predicates that are handled by the NED-2 “fuzzy”
inference engine. Object represents the snapshot that the goal analysis is looking at.
Variable is the NED-2 Prolog predicate that represents the variable for the desired future
condition and the Value represents the target value.
• equal(Object,Variable,Value)
The equal DFC checks if the actual value for the given Variable for the given object
is equal to the given target Value. If the target Value is a numerical value, the “fuzzy”
calculations are applied and the result is compared to the actual value. If the target
Value is not a numerical value it is compared to the actual value and gets a CF of 1.0 or
0.0.
• in_range(Object,Variable,Range)
The in_range DFC checks if the given Variable is in the range of the two target
values listed in Range for the given view. The inference engine applies the “fuzzy”
calculations to both target values and according to where the actual value lies, it returns a
CF.
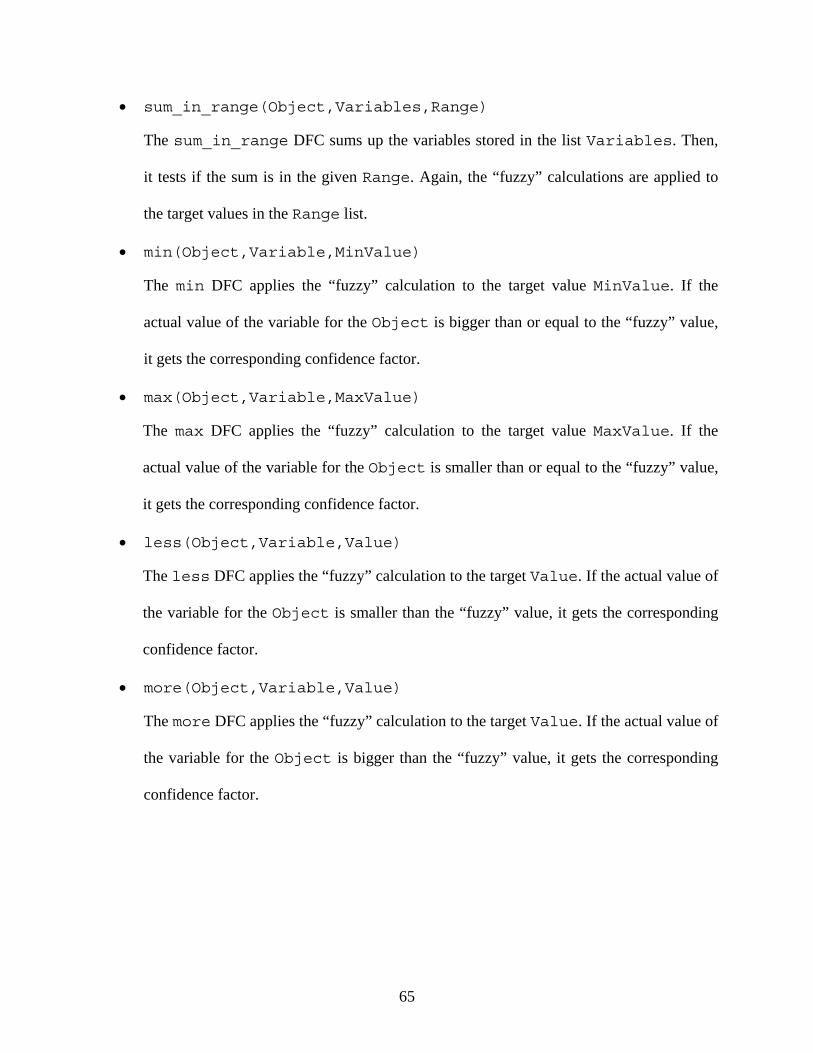
65
• sum_in_range(Object,Variables,Range)
The sum_in_range DFC sums up the variables stored in the list Variables. Then,
it tests if the sum is in the given Range. Again, the “fuzzy” calculations are applied to
the target values in the Range list.
• min(Object,Variable,MinValue)
The min DFC applies the “fuzzy” calculation to the target value MinValue. If the
actual value of the variable for the Object is bigger than or equal to the “fuzzy” value,
it gets the corresponding confidence factor.
• max(Object,Variable,MaxValue)
The max DFC applies the “fuzzy” calculation to the target value MaxValue. If the
actual value of the variable for the Object is smaller than or equal to the “fuzzy” value,
it gets the corresponding confidence factor.
• less(Object,Variable,Value)
The less DFC applies the “fuzzy” calculation to the target Value. If the actual value of
the variable for the Object is smaller than the “fuzzy” value, it gets the corresponding
confidence factor.
• more(Object,Variable,Value)
The more DFC applies the “fuzzy” calculation to the target Value. If the actual value of
the variable for the Object is bigger than the “fuzzy” value, it gets the corresponding
confidence factor.
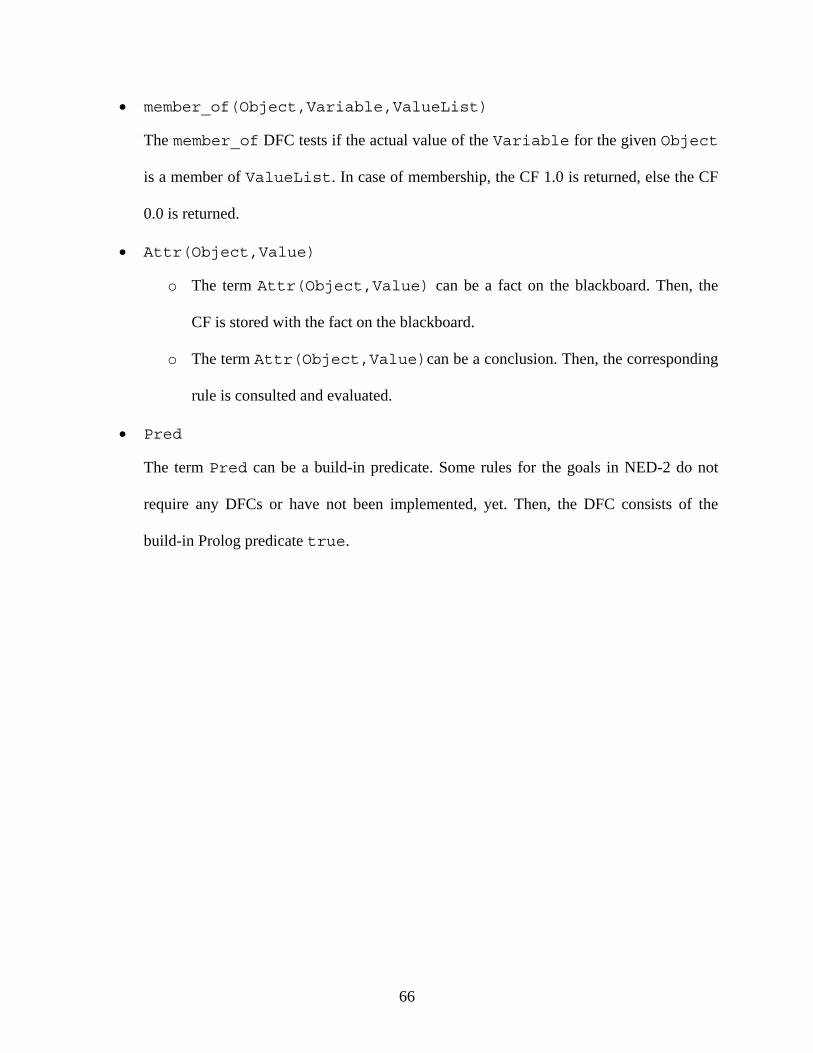
66
• member_of(Object,Variable,ValueList)
The member_of DFC tests if the actual value of the Variable for the given Object
is a member of ValueList. In case of membership, the CF 1.0 is returned, else the CF
0.0 is returned.
• Attr(Object,Value)
o The term Attr(Object,Value) can be a fact on the blackboard. Then, the
CF is stored with the fact on the blackboard.
o The term Attr(Object,Value)can be a conclusion. Then, the corresponding
rule is consulted and evaluated.
• Pred
The term Pred can be a build-in predicate. Some rules for the goals in NED-2 do not
require any DFCs or have not been implemented, yet. Then, the DFC consists of the
build-in Prolog predicate true.

67
APPENDIX B
NED-2 VARIABLE DOCUMENTATIONS
1. Size class
Variable name Size class
Level Stand
Table Stand_snapshots_measures
ID (table column)
stand_size_class
Description Stand size class
Column heading
Size class
Row heading Size class
Variable type Category
Validation rule "regeneration" Or "sapling" Or "pole" Or "small sawtimber" Or "large sawtimber" Or Is Null
Validation text Size class must be 1="regeneration", 2="sapling", 3="pole", 4="small sawtimber" or 5="large sawtimber"
Valid codes 1 = regeneration 2 = sapling 3 = pole 4 = small sawtimber 5 = large sawtimber
Needed No
Editable No
Tallied No
Defaulted No
Calculated Yes

68
Variables used in calculation: Medial dbh
2. Land cover type
Variable name
Land cover type
Level Stand
Table Stand_snapshots_measures
ID (table column)
stand_cover_type
Description Land cover type of stand
Column heading
Land cover
Row heading
Land cover type
Variable type
Category
Validation rule
"Urban and built-up land" Or "Agricultural land" Or "Brush or transitional between open and forested" Or "Forest" Or "Water" Or "Wetlands (not including open water; palustrine wetlands only)" Or "Barren land" Or "Tundra" Or "Permanent snow and ice" Or "Residential" Or "Commercial, Services & Institutional" Or "Industrial" Or "Transportation, Communication and Utilities" Or "Industrial/Commercial complexes" Or "Mixed urban or built-up land" Or "Other urban or built-up land" Or "Cropland and pasture" Or "Orchards, bush fruits, vineyards, nurseries & ornamental horticulture" Or "Confined feeding operations" Or "Other agricultural land" Or "primarily herbaceous, non woody vegetation (75% or more cover)" Or "primarily shrub/brush (75% or more cover)" Or "mixed herbaceous and shrub/brush" Or "Broadleaf forest" Or "Coniferous forest" Or "Mixed Coniferous/Broadleaf forest" Or "Rivers, canals and other waterways" Or "Lakes and ponds" Or "Reservoirs (and other artificial water surfaces)" Or "Bays/Estuaries" Or "Aquatic bed" Or "Moss/Lichen (includes bogs and fens)" Or "Emergent wetland" Or "Scrub-Shrub wetland" Or "Forested wetland" Or "Salt flats" Or "Beaches and river banks" Or "Sandy areas (non-beaches)" Or

69
"Bare/Exposed rock" Or "Strip mines, Quarries and Gravel pits" Or "Transitional" Or "Mixed barren land" Or "Shrub and brush" Or "Herbaceous" Or "Bare Ground" Or "Wet" Or "Mixed" Or Is Null
Validation text
Land cover type must be 1="Urban and built-up land", 2="Agricultural land", 3="Brush or transitional between open and forested", 4="Forest", 5="Water", 6="Wetlands (not including open water; palustrine wetlands only)", 7="Barren land", 8="Tundra", 9="Permanent snow and ice", 11="Residential", 12="Commercial, Services & Institutional", 13="Industrial", 14="Transportation, Communication and Utilities", 15="Industrial/Commercial complexes", 16="Mixed urban or built-up land", 17="Other urban or built-up land", 21="Cropland and pasture", 22="Orchards, bush fruits, vineyards, nurseries & ornamental horticulture", 23="Confined feeding operations", 24="Other agricultural land", 31="primarily herbaceous, non woody vegetation (75% or more cover)", 32="primarily shrub/brush (75% or more cover)", 33="mixed herbaceous and shrub/brush", 41="Broadleaf forest", 42="Coniferous forest", 43="Mixed Coniferous/Broadleaf forest", 51="Rivers, canals and other waterways", 52="Lakes and ponds", 53="Reservoirs (and other artificial water surfaces)", 54="Bays/Estuaries", 61="Aquatic bed", 62="Moss/Lichen (includes bogs and fens)", 63="Emergent wetland", 64="Scrub-Shrub wetland", 65="Forested wetland", 71="Salt flats", 72="Beaches and river banks", 73="Sandy areas (non-beaches)", 74="Bare/Exposed rock", 75="Strip mines, Quarries and Gravel pits", 76="Transitional", 77="Mixed barren land", 81="Shrub and brush", 82="Herbaceous", 83="Bare Ground", 84="Wet" or 85="Mixed"
Valid codes
1 = Urban and built-up land 2 = Agricultural land 3 = Brush or transitional between open and forested 4 = Forest 5 = Water 6 = Wetlands (not including open water; palustrine wetlands only) 7 = Barren land 8 = Tundra 9 = Permanent snow and ice 11 = Residential 12 = Commercial, Services & Institutional 13 = Industrial 14 = Transportation, Communication and Utilities 15 = Industrial/Commercial complexes 16 = Mixed urban or built-up land 17 = Other urban or built-up land 21 = Cropland and pasture 22 = Orchards, bush fruits, vineyards, nurseries & ornamental horticulture 23 = Confined feeding operations 24 = Other agricultural land 31 = primarily herbaceous, non woody vegetation (75% or more cover) 32 = primarily shrub/brush (75% or more cover) 33 = mixed herbaceous and shrub/brush 41 = Broadleaf forest 42 = Coniferous forest 43 = Mixed Coniferous/Broadleaf forest 51 = Rivers, canals and other waterways 52 = Lakes and ponds 53 = Reservoirs (and other artificial water surfaces) 54 = Bays/Estuaries 61 = Aquatic bed 62 = Moss/Lichen (includes bogs and fens) 63 = Emergent wetland 64 = Scrub-Shrub wetland 65 = Forested wetland

70
71 = Salt flats 72 = Beaches and river banks 73 = Sandy areas (non-beaches) 74 = Bare/Exposed rock 75 = Strip mines, Quarries and Gravel pits 76 = Transitional 77 = Mixed barren land 81 = Shrub and brush 82 = Herbaceous 83 = Bare Ground 84 = Wet 85 = Mixed
Needed No
Editable Yes
Tallied yes Field procedure: Enter the proper Anderson Level type from the following codes: 1 = urban; 2 = agriculture; 3 = rangeland; 4 = forest; 5 = Water; 6 = wetland; 7 = barren; 8 = tundra; 9 = perennial snow. If the stand is a wetland forest, type it as wetland (5).
Defaulted No
Calculated yes

71
Variables used in calculation: Forest type

72
APPENDIX C
TIMBER ANALYSIS REPORT
1. Top Level Report

73
2. Individual Stand Level Report
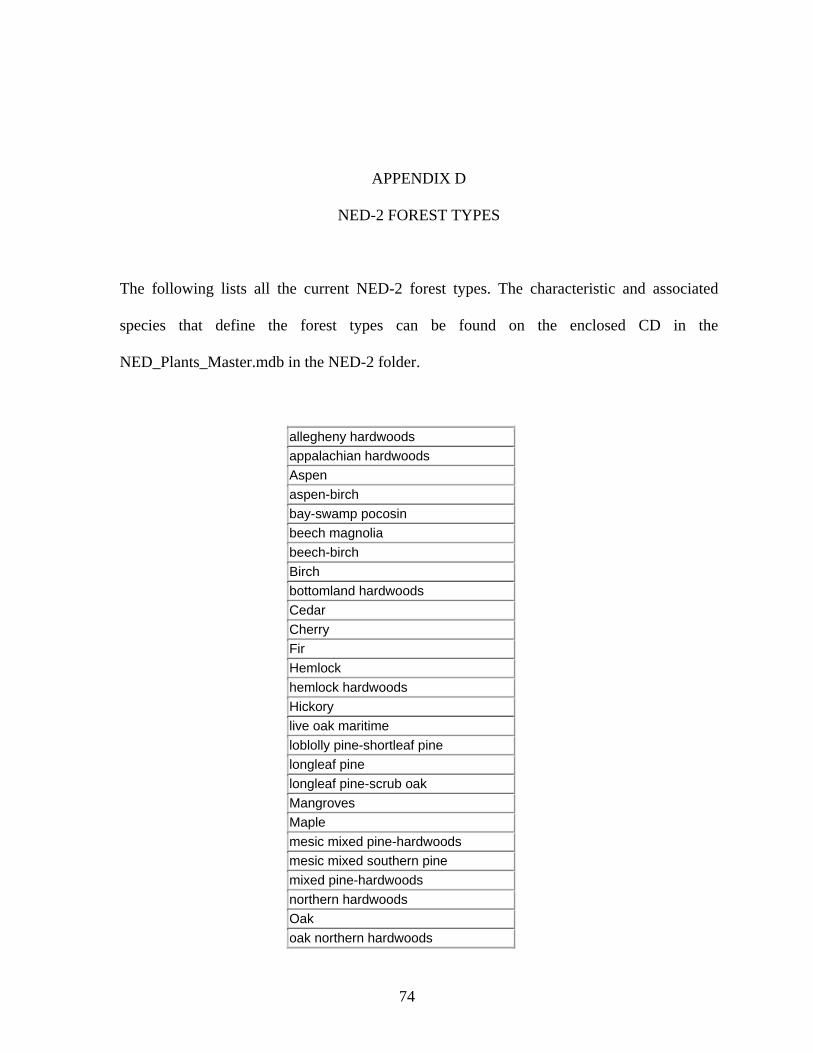
74
APPENDIX D
NED-2 FOREST TYPES
The following lists all the current NED-2 forest types. The characteristic and associated
species that define the forest types can be found on the enclosed CD in the
NED_Plants_Master.mdb in the NED-2 folder.
allegheny hardwoods appalachian hardwoods Aspen aspen-birch bay-swamp pocosin beech magnolia beech-birch Birch bottomland hardwoods Cedar Cherry Fir Hemlock hemlock hardwoods Hickory live oak maritime loblolly pine-shortleaf pine longleaf pine longleaf pine-scrub oak Mangroves Maple mesic mixed pine-hardwoods mesic mixed southern pine mixed pine-hardwoods northern hardwoods Oak oak northern hardwoods

75
oak southern pine oak-hickory Pine Pine hardwoods Pine hemlock pond pine pond pine pocosin sand pine-southern scrub oak southern bottomland hardwoods southern mixed mesic hardwoods southern pine southern scrub oak Spruce spruce-fir spruce-northern hardwoods tropical hardwoods white pine-hemlock xeric mixed pine-hardwoods xeric mixed southern pine yellow poplar

76
APPENDIX E
GOAL ANALYSIS REPORTS FOR WILDLIFE
1. Top Level Wildlife Report with links to individual goal reports
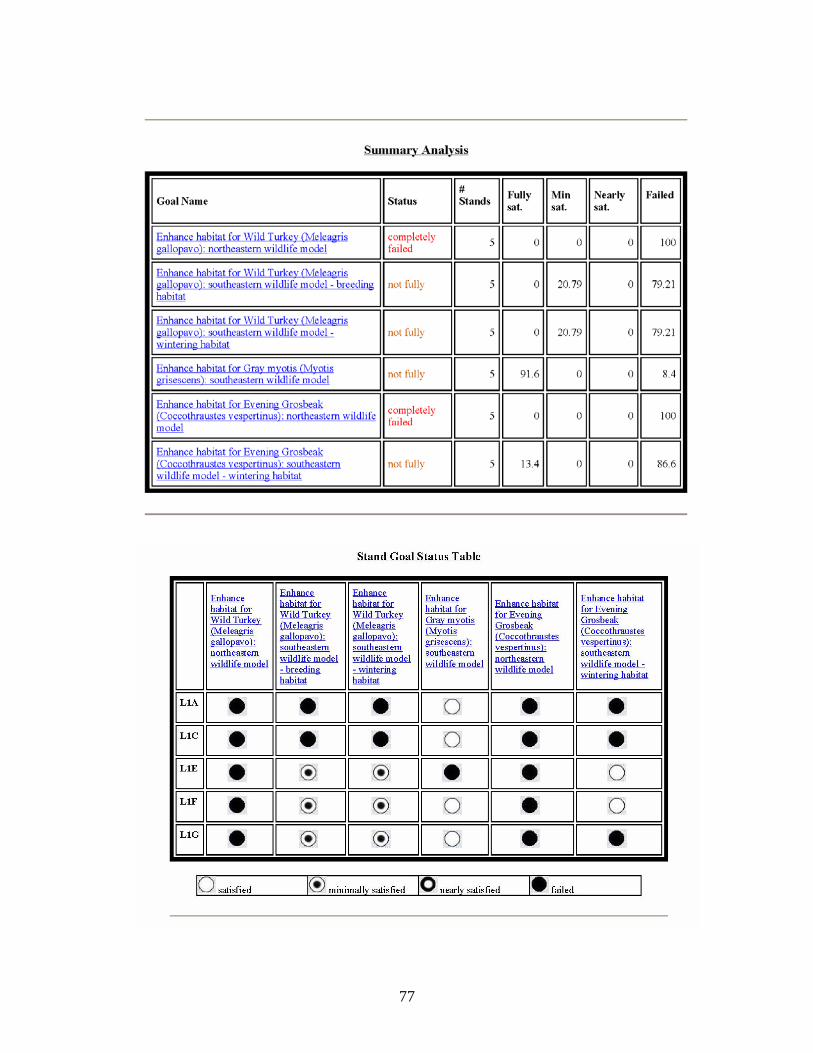
77

78
2. Individual Goal Report for Gray Myotis
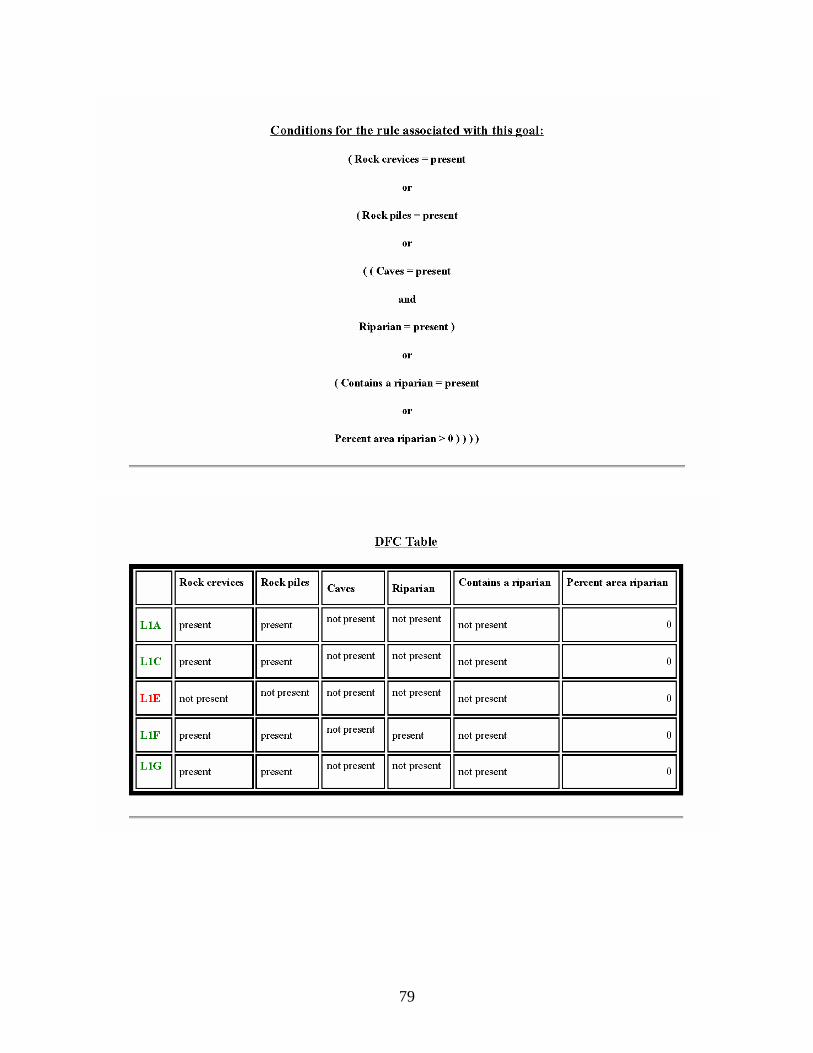
79

80

81
3. Individual Goal Report for Evening Grosbeak
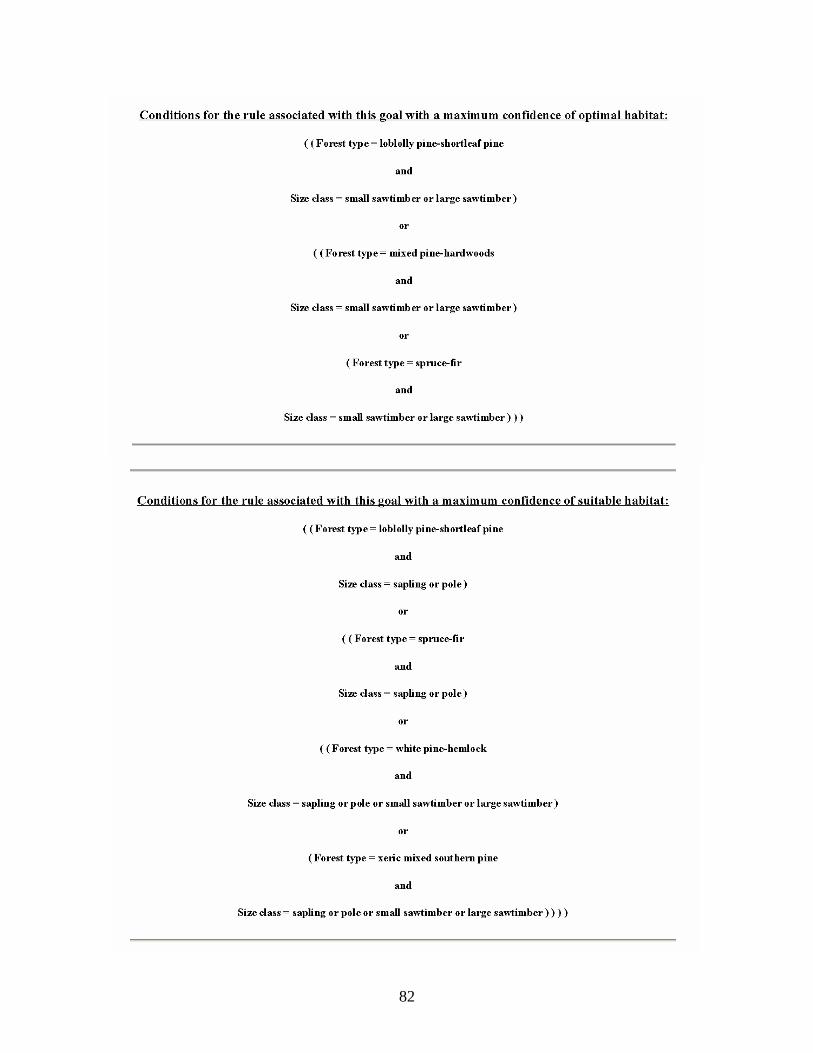
82

83
84
APPENDIX F
WILDLIFE MODEL FOR GAME SPECIES: WILD TURKEY HABITAT
2/9/2001
Turkey Rules for NED
Expert: Craig Harper, Univ. of Tennessee at Knoxville
Knowledge Elicitation by: H. M. Rauscher
Note that this rule set describes the absolute BEST/OPTIMUM conditions for the support of the
best wild turkey populations. It is unlikely that any one area will measure up to all of these
criteria. So we need to develop a rating system which allows partial success by reducing rating
points for the area. Notice also, that failure to meet any of these conditions, implies knowledge
of what we need to do in order to manage for better turkey habitat.
hmr
Highest Level Goal:
F Special Needs are favorable
AND Landscape pattern is favorable
AND Food is favorable
Then
Habitat is favorable for turkey
** Rules for determining the favorability of special needs

85
IF Winter snow covers ground <= 2 weeks at a time
AND Roosting trees are present in management area
AND Special conditions are favorable
THEN
Special needs are favorable
REM Northern limit of turkey is function of duration of winter snow cover
Western limit of turkey is function of lack of roosting trees due to drought
IF Geographic area is Southern Appalachians
AND (Coniferous stands are present
OR Conifers are present in hardwood stands)
AND Spring seeps are present
THEN
Special conditions are favorable
REM Each geographic region is likely to have some special unique features
IF Geographic area is Coastal Plain Pine Belt
AND Mature pine forests exist
AND Mature hardwood forests along riparian zones exist
THEN
Special conditions are favorable
IF Not above
THEN
Special conditions are favorable
86
** Rules for determining the favorability of landscape pattern
IF Herbaceous openings in the landscape are favorable
AND
(Mature hardwoods are favorable
AND Mature conifers are favorable)
OR Mature mixed hardwood/conifers are favorable
Then
Landscape pattern is favorable
IF Total acres of herbaceous openings are between 25 – 50% of area
AND Managed foodplots make up 5% of the area
AND Herbaceous openings are dispersed throughout the area
THEN
Herbaceous openings in the landscape are favorable
REM Seeded roads also qualify for herbaceous opening area
Herbaceous openings are those where forbs predominate
IF Mature Oak and Beech >= 30% of basal area
AND Woody understory is open
AND Herbaceous understory >= 30%
THEN
Mature hardwoods are favorable
REM Herbaceous understory is used for brood cover
IF Mature conifers >= 5 and <= 15% of area
THEN
Mature conifers are favorable
IF Mature Oak and beech >= 30% of basal area
AND Mature conifers are present
87
AND Woody understory is open
AND Herbaceous understory >= 30%
THEN
Mature mixed hardwood/conifers are favorable
REM Herbaceous understory is used for brood cover
** Rules for determining the favorability of food
IF Mature hardwoods are favorable
AND Herbaceous openings for food are favorable
AND Managed food plots are favorable
AND Wild grapes present in management area
THEN
Food is favorable
IF Vegetation is predominantly forbs
AND Vegetation is NOT predominantly cool season perennial grasses
AND Ground level vegetation structure is sparse or open NOT dense
AND Vegetation height is between 1-2 ft
AND Herbaceous openings contain small patches of brambles
AND Scattered soft-mast producing trees are present
THEN
Herbaceous openings for food are favorable
IF Managed food plots make up 5% of the area
AND 50% of food plots are in grain (corn/millet/milo)
AND 50% of food plots are in forage (clover/wheat/oats/rye)
THEN
Managed food plots are favorable

88
APPENDIX G
FUTURE VARIABLES IN NED-2
• stand_grassy_open
• stand_earth_bank
• stand_fresh_water
• stand_brackish_water
• stand_salt_water
• stand_shrub_thickets
• stand_moist_soil
• stand_rocky_outcrops
• stand_potholes
• stand_aquatic_vegetation