the national council for soviet and east european research
TRANSCRIPT

TITLE: UNEMPLOYMENT AND POLICIES IN ROMANIA(September 1993)
AUTHOR: JOHN S. EARLE, Stanford University
THE NATIONAL COUNCILFOR SOVIET AND EAST EUROPEAN
RESEARCH
TITLE VIII PROGRAM
1755 Massachusetts Avenue, N.W.Washington, D.C. 20036

PROJECT INFORMATION:1
CONTRACTOR: Stanford University
PRINCIPAL INVESTIGATOR: John S. Earle
COUNCIL CONTRACT NUMBER: 808-23
DATE: January 31 , 1996
COPYRIGHT INFORMATION
Individual researchers retain the copyright on work products derived from research funded byCouncil Contract. The Council and the U.S. Government have the right to duplicate written reportsand other materials submitted under Council Contract and to distribute such copies within theCouncil and U.S. Government for their own use, and to draw upon such reports and materials fortheir own studies; but the Council and U.S. Government do not have the right to distribute, ormake such reports and materials available, outside the Council or U.S. Government without thewritten consent of the authors, except as may be required under the provisions of the Freedom ofInformation Act 5 U.S.C. 552, or other applicable law.
1 The work leading to this report was supported in part by contract funds provided by the NationalCouncil for Soviet and East European Research, made available by the U. S. Department of State under TitleVIII (the Soviet-Eastern European Research and Training Act of 1983, as amended). The analysis andinterpretations contained in the report are those of the author(s).

UNEMPLOYMENT AND POLICIES IN ROMANIA1
John S. Earle2
Central European University
September 1993
1This paper was prepared for the OECD Technical Workshop on "The Persistence of Unemployment in Centraland Eastern Europe," and is forthcoming in the conference volume.
2I thank the National Council for Soviet and East European Research for funding, the CEU Privatization Projectfor research support, and Gigi Oprescu, Constantin Alecu, and Laurentiu Ungureanu for providing information.The Ministry of Labor and Social Protection was enthusiastic and cooperative in implementing the Survey ofRegistered Unemployed. Sorana Baciu, Doina Rachita, Nicusor Ruiu, and Roxana Trofin assisted. Most especially,I am indebted to Simona Spiridon. Catalin Pauna, and Irina Vantu for excellent and dedicated research assistance.All errors are mine.

IntroductionThis paper has two purposes: first, to redress many of the existing gaps in information
about Romanian unemployment and. second, to analyze policies targetted to assist the
unemployed. The first two sections provide a detailed report on the characteristics and
dynamics of unemployment in Romania. In the first, the million or so unemployed in Romania
are disaggregated along demographic and economic dimensions to portray the magnitude, the
incidence, and the origins of the problem. The dynamics of unemployment are the topic of
section 2, including the evolution of unemployment characteristics since early 1991, the time
series behavior of the flows of workers among branches, sectors, and labor market states, and
the determinants of the duration of unemployment for individuals. Section 3 contains an
analysis of the unemployment insurance, extended benefit, and active labor market policies,
including training programs and wage subsidies in place as of September 1993, the time of this
writing.
As in many post-socialist economies struggling to adapt to rapid changes, information
concerning the new phenomenon of open unemployment is small in quantity and poor in
quality. Results from the first labor force survey have only recently been made available, and
the survey is missing several variables important to researchers (earnings, for instance).
Official unemployment data come entirely from the registration of individuals at local labor
offices. The Ministry of Labor and Social Protection (MLSP) provides some aggregate
classifications each month, which, although useful, are limited to a few basic dimensions and
allow few inferences concerning the origins, causes, and incidence of unemployment to be
drawn. The National Commission for Statistics (CNS) collects quite a bit of information
concerning employment and wages from enterprises in the state sector, but little of it has been
brought to bear on the problems of understanding unemployment.
Although this inquiry exploits whatever material the MLSP and CNS provide, often also
adjusting or recombining it as necessary or appropriate, the chief source of data in the paper is
a Survey of Registered Unemployed (SRU). The SRU was conducted on a 1.5 percent sample
of all registered unemployed in August 1993 by the Labor Research program of the Central
European University Privatization Project in cooperation with the MLSP. It redresses many of
the deficiencies in existing data and permits a much more complete picture of unemployment
and of the effects of labor market policies in Romania.
1. Characteristics of Unemployment in Romania
Although it rose rapidly in 1992, open unemployment in Romania levelled off during the
first half of 1993, at least temporarily, and the current rate of just under 10 percent remains

among the lowest of Eastern Europe. Nonetheless, the post-1989 tumbles in output and
productivity have been particularly precipitous in Romania, and there is reason to believe that
the branch structure and overall allocation of resources remain extremely distorted; thus,
unemployment is widely expected to rise dramatically again in the future.3 An analysis of
current characteristics of unemployment, besides contributing to an understanding of the role of
unemployment and of labor market policies in the restructuring process so far, may also
provide some basis for forecasting future trends in both the aggregate level and the
composition of unemployment.
As mentioned in the introduction, however, official data on unemployment come only
from registration with local offices of the Ministry of Labor. The Ministry and the local offices
have entirely new tasks since the beginning of the economic reform and must try to cope under
the strain of a rapidly expanding caseload of ever more desperate unemployed, thus it may be
understandable that information collection is not their first priority. Nonetheless, it is important
to recognize two major deficiencies in the data they provide (in addition to the inherent
problems of using registration data rather than conducting a survey of households).
First, the Ministry reports regularly only the total number of unemployed and the
number in a few basic categories: sex, age groups, counties (judet), broad educational ("socio-
professional") groups, and disaggregated occupations. Many other characteristics, particularly
those involving origins and reasons, are also critical for a full assessment of unemployment.
Second, registration data concern only absolute numbers and the composition of
unemployment, but allow no evaluation of incidence. Yet it is crucial to know not only who
accounts for most of unemployment, but also in which groups unemployment is particularly
concentrated. The Ministry computes only an aggregate unemployment rate, dividing the
number registered by an annual estimate of "active population." and provides breakdowns only
by composition and not incidence.
The project on which this paper reports attempts to solve or at least significantly alleviate
both of these problems. Regarding the first, the Survey of Registered Unemployed (SRU)
provides much more detailed characteristics of unemployed individuals and allows an explicit
examination of individual behavior, including the origins and causes of unemployment. The
questionaire was completed by over 15,000 individuals (1.5 percent of the unemployed) on a
geographically representative basis (proportionately from each of 190 labor offices) in August
1993. and is broadly representative of the population described by the MLSP statistics, along
3These two sets of factors are reviewed in Earle and Oprescu (1993) and Earle and Sapatoru (1993),respectively.

the limited number of dimensions which can be compared.4 It also included questions on
search behavior, usage of time, willingness to switch occupations, and other topics.5 Second,
this paper combines figures on the number unemployed from both the SRU and MLSP with
employment and labor force figures from a wide variety of sources within the CNS to generate
rates of unemployment for many demographic and economic categories.
To summarize the results: women, youths, skilled workers, persons of medium
education, former employees of state-owned commercial companies in industry, job losers, and
new entrants dominate Romanian unemployment. Tables 1 to 7 show the composition, rate.
and average duration of unemployment by sex, age, education, occupation, industry (branch).
and property form of former job, and reason. "Count" indicates the number of unemployed in
the sample of the SRU in the given category. "Percentage" refers to the composition of the
unemployment pool. And "mean duration" is the measure, in months, of the average duration
of unemployment for the indicated group.
As in many other transition countries, the unemployment rate of women is much higher
than that of men; but in Romania it is nearly double. However, this is not due to a high rate of
re-entrants among women, which accounts for very little of unemployment; rather, the
differential is the result of higher layoff and new entrant rates.
Youths account for a large proportion of unemployed, but the unemployment rates in
Table 2 are reported for the first time.6 The unemployment rate for teenagers is astonishingly
high, and it is also notable that workers in their late twenties have a much higher rate than do
those in their early twenties. This is still more puzzling in light of Romanian demographics: a
factor that would have seemed to push in the opposite direction is that current 26 year olds are
members of the vanguard of the Romanian baby boom, begun after Ceausescu banned abortion
and most forms of contraception in late 1966. The birthrate nearly doubled in 1967 and only
fell very gradually thereafter.
Information from the CNS concerning employment by education exists only on a very
limited basis: for the same three groups as defined by the MLSP. But the unemployment rates
in Table 3 are calculated and presented for the first time. It is remarkable that secondary
school graduates have by far the highest unemployment rate. Both unskilled and low-skilled
workers and university graduates are faring much better, at least in this dimension of labor
market performance. A possible explanation of this phenomenon is the high degree of specific
4The SRU has slight over-representation of university-educated individuals and of younger people, which wemay conjecture is due either to their greater ability and willingness to respond or to problems in the Ministry's data.
5Catalin Pauna contributed substantially to the design and organization of the survey.6The MLSP does not gather unemployment statistics for teenagers separately, nor does it calculate rates.

training of medium skilled workers, slowing their ability to adjust to changing labor market
conditions. Table 4, however, shows that unskilled workers have the highest unemployment
rate, although skilled workers and administrative staff also have very high rates.
Table 5 shows "experienced unemployment" by branch, defining the relevant branch
labor force as the sum of current employment in the branch plus those unemployed whose
previous job was in the branch. These figures have, to our knowledge, never been calculated
in Romania, and they show enormous variation in unemployment rates across sectors.
Unemployment in textiles and clothing, where large-scale layoffs have occurred, is highest.
Service industries have low unemployment. Agricultural unemployment is low, probably due to
the non-eligibility of former agricultural cooperative members for unemployment benefits.
The average duration of unemployment, on the other hand, varies comparatively little
across economic branches. While separation rates differ quite significantly across sectors, as
we shall see in the next section, the probability of re-employment varies less, which could
imply that unemployment is a "stagnant pool" from which escape is difficult, regardless of
one's previous experience. In addition, those sectors with the highest durations, such as coal
mining, other mining, and transportation may be those which are slowest to begin
restructuring, implying that laidoff workers from those sectors may face particular difficulties
in finding new jobs. If this is the case, then it suggests that unemployment may increase quite
significantly when the real restructuring process in those sectors begins.
Table 6 provides some interesting further evidence on restructuring. Surprisingly, the
highest rates of "experienced unemployment" are in cooperatives, with privatized firms close
behind. Because former members of former agricultural cooperatives are ineligible for
unemployment benefits, as discussed below, these cooperatives must operate in industry.
According to these results, privatized firms have laid off about a quarter of their workers.
Finally, among state-owned enterprises, the "commercial companies" have a much higher
unemployment rate than do the "regies autonomes." which include many of the dinosaurs of
Romanian industry.
Table 7 shows unemployment by reason. Over 60 percent of Romanian unemployed are
job losers, of which well over half were laid off en masse. The other big category are the new
entrants, to which we have already alluded.
2. Dynamics of Romanian Unemployment
How has the unemployment situation in Romania evolved over the last two and a half
years? How many workers have been quitting state industry for new jobs, how many have
been retiring or leaving the labor force for other reasons, and how many have been laid off

involuntarily? What are the magnitudes and directions of flows of workers into and out of
unemployment? To what extent should Romanian unemployment be characterized as high
turnover-short duration or as low turnover-long duration?
The first issue can be addressed only with the use of Labor Ministry data, which permits
the analysis of only the limited number of dimensions described above. The composition of
unemployment by sex has been remarkably constant, with women accounting for 60 percent of
the unemployed since the MLSP tabulations began. The relative proportions of the three
educational ("socio-professional") categories in total unemployment — "workers," "persons of
average education," and "university graduates" — have also been remarkably constant at 87,
11, and 2 percent, respectively, since late 1991. The structure of unemployment by age,
however, changed significantly in August 1992, when the proportion of unemployed younger
than 25 fell from almost 50 to about 41 percent, while the weights of other age groups rose
almost proportionately. As discussed below, this was possibly a result of the establishment of
the Support Allowance Program, particularly because, since then, the age structure has
displayed little evolution.
Concerning labor turnover, remarkably good data are available on accessions and
separations of various categories in industry and a few other sectors from the National
Commission for Statistics. Several remarkable conclusions may be drawn.
First, Romania in the late 1980s was not a particularly low turnover economy. Annual
accession and separation rates varied within the 15 to 17 percent range, of which less than 5
percentage points involved flows out of the labor force. Layoff rates were quite low. but not
entirely negligible, and both disciplinary discharges and voluntary job-to-job quits were
significant. Second, 1990 was the big year for job changing, as hiring jumped to about 130
percent of the average of the past three years, and quits, both to new jobs and to out of the
labor force, more than doubled. Third, turnover in 1991 and 1992 fell back to pre-
revolutionary" levels: for several categories, including overall separations. 1991 and 1992
look much more like 1987 to 1989 than to 1990. The hiring rate essentially collapsed,
however, and the little movement in total separations masks a rising rate of dismissals and
falling quit rate, especially to other jobs.
These data may be taken as indicators of the beginnings of restructuring in Romanian
state-owned industry: not sensational, but also not insignificant. After the comparative trickle
of 1990 and 1991, the year 1992 witnessed a 12.5 percent decline in industrial employment,
the first sizable drop. Employment declines were quite unequally distributed across sub-
branches, being especially large in textiles, radioactive minerals, nonmetallic mining,
fabricated metals, machine building, and electrical equipment. In some sub-branches, such as

oil and gas, metallic minerals, food, chemicals, transportation equipment, and railways,
employment fell comparatively little. It actually rose in coal mining, where there was great
turnover: both accession and separation rates were close to 20 percent. Most of the variation in
employment declines is due to differences across sub-branches in dismissal rates, with textiles
showing the greatest active restructuring: nearly 12 percent of textile employees were
dismissed in 1992.
It is not exactly easy to calculate gross unemployment flows from the figures reported by
the MLSP in Romania. Prior to August 1992, when the Support Allowance was introduced, as
described below, unemployed individuals who exhausted their eligibility for benefits and did
not re-register as nonrecipients were neither counted as part of "deregistrations," nor were they
enumerated separately. Deregistrations are reported for job finders and suspensions (for no
longer complying with the conditions for benefit eligibility) separately, but exhaustees simply
disappear. This might cause more than a little trepidation in one attempting to measure the
magnitude of gross flows into and out of the unemployment pool.7
But some conclusions may still be drawn, if one takes into account the pattern of benefit
durations in the context of the Romanian program: in fact, we know in which months benefit
exhaustion occurred and therefore when to avoid spurious calculations. In the first six months
(February to August 1991), there was no benefit exhaustion, nor, after benefits were extended
to nine months, was there from January to March 1992 as former exhaustees returned for 3
months to the rolls. Finally, beginning August 1992, benefits exhaustees were automatically
transferred into the Support Allowance category, so that they remained counted. Only starting
January 1994 will SA recipients begin to exhaust their 18 months of support, but hopefully by
that time the Ministry will be ready to start counting them.
Operating under these constraints, calculations of total outflows from unemployment.
outflows to jobs, inflows to unemployment, and the corresponding rates for all the months in
which these flows may be precisely calculated, show that both the inflow rates (calculated as a
percent of the population aged 15 to 59) and the outflow rates (calculated as a percent of total
employment) are quite low. In general, it seems that Romania is similar to many other
transition economies, the Czech Republic being the notable exception, in having unemployment
characterized by very low turnover.
While this conclusion seems to be valid on average, it may not hold for all groups of the
unemployed. We saw in the previous section that mean duration of unemployment differs
7Indeed, naive calculation of unemployment inflow as the first difference of the number unemployed plusderegistrations sometimes yields a negative inflow!

greatly across different population groups, suggesting that some groups may be characterized
by high turnover, others by long term unemployment.
Concerning unemployed individuals who are registered with labor offices but who are
ineligible to receive any kind of benefits, for instance, a bit more information is available.
Turnover seems to be very high in this pool of workers. For instance, in the Bucharest office
at the beginning of April 1993, 1439 such individuals were already registered, but two and a
half times that - 3564 — registered newly in the course of that month. Of the total 5003, 4087
or over 80 percent found jobs during April. The rapid turnover was also consistent across
occupational and educational categories.
3. Labor Market Policies for the Unemployed in Romania
Since 1990, Romania has undertaken a number of programs for the specific purpose of
assisting the unemployed. The programs combine social insurance and means-tested income
support with active policies to increase labor demand for youths and to improve matching by
providing retraining for many categories of unemployed individuals. To be sure, other policies,
including monetary, credit, fiscal, industrial, regulatory, incomes, indexation, mimimum wage,
retirement, and other social assistance policies, may well influence the rate and composition of
unemployment. This section, however, focusses on essential features of those programs
specifically targetted on the unemployed qua unemployed.8
Unemployment Benefit and Support Allowance
By far the most important unemployment policy in Romania, and the one to which this
paper devotes most attention, is the Unemployment Benefit Program, founded by Law No. 1 in
1991 "Concerning the Social Protection of the Unemployed and their Professional Re-
Integration." It has been amended twice (Law No. 72 in December 1991 and Law No. 86 in
July 1992).
According to these laws, the following groups are eligible to receive benefits:
(1) secondary school and university graduates over 18 years old, with personal income less
than half of the minimum wage in the economy, unable to find a job within the first 60
days after their graduation (new entrants), and only after a further 30 day waiting period:
the age requirement was amended to 16 years for those with no parents or other sources
of income in December 1991;
8Several of the other policies, in particular the incomes and indexation policies, are analyzed extensively in Earleand Oprescu (1993).

(2) those with no prior labor contract who after compulsory military service could not find a
job within 30 days (the requirement for no prior contract seems not to be enforced);
(3) those dismissed due to reasons listed in articles a-f of the Romanian Labor Code:
(a) reduction or reorganization of activity,
(b) closing of plant,
(c) moving of enterprise to another location, where local workers are being hired,
(d) moving of enterprise to another location, but the employee does not agree to move,
(e) lack of necessary qualifications for the job,
(f) return of former employee with rights to the job (for instance, someone on approved
leave);
(4) those dismissed from handicraft cooperatives, for reasons for which they are not to blame;
(5) those dismissed illegally, if it is impossible to be rehired for the same job;
(6) those who quit with the approval of the former enterprise (literally: "for reasons that do not
modify the bonus for years of employment"), but only if they have been employed at
least 6 months out of the last 12 months;
(7) those who had been on fixed (temporary) contracts, but again only if they were employed
at least for 6 of the last 12 months.
Essentially, persons laid off and discharged without prejudice plus new entrants who are recent
school or university graduates are covered, but persons discharged for cause as well as most
job leavers (quits) and re-entrants are not.
The Law also specifically excludes the following categories of individuals:
(1) owners of over 10,000 square meters agricultural land in plain or hilly areas, or over
20,000 in mountainous areas (proven by documents from local authorities); these ceilings
were amended to 20.000 and 40.000 in July 1992;
(2) those with personal income "from authorized activities" greater than half of the minimum
wage;
(3) those who have "unreasonably" refused the offer of the Local Labor Office for a training
course or a job in accordance with their skills, health and no further than 50 km. away
from their home;
(4) those eligible to retire (defined by age — 57 for women and 62 for men — and years of
employment — 25 for women and 30 for men);
(5) former members of the former agricultural cooperatives (under the rationale that they
should have enough land to support themselves).

Thus, the Unemployment Benefit program is not a pure social insurance program, but
contains provisions for means-testing. According to officials from the Ministry of Labor, the
ceiling on land ownership is not often a binding constraint, although primarily for paradoxical
reasons. Agricultural land ownership has been widely dispersed in Romania since the
implementation of the Land Law (No. 18/1991), which broke up the agricultural cooperatives
and returned their land to over 7 million people, but with a maximum of 10 hectares per
family, widely acknowledged as too small an area to support profitable commercial farming.
However, the inefficiency and corruption involved in this process has meant that relatively few
new owners have received their titles (fewer than 100,000 by the summer of 1992), thus there
is no proof that the land is theirs, although they may work it unofficially. The result is highly
inefficient agriculture, a near impossibility to sell land and therefore for more concentrated
holdings to develop, but, at the same time, little difficulty in eligibility for unemployment
insurance!
A more serious element of means-testing seems to be the ceiling on personal income of
half the minimum wage, or less than $15 at the current exchange rate, and certainly less than a
subsistence income. However, this provision probably functions more to reduce income
reporting than it accomplishes anything else.9
Other conditions for eligibility include the requirements that the recipient be registered at
a local labor office, report there twice a month (later amended to once a month), and have a
health certificate.
Levels of benefits vary for new entrants compared to laid-off workers, and by level of
education for new entrants and by years of experience for experienced workers. The specific
levels are set as follows:
(1) 60 percent of the indexed national minimum wage for graduates of secondary, vocational.
and apprenticeship schools and for workers with less than one year of experience;
(2) 70 percent of the indexed national minimum wage for university graduates;
(3) 50 percent of the indexed last base wage (amended to the average of the last three months
in July 1992), but not less than 75 percent of the minimum wage, for recipients with 1 to
5 years of experience;
9It is presumably because it is regarded as a social insurance rather than a transfer program that theUnemployment Benefit Program is scarcely treated in the Ministry's (1993) "White Paper on Social Assistance,"but to the degree that the program is means-tested, this presumption is unfounded.
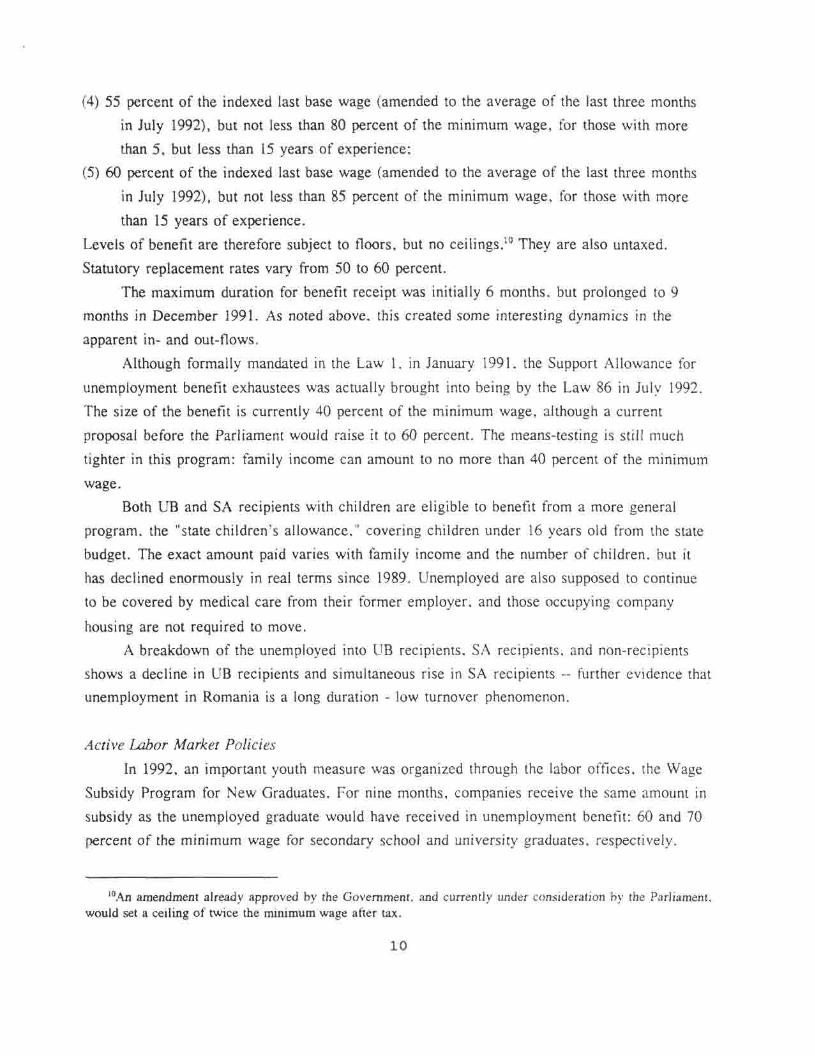
(4) 55 percent of the indexed last base wage (amended to the average of the last three months
in July 1992), but not less than 80 percent of the minimum wage, for those with more
than 5, but less than 15 years of experience;
(5) 60 percent of the indexed last base wage (amended to the average of the last three months
in July 1992), but not less than 85 percent of the minimum wage, for those with more
than 15 years of experience.
Levels of benefit are therefore subject to floors, but no ceilings.10 They are also untaxed.
Statutory replacement rates vary from 50 to 60 percent.
The maximum duration for benefit receipt was initially 6 months, but prolonged to 9
months in December 1991. As noted above, this created some interesting dynamics in the
apparent in- and out-flows.
Although formally mandated in the Law 1, in January 1991. the Support Allowance for
unemployment benefit exhaustees was actually brought into being by the Law 86 in July 1992.
The size of the benefit is currently 40 percent of the minimum wage, although a current
proposal before the Parliament would raise it to 60 percent. The means-testing is still much
tighter in this program: family income can amount to no more than 40 percent of the minimum
wage.
Both UB and SA recipients with children are eligible to benefit from a more general
program, the "state children's allowance." covering children under 16 years old from the state
budget. The exact amount paid varies with family income and the number of children, but it
has declined enormously in real terms since 1989. Unemployed are also supposed to continue
to be covered by medical care from their former employer, and those occupying company
housing are not required to move.
A breakdown of the unemployed into UB recipients. SA recipients, and non-recipients
shows a decline in UB recipients and simultaneous rise in SA recipients -- further evidence that
unemployment in Romania is a long duration - low turnover phenomenon.
Active Labor Market Policies
In 1992, an important youth measure was organized through the labor offices, the Wage
Subsidy Program for New Graduates. For nine months, companies receive the same amount in
subsidy as the unemployed graduate would have received in unemployment benefit: 60 and 70
percent of the minimum wage for secondary school and university graduates, respectively.
10An amendment already approved by the Government, and currently under consideration by the Parliament.would set a ceiling of twice the minimum wage after tax.
10

They are supposed to be hired in the state sector only at the minimum wage corresponding to
their category of education and skill.
In the 1992 program, 15,895 individuals had been hired by July 1, 1993, less than 10
percent of all 1992 graduates.11 The 1992 program involved a total outlay of 388,543.9 ths.
Lei, according to the MLSP. Several results of the program are notable and surprising. First,
13,950, or about 88 percent, of the new jobs were in state firms. Yet this is not the sector
experiencing most growth in labor demand. Second, 7117, or nearly half, the jobs were for
university rather than secondary school graduates, although, as we saw earlier, the latter group
is much larger and has a much bigger unemployment problem: of all new entrants in the SRU,
97.7 percent were secondary school graduates, and only 2.3 percent were university graduates.
Moreover, although the subsidy for university graduates is slightly higher in absolute terms
than that for secondary school graduates, it is likely that relative wages are such that the
proportionate subsidy is much larger for the latter than the former.12 Third, over half the jobs
created were in Bucharest, where new labor demand is highest and unemployment rates are
low anyway, and where one might expect that the proportionate subsidy is relatively low.
Thus, the effects of this program seem to have little to do with either labor supply or labor
demand.
Apart from its modest size, it is quite difficult to estimate what the effects of the wage
subsidy program might be on aggregate unemployment. As a program for new entrants, it
targets workers who may be supposed to be high turnover-short duration unemployed. In this
case, the program would not be helping the truly needy long-term unemployed, but just the
opposite group. However, as shown in Table 2, young re-entrant unemployed do not have
significantly shorter durations than do older, experienced workers. There may be significant
cross-demand effects that are not easy to predict a priori.
The program for 1992 graduates having finished, the Parliament is now considering
establishing a program for 1993 praduates. Another proposal presently before the Parliament
would extend the wage subsidy to new or expanding companies hiring at least 6o percent of
their employees from the pool of unemployed. According to the proposal, only firms in
industry, services, or tourism would be permitted to participate. While this might create a
healthy stimulus for new growth, it might also displace other growth or subsidize development
that would have occurred anyway. The idea that proposals to participate would be evaluated by
some "credit committee" seems far too discretionary and non-transparent.
11According to C. Pauna (1993).12This point is made in Spiridon (1993).
1 1

Another unemployment measure involving the payment of wages out of the
unemployment fund was the so-called "technical unemployment." In the period November 1,
1991 to March 31, 1992, some enterprises were forced to close due to a lack of energy supply.
Their wages were paid out of the Unemployment Fund (described below) during this time.
The final unemployment policy to be discussed concerns training and re-training.
According to Law 288 (April 1991), all registered unemployed, including recipients and non-
recipients, are eligible for up to two retraining courses, which can last up to 6 months each
and which can be offerred either at retraining centers or at firms. Recipients concluded
contracts with the labor offices, obliging the former to repay the cost of the training in the
event that two subsequent offers of employment are refused. Firms offerring the courses
concluded a contract to hire the trainees at the conclusion of the course. The labor offices
determine the types of courses, also in cooperation with the firms offerring them, in such
cases.
Under these circumstances, it is somewhat surprising that only 107.665 had participated
and only 64,342, less than 7 percent of the total unemployed, had completed courses by
September 1993. Only the courses organized by firms (with obvious interest, as well as
obligation to hire subsequently) were very successful in getting jobs for the unemployed
participants, but these courses involved only about 6 percent of trainees. By contrast, most
courses were organized at the initiative of local labor offices (the euphemism is "organized to
meet the labor demand"), but only about 15 percent of trainees were placed in jobs thereafter,
a rather abysmal record. The "courses for entrepreneurs" fared no better: again, only 15
percent actually started a business after the course. It is interesting to note in the occupational
breakdown that those completing courses in more service and consumer-oriented occupations
generally had better placement records than others, although masons also did rather well.
The small scale and low participation in retraining may have several explanations. First,
according to some observers, the unemployed are not interested in retraining, preferring rather
to remain dependent on the state.13 The Survey of Registered Unemployed, however, found
that a large proportion of the unemployed believe they must change occupations in order to
find a new job; thus, they must have some recognition of the need for retraining. A second
possible explanation is that labor offices may be offering courses that correspond only poorly
with the structure of growth in labor demand. The training course offerings are dominated by
industrial occupations, which are not necessarily the obvious areas for growing demand.
13Interview with Iulian Oneasca, reporting some unpublished results of an unemployment survey concerned withthese questions.
12

It has been recently proposed that the retraining program be expanded to permit
employed individuals to participate, and to encourage enterprises to submit proposals for new
courses.14
All of these programs are financed from the Unemployment Fund, established in the Law
1. Employers contribute 4 percent of payroll (amended in July 1992 to 5 percent), and
employees contribute 1 percent of their wages. The Fund is deposited in a "special account" in
the National Bank. Although the account bears interest, the ex-post real interest rates have
generally been negative. It is difficult to determine how the Fund has been used and why it has
been allowed to lose real value. But there seems to be little danger of the Fund being
exhausted in the short run. And Law 1 would permit benefits to be paid from the state budget
in this event.
As already mentioned, the organization of the disbursement of all these benefits and
programs takes place through the local labor offices, of which there are about 190 in 41
counties (including Bucharest). A total 1552 people are employed in these offices, with an
average "caseload" of 668 unemployed per employee. Moreover, this caseload differs quite
significantly across offices, with a range from 295 in Brasov to 3454 in Calafat. We may
hypothesize that this is a significant determinant of the ability of offices to place unemployed
workers in new jobs.
14According to C. Pauna (1993).
13

References
Codin, M. and M. Zecheriu (1992), "Unemployment and the Behavior of UnemployedWorkers" (in Romanian), Institute for Research on the Quality of Life, Bucharest.
Earle, J. and G. Oprescu (1993), "Romanian Labor Markets in Transition: Wage andEmployment Determination, Unemployment, and Labor Market Policies," study for theWorld Bank Project on Labor Markets in Transitional Socialist Economies, Washington.
Earle, J. and D. Sapatoru (1993), "Privatization in a Hypercentralized Economy: the Case ofRomania," in J. Earle, R. Frydman, and A. Rapaczynski (eds.) Privatization in theTransition to a Market Economy. Pinter Publishers and St. Martin's Press, London andNew York.
Ministry of Labor and Social Protection (1993), "White Paper on the Social Assistance Systemof Romania: Description. Assessment and Options for Reform," Bucharest.
Pauna, C. (1993), "Patterns of Unemployment in Romania during the Transition Period,"Central European University Department of Economics, Prague.
Pert, S. (1992), "Persistent Unemployment - A New Phenomenon: Dimensions.Characteristics, Trends" (in Romanian). National Institute for Economic Research.Bucharest.
Spiridon, S. (1993), "The Wage Subsidy Program in Romania," Central European UniversityDepartment of Economics, Prague.
14

Table 1
Unemployment by Sex-July 1993-
Sex
Female
Male
Count
3714
2284
Percentage
61.9
38.1
Unemploymentrate
11.38
6.43
Meanduration
8.4
8.2
Sources: Survey of Registered Unemployed (SRU)and National Commission for Statistics (CNS)
Table 2
UNEMPLOYMENT BY AGE-July, 1993-
Age groups
16-20 years
20-24 years
25-29 years
30-39 years
40-49 years
50-55 years
55-60 years
Count
1430
1320
1168
1196
633
160
68
Percentage
23.9
22.2
19.5
20.0
10.6
2.7
1.1
Unemplrate
39.49
13.63
16.40
6.86
4.57
3.06
2.26
Meanduration
7.3
8.9
8.9
8.5
8.4
8.4
8.1
Sources: SRU and CNS.
15

Table 3
UNEMPLOYMENT BY EDUCATION GROUPS-July, 1993-
Education groups
University graduates
Lyceum and post-lycee grd.
Less than 12 years of school
Count
288
2699
2874
Percen-tage
4.91
46.05
49.04
Unemplrate
6.05
15.66
6.05
Meandura-tion
8.4
9.1
7.5
Sources: SRU and CNS.
Table 4
Unemployment by Occupation-July 1993-
Occupation
Managers
Specialists
Technicians
Administrative
Agriculture work
Skilled workers
Unskilled workers
Count
1
172
248
388
75
2875
566
Percentage
0.0
3.98
5.74
8.97
1.74
66.48
13.09
Unemploymentrate
0.14
9.21
8.56
14.01
5.91
15.49
19.63
Meanduration
2.0
7.4
9.1
7.9
8.5
8.6
8.7
Sources: SRU and CNS.
16

Table 5Unemployment by Branch
-July 1993-
Branches
Agriculture
Industry
Coal mining
Other mining
Food, beverage & Tabaccomanufacturing
Textile, knit, wearingapparel&leather manuf
Leather & footwear manufacturing
Wood Industry
Chemistry
Glass & rubber Ind.
Metallurgy
Fabricated metal products
Machinery& equipmentmanufacturing
Electrical& Optical Equipment
Transportation equipment
Other manufacturing industries
Energetics
Construction
Trade, Hotel&Rest
Transportation&Comm
Fire
Service
Count
376
2141
52
19
141
597
46
46
85
22
116
52
460
127
8
83
17
271
295
85
44
366
Percentage
6.7
56.1
0.9
0.3
2.5
10.9
0.8
0.8
1.5
0.4
2.0
0.9
8.1
2.3
0.1
1.5
0.3
4.7
5.3
1.5
0.8
6.6
Unempl.rate
11.34
11.48
7.80
1.92
8.82
16.14
6.87
5.18
6.88
1.65
9.87
4.97
14.96
12.17
0.57
7.69
1.77
7.53
5.23
2.23
1.51
5.70
Meanduration
9.9
8.5
11.3
11.2
8.3
7.7
8.2
7.5
9.0
9.2
8.9
8.3
8.5
10.0
13.7
9.0
12.7
8.7
7.6
6.2
11.0
9.0
Sources: SRU and CNS.
17

Table 6Unemployment by Legal Form
-July 1993-
Legal form
Budgetary institutions
Regies autonomes
Commercial companies
Cooperatives
Private firms
Privatized firms
Joint venture
Count
165
173
2271
573
105
64
10
Percentage
4.3
4.5
71.8
14.8
2.7
1.7
0.3
Unemploymentrate
4.84
3.89
13.75
30.88
6.30
25.95
1.80
Meanduration
8.7
10.5
8.5
9.0
6.2
10.0
6.9
Table 7Unemployment by Reasons of Unemployment
-July 1993-
Reason
Mass layoff (> 10 empl
Mass layoff (2-10 empl
Individual layoff
Plant closure
Quit
Newentrant
Reentrant
Out of LF
Others
Count
2110
724
361
347
51
1932
150
33
62
Percentage
36.6
12.5
6.3
6.0
0.9
33.5
2.6
0.6
1.1
Mean duration
9.1
8.3
7.2
8.9
9.4
7.7
8.0
7.1
9.4
Sources: SRU and CNS.
18
