the national alcohol strategy monitoring projectccsa.ca/resource...
TRANSCRIPT

www.ccsa.ca • www.ccdus.ca
The National Alcohol Strategy
Monitoring Project
A Status Report
November 2017

The National Alcohol Strategy
Monitoring Project
A Status Report
This document was published by the Canadian Centre on Substance Use and Addiction
(CCSA).
Suggested citation: Canadian Centre on Substance Use and Addiction. (2017). The National
Alcohol Strategy monitoring project: a status report. Ottawa, Ont.: Author.
© Canadian Centre on Substance Use and Addiction, 2017.
CCSA, 500–75 Albert Street
Ottawa, ON K1P 5E7
Tel.: 613-235-4048
Email: [email protected]
Production of this document has been made possible through a financial contribution from
Health Canada. The views expressed herein do not necessarily represent the views of Health
Canada.
This document can also be downloaded as a PDF at www.ccsa.ca
Ce document est également disponible en français sous le titre :
Projet de surveillance de la Stratégie nationale sur l’alcool : rapport de référence
ISBN 978-1-77178-455-9
The National Alcohol Strategy Monitoring Project: A Status Report
Canadian Centre on Substance Use and Addiction • Centre canadien sur les dépendances et l’usage de substances
Table of Contents
The National Alcohol Strategy Monitoring Project ....................................................... 1
Table of Contents ......................................................................................................... 1
Conflict of Interest .................................................................................................. 3
Executive Summary ..................................................................................................... 1
Background ............................................................................................................ 1
Methods .................................................................................................................. 1
A Status Report ........................................................................................................ 1
Results .................................................................................................................... 1
Implementation of the NAS ..................................................................................... 1
Alcohol-related Behaviours and Consequences ..................................................... 2
Discussion ............................................................................................................... 2
Conclusion and Next Steps ..................................................................................... 3
Introduction ................................................................................................................. 4
Method ......................................................................................................................... 6
Logic model-based monitoring ............................................................................... 6
Using Indicators to Measure Results ....................................................................... 7
A Status Report ........................................................................................................ 8
Results ........................................................................................................................ 10
Implementation of the NAS ................................................................................... 10
Alcohol-related Behaviours and Consequences ................................................... 11
Discussion .................................................................................................................. 12
Outputs ................................................................................................................. 12
Strategic Area 1: Health Promotion, Prevention and Education ............................ 12
Strategic Area 2: Health Impacts and Treatment ................................................... 12
Strategic Area 3: Availability of Alcohol ............................................................... 13

The National Alcohol Strategy Monitoring Project: A Status Report
Canadian Centre on Substance Use and Addiction • Centre canadien sur les dépendances et l’usage de substances
Strategic Area 4: Safer Communities .................................................................... 13
Outcomes .............................................................................................................. 14
Short- and Medium-term Outcomes ...................................................................... 14
Long-term Outcomes ............................................................................................ 15
Conclusion and Next Steps ........................................................................................ 16
References ................................................................................................................. 17
Appendix 1: List of Indicators for Outputs .................................................................. 19
Restrictions for on-or off-premise sales of alcoholic beverages to intoxicated
persons ................................................................................................................. 19
Appendix 2: List of Indicators for Outcomes .............................................................. 21
Appendix 3: Information Sheets ................................................................................. 24
Output 1.1: Promotion of Moderation .................................................................... 25
Output 2.1: Health Services Responses ................................................................. 29
Output 2.2: Monitoring and Surveillance .............................................................. 30
Output 3.1: Regulating the Availability of Alcohol ................................................ 31
Output 3.2: Regulating the Affordability of Alcohol............................................... 35
Output 3.3: Marketing Restrictions ....................................................................... 41
Output 3.4: Underage Drinking............................................................................. 46
Output 4.1: Policies ............................................................................................... 48
Output 4.3: Beverages Services ............................................................................ 49
Output 4.4: Impaired Driving ................................................................................ 51
Outcome 1.1: Increased Alcohol Literacy ............................................................. 53
Outcome 1.2: Increased Adherence to the Low-Risk Drinking Guidelines ........... 55
Outcome 1.3: Reduced Alcohol-related Mortality and Morbidity ......................... 59
Outcome 2.2: Reduced Problem Drinking ............................................................ 65
Outcome 3.1: Decreased Irresponsible Alcohol Consumption ............................. 68
Outcome 3.2: Reduced Alcohol Use ...................................................................... 75
Outcome 4.3: Reduced Impaired Driving ............................................................. 81
Outcome 4.4: Reduced Intentional and Unintentional Injuries .............................. 85
The National Alcohol Strategy Monitoring Project: A Status Report
Canadian Centre on Substance Use and Addiction • Centre canadien sur les dépendances et l’usage de substances
Conflict of Interest
None

The National Alcohol Strategy Monitoring Project: A Status Report
Canadian Centre on Substance Use and Addiction • Centre canadien sur les dépendances et l’usage de substances Page 1
Executive Summary
Background
Alcohol is a legal commodity with economic and social benefits that also has a high potential for harm.
In 2007, an expert working group reached consensus on a National Alcohol Strategy (NAS) that makes
41 recommendations to help Canada move toward a culture of moderation for alcohol consumption.
Since the release of the NAS, stakeholders have been developing initiatives and investments to
move toward a culture of moderation and the National Alcohol Strategy Advisory Committee (NASAC)
has continuously overseen the implementation of the recommendations. In 2012, it became a priority
to assess the effect of these efforts and so, a year later, NASAC identified the need to track the
progress of the recommendations in terms of their implementation and impact through a structured
evaluation and monitoring framework.
The purpose of the monitoring project is to measure progress in the implementation of the NAS over
time and how that progress translates into promoting moderation and reducing the overall harm from
alcohol in Canada.
Methods
To ensure neutrality and objectivity in the development of this report, NASAC agreed to develop a
monitoring strategy that would also guide the development of future reports. Monitoring is a
systematic, ongoing process to collect, analyze and interpret accurate, up-to-date, relevant
information from various data sources and to examine changes in a phenomenon over time
(Treasury Board of Canada Secretariat, 2004). A logic model was adopted to formalize the links
between the resources available, the initiatives developed to implement the NAS and the specific
changes in knowledge, attitudes and behaviours expected to result from the NAS activities.
A Status Report
The complexity of Canada’s federal system and especially the fact that health care and the regulation
of alcohol falls largely under the authority of the provinces and territories creates significant challenges
for gathering data to evaluate the progress of a health-related national strategy for alcohol. Moreover,
the number of questions about alcohol consumption in national surveys has been markedly reduced
in recent years and this limits the ability to estimate changes in drinking-related experiences over time.
For the first release of the monitoring project, it was decided that instead of completing an overall
evaluation since 2007, a status report would be developed to document indicators for which a scan
of existing national, provincial and territorial reports, records or documents on alcohol revealed the
existence of reliable national sources of information. These indicators were summarized into a series
of information sheets.
Results
Implementation of the NAS
In addition to establishing this evaluation framework, logic model and list of associated indicators
and information sheets, a number of resources in support of the NAS recommendations have been
developed since the adoption of the NAS. For example, the Low-Risk Alcohol Drinking Guidelines
(LRDGs) have been developed, consensus on standard drink labelling guidelines has been reached

The National Alcohol Strategy Monitoring Project: A Status Report
Canadian Centre on Substance Use and Addiction • Centre canadien sur les dépendances et l’usage de substances Page 2
and a comprehensive alcohol screening, brief intervention and referral (SBIR) resource has been
available since 2012. While these resources provide a good start for building the foundation for
implementing the NAS, their uptake and implementation is varied across the provinces and territories.
For example, Éduc’alcool in Quebec and the LCBO in Ontario have invested funds in disseminating
and promoting the LRDGs, but it will be important moving forward that alcohol-related health
promotion resources are fully and consistently implemented across the provinces and territories.
One area of significant progress is that of drinking and driving policy. As recommended in the NAS,
twelve out of thirteen Canadian jurisdictions, have now adopted zero-tolerance alcohol provisions for
young or novice drivers. Furthermore, since the release of the NAS, three provinces have followed
NASAC’s precedent and adopted an alcohol strategy.
The NAS includes 16 recommendations related to the availability of alcohol. Unfortunately, due to
limited data being available, it is difficult to assess progress in this area. Data from one indicator, the
consumer price index for alcoholic beverage, indicates that since the release of the NAS, the price
paid by Canadians for alcoholic beverages has increased, but less than the price for other items.
While this only represents data from one indicator in this area, it will be important to monitor progress
with regard to alcohol availability to ensure we are moving in a direction that supports a culture of
moderation.
Alcohol-related Behaviours and Consequences
To move toward a culture of moderation, Canadians need to be aware of the LRDGs. One year after
the release of the LRDGs, survey data indicated that a quarter (26%) of Canadians had seen or heard
about the LRDGs. Nevertheless, adherence to the LRGDs appears high as 84% of the total population
report drinking within the LRDGs for chronic effects and 89% report drinking within the LRDGs for
acute effects in 2013 (Outcome Indicators 1.2.1 and 1.2.2). The prevalence of heavy drinking signals
that nearly one-fifth (18%) of Canadians aged 12 and over report to have had five drinks (four drinks
for women) on at least one occasion monthly. This proportion reaches 30.5% among young adults
(Outcome Indicator 3.1.1).
Regarding drinking among youth, the average age for having a first drink is 13.5 years old. Moreover,
39.5% of school-aged children consumed alcohol during the past year and 23.7% reported heavy
drinking (Outcome Indicators 3.1.2 to 3.1.4). While adherence to the LRDGs among the general
population was upwards of 80%, more work is needed around youth and adherence to the LRDGs
specifically in reference to the LRDG recommendation that youth should delay drinking alcohol for as
long as possible, at least until the legal drinking age.
Discussion
This status report provides some initial findings regarding progress made towards the implementation
of the NAS and promoting a culture of moderation. The limited availability and quality of data, however,
made it challenging to provide a complete picture. This limitation will need to be addressed to obtain
a better understanding of how far the implementation of NAS recommendations has been rendered
and the extent to which these recommendations have affected Canadians’ attitudes, knowledge and
behaviours related to alcohol.
Regarding the implementation of the NAS, national data on social marketing campaigns for moderate
drinking, SBIR activities and access to treatment services were unavailable for this status report.
There were also significant gaps with regards to indicators focusing on specific drinking environments
in which drinking occurs, including campuses, licenced establishments and recreational events.
Additionally, while the report includes sufficient indicators on alcohol availability, affordability and
The National Alcohol Strategy Monitoring Project: A Status Report
Canadian Centre on Substance Use and Addiction • Centre canadien sur les dépendances et l’usage de substances Page 3
marketing, the data used was limited to the existence of key policies and regulations such as outlet
density, social reference price or binding regulations on advertising, as data on the extent to which
these policies and regulations are implemented or enforced was not readily available across
jurisdictions.
Regarding alcohol-related experiences, there is a lack of data to measure Canadian’s alcohol literacy,
harms caused by others’ drinking and the proportion of those at risk for alcohol abuse versus those
at risk for alcohol dependence. Data for alcohol hospitalizations were limited in scope as they
focused exclusively on hospital stays for the treatment of conditions wholly caused by alcohol (e.g.,
alcohol dependence or alcoholic liver disease).
Conclusion and Next Steps
This project is ongoing and a monitoring framework based on a logic model is starting to bear results.
Some results from this work are already being used to inform discussions with stakeholders who
have implemented resources and activities in the past and wish to know how they should invest in
the future.
Building on this status report, the long-term goal of the monitoring strategy will be reached in future
report releases once data from multiple points in time have been collected. In that process, it will be
crucial to address gaps identified in terms of monitoring, including the limited availability and quality
of data. Conversations will be initiated with various groups, institutes and stakeholders to evaluate the
possibility of expanding and strengthening data collection to improve the number of significant
indicators.
Moving forward, it is anticipated that future releases of the monitoring project will allow for comparing
trends over time and across jurisdictions. In return, it is hoped that this will guide future investments
and lead to innovative policies that support a culture of moderation in Canada.

The National Alcohol Strategy Monitoring Project: A Status Report
Canadian Centre on Substance Use and Addiction • Centre canadien sur les dépendances et l’usage de substances Page 4
Introduction Alcohol is a legal commodity with economic and social benefits that also has a high potential for
harm. During cross-country consultations in 2005 on substance use in Canada, alcohol was
identified as an issue requiring national attention. While low levels of consumption had been associated
with health benefits for some people, higher levels of consumption were recognised to be a significant
risk factor for numerous chronic health conditions, such as heart disease, cirrhosis of the liver and
several types of cancers, as well as acute problems like injuries (e.g., from road crashes), violence
and suicide. Besides health impact, it was recognized that the harmful use of alcohol had broader
social implications within the domestic, the work and the legal spheres (Public Health Agency of
Canada, 2016). In 2002, it had been estimated that the total cost of alcohol-related harm in Canada
was $14.6 billion per year, including $7.1 billion in lost productivity, $3.3 billion for direct healthcare
costs and $3.1 billion for direct enforcement costs (Rehm et al., 2007). In this context, Health
Canada, the Alberta Alcohol and Drug Abuse Commission and the Canadian Centre on Substance
Use and Addiction (CCSA) jointly created an expert working group to study the issue and develop
recommendations for a National Alcohol Strategy (NAS).
In 2007, the group reached consensus on a strategy that recognizes the roles of all stakeholders in
the field of alcohol in minimizing alcohol-related harm (National Alcohol Strategy Working Group,
2007). The strategy makes 41 recommendations to help Canada move toward a culture of moderation
for alcohol consumption. In 2008, the National Alcohol Strategy Advisory Committee (NASAC), including
representatives and stakeholders from federal, provincial and territorial governments, addictions
organizations, universities, non-governmental organizations, and the alcohol and hospitality industries,
was mandated to lead the implementation, monitoring and evaluation of the recommendations.1
Originally, the group was co-chaired by the Chief Executive Officer, MADD Canada, the Director,
Addiction Services, Nova Scotia Department of Health and Wellness, and the CEO, CCSA.2
Since the release of the NAS, stakeholders have been developing initiatives and investments to
move toward a culture of moderation and NASAC has continuously overseen the implementation of
the 41 recommendations. In 2012, it became a priority to assess the effect of these efforts and so, a
year later NASAC identified the need to track the progress of the recommendations in terms of their
implementation and impact through a structured evaluation and monitoring framework. It was
decided that the framework should:
Provide a reference measure against which to track the progress of each recommendation;
Highlight the progress that has been made on each of the recommendations and the NAS as
a whole;
Facilitate transparency and accountability in reporting on progress related to the
recommendations;
Ensure the NAS is being implemented as planned;
Identify priority areas where further action is needed; and
Identify opportunities for collaboration and possible ways forward.
1 For a complete list of NASAC members, see www.ccsa.ca/Eng/collaboration/National-Alcohol-Strategy-Partnerships/Pages/National-
Alcohol-Strategy-Advisory-Committee.aspx.
2 In 2016, the Director, Addiction Services, Nova Scotia Department of Health and Wellness, was replaced by the Director, Alberta Health,
Government of Alberta.

The National Alcohol Strategy Monitoring Project: A Status Report
Canadian Centre on Substance Use and Addiction • Centre canadien sur les dépendances et l’usage de substances Page 5
Fulfilling these goals will inform decision-making and resource allocation for prevention, education
and treatment, as well as facilitate policy innovations to reduce the burden of alcohol use in Canada.
In 2014, to start this project, a working group of NASAC experts and collaborators met to discuss
approaches, tools and methods that should be adopted to carry out this project.3
3 The working group comprised representatives from CCSA, including the project lead, Catherine Paradis (CCSA), Sylvia Kairouz (Concordia
University) and three NASAC members, Peter Butt (University of Saskatchewan and College of Family Physicians of Canada), Louise
Nadeau (University of Montreal) and Tim Stockwell (Centre for Addictions Research of BC, University of Victoria).

The National Alcohol Strategy Monitoring Project: A Status Report
Canadian Centre on Substance Use and Addiction • Centre canadien sur les dépendances et l’usage de substances Page 6
Method The monitoring project must be grounded in evidence. To ensure neutrality and objectivity in
measuring progress, a monitoring strategy was chosen (for more details see Paradis, 2016).
Monitoring is a systematic, ongoing process to collect, analyze and interpret accurate, up-to-date,
relevant information from various data sources with a view to describing and examining changes in a
phenomenon over time (Treasury Board of Canada Secretariat, 2004). In the short term, a monitoring
strategy for the NAS will collect available data to reveal general trends in alcohol-related issues in
Canada since the release of the NAS. In the long term, analyses of these multiple data sources will
facilitate a detailed explanation of the drinking behaviours of Canadians and the environment in
which those behaviours have evolved.
Logic Model-based Monitoring
A monitoring system is based on a logic model, an often schematic tool that presents contextual
elements surrounding the phenomenon under study. It is a visual way of expressing the rationale
and theory behind a program, initiative or strategy. It illustrates the cause-and-effect relationship
between inputs and activities through to outputs and final outcomes (Treasury Board of Canada
Secretariat, 2004).
The logic model adopted for this project formalizes the causal links between four main components.
First, the inputs are the human, financial, organizational and community resources available to
implement the NAS recommendations. Second, the outputs are what NAS partners and stakeholders
do with the resources, as well as the main products or services they produce to implement the NAS.
Third, the outcomes are the specific changes in attitudes, behaviours, knowledge, skills, status or
level of functioning expected to result from NAS activities, which are most often expressed at an
individual level. Last, the impacts are population-level changes expected to result from all the
initiatives taken under the NAS.
The logic model reflects the NAS’s four strategic areas for action:
1. Health promotion, prevention and education
2. Health impacts and treatment
3. Availability of alcohol
4. Safer communities
The 41 NAS recommendations fall into these four strategic areas. While each recommendation is
important, a logic model that incorporated them all individually would be overly complex and would
lose its value as a communications, planning and evaluation tool. Therefore, within each strategic
area some recommendations were merged in order to streamline the visual presentation of the
strategy. The logic model also clusters activities into different streams of action such as legislation,
communications, educational programs, research and so on.
While different resources are deployed within each of the four strategic areas, and different activities
with various anticipated benefits for the population are expected, all activities within each area aim
to ultimately reduce alcohol-related harm in Canada and move towards a culture of moderation.
Therefore, the long-term results and impacts are essentially the same for each strategic area and the
logic model needs to express the inherent synergy between the four strategic areas, their resources
and their activities. The use of a circular logic model reflects this synergy (Figure 1).

The National Alcohol Strategy Monitoring Project: A Status Report
Canadian Centre on Substance Use and Addiction • Centre canadien sur les dépendances et l’usage de substances Page 7
Figure 1. Logic Model of the National Alcohol Strategy

The National Alcohol Strategy Monitoring Project: A Status Report
Canadian Centre on Substance Use and Addiction • Centre canadien sur les dépendances et l’usage de substances Page 8
Using Indicators to Measure Results
A structured monitoring framework requires indicators to measure results. An indicator is a statistic
or parameter that provides information on trends in the condition of a phenomenon, and has
significance extending beyond that associated with the statistic itself. Indicators are meant to
compare planned results with actual results (Treasury Board of Canada Secretariat, 2004). While
most indicators are quantitative, they can also be qualitative.
Being able to track change over time is an important component of a monitoring system. Accordingly,
this project needs to emphasize, among an array of possible indicators, those that are valid and
reliable and for which it should be possible to get data at various measure points.
A Status Report
Significant challenges surfaced in the course of establishing the monitoring strategy. Canada is a
collection of 13 provincial and territorial jurisdictions, each with their own method of collecting,
presenting and making available alcohol-related information. Assessing progress on the NAS
recommendations in Canada is equivalent to reporting on 13 different countries and so it is much
more complex than for countries consisting of a single jurisdiction. The complexity of Canada’s
federal system, and especially the fact that health care and the regulation of alcohol falls largely
under the authority of the provinces and territories, creates significant challenges for gathering data
to evaluate the progress of a health-related national strategy for alcohol. Moreover, the number of
questions about alcohol consumption in national surveys has been markedly reduced in recent years
and this limits the ability to estimate changes in drinking-related experiences over time. Initially the
framework was to include at least one indicator for every input, activity, output and outcome
identified in the logic model. However, this proved to be beyond the capacity of existing resources. A
realistic compromise was taken by shifting the focus from completing an overall evaluation including
all the indicators to establishing a status report using existing data collected in all jurisdictions.
To this end, CCSA researchers took the following steps. First, they conducted a Google search to
identify the most recent national, provincial and territorial reports, records or documents that
included alcohol indicators.4 They used the results of this search to identify indicators and sources of
information used across provinces and territories to report on alcohol. Second, they mapped these
alcohol indicators onto the logic model’s components. Third, it was decided that the status report
would only document indicators relevant to the logic model and for which the previous steps had
revealed the existence of a national source of information, allowing the researchers to obtain data
for all the jurisdictions. In other words, we identified “green light” and “red light” indicators. “Green
light” indicators are items that can be captured by current national data-collection mechanisms. Focus
on “green light” indicators does not mean that other indicators are not considered important or
relevant. It simply means that no national source of information currently exists to document the
other indicators in a sustainable manner in all jurisdictions. An example is mortality rate for alcohol
attributable conditions, which is an indicator documented by the Centre for Addictions Research of
British Columbia and used by the British Columbia Ministry of Health, but not currently available at
the national level. For this status report, such an indicator will be considered a “red light” indicator or
an item that might eventually be integrated to the surveillance framework if considerable challenges
in accessing the data at the national level are overcome.
4 For one province, British Columbia, we did not find a provincial report that included alcohol-related indicators. Therefore, Gerald Thomas,
Director, Alcohol and Gambling Policy, B.C. Ministry of Health, was contacted. He confirmed that B.C. does not have any official alcohol
indicators, but he provided a short list of measures the Ministry of Health routinely uses to produce a statement about alcohol.

The National Alcohol Strategy Monitoring Project: A Status Report
Canadian Centre on Substance Use and Addiction • Centre canadien sur les dépendances et l’usage de substances Page 9
The final list of “green light” and “red light” indicators for outputs and outcomes are presented in
Appendix 1 and 2. Separate information sheets documenting the 36 “green light” indicators are
presented in Appendix 3. This information serves as a reference measure for the implementation of
the NAS (18 output indicators), as well as for alcohol-related behaviours and consequences expected
to be related to the implementation of the NAS (18 outcome indicators). The next section of this
report summarizes the key results from these indicators.
The National Alcohol Strategy Monitoring Project: A Status Report
Canadian Centre on Substance Use and Addiction • Centre canadien sur les dépendances et l’usage de substances Page 10
Results
Implementation of the NAS
In addition to establishing this monitoring framework, logic model and list of associated indicators
and information sheets, a number of resources in support of the NAS recommendations have been
developed since the adoption of the NAS. For example, the Low-Risk Alcohol Drinking Guidelines
(LRDGs),5 which the NAS stated would provide the cornerstone for undertaking a variety of health
promotion, prevention and education initiatives, have been developed for Canadians, for specific
populations (youth6 women7) and issues (cancer8 and chronic illnesses9). Consensus on standard
drink labelling and education guidelines has been reached and documented and a comprehensive
alcohol screening, brief intervention and referral (SBIR) resource10 has been available since 2012.
These resources are an important foundation for implementing the NAS recommendations and it is
important that this progress continues. For example, further uptake and implementation of these
resources is needed. While a guidance document for standard drink labelling and education exists,11
only one territorial government (Yukon) has implemented legal requirements to display enhanced
alcohol labels (Output indicator 1.1.3). There is one known alcohol manufacturer in Saskatchewan,
Lucky Bastard Distillers, that has voluntarily implemented standard drink labelling.12 From a public
health perspective, additional jurisdictions are encouraged to move towards implementing standard
drink labelling.
The NAS includes 16 recommendations related to Strategic Area 3: Availability of Alcohol. Most of
the results pertaining to this area are based on qualitative data and, as discussed later in this report,
this limits our ability to assess whether the NAS is being implemented as planned. However,
measurement of one quantitative indicator, the consumer price index for alcoholic beverage (Output
indicator 3.2.2), suggests alcohol is becoming more affordable. Data from the consumer price index
for alcoholic beverages indicates that since the release of the NAS, the price paid by Canadians for
alcoholic beverages has increased, but less than the price for other-items (9.75% versus 10.96%).
This means that it was relatively cheaper to purchase alcohol in 2015 than it was in 2008. While this
only represents data from one indicator in this area, it is critical to closely monitor progress with
regard to alcohol availability to ensure we are moving in a direction that supports a culture of
moderation and a reduction of alcohol-related harm.13
Results from the current report have revealed encouraging results with regards to Strategic Area 4:
Safer Communities. For example, as recommended in the NAS, all but one Canadian jurisdiction has
adopted zero-tolerance alcohol provisions for young or novice drivers (Output indicator 4.4.1). In
5 Canada's Low-Risk Alcohol Drinking Guidelines (LRDGs) help Canadians moderate their alcohol consumption and reduce their immediate
and long-term alcohol-related harm. The Guidelines recommend no more than two drinks a day, 10 per week for women, and three drinks
a day, 15 per week for men, with an extra drink allowed on special occasions.
6 Please see Youth and Alcohol.
7 Please see Women-and-Alcohol.
8 Please see Cancer-and-Alcohol.
9 Please see Chronic-Illness-and-Alcohol.
10 Please see www.sbir-diba.ca.
11 Please see What is a Drink? Communication Drink Information to the Consumer.
12 Please see luckybastard.ca/dont-be-a-dumbass-drink-responsibly/.
13 For example, on June 2017, the Senate passed budget Bill C-44, which includes a section that will increase the excise duty rates on
alcohol products by two per cent and automatically adjust the rates in line with inflation on April 1 of each year, beginning in 2018.

The National Alcohol Strategy Monitoring Project: A Status Report
Canadian Centre on Substance Use and Addiction • Centre canadien sur les dépendances et l’usage de substances Page 11
follow-up reports, it will be important to assess the impact of this particular recommendation on the
rate of impaired driving and associated harm.
Finally, since the release of the NAS, three provinces (Nova Scotia, Manitoba and Alberta) have
followed NASAC’s precedent and adopted an alcohol strategy (Output indicator 4.1.1) and at least
one other province (Ontario) is in the process of developing an alcohol strategy. Stakeholders are
encouraged to continue to work with provincial and territorial governments to support the
development of provincial and territorial alcohol strategies, as an alcohol strategy can help protect
against the weakening of alcohol-related laws and regulations across the country (World Health
Organization, 2014).
Alcohol-related Behaviours and Consequences
To move toward a culture of moderation, Canadians should be aware of the LRDGs so they can make
informed choices about their drinking. One year following the release of the LRDGs, survey data
focusing on knowledge of the LRDGs (Outcome Indicator: 1.1.1) indicated that a quarter (26%) of
Canadians had seen or heard of the LRDGs. This relatively low-level of alcohol literacy in the
population should be monitored closely given the well-accepted idea that changes in beliefs and
attitudes must appear before changes in behaviour are likely to occur (Ajzen, 1991).
Nevertheless, adherence to the LRDGs appears high. Specifically, Canadian Tobacco, Alcohol and
Drugs Survey (CTADS) data show that 84% of the total population report drinking within the LRDGs
for chronic effects and 89% report drinking within the LRDGs for acute effects in 2013 (Outcome
Indicators 1.2.1 and 1.2.2). However, these high prevalence rates could be due to limitations in the
data collection methods, which might lead to a systematic overestimation of the prevalence of the
population drinking within the LRDGs.14
The indicator of heavy drinking (Outcome Indicator 3.1.1) presents a greater cause for concern. In
2014, nearly one fifth (18%) of Canadians aged 12 and over reported to have had five drinks (four
drinks for women) on at least one occasion monthly. In other words, one fifth of Canadians drink in
excess once a month and therefore, put themselves at risk for injury and harm. Nearly one-third
(30.5%) of young adults who put themselves at risk for such acute risks on a monthly basis.
The monitoring strategy has also revealed that in 2014–2015 among school-aged children, the
average age for having a first drink that was more than just a sip was 13.5 years old (Outcome
Indicator 3.1.2). More than a third (39.5%) of school-aged children consumed alcohol during the past
year (Outcome Indicator 3.1.3) and 23.7% reported heavy drinking or consuming five drinks or more
on at least one occasion (Outcome Indicator 3.1.4). By Grade 12, that proportion reaches 47.2 %
meaning that nearly half of young Canadians will have had five drinks or more on at least one
occasion before they graduate from high school. While adherence to the LRDGs among the general
population was estimated to be upwards of 80%, more work is needed around youth and adherence
to the LRDGs, specifically with regards to the LRDG recommendation that youth should delay
drinking alcohol for as long as possible, at least until the legal drinking age.
14 Specifically, these estimates are based on the alcohol consumption in the previous seven days only. Current drinkers who did not drink
in the week preceding the survey are automatically considered as not exceeding the LRDGs. In the 2013 CTADS, 40.4% of current drinkers
reported drinking in the week preceding the survey. Because it would be very unlikely that the remaining 59.6% of current drinkers — the
occasional ones — systematically drink within the LRDGs, the proportions reported are probably overestimated.

The National Alcohol Strategy Monitoring Project: A Status Report
Canadian Centre on Substance Use and Addiction • Centre canadien sur les dépendances et l’usage de substances Page 12
Discussion In the alcohol field, there is constant debate about what works and what does not to reduce alcohol-
related harm. The adoption of the NAS presents a unique opportunity to develop an evidence base
and coordinate efforts that would further the development and implementation of various initiatives.
This status report provides initial findings about progress made towards implementing the NAS and
promoting a culture of moderation. The limited availability and quality of data collected nationally,
however, have made it challenging to complete an overall evaluation of the NAS since its inception in
2007. This section of the report presents current findings in light of challenges and limitations that
will need to be addressed to obtain a better understanding of the progress made in implementing
the NAS recommendations. It will also discuss the extent to which the NAS recommendations have
affected Canadians’ attitudes, knowledge and behaviours related to alcohol.
Outputs
Strategic Area 1: Health Promotion, Prevention and Education
Raising awareness about alcohol-related harms is a key element of behaviour change. Accordingly,
across Canada, NGOs, retail alcohol monopolies and public health units, among other types of
organizations, have undertaken social marketing campaigns to raise awareness about various issues
such as the low-risk alcohol drinking guidelines, alcohol and cancer, drinking and driving, and so on.
The NAS states that establishing a common understanding of what constitutes sensible drinking is
critical to achieving a culture of moderation. A scan of the most recent jurisdictional reports was
unable to find any national source of data to document social marketing campaigns across
jurisdictions. This lack of information sources means that, for example, the resources allocated by
the Liquor Control Board of Ontario (LCBO)15 and the significant efforts of Éduc’alcool16 to promote
the LRDGs go unreported in this report. To address this gap, in future releases of this project it is
recommended that at least one indicator focusing on prevention campaigns is developed. At this
point, a suitable interim solution might be simply to document whether a provincial or territorial
ministry has allocated public funds to an alcohol-related social marketing campaign.
Strategic Area 2: Health Impacts and Treatment
The current report was also unable to identify a national source of documentation of provincial and
territorial policies and initiatives around Strategic Area 2: Health Impacts and Treatment. For instance,
the number of treatment centres offering services for Canadians who have medically diagnosed
alcohol dependence is unavailable. While a key recommendation of the NAS is the expansion of
health professionals implementing SBIR for those who might be at risk of developing or might already
have alcohol-related problems, progress on this recommendation cannot currently be measured
because data is unavailable. A SBIR resource developed by NASAC exists and the Registered Nurses’
Association of Ontario is currently working with CCSA to identify the necessary clinical resources and
tools required to facilitate the routine use of SBIR by registered nurses, nurse practitioners and
nursing students across all clinical settings. Moreover, according to a report published in July 2017
15 Since the guidelines were released in 2011, LCBO has produced nearly one million guideline brochures and promoted the LRDGs
through its free consumer publication, Food & Drink, on its website and to customers shopping in its stores across Ontario.
16 Éduc’alcool, an independent, not-for-profit organization primarily responsible for preventing alcohol abuse in the province of Quebec,
has invested a total of $7.5 million over the past five years to disseminate and promote the LRDGs. In 2017, the organisation started to
invest $1.5 million in promoting the benefits of sticking to the recommended drinking guidelines in order to convince Quebec consumers
to put their knowledge into practice.

The National Alcohol Strategy Monitoring Project: A Status Report
Canadian Centre on Substance Use and Addiction • Centre canadien sur les dépendances et l’usage de substances Page 13
by the Canadian Institute for Health Information (CIHI), over half of the provinces and territories have
SBIR included in an alcohol or mental health and addictions strategy (CIHI, 2017). Nonetheless, the
extent to which healthcare providers in general have adopted SBIR into practice is currently not
known. Moving forward, it might be useful to reach out to College of Family Physicians of Canada
(CFPC) or to the National Treatment Indicator (NTI) working group and work with them to develop
alcohol-related treatment indicators.17 The NTI working group is responsible for filling the gap between
the information required to monitor Canada’s treatment system and the information currently available.
It already compiles data on publicly funded programs from across Canada and could assist NASAC in
this regard.
Strategic Area 3: Availability of Alcohol
More than half of the indicators for outputs relate to Strategic Area 3: Availability of Alcohol. The
monitoring system used in the current report includes indicators for alcohol availability, affordability
and marketing, and underage drinking. Regulation of the marketing and affordability of alcohol
appears to have the greatest effect on alcohol consumption levels and drinking-related problems
(Burton et al., 2016). However, particularly in this strategic area, the depth and scope of the indicators
has been sacrificed for the benefit of national coverage. In other words, to find availability indicators
that are uniformly accessible across jurisdictions in Canada, it was necessary to rely on broad
indicators of implementation rather than precise measures.
While current findings document the existence of key policies and regulations, they cannot be used
to determine the extent to which certain policies and regulations are implemented or enforced. For
example, Output Indicator 3.4.1 captures minimum legal drinking age legislation by jurisdiction, but
not the extent to which this legislation is adhered to and enforced. To take another example, Quebec
appears to be tackling the issue of alcohol affordability by having adopted minimum pricing (Output
Indicator 3.2.3). Yet there are multiple loopholes in Quebec regulations that allow for a case of 24
cans of beer to be sold in Quebec for as little as $0.77 per beer (Sacy, 2015).
NASAC must decide whether these indicators should be described differently in the subsequent
releases from the monitoring project. As an illustration of this necessity, recent changes to British
Columbia’s liquor laws make it possible for bars in this province to adopt Happy Hours, which will
likely have a significant impact on drinking behaviours (Thombs et al 2008 and 2009, Sharpe &
Stockwell, 2015). Although this change should be captured by the monitoring system, it currently is
not because the indicator, in its current form, simply allows to say if a jurisdiction regulates price
promotions. To address this problem, a possible solution could be to use the data established in this
report as a baseline to document if there is a strengthening or an easing of existing policies and
regulations across jurisdictions. NASAC will need to reflect upon and provide guidance on this issue.
Strategic Area 4: Safer Communities
Finally, the NAS affirms the importance of communities and that they can foster a culture of moderation
and create safer drinking environments. Unfortunately, there is an absence of national data sources
to monitor progress towards recommendations in Strategic Area 4: Safer Communities. Besides the
indicator relating to written policy on alcohol, the only other two indicators for which data were obtained
relate to the existence of legally required responsible beverage service training programs and the
maximum legal blood alcohol concentration when driving a vehicle (Output Indicators 4.3.1 and 4.4.1).
The status report does not include indicators focusing on the various social contexts in which drinking
in general and drinking in excess can occur, including college, university, licensed establishments
17 Please see National Treatment Indicators.
The National Alcohol Strategy Monitoring Project: A Status Report
Canadian Centre on Substance Use and Addiction • Centre canadien sur les dépendances et l’usage de substances Page 14
and recreational events. Given that when and where individuals drink has an impact on their alcohol
intake (Callinan, Livingston, Room, & Dietze, 2016; Huckle, Gruenewald, & Ponicki, 2016; Mustonen,
Mäkelä, & Lintonen, 2016), there is a clear need to identify and develop indicators to document
drinking environments. A potential indicator that could eventually be documented is a jurisdiction’s
proportion of municipalities with a formal municipal alcohol policy. Another indicator might be the
proportion of colleges and university with a formal alcohol policy, a type of information that could be
gathered through the Postsecondary Education Partnership — Alcohol Harms (PEP-AH).18
Outcomes
Short- and Medium-term Outcomes
For most short- and medium-term outcomes across all four strategic areas, the monitoring strategy
captured a wide array of behaviours. Nonetheless, three notable gaps were identified.
First, the only data source that measures Canadians’ knowledge and attitudes toward alcohol issues
is the 2012 Canadian Alcohol and Drugs Use Monitoring Survey (CADUMS), which had a question
asking respondents if they had “ever seen or heard about Canada’s low risk alcohol drinking
guidelines?” Unfortunately, this question was not kept in CTADS, which replaced CADUMS. The
removal of this question and the lack of any other questions about knowledge and attitudes about
alcohol issues leaves an important gap in our ability to evaluate change in Canadians’ alcohol
literacy subsequent to the implementation of the NAS.
Secondly, the monitoring strategy used for this report has revealed the absence of data focusing on
harms caused by others’ drinking. Lessons learned from the experience of regulating tobacco
indicate that being able to identify the harms associated with second-hand smoke was a key step in
mobilizing efforts to reduce tobacco-related harms. One way to further the implementation of policies
supporting a culture of moderation could be, as was done with tobacco, to show that excessive
drinking of alcohol harms others besides the drinker. For example, if it could be documented that a
significant proportion of the relatives of excessive drinkers are abused, threatened, hurt or
neglected, it might be easier to implement policies to control the availability and affordability of
alcohol. In our current monitoring strategy it is not possible to make this demonstration because all
questions on harms caused by others have been removed from national surveys, as have questions
about risky behaviours associated with alcohol use. This gap affects our ability to evaluate the
association between policies, regulations and outcomes.
Thirdly, the current report was unable to distinguish between the proportion of Canadians who are at
risk for alcohol abuse versus those who are at risk for alcohol dependence. In 2015, the Canadian
Community Health Survey (CCHS) included questions about alcohol dependence and alcohol
interference (alcohol abuse), but those questions were optional and, unfortunately, only British
Columbia adopted the questions. Hence, for this status report, we had to rely on the CCHS Mental
Health survey that merges both groups of drinkers (Outcome Indicator 2.2.1). It was also not possible
to document access to alcohol treatment services by Canadians who are alcohol dependent. This gap
is significant given that access to treatment plays an important role in helping people to reduce their
drinking (Huebner & Kantor, 2011). In this case, as was suggested in another context, NASAC might
seek to collaborate with the NTI working group to get an accurate picture of the situation.
18 PEP-AH joins together Canadian colleges and universities that aim to reduce alcohol-related harms among their students. PEP-AH is
proposing an evidence-based approach, common indicators, and an open sharing of strategies and results.

The National Alcohol Strategy Monitoring Project: A Status Report
Canadian Centre on Substance Use and Addiction • Centre canadien sur les dépendances et l’usage de substances Page 15
Long-term Outcomes
For long-term outcomes, there is a lack of comprehensive measures for alcohol-related mortality and
morbidity. While alcohol is linked to over 200 different diseases, conditions and types of injuries
(Public Health Agency of Canada, 2016), the only currently available data are Mortality Rate from
Alcoholic Liver Disease (Outcome Indicator 1.3.1), Deaths Due to Alcohol Use Disorders (Outcome
Indicator 1.3.2) and Hospitalizations Attributable to Alcohol (Outcome Indicator 1.3.3). However,
Young and Jesseman (2014) showed that such indicators focus only on the small proportion of
Canadians who are admitted to a hospital with the primary diagnosis of an alcoholic liver disease or
a substance use disorder requiring treatment for the severe and direct harms associated with
substance use. Such indicators do not include Canadians admitted to hospital for accidents or
injuries that happened as a result of alcohol. Hence, we must recognize that the results presented in
this status report in this area only present a small portion of the issue.
As this report was being prepared, CIHI released a new indicator for Hospitalizations Attributable to
Alcohol.19 Still, this new indicator alone will still not provide the ability to fully estimate the seriousness
of harm associated with alcohol use. The magnitude of hospital use due to alcohol harm will remain
underestimated as CIHI’s indicator does not include hospitalizations due to partially alcohol-
attributable conditions (e.g., cancer, motor vehicle traffic injuries, heart disease) and that in other
contexts, have been estimated to account for as much as 70% of all alcohol-related hospitalizations
(Public Health England, 2017, in CIHI 2017).
19 Subsequently to this report’s data collection, CIHI introduced a new indicator focusing on hospitalizations that are 100% caused by the
harmful consumption of alcohol. Based on this new indicator, in 2015–2016, there were about 77,000 hospitalizations entirely caused by
alcohol, there were more hospitalizations in the territories than in the provinces and hospitalization rates were higher in the west than in
the east, with the exception of Nova Scotia (CIHI, 2017).

The National Alcohol Strategy Monitoring Project: A Status Report
Canadian Centre on Substance Use and Addiction • Centre canadien sur les dépendances et l’usage de substances Page 16
Conclusion and Next Steps The monitoring project aims to provide a truly comprehensive picture of the implementation of the
National Alcohol Strategy and how it translates into promoting moderation and reducing the overall
harm from alcohol. This project is ongoing, and its monitoring framework based on a logic model is
starting to bear fruit. Some results are already being used to inform discussions with stakeholders
who have implemented resources and activities in the past and wish to know how they should invest
in the future.
Building on this status report, the long-term goal of the monitoring project will be reached in future
releases once data from multiple measure points have been collected. Only then can progress made
on the 41 NAS recommendations effectively be tracked. In that process, it will be crucial to address
gaps identified in terms of monitoring, including the limited availability and quality of data. It is hoped
that this status report will serve as a call to action to increase awareness about the importance of
collecting data and monitoring trends.
Better collaboration and cooperation is needed among stakeholders to describe initiative, activity
and policy gaps across the four strategic areas, and to identify population subgroups that could
require greater attention due to their susceptibility to alcohol harm. A first step would be for
stakeholders to agree on a carefully selected set of indicators to focus on moving forward. Moreover,
during the coming year, groups such as the Canadian Paediatric Surveillance Program, as well as
other previously named groups (PEP-AH, CFPC and NTI), will be approached to evaluate the
possibility of expanding and strengthening data collection to improve the number of significant
indicators. The possibility of collaboration with CIHI, which over the past year has brought together
data across a range of sources to monitor the burden of alcohol on the health system will be
explored. Conversations will be initiated with Health Canada to discuss the possibility of the agency
revising the content of the next CTADS and the analyses related to drinking within the LRDGs.
By taking those steps, it is anticipated that future releases of the monitoring project will allow for
comparing trends over time and across jurisdictions. In return, it is hoped that this comparison will
guide future investments and lead to innovative policies that support a culture of moderation in
Canada.
Finally, the development of this first status report underscores the importance of having a
comprehensive evaluation strategy built into the strategy development process itself, as this is one
of the reasons why it is now not possible to thoroughly evaluate the impact of key initiatives like the
LRDGs and the SBIR resource that were developed in response to the adoption of the NAS. In the
midst of the federal plan to legalize non-medical cannabis use, a lesson learned from the alcohol
field should be to intertwine an evaluation plan into all aspect of the legislative process. This plan
should include the identification of key indicators and gathering baseline data to monitor the impacts
of legalizing the personal use and possession of cannabis in Canada on the health of Canadians,
society as a whole, the economy and public health.

The National Alcohol Strategy Monitoring Project: A Status Report
Canadian Centre on Substance Use and Addiction • Centre canadien sur les dépendances et l’usage de substances Page 17
References Ajzen, I. (1991). The theory of planned behavior. Organizational Behavior and Human Decision Processes,
50(2), 179–211.
Burton, R., Henn, C., Lavoie, D., O'Connor, R., Perkins, C., Sweeney, K., ... & Sheron, N. (2017). A rapid evidence
review of the effectiveness and cost-effectiveness of alcohol control policies: an English perspective. The
Lancet, 389, 1558–1580.
Callinan, S., Livingston, M., Room, R., & Dietze, P. (2016). Drinking contexts and alcohol consumption: how
much alcohol is consumed in different Australian locations? Journal of Studies on Alcohol and Drugs,
77(4), 612–619.
Canadian Institute for Health Information. (2017). Alcohol harm in Canada: examining hospitalizations entirely
caused by alcohol and strategies to reduce alcohol harm. Ottawa, Ont.: Author.
Giesbrecht, N., Wettlaufer, A., April, N., Asbridge, M., Cukier, S., Mann, R., … & Vallance, K. (2013). Strategies
to reduce alcohol-related harms and costs in Canada: a comparison of provincial policies. Toronto, Ont.:
Centre for Addiction and Mental Health.
Huebner, R.B., & Kantor, L.W. (2011). Advances in alcoholism treatment. Alcohol Research & Health 33(4),
295–299.
Huckle, T., Gruenewald, P., & Ponicki, W.R. (2016). Context‐specific drinking risks among young people.
Alcoholism: Clinical and Experimental Research, 40(5), 1129–1135.
Mustonen, H., Mäkelä, P., & Lintonen, T. (2016). Situational drinking in private and public locations: a
multilevel analysis of blood alcohol level in Finnish drinking occasions. Drug and Alcohol Review, 35(6),
772–784.
Paradis, C. (2016). Canada’s National Alcohol Strategy. it’s time to assess progress. Canadian Journal of
Program Evaluation, 31(2), 232–241.
Public Health Agency of Canada. (2016). The Chief Public Health Officer’s report on the state of public health in
Canada, 2015: alcohol consumption in Canada. Retrieved from
www.canada.ca/content/dam/canada/health-canada/migration/healthy-
canadians/publications/department-ministere/state-public-health-alcohol-2015-etat-sante-publique-
alcool/alt/state-phac-alcohol-2015-etat-aspc-alcool-eng.pdf.
Public Health England. (2017) Local alcohol profiles for England. Retrieved from
www.gov.uk/government/collections/local-alcohol-profiles-for-england-lape.
Rehm, J., Gnam, W., Popova, S., Baliunas, D., Brochu, S., Fischer, B., ... & Taylor, B. (2007). The costs of
alcohol, illegal drugs, and tobacco in Canada, 2002. Journal of Studies on Alcohol and Drugs, 68(6), 886–
895.
Sacy, H. (2015). « Prendre un verre, prendre un coup. » Debanaliser et agir! Conference de l’ASPQ, 19e
Journées annuelles de santé publique. Retrieved from
www.inspq.qc.ca/sites/default/files/jasp/archives/2015/JASP2015_ConferenceASPQ_HSacy.pdf.
Sharpe, C., & Stockwell, T. (2015). The introduction of happy hours to bars, pubs and clubs in Victoria, BC: did
alcohol become cheaper? (CARBC Bulletin #13.) Victoria, B.C.: University of Victoria.
Thombs, D.L., Dodd, V.J., Pokorny, S.B., Omli, M.R., O’Mara, R., Webb, M.C., … Werch, C.C. (2008). Drink
specials and the intoxication levels of patrons exiting college bars. American Journal of Health Behavior,
32, 411–419.
Thombs, D.L., O’Mara, R., Dodd, V.J., Hou, W., Merves, M.L., Weiler, R.M., … Werch, C.C. (2009). A field study of
bar-sponsored drink specials and their association with patron intoxication. Journal of Studies on Alcohol
and Drugs, 70, 206–214.

The National Alcohol Strategy Monitoring Project: A Status Report
Canadian Centre on Substance Use and Addiction • Centre canadien sur les dépendances et l’usage de substances Page 18
Treasury Board of Canada Secretariat. (2004). Supporting Effective Evaluations: A Guide to Developing
Performance Measurement Strategies. Retrieved from www.canada.ca/en/treasury-board-
secretariat/services/audit-evaluation/centre-excellence-evaluation/guide-developing-performance-
measurement-strategies.html
World Health Organization. (2014). Global status report on alcohol and health, 2014. Geneva, Switz.: Author.
Young, M.M., & Jesseman, R.J. (2014). The impact of substance use disorders on hospital use. Ottawa, Ont.:
Canadian Centre on Substance Use and Addiction.

The National Alcohol Strategy Monitoring Project: A Status Report
Canadian Centre on Substance Use and Addiction • Centre canadien sur les dépendances et l’usage de substances Page 19
Appendix 1: List of Indicators for Outputs
Outputs
Jurisdictions
using the
indicator Data source
Categories for
presentation
Strategic Area 1, Indicators for Outputs: Health Promotion, Prevention and Education
Output 1.1 PROMOTION OF MODERATION
Indicator 1.1.1 National alcohol drinking guidelines CCSA CCSA National
Indicator 1.1.2 Standard drink labels CCSA CCSA National
Indicator 1.1.3 Labelling policies WHO PHO Province/Territory
Strategic Area 2, Indicators for Outputs: Health Impacts and Treatment
Output 2.1 HEALTH SERVICES RESPONSES
Indicator 2.1.1 Screening, Brief Intervention and
Referral
CCSA CCSA National
Output 2.2 MONITORING AND SURVEILLANCE
Indicator 2.2.1 National monitoring system WHO Statistics Canada Province/Territory
Output 2.3 RESEARCH
Strategic Area 3, Indicators for Outputs: Availability
Output 3.1 REGULATING THE AVAILABILITY OF ALCOHOL
Indicator 3.1.1 Outlet density Que., N.S., Alta.
Indicator 3.1.2 Restrictions for on-or off-premise
sales of alcoholic beverages to
intoxicated persons
WHO CAMH Province/Territory
Indicator 3.1.4 Time restrictions for sales of
alcoholic beverages
WHO CAMH Province/Territory
Indicator 3.1.5 Location restrictions for sales of
alcoholic beverages
WHO CAMH Province/Territory
Output 3.2 REGULATING THE AFFORDABILITY OF ALCOHOL
Indicator 3.2.1 Excise tax on alcoholic beverages WHO Canada Revenue
Agency, Excise Duty
Rate
National
Indicator 3.2.2 Consumer price index for alcoholic
beverages
Que CANSIM 326-0021 Province/Territory
Indicator 3.2.3 Mandatory minimum pricing for on-
or off-premise sales of alcoholic
beverages
CCSA Updated CCSA report
2014
Province/Territory
The National Alcohol Strategy Monitoring Project: A Status Report
Canadian Centre on Substance Use and Addiction • Centre canadien sur les dépendances et l’usage de substances Page 20
Outputs
Jurisdictions
using the
indicator Data source
Categories for
presentation
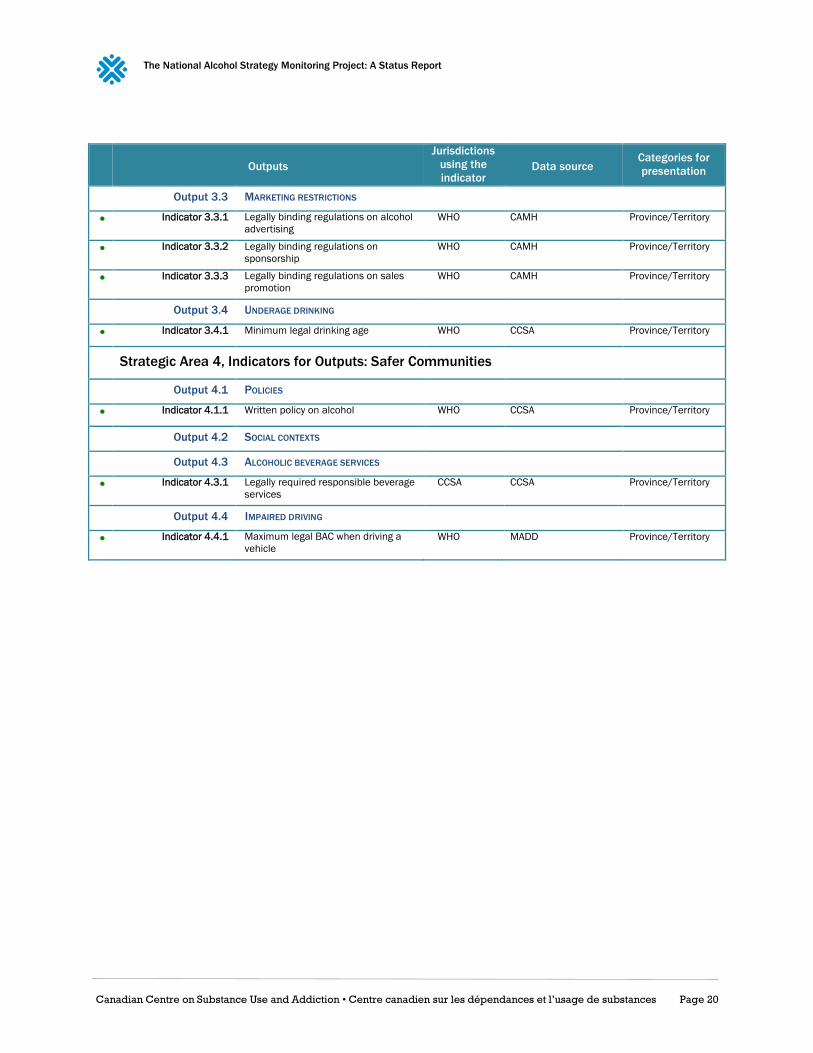
Output 3.3 MARKETING RESTRICTIONS
Indicator 3.3.1 Legally binding regulations on alcohol
advertising
WHO CAMH Province/Territory
Indicator 3.3.2 Legally binding regulations on
sponsorship
WHO CAMH Province/Territory
Indicator 3.3.3 Legally binding regulations on sales
promotion
WHO CAMH Province/Territory
Output 3.4 UNDERAGE DRINKING
Indicator 3.4.1 Minimum legal drinking age WHO CCSA Province/Territory
Strategic Area 4, Indicators for Outputs: Safer Communities
Output 4.1 POLICIES
Indicator 4.1.1 Written policy on alcohol WHO CCSA Province/Territory
Output 4.2 SOCIAL CONTEXTS
Output 4.3 ALCOHOLIC BEVERAGE SERVICES
Indicator 4.3.1 Legally required responsible beverage
services
CCSA CCSA Province/Territory
Output 4.4 IMPAIRED DRIVING
Indicator 4.4.1 Maximum legal BAC when driving a
vehicle
WHO MADD Province/Territory
The National Alcohol Strategy Monitoring Project: A Status Report
Canadian Centre on Substance Use and Addiction • Centre canadien sur les dépendances et l’usage de substances Page 21
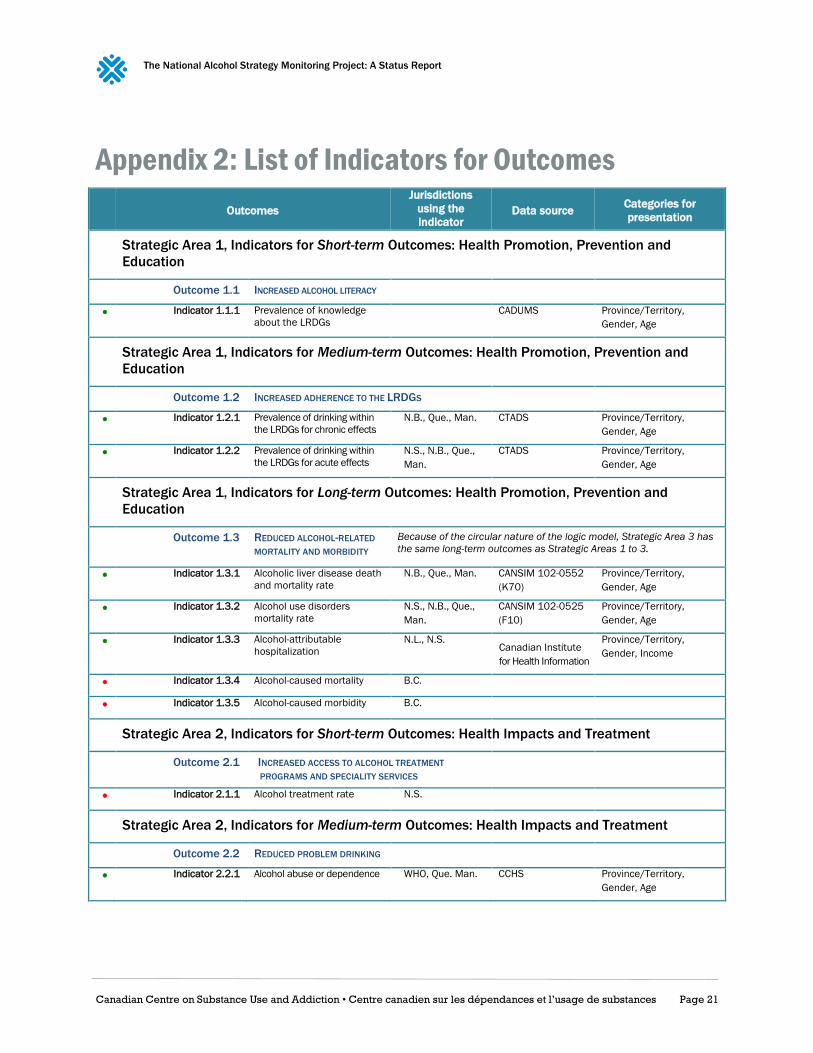
Appendix 2: List of Indicators for Outcomes
Outcomes
Jurisdictions
using the
indicator Data source
Categories for
presentation
Strategic Area 1, Indicators for Short-term Outcomes: Health Promotion, Prevention and
Education
Outcome 1.1 INCREASED ALCOHOL LITERACY
Indicator 1.1.1 Prevalence of knowledge
about the LRDGs
CADUMS Province/Territory,
Gender, Age
Strategic Area 1, Indicators for Medium-term Outcomes: Health Promotion, Prevention and
Education
Outcome 1.2 INCREASED ADHERENCE TO THE LRDGS
Indicator 1.2.1 Prevalence of drinking within
the LRDGs for chronic effects
N.B., Que., Man. CTADS Province/Territory,
Gender, Age
Indicator 1.2.2 Prevalence of drinking within
the LRDGs for acute effects
N.S., N.B., Que.,
Man.
CTADS Province/Territory,
Gender, Age
Strategic Area 1, Indicators for Long-term Outcomes: Health Promotion, Prevention and
Education
Outcome 1.3 REDUCED ALCOHOL-RELATED
MORTALITY AND MORBIDITY
Because of the circular nature of the logic model, Strategic Area 3 has
the same long-term outcomes as Strategic Areas 1 to 3.
Indicator 1.3.1 Alcoholic liver disease death
and mortality rate
N.B., Que., Man. CANSIM 102-0552
(K70)
Province/Territory,
Gender, Age
Indicator 1.3.2 Alcohol use disorders
mortality rate
N.S., N.B., Que.,
Man.
CANSIM 102-0525
(F10)
Province/Territory,
Gender, Age
Indicator 1.3.3 Alcohol-attributable
hospitalization
N.L., N.S. Canadian Institute
for Health Information
Province/Territory,
Gender, Income
Indicator 1.3.4 Alcohol-caused mortality B.C.
Indicator 1.3.5 Alcohol-caused morbidity B.C.
Strategic Area 2, Indicators for Short-term Outcomes: Health Impacts and Treatment
Outcome 2.1 INCREASED ACCESS TO ALCOHOL TREATMENT
PROGRAMS AND SPECIALITY SERVICES
Indicator 2.1.1 Alcohol treatment rate N.S.
Strategic Area 2, Indicators for Medium-term Outcomes: Health Impacts and Treatment
Outcome 2.2 REDUCED PROBLEM DRINKING
Indicator 2.2.1 Alcohol abuse or dependence WHO, Que. Man. CCHS Province/Territory,
Gender, Age
The National Alcohol Strategy Monitoring Project: A Status Report
Canadian Centre on Substance Use and Addiction • Centre canadien sur les dépendances et l’usage de substances Page 22
Outcomes
Jurisdictions
using the
indicator Data source
Categories for
presentation
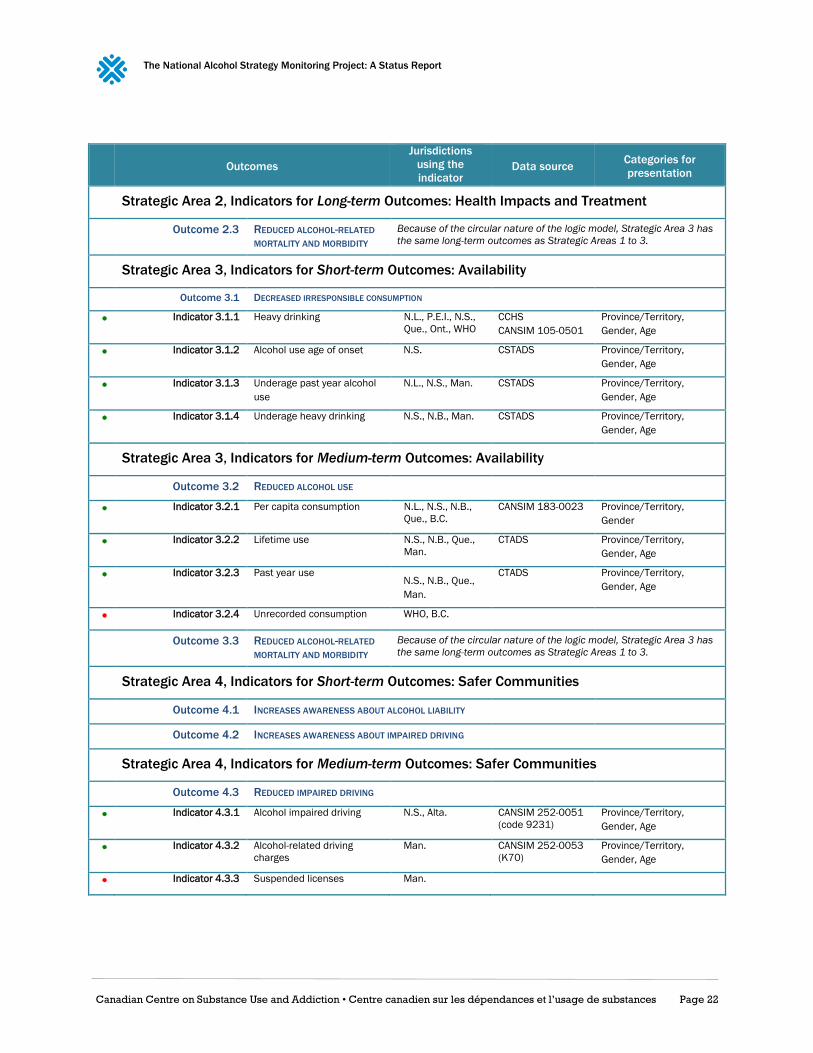
Strategic Area 2, Indicators for Long-term Outcomes: Health Impacts and Treatment
Outcome 2.3 REDUCED ALCOHOL-RELATED
MORTALITY AND MORBIDITY
Because of the circular nature of the logic model, Strategic Area 3 has
the same long-term outcomes as Strategic Areas 1 to 3.
Strategic Area 3, Indicators for Short-term Outcomes: Availability
Outcome 3.1 DECREASED IRRESPONSIBLE CONSUMPTION
Indicator 3.1.1 Heavy drinking N.L., P.E.I., N.S.,
Que., Ont., WHO
CCHS
CANSIM 105-0501
Province/Territory,
Gender, Age
Indicator 3.1.2 Alcohol use age of onset N.S. CSTADS Province/Territory,
Gender, Age
Indicator 3.1.3 Underage past year alcohol
use
N.L., N.S., Man. CSTADS Province/Territory,
Gender, Age
Indicator 3.1.4 Underage heavy drinking N.S., N.B., Man. CSTADS Province/Territory,
Gender, Age
Strategic Area 3, Indicators for Medium-term Outcomes: Availability
Outcome 3.2 REDUCED ALCOHOL USE
Indicator 3.2.1 Per capita consumption N.L., N.S., N.B.,
Que., B.C.
CANSIM 183-0023 Province/Territory,
Gender
Indicator 3.2.2 Lifetime use N.S., N.B., Que.,
Man.
CTADS Province/Territory,
Gender, Age
Indicator 3.2.3 Past year use N.S., N.B., Que.,
Man.
CTADS Province/Territory,
Gender, Age
Indicator 3.2.4 Unrecorded consumption WHO, B.C.
Outcome 3.3 REDUCED ALCOHOL-RELATED
MORTALITY AND MORBIDITY
Because of the circular nature of the logic model, Strategic Area 3 has
the same long-term outcomes as Strategic Areas 1 to 3.
Strategic Area 4, Indicators for Short-term Outcomes: Safer Communities
Outcome 4.1 INCREASES AWARENESS ABOUT ALCOHOL LIABILITY
Outcome 4.2 INCREASES AWARENESS ABOUT IMPAIRED DRIVING
Strategic Area 4, Indicators for Medium-term Outcomes: Safer Communities
Outcome 4.3 REDUCED IMPAIRED DRIVING
Indicator 4.3.1 Alcohol impaired driving N.S., Alta. CANSIM 252-0051
(code 9231)
Province/Territory,
Gender, Age
Indicator 4.3.2 Alcohol-related driving
charges
Man. CANSIM 252-0053
(K70)
Province/Territory,
Gender, Age
Indicator 4.3.3 Suspended licenses Man.
The National Alcohol Strategy Monitoring Project: A Status Report
Canadian Centre on Substance Use and Addiction • Centre canadien sur les dépendances et l’usage de substances Page 23
Outcomes
Jurisdictions
using the
indicator Data source
Categories for
presentation
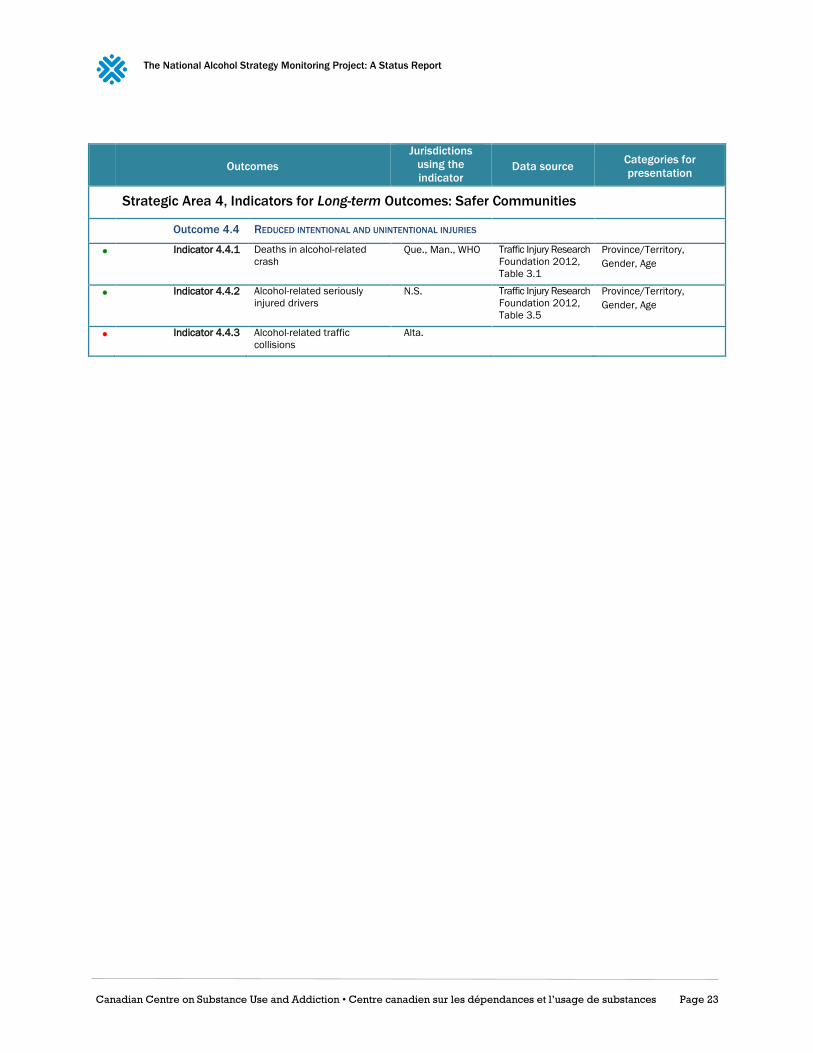
Strategic Area 4, Indicators for Long-term Outcomes: Safer Communities
Outcome 4.4 REDUCED INTENTIONAL AND UNINTENTIONAL INJURIES
Indicator 4.4.1 Deaths in alcohol-related
crash
Que., Man., WHO Traffic Injury Research
Foundation 2012,
Table 3.1
Province/Territory,
Gender, Age
Indicator 4.4.2 Alcohol-related seriously
injured drivers
N.S. Traffic Injury Research
Foundation 2012,
Table 3.5
Province/Territory,
Gender, Age
Indicator 4.4.3 Alcohol-related traffic
collisions
Alta.

The National Alcohol Strategy Monitoring Project: A Status Report
Canadian Centre on Substance Use and Addiction • Centre canadien sur les dépendances et l’usage de substances Page 24
Appendix 3: Information Sheets This Appendix presents separate information sheets documenting “green light” indicators. Each
information sheet is divided into three main parts:
The first part includes a general description of the indicator, a method of estimation and a
description of the sources of information used to produce the data pertaining to the
indicator.
The second part presents the results obtained through an analysis of the information
sources.
The third part presents the highlights.
In Canada, few alcohol-related initiatives are implemented nationally. Decisions about prevention,
treatment, availability, promotion, legislation and regulation are almost exclusively made at the
provincial level. When the data allow it, this project will present its findings in a way that highlights
differences among provinces, so that legislators can draw on the experience of their counterparts in
other provinces.
Moreover, given the significant variations in alcohol-related behaviours and consequences among
social groups, when the data allow it, we gave priority to a presentation of the findings that highlights
such differences. Since the only comparisons possible are by gender and age group, we will report
the overall findings and the findings specific to each sub-group.
The National Alcohol Strategy Monitoring Project: A Status Report
Canadian Centre on Substance Use and Addiction • Centre canadien sur les dépendances et l’usage de substances Page 25
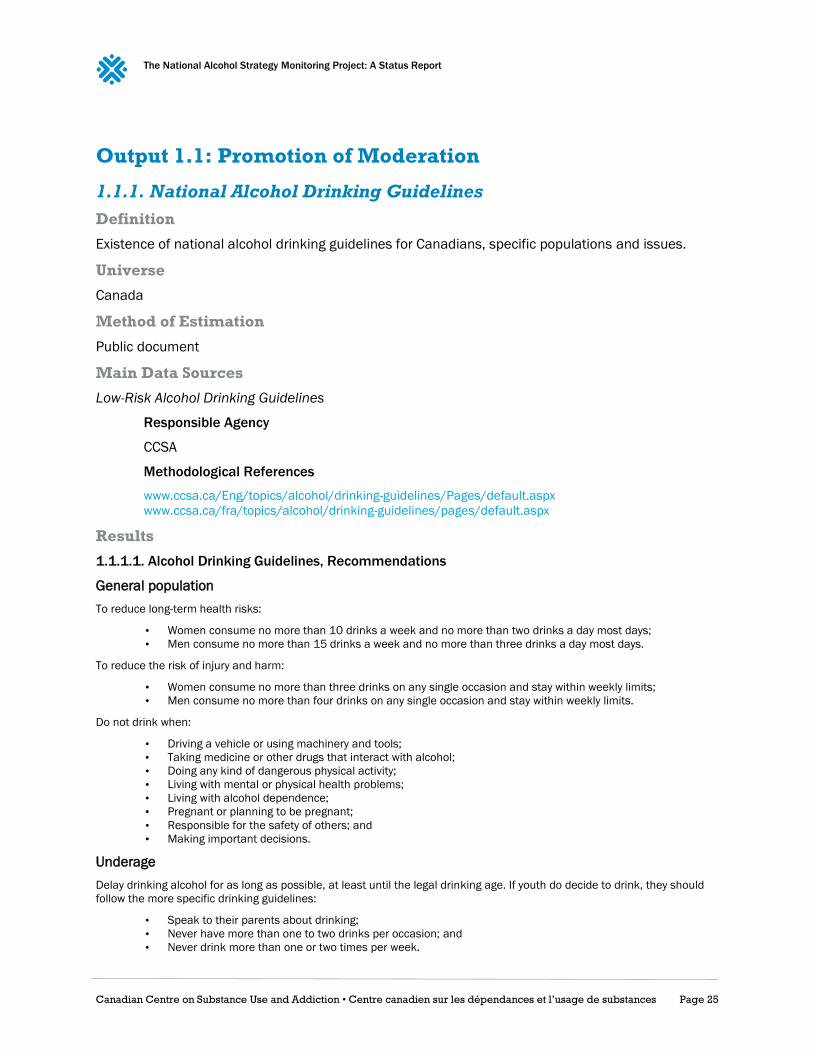
Output 1.1: Promotion of Moderation
1.1.1. National Alcohol Drinking Guidelines
Definition
Existence of national alcohol drinking guidelines for Canadians, specific populations and issues.
Universe
Canada
Method of Estimation
Public document
Main Data Sources
Low-Risk Alcohol Drinking Guidelines
Responsible Agency
CCSA
Methodological References
www.ccsa.ca/Eng/topics/alcohol/drinking-guidelines/Pages/default.aspx
www.ccsa.ca/fra/topics/alcohol/drinking-guidelines/pages/default.aspx
Results
1.1.1.1. Alcohol Drinking Guidelines, Recommendations
General population
To reduce long-term health risks:
• Women consume no more than 10 drinks a week and no more than two drinks a day most days;
• Men consume no more than 15 drinks a week and no more than three drinks a day most days.
To reduce the risk of injury and harm:
• Women consume no more than three drinks on any single occasion and stay within weekly limits;
• Men consume no more than four drinks on any single occasion and stay within weekly limits.
Do not drink when:
• Driving a vehicle or using machinery and tools;
• Taking medicine or other drugs that interact with alcohol;
• Doing any kind of dangerous physical activity;
• Living with mental or physical health problems;
• Living with alcohol dependence;
• Pregnant or planning to be pregnant;
• Responsible for the safety of others; and
• Making important decisions.
Underage
Delay drinking alcohol for as long as possible, at least until the legal drinking age. If youth do decide to drink, they should
follow the more specific drinking guidelines:
• Speak to their parents about drinking;
• Never have more than one to two drinks per occasion; and
• Never drink more than one or two times per week.
The National Alcohol Strategy Monitoring Project: A Status Report
Canadian Centre on Substance Use and Addiction • Centre canadien sur les dépendances et l’usage de substances Page 26
18/19 to 24, and over 65
Females never have more than two drinks a day and never more than 10 drinks a week
Males never have more than three drinks a day and never more than 15 drinks a week
Highlights
Low-risk alcohol drinking guidelines for Canadians generally and for specific populations have been
available since 2011.

The National Alcohol Strategy Monitoring Project: A Status Report
Canadian Centre on Substance Use and Addiction • Centre canadien sur les dépendances et l’usage de substances Page 27
1.1.2. Standard Drink Labels
Definition
Existence of standard drink labelling guidelines.
Universe
Canada
Method of Estimation
Public document
Main Data Sources
What Is a Drink? Communicating Drink Information to the Consumer
Responsible Agency
CCSA
Source
www.ccsa.ca/Resource%20Library/CCSA-Communicating-Drink-Information-to-Consumers-Report-
2015-en.pdf
www.ccsa.ca/Resource%20Library/CCSA-Communicating-Drink-Information-to-Consumers-Report-
2015-fr.pdf
Results
1.1.2.1. Standard Drink Labelling, Recommendations
The number of drinks in a container must be rounded to one decimal place;
If using a written statement, the format must be “contains/contient: X.X drinks/verres” or
“X.X drinks/verres”;
If using a pictogram, it must also include the written statement “contains X.X drinks/contient
X,X verres” or “X.X drinks/X,X verres”;
At a minimum, the drinks statement/pictogram must be readily visible to the consumer
under the customary conditions of purchase and used as specified in the Food and Drug
Regulations, and should be located in close proximity to the alc./vol information on the label;
The drinks statement/pictogram must not contradict requirements under the Product
Identification Standards defined by the Canadian Association of Liquor Jurisdictions (2004);
The drinks statement/pictogram must not contradict requirements under the Food and
Drugs Act Regulations or the Consumer Packaging and Labelling Act Regulations; and
The drinks statement/pictogram must be informative and not be implemented in such a way
that would direct consumers towards beverage alcohol products of higher alcohol content.
Highlights
Standard drink labelling guidelines have been available in Canada since 2015.

The National Alcohol Strategy Monitoring Project: A Status Report
Canadian Centre on Substance Use and Addiction • Centre canadien sur les dépendances et l’usage de substances Page 28
1.1.3. Labelling Policies
Definition
Legal requirement to display health warning or standard drink labels that provide information to the
buyer of the dangers associated with use of the product and the number of standard alcoholic drinks
in the container.
Universe
Canada
Method of Estimation
Public document
Main Data Sources
Focus On: Standard Alcohol Labels
Responsible Agency
Public Health Ontario
Source
www.publichealthontario.ca/fr/eRepository/FocusOn-Standard_Alcohol_Labels_2015.pdf
Results
1.1.3.1. Labelling Policies
Can. N.L. P.E.I. N.S. N.B. Que. Ont. Man. Sask. Alta. B.C. Y.T. N.W.T. Nvt.
Legally Required
Health Labels on
Alcohol Containers No No No No No No No No No No No Yes* Yes No
Legally Required
Standard Drink Labels
on Alcohol Containers No No No No No No No No No No No No No No
* Not legislation, but a policy of the Yukon Liquor Board.
Highlights
With the exception of the Northwest Territories, no Canadian province or territory legally
requires health warning labels on alcohol containers.
No Canadian province or territory legally requires standard drink labels on alcohol containers.

The National Alcohol Strategy Monitoring Project: A Status Report
Canadian Centre on Substance Use and Addiction • Centre canadien sur les dépendances et l’usage de substances Page 29
Output 2.1: Health Services Responses
2.1.1. Alcohol Screening, Brief Intervention and Referral
Definition
Existence of an alcohol screening, brief intervention and referral process.
Universe
Canada
Method of Estimation
Public document
Main Data Sources
Alcohol Screening, Brief Interventions & Referral
Responsible Agencies
College of Family Physicians of Canada
CCSA
Source
www.sbir-diba.ca
Results
2.1.1.1. Screening, Brief Interventions and Referral, Overview
“Alcohol Screening, Brief Intervention & Referral: Helping patients reduce alcohol-related risks” is a
resource for Canadian family physicians, nurse practitioners and other healthcare professionals. The
resource provides access to evidence-informed guidance and resources to assist healthcare professionals
help patients better manage their alcohol consumption. The resource includes three steps.
1. Screening and Assessment: Identify patients who drink alcohol beyond low-risk consumption levels and further assess
their at-risk status based on reported alcohol use and other relevant clinical information.
• Screen for at risk drinking
• Determine level of risk
2. Brief Intervention and Referral: Communicate patient’s risk status, help patient identify goals and readiness to change,
make referrals as appropriate.
• Conduct brief intervention
• Assess readiness to change
• Refer to appropriate resources
3. Follow-up and Support: Follow up with patients, monitor withdrawal symptoms, and review goals and progress.
• Assess progress towards goals
• Monitor and manage withdrawal
Highlights
Alcohol screening, brief intervention and referral tool has been available for health professionals
since 2012.
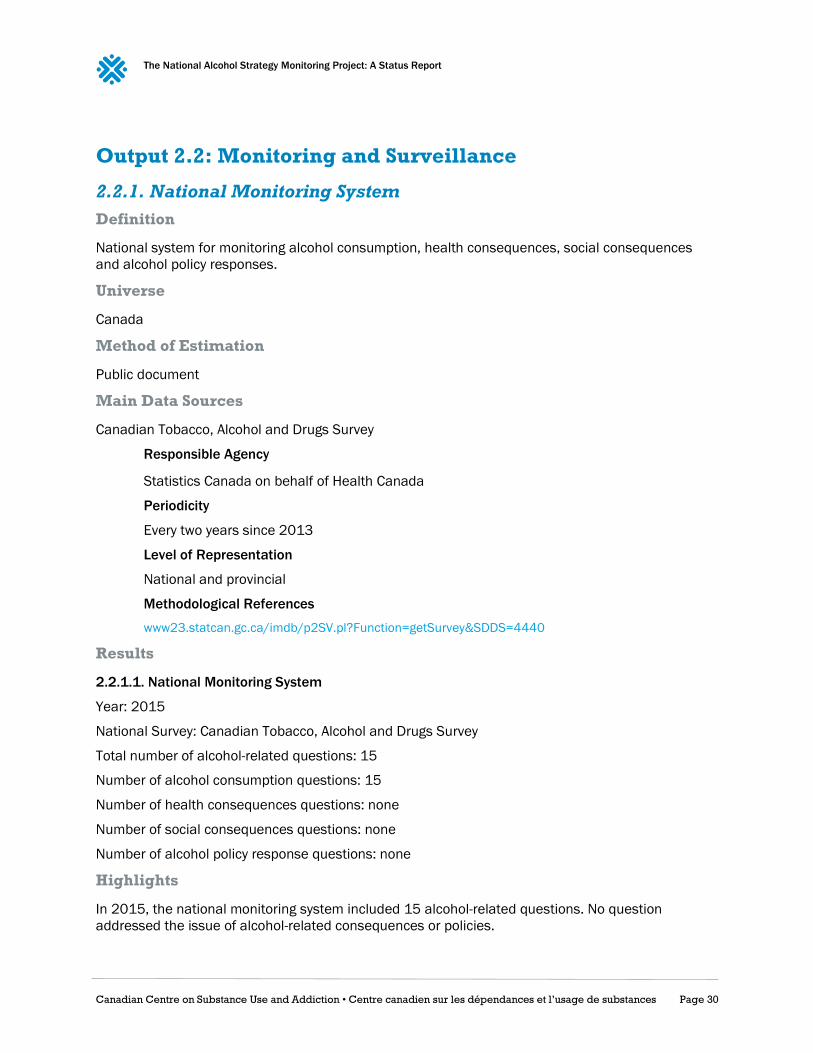
The National Alcohol Strategy Monitoring Project: A Status Report
Canadian Centre on Substance Use and Addiction • Centre canadien sur les dépendances et l’usage de substances Page 30
Output 2.2: Monitoring and Surveillance
2.2.1. National Monitoring System
Definition
National system for monitoring alcohol consumption, health consequences, social consequences
and alcohol policy responses.
Universe
Canada
Method of Estimation
Public document
Main Data Sources
Canadian Tobacco, Alcohol and Drugs Survey
Responsible Agency
Statistics Canada on behalf of Health Canada
Periodicity
Every two years since 2013
Level of Representation
National and provincial
Methodological References
www23.statcan.gc.ca/imdb/p2SV.pl?Function=getSurvey&SDDS=4440
Results
2.2.1.1. National Monitoring System
Year: 2015
National Survey: Canadian Tobacco, Alcohol and Drugs Survey
Total number of alcohol-related questions: 15
Number of alcohol consumption questions: 15
Number of health consequences questions: none
Number of social consequences questions: none
Number of alcohol policy response questions: none
Highlights
In 2015, the national monitoring system included 15 alcohol-related questions. No question
addressed the issue of alcohol-related consequences or policies.
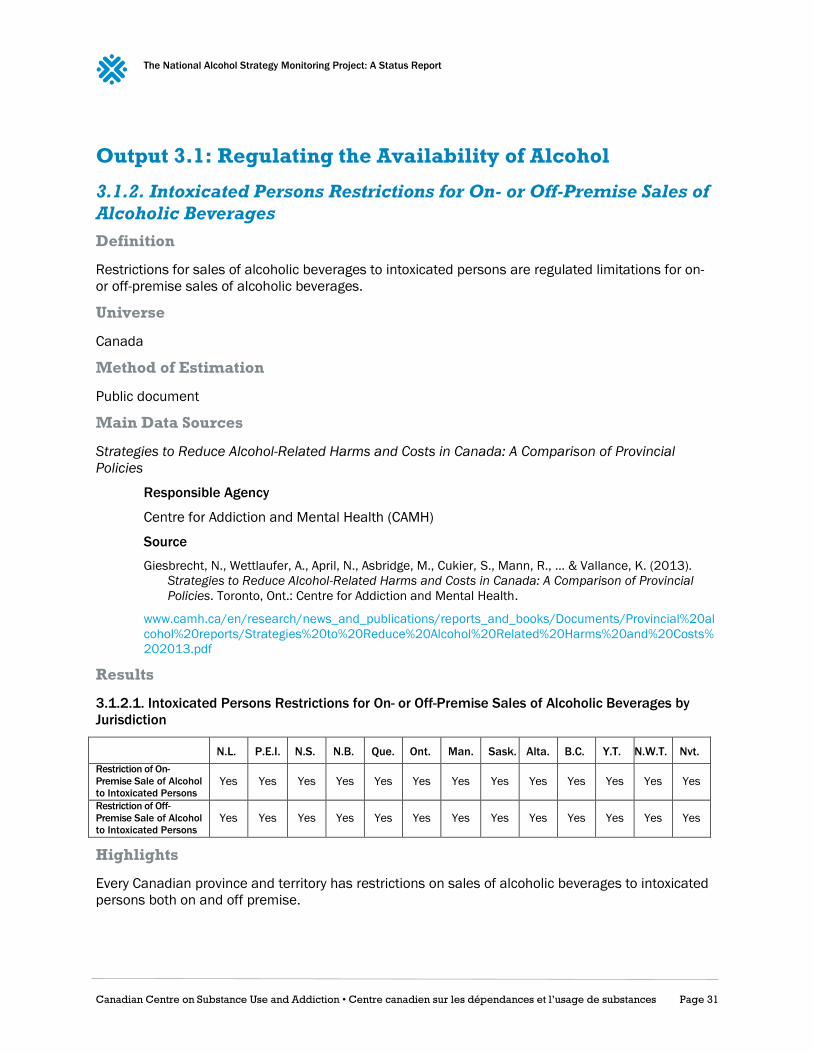
The National Alcohol Strategy Monitoring Project: A Status Report
Canadian Centre on Substance Use and Addiction • Centre canadien sur les dépendances et l’usage de substances Page 31
Output 3.1: Regulating the Availability of Alcohol
3.1.2. Intoxicated Persons Restrictions for On- or Off-Premise Sales of
Alcoholic Beverages
Definition
Restrictions for sales of alcoholic beverages to intoxicated persons are regulated limitations for on-
or off-premise sales of alcoholic beverages.
Universe
Canada
Method of Estimation
Public document
Main Data Sources
Strategies to Reduce Alcohol-Related Harms and Costs in Canada: A Comparison of Provincial
Policies
Responsible Agency
Centre for Addiction and Mental Health (CAMH)
Source
Giesbrecht, N., Wettlaufer, A., April, N., Asbridge, M., Cukier, S., Mann, R., … & Vallance, K. (2013).
Strategies to Reduce Alcohol-Related Harms and Costs in Canada: A Comparison of Provincial
Policies. Toronto, Ont.: Centre for Addiction and Mental Health.
www.camh.ca/en/research/news_and_publications/reports_and_books/Documents/Provincial%20al
cohol%20reports/Strategies%20to%20Reduce%20Alcohol%20Related%20Harms%20and%20Costs%
202013.pdf
Results
3.1.2.1. Intoxicated Persons Restrictions for On- or Off-Premise Sales of Alcoholic Beverages by
Jurisdiction
N.L. P.E.I. N.S. N.B. Que. Ont. Man. Sask. Alta. B.C. Y.T. N.W.T. Nvt.
Restriction of On-
Premise Sale of Alcohol
to Intoxicated Persons Yes Yes Yes Yes Yes Yes Yes Yes Yes Yes Yes Yes Yes
Restriction of Off-
Premise Sale of Alcohol
to Intoxicated Persons Yes Yes Yes Yes Yes Yes Yes Yes Yes Yes Yes Yes Yes
Highlights
Every Canadian province and territory has restrictions on sales of alcoholic beverages to intoxicated
persons both on and off premise.

The National Alcohol Strategy Monitoring Project: A Status Report
Canadian Centre on Substance Use and Addiction • Centre canadien sur les dépendances et l’usage de substances Page 32
3.1.4. Time Restriction for Sales of Alcoholic Beverages
Definition
Restrictions for sales of alcoholic beverages during specific times are regulated limitations on the
hours and days of sales of alcoholic beverages, both on and off premises.
Universe
Canada
Method of Estimation
Public document
Main Data Sources
Strategies to Reduce Alcohol-Related Harms and Costs in Canada: A Comparison of Provincial
Policies
Responsible Agency
CAMH
Source
Giesbrecht, N., Wettlaufer, A., April, N., Asbridge, M., Cukier, S., Mann, R., … Vallance, K.
(2013). Strategies to Reduce Alcohol-Related Harms and Costs in Canada: A
Comparison of Provincial Policies. Toronto, Ont.: Centre for Addiction and Mental
Health.
www.camh.ca/en/research/news_and_publications/reports_and_books/Documents/Provincial%20al
cohol%20reports/Strategies%20to%20Reduce%20Alcohol%20Related%20Harms%20and%20Costs%
202013.pdf
Results
3.1.4.1. Time Restriction for Sales of Alcoholic Beverages by Jurisdiction
N.L. P.E.I. N.S. N.B. Que. Ont. Man. Sask. Alta. B.C. Y.T. N.W.T. Nvt.
On-Premise Sales of
Alcohol Restricted
during Specific Hours Yes Yes Yes Yes Yes Yes Yes Yes Yes Yes Yes Yes Yes
On-Premise Sales of
Alcohol Restricted
during Specific Days Yes Yes Yes Yes Yes Yes Yes Yes Yes Yes Yes Yes Yes
Off-Premise Sales of
Alcohol Restricted
during Specific Hours No Yes No Yes Yes Yes Yes No Yes Yes Yes Yes Yes
Off-Premise Sales of
Alcohol Restricted
during Specific Days No Yes No Yes Yes Yes Yes No Yes Yes Yes Yes Yes
Highlights
Every Canadian province and territory has restrictions on the hours and days for on-premise sales of
alcoholic beverages. For off-premise sales, Newfoundland, Nova Scotia, Saskatchewan and the
Northwest Territories do not have restriction on the hours and days alcoholic beverages can be sold.
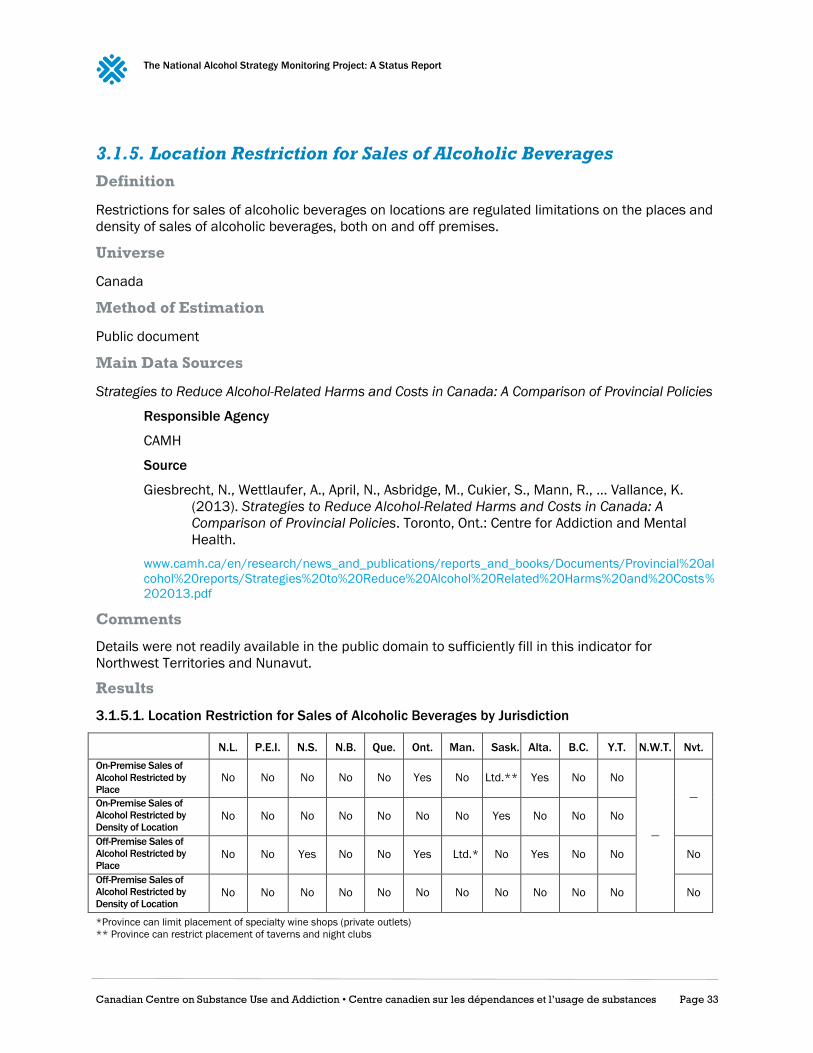
The National Alcohol Strategy Monitoring Project: A Status Report
Canadian Centre on Substance Use and Addiction • Centre canadien sur les dépendances et l’usage de substances Page 33
3.1.5. Location Restriction for Sales of Alcoholic Beverages
Definition
Restrictions for sales of alcoholic beverages on locations are regulated limitations on the places and
density of sales of alcoholic beverages, both on and off premises.
Universe
Canada
Method of Estimation
Public document
Main Data Sources
Strategies to Reduce Alcohol-Related Harms and Costs in Canada: A Comparison of Provincial Policies
Responsible Agency
CAMH
Source
Giesbrecht, N., Wettlaufer, A., April, N., Asbridge, M., Cukier, S., Mann, R., … Vallance, K.
(2013). Strategies to Reduce Alcohol-Related Harms and Costs in Canada: A
Comparison of Provincial Policies. Toronto, Ont.: Centre for Addiction and Mental
Health.
www.camh.ca/en/research/news_and_publications/reports_and_books/Documents/Provincial%20al
cohol%20reports/Strategies%20to%20Reduce%20Alcohol%20Related%20Harms%20and%20Costs%
202013.pdf
Comments
Details were not readily available in the public domain to sufficiently fill in this indicator for
Northwest Territories and Nunavut.
Results
3.1.5.1. Location Restriction for Sales of Alcoholic Beverages by Jurisdiction
N.L. P.E.I. N.S. N.B. Que. Ont. Man. Sask. Alta. B.C. Y.T. N.W.T. Nvt.
On-Premise Sales of
Alcohol Restricted by
Place No No No No No Yes No Ltd.** Yes No No
—
— On-Premise Sales of
Alcohol Restricted by
Density of Location No No No No No No No Yes No No No
Off-Premise Sales of
Alcohol Restricted by
Place No No Yes No No Yes Ltd.* No Yes No No No
Off-Premise Sales of
Alcohol Restricted by
Density of Location No No No No No No No No No No No No
*Province can limit placement of specialty wine shops (private outlets)
** Province can restrict placement of taverns and night clubs
The National Alcohol Strategy Monitoring Project: A Status Report
Canadian Centre on Substance Use and Addiction • Centre canadien sur les dépendances et l’usage de substances Page 34
Highlights
Across Canadian provinces and territories, the norm is no restrictions according to location or density
for the sales of alcoholic beverages, both on and off premises. Only Ontario and Alberta restrict
places where alcohol can be sold, both on and off premises. In Manitoba, the placement of specialty
wine shops is restricted. Saskatchewan restricts placement of taverns and nightclubs, and restricts
on-premise outlet density.
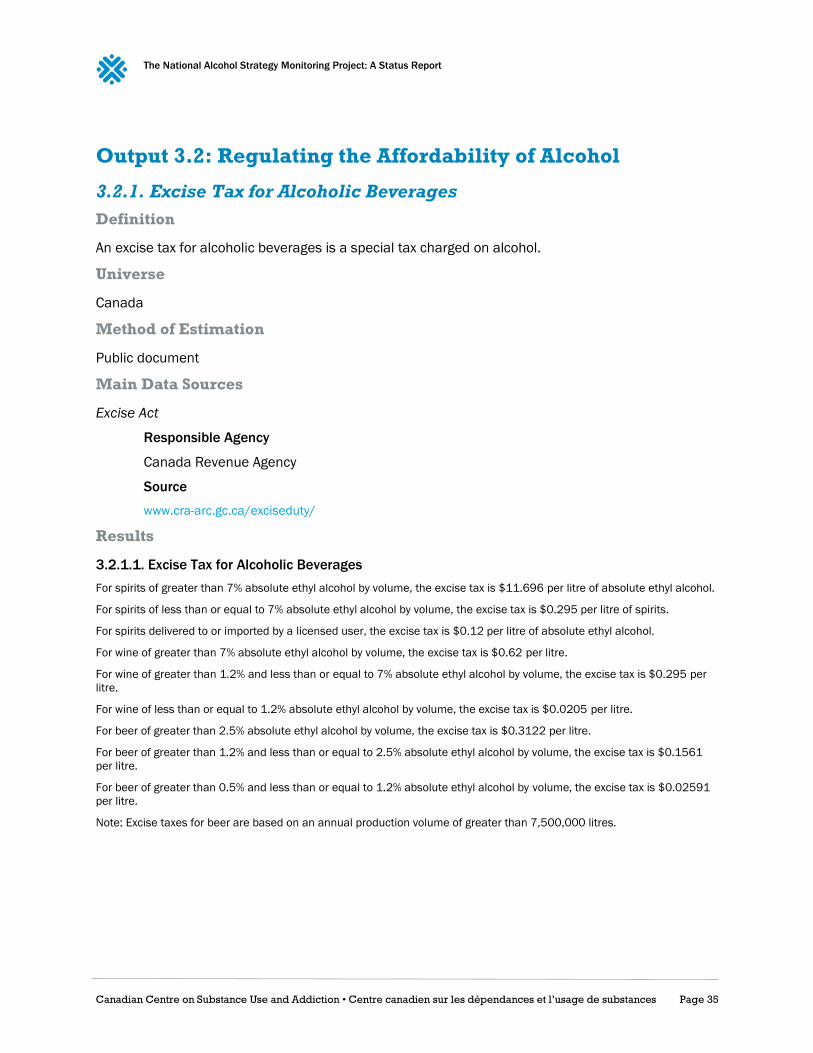
The National Alcohol Strategy Monitoring Project: A Status Report
Canadian Centre on Substance Use and Addiction • Centre canadien sur les dépendances et l’usage de substances Page 35
Output 3.2: Regulating the Affordability of Alcohol
3.2.1. Excise Tax for Alcoholic Beverages
Definition
An excise tax for alcoholic beverages is a special tax charged on alcohol.
Universe
Canada
Method of Estimation
Public document
Main Data Sources
Excise Act
Responsible Agency
Canada Revenue Agency
Source
www.cra-arc.gc.ca/exciseduty/
Results
3.2.1.1. Excise Tax for Alcoholic Beverages
For spirits of greater than 7% absolute ethyl alcohol by volume, the excise tax is $11.696 per litre of absolute ethyl alcohol.
For spirits of less than or equal to 7% absolute ethyl alcohol by volume, the excise tax is $0.295 per litre of spirits.
For spirits delivered to or imported by a licensed user, the excise tax is $0.12 per litre of absolute ethyl alcohol.
For wine of greater than 7% absolute ethyl alcohol by volume, the excise tax is $0.62 per litre.
For wine of greater than 1.2% and less than or equal to 7% absolute ethyl alcohol by volume, the excise tax is $0.295 per
litre.
For wine of less than or equal to 1.2% absolute ethyl alcohol by volume, the excise tax is $0.0205 per litre.
For beer of greater than 2.5% absolute ethyl alcohol by volume, the excise tax is $0.3122 per litre.
For beer of greater than 1.2% and less than or equal to 2.5% absolute ethyl alcohol by volume, the excise tax is $0.1561
per litre.
For beer of greater than 0.5% and less than or equal to 1.2% absolute ethyl alcohol by volume, the excise tax is $0.02591
per litre.
Note: Excise taxes for beer are based on an annual production volume of greater than 7,500,000 litres.
The National Alcohol Strategy Monitoring Project: A Status Report
Canadian Centre on Substance Use and Addiction • Centre canadien sur les dépendances et l’usage de substances Page 36
Highlights
For spirits, wine and beer, excise duty is imposed according to percentage of absolute ethyl
alcohol by volume.
Across alcoholic beverage categories, the excise tax is similar for products with similar
percentage of absolute ethyl alcohol. But for spirits containing more than 7% of absolute
ethyl alcohol, the excise tax is significantly higher than the one for other products containing
more than 7% of absolute ethyl alcohol.
For beer, there are reduced rates of excise tax based on the annual production volume
increments in liters (0 to 200,000; 200,001 to 500,000; 500,001 to 1,500,000; 1,500,001
to 5,000,000; 5,000,001 to 7,500,000).
The National Alcohol Strategy Monitoring Project: A Status Report
Canadian Centre on Substance Use and Addiction • Centre canadien sur les dépendances et l’usage de substances Page 37
3.2.2. Consumer Price Index for Alcoholic Beverages
Definition
The Consumer Price Index (CPI) for alcoholic beverages is an indicator of the changes in consumer
prices experienced by Canadians for alcoholic beverages compared to eight major components of
goods and services (all items). It is obtained by comparing, through time, the cost of a fixed basket of
alcoholic beverages compared to a fixed basket of all items purchased by Canadian consumers in a
particular year. Since the basket contains commodities of unchanging or equivalent quantity and
quality, the index reflects pure price movements.
Universe
Canada
Method of Estimation
Public document
Percentage change
(Index2008 - Index2015) / Index2008* 100
Main Data Sources
Consumer Price Index
Responsible Agency
Statistics Canada
Periodicity
Monthly since 2000
Level of Representation
National
Available Data
2015
Source
CANSIM Table 326-0021
Methodological References
www23.statcan.gc.ca/imdb/p2SV.pl?Function=getSurvey&Id=321185
Comments
The price index for alcoholic beverages is not available for Nunavut
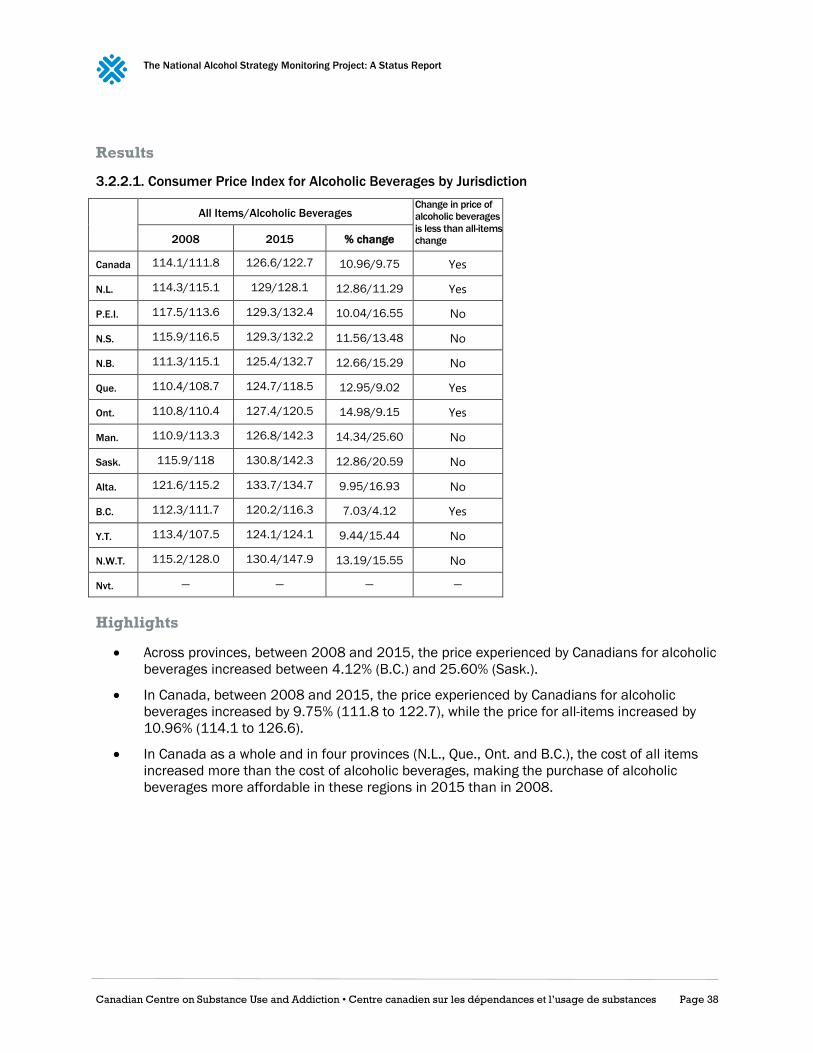
The National Alcohol Strategy Monitoring Project: A Status Report
Canadian Centre on Substance Use and Addiction • Centre canadien sur les dépendances et l’usage de substances Page 38
Results
3.2.2.1. Consumer Price Index for Alcoholic Beverages by Jurisdiction
All Items/Alcoholic Beverages Change in price of
alcoholic beverages
is less than all-items
change 2008 2015 % change
Canada 114.1/111.8 126.6/122.7 10.96/9.75 Yes
N.L. 114.3/115.1 129/128.1 12.86/11.29 Yes
P.E.I. 117.5/113.6 129.3/132.4 10.04/16.55 No
N.S. 115.9/116.5 129.3/132.2 11.56/13.48 No
N.B. 111.3/115.1 125.4/132.7 12.66/15.29 No
Que. 110.4/108.7 124.7/118.5 12.95/9.02 Yes
Ont. 110.8/110.4 127.4/120.5 14.98/9.15 Yes
Man. 110.9/113.3 126.8/142.3 14.34/25.60 No
Sask. 115.9/118 130.8/142.3 12.86/20.59 No
Alta. 121.6/115.2 133.7/134.7 9.95/16.93 No
B.C. 112.3/111.7 120.2/116.3 7.03/4.12 Yes
Y.T. 113.4/107.5 124.1/124.1 9.44/15.44 No
N.W.T. 115.2/128.0 130.4/147.9 13.19/15.55 No
Nvt. — — — —
Highlights
Across provinces, between 2008 and 2015, the price experienced by Canadians for alcoholic
beverages increased between 4.12% (B.C.) and 25.60% (Sask.).
In Canada, between 2008 and 2015, the price experienced by Canadians for alcoholic
beverages increased by 9.75% (111.8 to 122.7), while the price for all-items increased by
10.96% (114.1 to 126.6).
In Canada as a whole and in four provinces (N.L., Que., Ont. and B.C.), the cost of all items
increased more than the cost of alcoholic beverages, making the purchase of alcoholic
beverages more affordable in these regions in 2015 than in 2008.
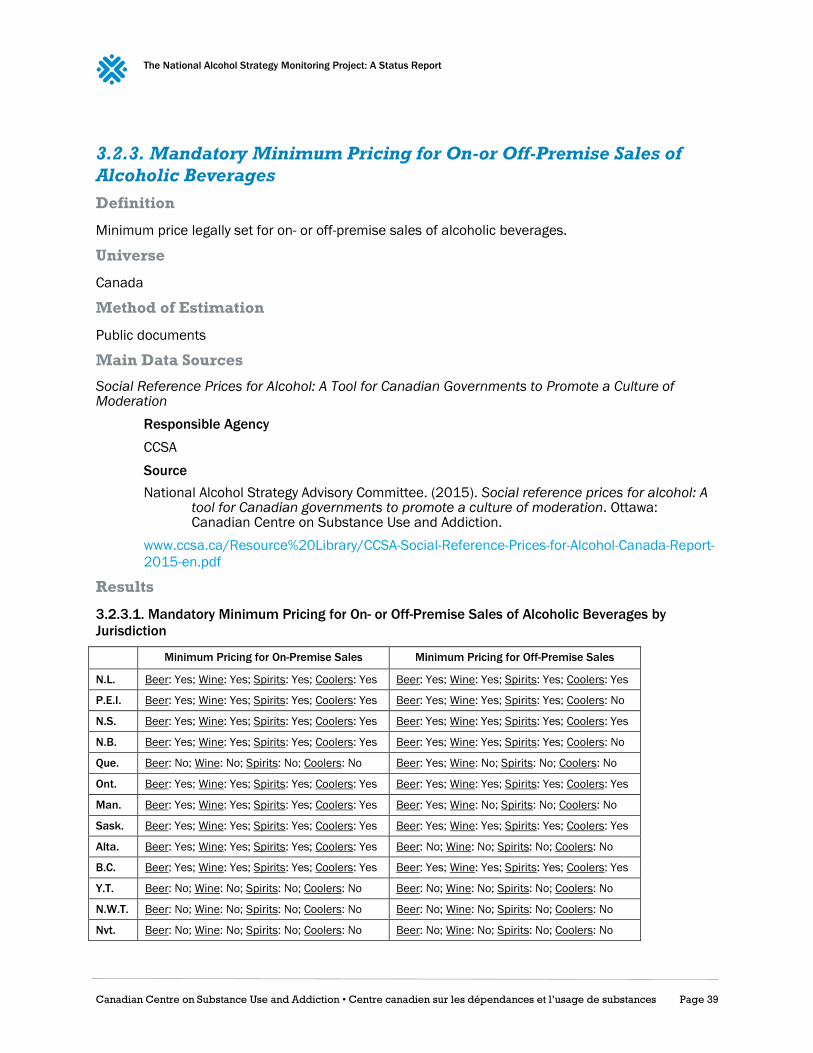
The National Alcohol Strategy Monitoring Project: A Status Report
Canadian Centre on Substance Use and Addiction • Centre canadien sur les dépendances et l’usage de substances Page 39
3.2.3. Mandatory Minimum Pricing for On-or Off-Premise Sales of
Alcoholic Beverages
Definition
Minimum price legally set for on- or off-premise sales of alcoholic beverages.
Universe
Canada
Method of Estimation
Public documents
Main Data Sources
Social Reference Prices for Alcohol: A Tool for Canadian Governments to Promote a Culture of Moderation
Responsible Agency
CCSA
Source
National Alcohol Strategy Advisory Committee. (2015). Social reference prices for alcohol: A tool for Canadian governments to promote a culture of moderation. Ottawa: Canadian Centre on Substance Use and Addiction.
www.ccsa.ca/Resource%20Library/CCSA-Social-Reference-Prices-for-Alcohol-Canada-Report-
2015-en.pdf
Results
3.2.3.1. Mandatory Minimum Pricing for On- or Off-Premise Sales of Alcoholic Beverages by
Jurisdiction
Minimum Pricing for On-Premise Sales Minimum Pricing for Off-Premise Sales
N.L. Beer: Yes; Wine: Yes; Spirits: Yes; Coolers: Yes Beer: Yes; Wine: Yes; Spirits: Yes; Coolers: Yes
P.E.I. Beer: Yes; Wine: Yes; Spirits: Yes; Coolers: Yes Beer: Yes; Wine: Yes; Spirits: Yes; Coolers: No
N.S. Beer: Yes; Wine: Yes; Spirits: Yes; Coolers: Yes Beer: Yes; Wine: Yes; Spirits: Yes; Coolers: Yes
N.B. Beer: Yes; Wine: Yes; Spirits: Yes; Coolers: Yes Beer: Yes; Wine: Yes; Spirits: Yes; Coolers: No
Que. Beer: No; Wine: No; Spirits: No; Coolers: No Beer: Yes; Wine: No; Spirits: No; Coolers: No
Ont. Beer: Yes; Wine: Yes; Spirits: Yes; Coolers: Yes Beer: Yes; Wine: Yes; Spirits: Yes; Coolers: Yes
Man. Beer: Yes; Wine: Yes; Spirits: Yes; Coolers: Yes Beer: Yes; Wine: No; Spirits: No; Coolers: No
Sask. Beer: Yes; Wine: Yes; Spirits: Yes; Coolers: Yes Beer: Yes; Wine: Yes; Spirits: Yes; Coolers: Yes
Alta. Beer: Yes; Wine: Yes; Spirits: Yes; Coolers: Yes Beer: No; Wine: No; Spirits: No; Coolers: No
B.C. Beer: Yes; Wine: Yes; Spirits: Yes; Coolers: Yes Beer: Yes; Wine: Yes; Spirits: Yes; Coolers: Yes
Y.T. Beer: No; Wine: No; Spirits: No; Coolers: No Beer: No; Wine: No; Spirits: No; Coolers: No
N.W.T. Beer: No; Wine: No; Spirits: No; Coolers: No Beer: No; Wine: No; Spirits: No; Coolers: No
Nvt. Beer: No; Wine: No; Spirits: No; Coolers: No Beer: No; Wine: No; Spirits: No; Coolers: No

The National Alcohol Strategy Monitoring Project: A Status Report
Canadian Centre on Substance Use and Addiction • Centre canadien sur les dépendances et l’usage de substances Page 40
Highlights
Across Canadian provinces and territories, there is more often mandatory minimum pricing
for on-premise sales of alcoholic beverages than for off-premise sales.
In Canada, minimum pricing is legally set for on-premise sales of beer, wine, spirits and
coolers in every province except Quebec. None of the territories have a minimum price set for
on-premise sales of alcoholic beverages.
Only Newfoundland, Nova Scotia, Ontario, Saskatchewan and British Columbia have
mandatory minimum pricing for off-premise sales of all four types of alcoholic beverages.
Territories and Alberta do not have mandatory minimum pricing for off-premise sales of beer.

The National Alcohol Strategy Monitoring Project: A Status Report
Canadian Centre on Substance Use and Addiction • Centre canadien sur les dépendances et l’usage de substances Page 41
Output 3.3: Marketing Restrictions
3.3.1. Legally Binding Regulations on Alcohol Advertising
Definition
Restrictions on alcohol advertising are legally binding restrictions enforced by law on alcohol
advertising (the promotion of alcoholic beverages by alcohol producers through a variety of media).
Universe
Canada
Method of Estimation
Public document
Main Data Sources
Strategies to Reduce Alcohol-Related Harms and Costs in Canada: A Comparison of Provincial
Policies
Responsible Agency
CAMH
Source
Giesbrecht, N., Wettlaufer, A., April, N., Asbridge, M., Cukier, S., Mann, R., … Vallance, K.
(2013). Strategies to Reduce Alcohol-Related Harms and Costs in Canada: A
Comparison of Provincial Policies. Toronto, Ont.: Centre for Addiction and Mental
Health.
www.camh.ca/en/research/news_and_publications/reports_and_books/Documents/Provincial%20al
cohol%20reports/Strategies%20to%20Reduce%20Alcohol%20Related%20Harms%20and%20Costs%
202013.pdf
Comments
This indicator documents whether jurisdictions have legally binding restrictions on advertising. While
these restrictions should be enforced by law, this indicator addresses their existence, not their
enforcement.
Results
3.3.1.1. Legally Binding Regulations on Alcohol Advertising by Jurisdiction
Can. N.L. P.E.I. N.S. N.B. Que. Ont. Man. Sask. Alta. B.C. Y.T. N.W.T. Nvt.
Legally Binding
Regulations on
Alcohol Advertising* Yes** Yes Yes Yes Yes Yes Yes Yes Yes No Yes No Yes No
* For provinces, “yes” refers to advertising regulations that go beyond the national Canadian Radio-television and Telecommunications
Commission (CRTC) code.
** The CRTC code only applies to broadcast advertising of alcoholic beverages. Online advertising is not covered by the CRTC code.

The National Alcohol Strategy Monitoring Project: A Status Report
Canadian Centre on Substance Use and Addiction • Centre canadien sur les dépendances et l’usage de substances Page 42
Highlights
Every Canadian province and territory, except Alberta, Yukon and Nunavut, has legally binding
restrictions enforced by law on alcohol advertising that go beyond the national CRTC code.
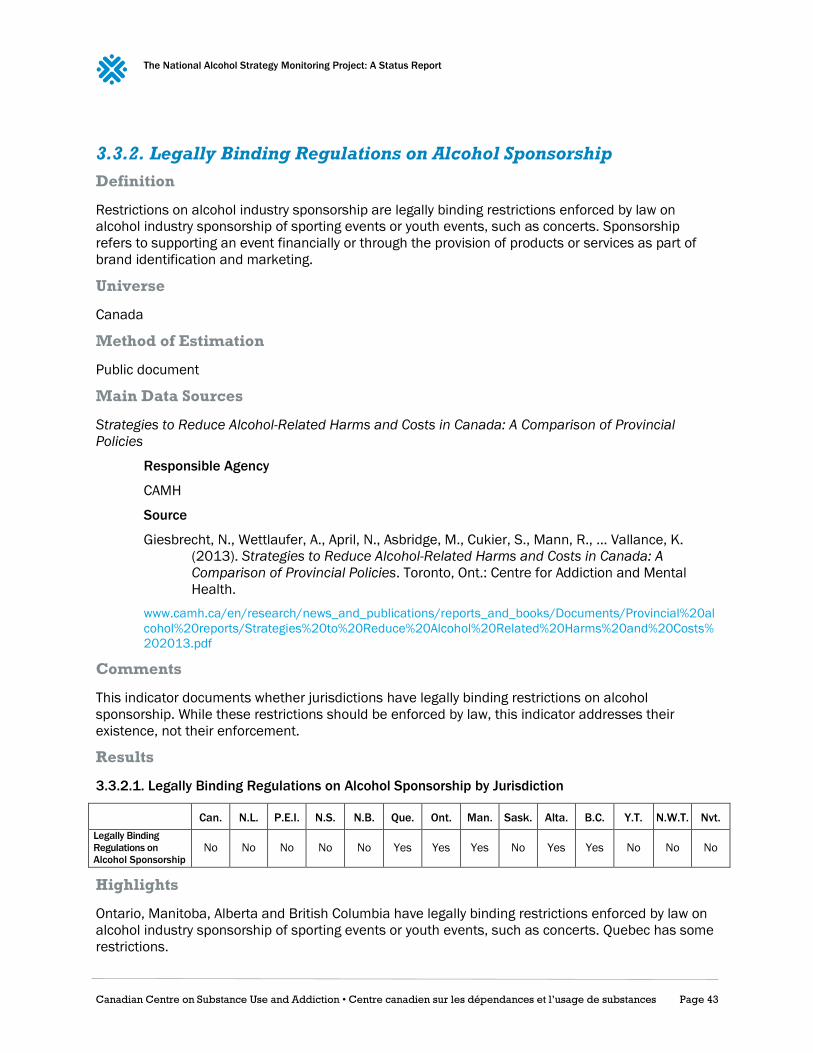
The National Alcohol Strategy Monitoring Project: A Status Report
Canadian Centre on Substance Use and Addiction • Centre canadien sur les dépendances et l’usage de substances Page 43
3.3.2. Legally Binding Regulations on Alcohol Sponsorship
Definition
Restrictions on alcohol industry sponsorship are legally binding restrictions enforced by law on
alcohol industry sponsorship of sporting events or youth events, such as concerts. Sponsorship
refers to supporting an event financially or through the provision of products or services as part of
brand identification and marketing.
Universe
Canada
Method of Estimation
Public document
Main Data Sources
Strategies to Reduce Alcohol-Related Harms and Costs in Canada: A Comparison of Provincial
Policies
Responsible Agency
CAMH
Source
Giesbrecht, N., Wettlaufer, A., April, N., Asbridge, M., Cukier, S., Mann, R., … Vallance, K.
(2013). Strategies to Reduce Alcohol-Related Harms and Costs in Canada: A
Comparison of Provincial Policies. Toronto, Ont.: Centre for Addiction and Mental
Health.
www.camh.ca/en/research/news_and_publications/reports_and_books/Documents/Provincial%20al
cohol%20reports/Strategies%20to%20Reduce%20Alcohol%20Related%20Harms%20and%20Costs%
202013.pdf
Comments
This indicator documents whether jurisdictions have legally binding restrictions on alcohol
sponsorship. While these restrictions should be enforced by law, this indicator addresses their
existence, not their enforcement.
Results
3.3.2.1. Legally Binding Regulations on Alcohol Sponsorship by Jurisdiction
Can. N.L. P.E.I. N.S. N.B. Que. Ont. Man. Sask. Alta. B.C. Y.T. N.W.T. Nvt.
Legally Binding
Regulations on
Alcohol Sponsorship No No No No No Yes Yes Yes No Yes Yes No No No
Highlights
Ontario, Manitoba, Alberta and British Columbia have legally binding restrictions enforced by law on
alcohol industry sponsorship of sporting events or youth events, such as concerts. Quebec has some
restrictions.
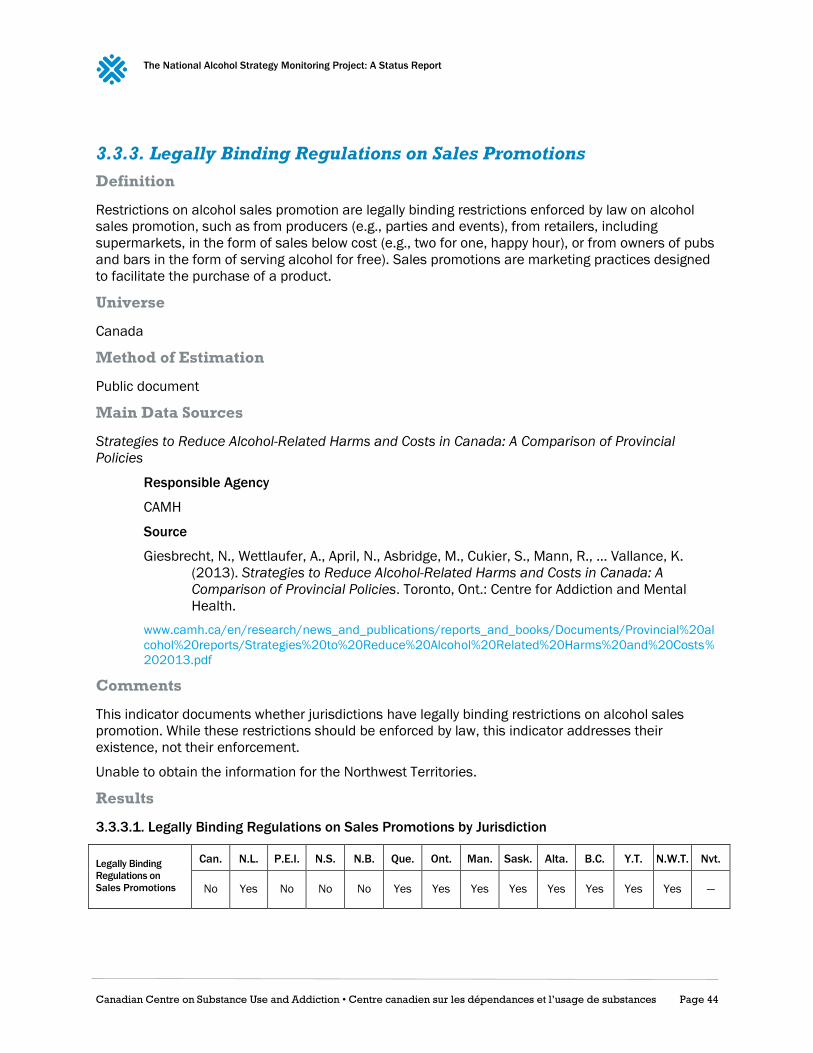
The National Alcohol Strategy Monitoring Project: A Status Report
Canadian Centre on Substance Use and Addiction • Centre canadien sur les dépendances et l’usage de substances Page 44
3.3.3. Legally Binding Regulations on Sales Promotions
Definition
Restrictions on alcohol sales promotion are legally binding restrictions enforced by law on alcohol
sales promotion, such as from producers (e.g., parties and events), from retailers, including
supermarkets, in the form of sales below cost (e.g., two for one, happy hour), or from owners of pubs
and bars in the form of serving alcohol for free). Sales promotions are marketing practices designed
to facilitate the purchase of a product.
Universe
Canada
Method of Estimation
Public document
Main Data Sources
Strategies to Reduce Alcohol-Related Harms and Costs in Canada: A Comparison of Provincial
Policies
Responsible Agency
CAMH
Source
Giesbrecht, N., Wettlaufer, A., April, N., Asbridge, M., Cukier, S., Mann, R., … Vallance, K.
(2013). Strategies to Reduce Alcohol-Related Harms and Costs in Canada: A
Comparison of Provincial Policies. Toronto, Ont.: Centre for Addiction and Mental
Health.
www.camh.ca/en/research/news_and_publications/reports_and_books/Documents/Provincial%20al
cohol%20reports/Strategies%20to%20Reduce%20Alcohol%20Related%20Harms%20and%20Costs%
202013.pdf
Comments
This indicator documents whether jurisdictions have legally binding restrictions on alcohol sales
promotion. While these restrictions should be enforced by law, this indicator addresses their
existence, not their enforcement.
Unable to obtain the information for the Northwest Territories.
Results
3.3.3.1. Legally Binding Regulations on Sales Promotions by Jurisdiction
Legally Binding
Regulations on
Sales Promotions
Can. N.L. P.E.I. N.S. N.B. Que. Ont. Man. Sask. Alta. B.C. Y.T. N.W.T. Nvt.
No Yes No No No Yes Yes Yes Yes Yes Yes Yes Yes —
The National Alcohol Strategy Monitoring Project: A Status Report
Canadian Centre on Substance Use and Addiction • Centre canadien sur les dépendances et l’usage de substances Page 45
Highlights
All provinces and territories except Nova Scotia, New Brunswick and Prince Edwards Island have
legally binding restrictions on alcohol sales promotion enforced by law. The regulations in Nunavut
for sales promotions are not known.

The National Alcohol Strategy Monitoring Project: A Status Report
Canadian Centre on Substance Use and Addiction • Centre canadien sur les dépendances et l’usage de substances Page 46
Output 3.4: Underage Drinking
3.4.1. Minimum Legal Drinking Age
Definition
Minimum legal drinking age is the minimum age you need to be allowed to drink alcohol under law.
Universe
Canada
Method of Estimation
Public documents
Main Data Sources
Legal Drinking Age for Alcohol in Canada
Responsible Agency
CCSA
Source
www.ccsa.ca/Eng/topics/alcohol/Pages/Legal-Drinking-Age-for-Alcohol-in-Canada.aspx
Strategies to Reduce Alcohol-Related Harms and Costs in Canada: A Comparison of Provincial
Policies
Responsible Agency
CAMH
Source
Giesbrecht, N., Wettlaufer, A., April, N., Asbridge, M., Cukier, S., Mann, R., … Vallance, K.
(2013). Strategies to Reduce Alcohol-Related Harms and Costs in Canada: A
Comparison of Provincial Policies. Toronto, Ont.: Centre for Addiction and Mental
Health.
www.camh.ca/en/research/news_and_publications/reports_and_books/Documents/Provincial%20al
cohol%20reports/Strategies%20to%20Reduce%20Alcohol%20Related%20Harms%20and%20Costs%
202013.pdf
Results
3.4.1.1. Minimum Legal Drinking Age by Jurisdiction
N.L. P.E.I. N.S. N.B. Que. Ont. Man. Sask. Alta. B.C. Y.T. N.W.T. Nvt.
Drink/Possess 19/19 19/19* 19/19 19/19§ 18*/18 19/19* 18/18¶ 19/19* 18/18* 19/19* 19/19† 19/19 19/19‡
Buy for/Serve 19/19 19/19 19/19 19/19 18/18 19/19 18/18 19/19 18/18 19/19 19/19 19/19 19/19
* Those under the legal drinking age are allowed to consume alcohol in the home, if it was provided by a parent or spouse.
§ Social hosting laws extend beyond the home to community hall.
¶ Social hosting laws extend beyond the home to on-premise establishments.
† Social hosting laws extend beyond the home to licensed establishments or events and also extend beyond the family if the provision of
alcohol is for medicinal or sacramental purposes.
‡ Exception in the home as well as some private social functions and for medicinal purposes.

The National Alcohol Strategy Monitoring Project: A Status Report
Canadian Centre on Substance Use and Addiction • Centre canadien sur les dépendances et l’usage de substances Page 47
Highlights
In Canada, each province and territory defines the legal drinking age for drinking and
possessing, buying for and serving.
For drinking and possessing, it is 18 years old in Quebec, Manitoba and Alberta. It is 19
years old elsewhere. In ten jurisdictions, there are exceptions such as, for example, allowing
those under the legal drinking age to consume alcohol in the home if it was provided by a
parent or spouse.
Regarding buying for and serving alcohol, the legal drinking age is 18 years old in Quebec,
Manitoba and Alberta, and 19 years old elsewhere.

The National Alcohol Strategy Monitoring Project: A Status Report
Canadian Centre on Substance Use and Addiction • Centre canadien sur les dépendances et l’usage de substances Page 48
Output 4.1: Policies
4.1.1. Written Policy on Alcohol
Definition
An adopted written policy on alcohol is defined as a written organized set of values, principles and
objectives for reducing the burden attributable to alcohol in a population.
Universe
Canada
Method of Estimation
Public document or representatives of a given jurisdiction responded to request by CCSA.
Main Data Sources
Information internal to CCSA
Responsible Agency
CCSA
Results
4.1.1.1. Written Policy on Alcohol
Can. N.L. P.E.I. N.S. N.B. Que. Ont. Man. Sask. Alta. B.C. Y.T. N.W.T. Nvt.
Written Policy on Alcohol Yes No No Yes No No No Yes No Yes No No No No
Highlights
A national alcohol strategy was released in Canada in 2007.
Nova Scotia, Manitoba and Alberta currently have provincial alcohol strategies.
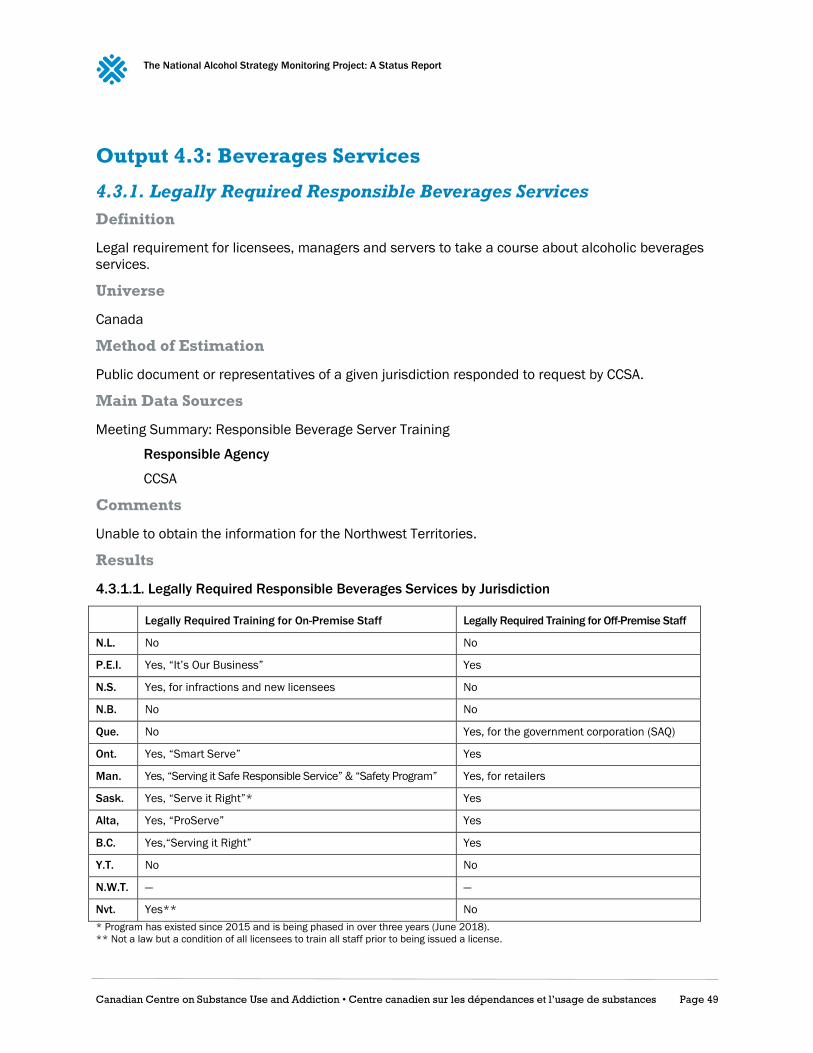
The National Alcohol Strategy Monitoring Project: A Status Report
Canadian Centre on Substance Use and Addiction • Centre canadien sur les dépendances et l’usage de substances Page 49
Output 4.3: Beverages Services
4.3.1. Legally Required Responsible Beverages Services
Definition
Legal requirement for licensees, managers and servers to take a course about alcoholic beverages
services.
Universe
Canada
Method of Estimation
Public document or representatives of a given jurisdiction responded to request by CCSA.
Main Data Sources
Meeting Summary: Responsible Beverage Server Training
Responsible Agency
CCSA
Comments
Unable to obtain the information for the Northwest Territories.
Results
4.3.1.1. Legally Required Responsible Beverages Services by Jurisdiction
Legally Required Training for On-Premise Staff Legally Required Training for Off-Premise Staff
N.L. No No
P.E.I. Yes, “It’s Our Business” Yes
N.S. Yes, for infractions and new licensees No
N.B. No No
Que. No Yes, for the government corporation (SAQ)
Ont. Yes, “Smart Serve” Yes
Man. Yes, “Serving it Safe Responsible Service” & “Safety Program” Yes, for retailers
Sask. Yes, “Serve it Right”* Yes
Alta, Yes, “ProServe” Yes
B.C. Yes,“Serving it Right” Yes
Y.T. No No
N.W.T. — —
Nvt. Yes** No
* Program has existed since 2015 and is being phased in over three years (June 2018).
** Not a law but a condition of all licensees to train all staff prior to being issued a license.
The National Alcohol Strategy Monitoring Project: A Status Report
Canadian Centre on Substance Use and Addiction • Centre canadien sur les dépendances et l’usage de substances Page 50
Highlights
Six jurisdictions have a legal requirement for responsible beverage services for both on- and
off-premise licensees.
The majority (8 out of 13) of provinces and territories have a legal requirement for on-
premise licensees, managers and servers to take a course about alcoholic beverages
services.
Seven jurisdictions have a legal requirement for off-premise licensees, managers and servers
to take a course about alcoholic beverages services.
In Quebec, the requirement applies to the government corporation (SAQ), but not to grocery
stores and gas stations.

The National Alcohol Strategy Monitoring Project: A Status Report
Canadian Centre on Substance Use and Addiction • Centre canadien sur les dépendances et l’usage de substances Page 51
Output 4.4: Impaired Driving
4.4.1. Maximum Legal BAC when Driving a Vehicle
Definition
There is a legal maximum blood alcohol concentration (BAC; measured as mass per volume) allowed
while driving a vehicle. The BAC limits for the general population and for young or novice drivers are
indicated.
Universe
Canada
Method of Estimation
Public document
Main Data Sources
Information internal to CCSA
Responsible Agency
CCSA
Results
4.4.1.1. Maximum Legal BAC when Driving a Vehicle by Jurisdiction
BAC Level/Type of Sanction BAC Level for Young or Novice Drivers
Can. 0.08; 0.16/criminal code None
N.L. 0.05/administrative Zero for Graduated Driver License (GDL) drivers
P.E.I. 0.05/administrative Zero for GDL drivers
N.S. 0.05/administrative Zero for GDL drivers
N.B. 0.05/administrative Zero for drivers under 21 years of age or GDL drivers
Que. 0.08/administrative Zero for drivers under 21 years of age or with learner’s or probationary licenses
Ont. 0.05/administrative Zero for drivers under 22 years of age or GDL drivers
Man. 0.05/administrative Zero for GDL drivers and for the first five years of being licenced
Sask. 0.04/administrative Zero for GDL drivers
Alta. 0.05/administrative Zero for GDL drivers
B.C. 0.05/administrative Zero for GDL drivers
Y.T. 0.08/administrative Zero for GDL drivers
N.W.T. 0.05/administrative Zero for novice drivers
Nvt. 0.06/administrative None

The National Alcohol Strategy Monitoring Project: A Status Report
Canadian Centre on Substance Use and Addiction • Centre canadien sur les dépendances et l’usage de substances Page 52
Highlights
The legal limit of blood alcohol content for drivers in Canada is 0.08, though the majority of
provinces and territories have sanctions for drivers with a BAC of 0.05 or higher.
Saskatchewan has the strictest limit, issuing consequences for drivers with a BAC of 0.04 or
higher.
In every province and territory, except Nunavut, there is zero tolerance for young drivers or
novice drivers, or drivers with a GDL.
New Brunswick, Quebec and Ontario have zero tolerance for both young drivers and those
without extensive driving experience.

The National Alcohol Strategy Monitoring Project: A Status Report
Canadian Centre on Substance Use and Addiction • Centre canadien sur les dépendances et l’usage de substances Page 53
Outcome 1.1: Increased Alcohol Literacy
1.1.1. Prevalence of Knowledge about the Low-Risk Alcohol Drinking
Guidelines
Definition
Proportion of Canadians 15 years old and older who report knowing about the Low-Risk Alcohol
Drinking Guidelines (LRDGs).
Method of Estimation
Numerator: Number of Canadians (15+ years) who report knowledge about the LRDGs
Denominator: Total number of Canadians sampled for the survey
Universe
Canadians aged 15 years and older
Main Data Sources
Canadian Alcohol and Drug Use Monitoring Survey
Responsible Agency
Health Canada
Target Population
Canadians age 15 years old and older living in a household with a telephone
Periodicity
Annual survey ran from 2008 through 2012
Level of Representation
National and provincial; territories not sampled
Available Data
2012
Methodological Reference
www.hc-sc.gc.ca/hc-ps/drugs-drogues/cadums-esccad-eng.php
Question
LRDG1: Have you ever seen or heard about Canada’s Low-Risk Alcohol Drinking Guidelines?
Comments
For the Canadian Alcohol and Drug Use Monitoring Survey, respondents were only asked if they had seen
or heard about the LRDGs, without being asked exactly what the guidelines are, so it is not possible to
assess whether Canadian know what they are. The Canadian Alcohol and Drug Use Monitoring Survey
was last run in 2012, so the results are out of date and should be interpreted with caution.

The National Alcohol Strategy Monitoring Project: A Status Report
Canadian Centre on Substance Use and Addiction • Centre canadien sur les dépendances et l’usage de substances Page 54
Results
1.1.1.1. Prevalence of Knowledge about the LRDGs by Province
Percentage
Who Report
Knowing
about LRDGs
Can. N.L. P.E.I. N.S. N.B. Que. Ont. Man. Sask. Alta. B.C.
26 20.5 14.5 17.9 21.3 42.8 21.4 21 25.1 18.7 19.5
1.1.1.2. Prevalence of Knowledge about the LRDGs by Gender
23.9% of males report knowing about the LRDGs
27.9% of females report knowing about the LRDGs
1.1.1.3. Prevalence of Knowledge about the LRDGs by Age
Percentage
Who Report
Knowing
about LRDGs
15–17 yrs old 18–24 yrs old 25–34 yrs old 35–44 yrs old 45–54 yrs old 55–64 yrs old 65 and older
21 23.8 22.2 25.5 26.9 30.5 27.4
Highlights
About a fifth of Canadians report knowing about the LRDGs. The exception is in Quebec,
where nearly half of Quebecers report knowing about the LRDGs.
Females are more likely than males to report knowing about the LRDGs.
Canadians aged under 35 are less likely to report knowing about the LRDGs.
The National Alcohol Strategy Monitoring Project: A Status Report
Canadian Centre on Substance Use and Addiction • Centre canadien sur les dépendances et l’usage de substances Page 55
Outcome 1.2: Increased Adherence to the Low-Risk
Drinking Guidelines
1.2.1. Prevalence of Drinking within the LRDGs for Chronic Effects
Definition
Proportion of Canadians 15 years old and older who consume no more than the recommended
quantity of alcohol within the number of days specified in the LRDGs for chronic effects.
Method of Estimation
Women
Numerator: Women who drink no more than 10 drinks a week, with no more than two drinks
a day most days
Denominator: Total number of Canadian women sampled for the survey
Men
Numerator: Men who drink no more than 15 drinks a week, with no more than three drinks a
day most days
Denominator: Total number of Canadian men sampled for the survey
Universe
Canadians aged 15 years and older
Main Data Sources
Canadian Tobacco, Alcohol and Drugs Survey
Responsible Agency
Statistics Canada on behalf of Health Canada
Target Population
Canadians age 15 years and older living in a household with a telephone
Periodicity
Every two years since 2013
Level of Representation
National and provincial
Available Data
2013
Methodological References
www23.statcan.gc.ca/imdb/p2SV.pl?Function=getSurvey&SDDS=4440
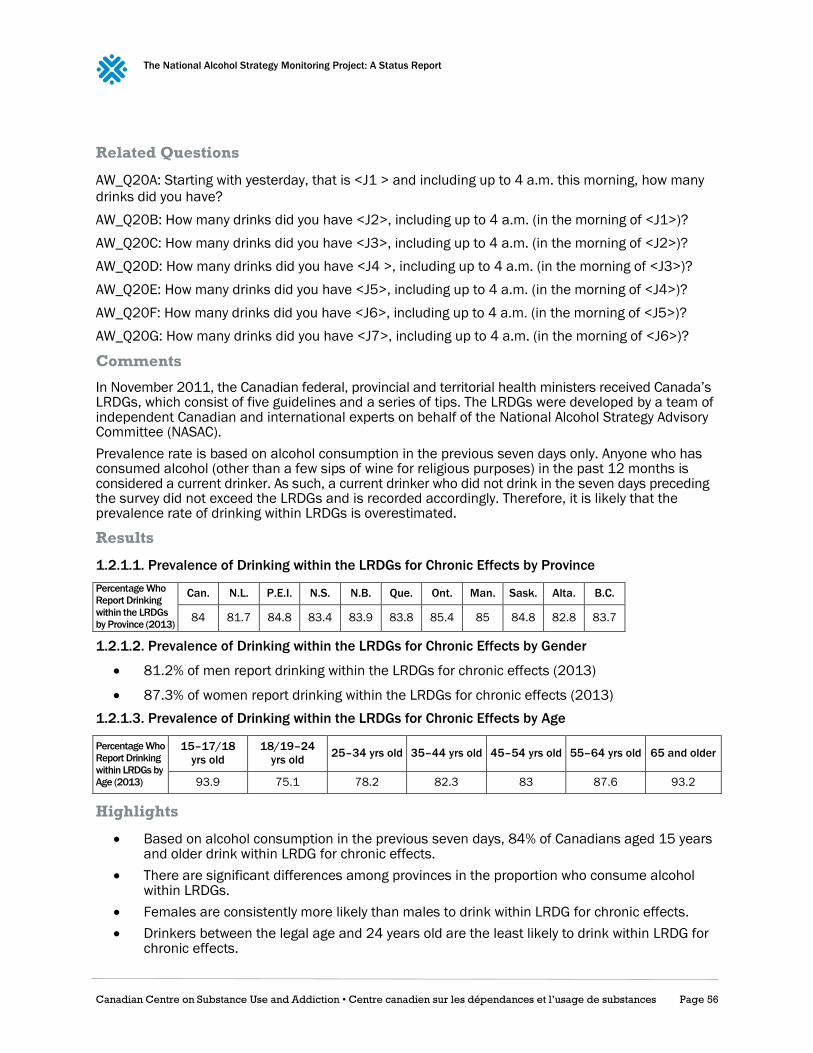
The National Alcohol Strategy Monitoring Project: A Status Report
Canadian Centre on Substance Use and Addiction • Centre canadien sur les dépendances et l’usage de substances Page 56
Related Questions
AW_Q20A: Starting with yesterday, that is <J1 > and including up to 4 a.m. this morning, how many
drinks did you have?
AW_Q20B: How many drinks did you have <J2>, including up to 4 a.m. (in the morning of <J1>)?
AW_Q20C: How many drinks did you have <J3>, including up to 4 a.m. (in the morning of <J2>)?
AW_Q20D: How many drinks did you have <J4 >, including up to 4 a.m. (in the morning of <J3>)?
AW_Q20E: How many drinks did you have <J5>, including up to 4 a.m. (in the morning of <J4>)?
AW_Q20F: How many drinks did you have <J6>, including up to 4 a.m. (in the morning of <J5>)?
AW_Q20G: How many drinks did you have <J7>, including up to 4 a.m. (in the morning of <J6>)?
Comments
In November 2011, the Canadian federal, provincial and territorial health ministers received Canada’s LRDGs, which consist of five guidelines and a series of tips. The LRDGs were developed by a team of independent Canadian and international experts on behalf of the National Alcohol Strategy Advisory Committee (NASAC).
Prevalence rate is based on alcohol consumption in the previous seven days only. Anyone who has consumed alcohol (other than a few sips of wine for religious purposes) in the past 12 months is considered a current drinker. As such, a current drinker who did not drink in the seven days preceding the survey did not exceed the LRDGs and is recorded accordingly. Therefore, it is likely that the prevalence rate of drinking within LRDGs is overestimated.
Results
1.2.1.1. Prevalence of Drinking within the LRDGs for Chronic Effects by Province
Percentage Who
Report Drinking
within the LRDGs
by Province (2013)
Can. N.L. P.E.I. N.S. N.B. Que. Ont. Man. Sask. Alta. B.C.
84 81.7 84.8 83.4 83.9 83.8 85.4 85 84.8 82.8 83.7
1.2.1.2. Prevalence of Drinking within the LRDGs for Chronic Effects by Gender
81.2% of men report drinking within the LRDGs for chronic effects (2013)
87.3% of women report drinking within the LRDGs for chronic effects (2013)
1.2.1.3. Prevalence of Drinking within the LRDGs for Chronic Effects by Age
Percentage Who
Report Drinking
within LRDGs by
Age (2013)
15–17/18
yrs old
18/19–24
yrs old 25–34 yrs old 35–44 yrs old 45–54 yrs old 55–64 yrs old 65 and older
93.9 75.1 78.2 82.3 83 87.6 93.2
Highlights
Based on alcohol consumption in the previous seven days, 84% of Canadians aged 15 years and older drink within LRDG for chronic effects.
There are significant differences among provinces in the proportion who consume alcohol within LRDGs.
Females are consistently more likely than males to drink within LRDG for chronic effects.
Drinkers between the legal age and 24 years old are the least likely to drink within LRDG for chronic effects.

The National Alcohol Strategy Monitoring Project: A Status Report
Canadian Centre on Substance Use and Addiction • Centre canadien sur les dépendances et l’usage de substances Page 57
1.2.2. Prevalence of Drinking within the LRDGs for Acute Effects
Definition
Proportion of Canadians 15 years old and older who on any one day do not exceed the
recommended maximum quantity of alcohol specified in the LRDGs for acute effects.
Method of Estimation
Women
Numerator: Women who consume no more than three drinks on any one day
Denominator: Total number of Canadian women sampled for the survey
Men
Numerator: Men who consume no more than four drinks on any one day
Denominator: Total number of Canadian men sampled for the survey
Universe
Canadians aged 15 years and older
Main Data Sources
Canadian Tobacco, Alcohol and Drugs Survey
Responsible Agency
Statistics Canada on behalf of Health Canada
Target Population
Canadians age 15 years and older living in a household with a telephone
Periodicity
Every two years since 2013
Level of Representation
National and provincial
Available Data
2013
Methodological References
www23.statcan.gc.ca/imdb/p2SV.pl?Function=getSurvey&SDDS=4440
Related Questions
AW_Q20A: Starting with yesterday, that is <J1 > and including up to 4 a.m. this morning, how many
drinks did you have?
AW_Q20B: How many drinks did you have <J2>, including up to 4 a.m. (in the morning of <J1>)?
AW_Q20C: How many drinks did you have <J3>, including up to 4 a.m. (in the morning of <J2>)?
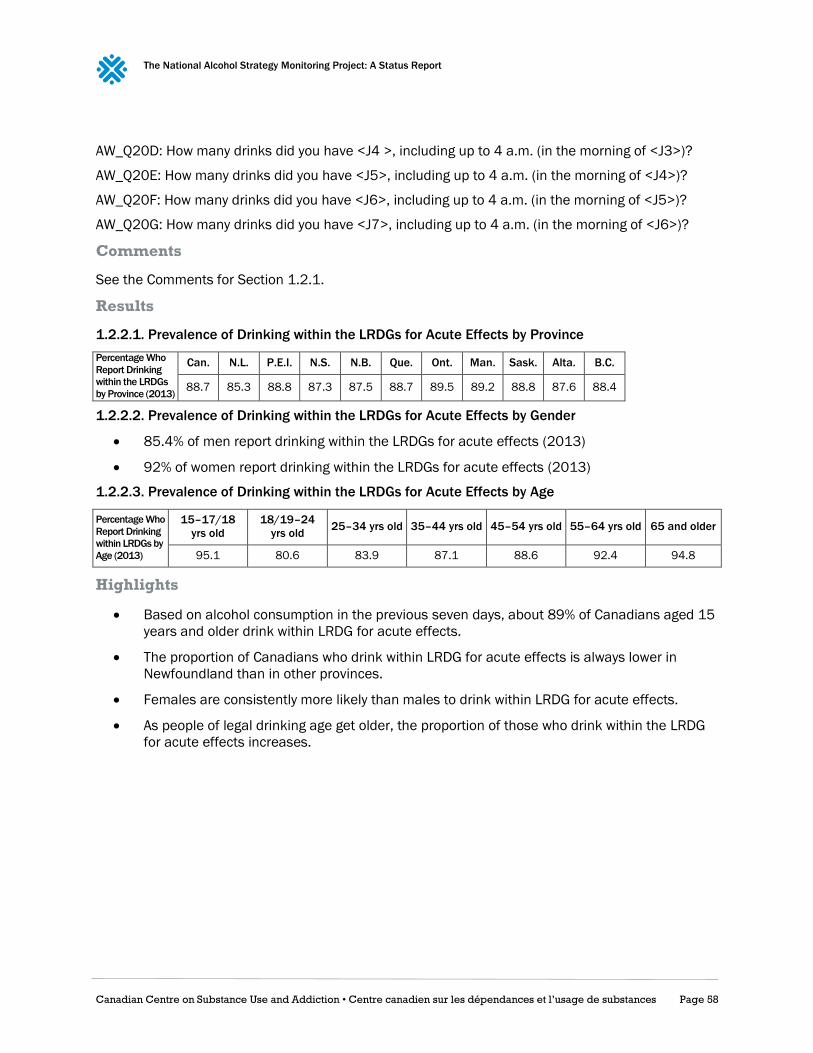
The National Alcohol Strategy Monitoring Project: A Status Report
Canadian Centre on Substance Use and Addiction • Centre canadien sur les dépendances et l’usage de substances Page 58
AW_Q20D: How many drinks did you have <J4 >, including up to 4 a.m. (in the morning of <J3>)?
AW_Q20E: How many drinks did you have <J5>, including up to 4 a.m. (in the morning of <J4>)?
AW_Q20F: How many drinks did you have <J6>, including up to 4 a.m. (in the morning of <J5>)?
AW_Q20G: How many drinks did you have <J7>, including up to 4 a.m. (in the morning of <J6>)?
Comments
See the Comments for Section 1.2.1.
Results
1.2.2.1. Prevalence of Drinking within the LRDGs for Acute Effects by Province
Percentage Who
Report Drinking
within the LRDGs
by Province (2013)
Can. N.L. P.E.I. N.S. N.B. Que. Ont. Man. Sask. Alta. B.C.
88.7 85.3 88.8 87.3 87.5 88.7 89.5 89.2 88.8 87.6 88.4
1.2.2.2. Prevalence of Drinking within the LRDGs for Acute Effects by Gender
85.4% of men report drinking within the LRDGs for acute effects (2013)
92% of women report drinking within the LRDGs for acute effects (2013)
1.2.2.3. Prevalence of Drinking within the LRDGs for Acute Effects by Age
Percentage Who
Report Drinking
within LRDGs by
Age (2013)
15–17/18
yrs old
18/19–24
yrs old 25–34 yrs old 35–44 yrs old 45–54 yrs old 55–64 yrs old 65 and older
95.1 80.6 83.9 87.1 88.6 92.4 94.8
Highlights
Based on alcohol consumption in the previous seven days, about 89% of Canadians aged 15
years and older drink within LRDG for acute effects.
The proportion of Canadians who drink within LRDG for acute effects is always lower in
Newfoundland than in other provinces.
Females are consistently more likely than males to drink within LRDG for acute effects.
As people of legal drinking age get older, the proportion of those who drink within the LRDG
for acute effects increases.

The National Alcohol Strategy Monitoring Project: A Status Report
Canadian Centre on Substance Use and Addiction • Centre canadien sur les dépendances et l’usage de substances Page 59
Outcome 1.3: Reduced Alcohol-related Mortality and
Morbidity
1.3.1. Mortality Rate from Alcohol Liver Disease
Definition
Mortality rate where alcohol liver disease is identified as the main cause of death among Canadians
age 15 years old and older in a given year.
Method of Estimation
Crude mortality rate per 100,000 population due to alcohol liver disease among Canadians in a
given year.
Universe
Canadians aged 15 years and older
Main Data Sources
Canadian Vital Statistics — Death Database
Responsible Agency
Statistics Canada
Target Population
All deaths in Canada
Periodicity
Every year since 2000
Level of Representation
National and provincial
Available Data
2012
Source
CANSIM Table 102-0552 (Code K70)
Methodological References
www23.statcan.gc.ca/imdb/p2SV.pl?Function=getSurvey&SDDS=3233
Results
1.3.1.1. Alcohol Liver Disease Death and Mortality Rate by Jurisdiction
Number of Deaths
by Alcohol Liver
Disease per
100,000 (2012)
Can. N.L. P.E.I. N.S. N.B. Que. Ont. Man. Sask. Alta. B.C. Y.T. N.W.T. Nvt.
4.5 2.7 4.8 3.1 2.2 2.9 4.6 5.4 4.2 3.9 8.0 11.1 4.6 0

The National Alcohol Strategy Monitoring Project: A Status Report
Canadian Centre on Substance Use and Addiction • Centre canadien sur les dépendances et l’usage de substances Page 60
1.3.1.2. Alcohol Liver Disease Mortality Rate by Gender
6.5 male deaths per 100,000 were from alcohol liver disease in 2012
2.4 of female deaths per 100,000 were from alcohol liver disease in 2012
Highlights
In total, 1,550 alcohol liver disease deaths were registered in Canada during 2012. This
represents a national crude mortality rate of 4.5 per 100,000 population.
The province where the highest number of deaths was registered due to alcohol liver disease
in 2012 was Ontario. However, the provinces with the highest alcohol liver disease mortality
rate were British Columbia, Manitoba and Prince Edward Island. When the territories are also
considered, Yukon has the highest alcohol liver disease mortality rate in Canada.
Men are more vulnerable than women to die due to alcohol liver disease.

The National Alcohol Strategy Monitoring Project: A Status Report
Canadian Centre on Substance Use and Addiction • Centre canadien sur les dépendances et l’usage de substances Page 61
1.3.2. Deaths due to Alcohol Use Disorders
Definition
Number of Canadians age 15 years and older who died as a result of disorders attributable to the
consumption of alcohol (e.g., harmful use of alcohol, alcohol dependence) in a given year.
Method of Estimation
Number of registered deaths among Canadians 15 years old and older where alcohol use disorders
are identified as the main cause, in a given year.
Universe
Canadians aged 15 years and older
Main Data Sources
Canadian Vital Statistics — Death Database
Responsible Agency
Statistics Canada
Target Population
The death database is an administrative survey that collects demographic and cause of death
information annually from all provincial and territorial vital statistics registries on all deaths in
Canada. Prior to 2010, some data were also collected on Canadian residents who died in
some American states.
Periodicity
Every year since 2000
Level of Representation
National
Available Data
2012
Source
CANSIM Table 102-0525 (Code F10)
Methodological References
www23.statcan.gc.ca/imdb/p2SV.pl?Function=getSurvey&SDDS=3233
Results
1.3.2.1. Number of Deaths due to Alcohol Use Disorders in Canada by Gender
A total of 751 deaths due to alcohol use disorders were recorded in Canada in 2012
152 females died of deaths due to alcohol use disorders in Canada in 2012
599 males died of deaths due to alcohol use disorders in Canada in 2012
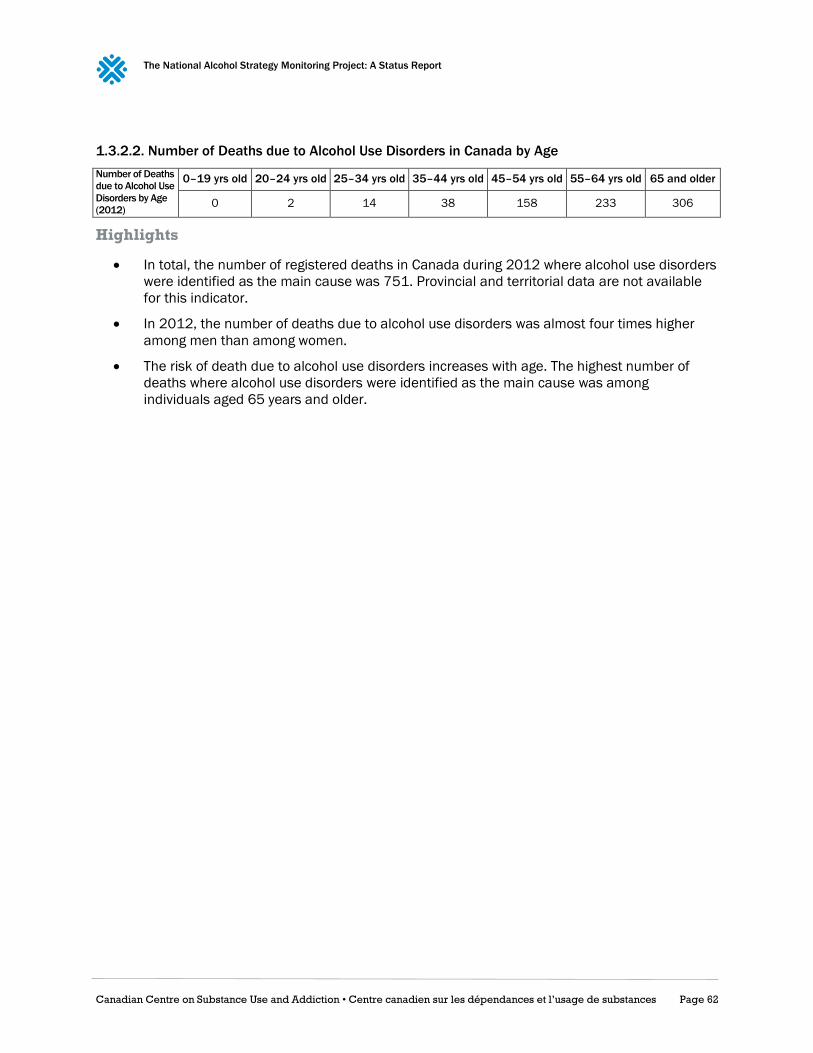
The National Alcohol Strategy Monitoring Project: A Status Report
Canadian Centre on Substance Use and Addiction • Centre canadien sur les dépendances et l’usage de substances Page 62
1.3.2.2. Number of Deaths due to Alcohol Use Disorders in Canada by Age
Number of Deaths
due to Alcohol Use
Disorders by Age
(2012)
0–19 yrs old 20–24 yrs old 25–34 yrs old 35–44 yrs old 45–54 yrs old 55–64 yrs old 65 and older
0 2 14 38 158 233 306
Highlights
In total, the number of registered deaths in Canada during 2012 where alcohol use disorders
were identified as the main cause was 751. Provincial and territorial data are not available
for this indicator.
In 2012, the number of deaths due to alcohol use disorders was almost four times higher
among men than among women.
The risk of death due to alcohol use disorders increases with age. The highest number of
deaths where alcohol use disorders were identified as the main cause was among
individuals aged 65 years and older.

The National Alcohol Strategy Monitoring Project: A Status Report
Canadian Centre on Substance Use and Addiction • Centre canadien sur les dépendances et l’usage de substances Page 63
1.3.3. Hospitalizations Attributable to Alcohol
Definition
Age-standardized rate of hospitalizations for alcohol-attributable conditions for Canadians age 15
and older per 100,000 population, including any inpatient treatment at hospitals for chronic
diseases or conditions that have been classified as entirely attributable to alcohol, but excluding
alcohol-related injuries and suicides.
Method of Estimation
Numerator: Total number of hospitalizations for a condition 100% attributable to alcohol in a
given year
Denominator: Total population age 15 years and older in that same year
Universe
Canadians aged 15 years and older
Main Data Sources
Discharge Abstract Database and Hospital Morbidity Database
Responsible Agency
Canadian Institute for Health Information
Target Population
Canadians age 15 years and older
Periodicity
Every year since 1994
Level of Representation
National and provincial (excluding Quebec)
Available Data
2012
Methodological References
www.cihi.ca/en/types-of-care/hospital-care/acute-care/dad-metadata
www.cihi.ca/en/types-of-care/hospital-care/acute-care/hmdb-metadata
Ontario Mental Health Reporting System
Responsible Agency
Canadian Institute for Health Information
Target Population
Canadians age 15 years and older
Periodicity
Every year since 2005
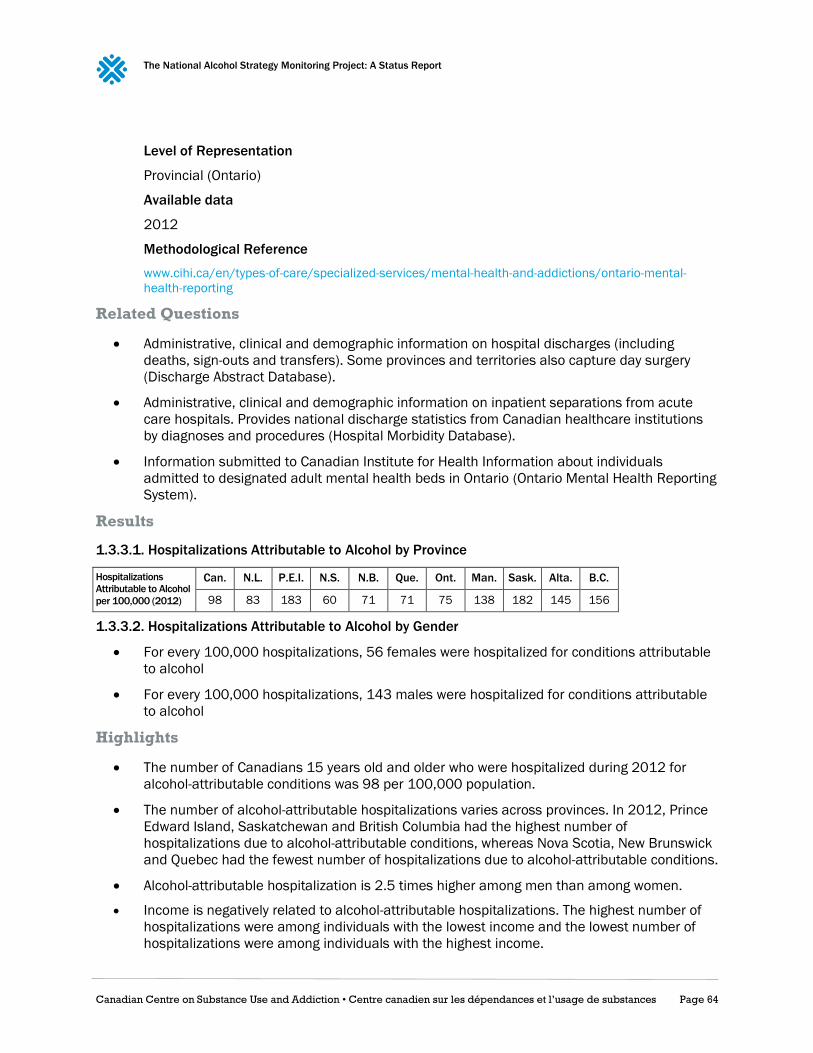
The National Alcohol Strategy Monitoring Project: A Status Report
Canadian Centre on Substance Use and Addiction • Centre canadien sur les dépendances et l’usage de substances Page 64
Level of Representation
Provincial (Ontario)
Available data
2012
Methodological Reference
www.cihi.ca/en/types-of-care/specialized-services/mental-health-and-addictions/ontario-mental-
health-reporting
Related Questions
Administrative, clinical and demographic information on hospital discharges (including
deaths, sign-outs and transfers). Some provinces and territories also capture day surgery
(Discharge Abstract Database).
Administrative, clinical and demographic information on inpatient separations from acute
care hospitals. Provides national discharge statistics from Canadian healthcare institutions
by diagnoses and procedures (Hospital Morbidity Database).
Information submitted to Canadian Institute for Health Information about individuals
admitted to designated adult mental health beds in Ontario (Ontario Mental Health Reporting
System).
Results
1.3.3.1. Hospitalizations Attributable to Alcohol by Province
Hospitalizations
Attributable to Alcohol
per 100,000 (2012)
Can. N.L. P.E.I. N.S. N.B. Que. Ont. Man. Sask. Alta. B.C.
98 83 183 60 71 71 75 138 182 145 156
1.3.3.2. Hospitalizations Attributable to Alcohol by Gender
For every 100,000 hospitalizations, 56 females were hospitalized for conditions attributable
to alcohol
For every 100,000 hospitalizations, 143 males were hospitalized for conditions attributable
to alcohol
Highlights
The number of Canadians 15 years old and older who were hospitalized during 2012 for
alcohol-attributable conditions was 98 per 100,000 population.
The number of alcohol-attributable hospitalizations varies across provinces. In 2012, Prince
Edward Island, Saskatchewan and British Columbia had the highest number of
hospitalizations due to alcohol-attributable conditions, whereas Nova Scotia, New Brunswick
and Quebec had the fewest number of hospitalizations due to alcohol-attributable conditions.
Alcohol-attributable hospitalization is 2.5 times higher among men than among women.
Income is negatively related to alcohol-attributable hospitalizations. The highest number of
hospitalizations were among individuals with the lowest income and the lowest number of
hospitalizations were among individuals with the highest income.

The National Alcohol Strategy Monitoring Project: A Status Report
Canadian Centre on Substance Use and Addiction • Centre canadien sur les dépendances et l’usage de substances Page 65
Outcome 2.2: Reduced Problem Drinking
2.2.1. Alcohol Abuse or Dependence
Definition
Proportion of Canadians 15 years old and older who were classified as meeting criteria for alcohol
abuse or dependence in the 12 months prior to the interview.
Abuse is defined as reporting at least one of the following occurrences in the same 12-month period:
failure to fulfill major roles at work, school or home, use in physically hazardous situations, recurrent
alcohol, related problems, and continued use despite social or interpersonal problems caused or
intensified by alcohol.
Alcohol dependence is defined as reporting at least three of the following occurrences in the same
12-month period: increased tolerance, withdrawal, increased consumption, unsuccessful efforts to
quit, a lot of time lost recovering or using, reduced activity, and continued use despite persistent
physical or psychological problems caused or intensified by alcohol.
Method of Estimation
Numerator: Total number of Canadian 15 years old and older meeting the criteria for alcohol
abuse or dependence
Denominator: Total sample excluding non-response categories (“refusal,” “don't know” and
“not stated”)
Universe
Canadians aged 15 years and over
Main Data Sources
Canadian Community Health Survey — Mental Health
Responsible Agency
Statistics Canada
Target Population
Canadians age 15 years and older living in a household with a telephone
Periodicity
2002; 2012
Level of Representation
National and provincial
Available Data
2012
Source
CANSIM Table 105-1101 (Alcohol abuse or dependence, 12 months)

The National Alcohol Strategy Monitoring Project: A Status Report
Canadian Centre on Substance Use and Addiction • Centre canadien sur les dépendances et l’usage de substances Page 66
Methodological References
www23.statcan.gc.ca/imdb/p2SV.pl?Function=getSurvey&lang=en&db=imdb&adm=8&dis=2&SDDS
=5015=8&dis=2&SDDS=5015
Related Questions
AUD_Q13a: First, was there ever a time in your life when your drinking or being hung over frequently
interfered with your work or responsibilities at school, on a job, or at home?
AUD_Q13a1: Was there ever a time in your life when your drinking caused arguments or other
serious or repeated problems with your family, friends, neighbours, or co-workers?
AUD_Q13b: Did you continue to drink even though it caused problems with these people?
AUD_Q13c: Were there times in your life when you were often under the influence of alcohol in
situations where you could get hurt, for example when riding a bicycle, driving, or operating a
machine?
AUD_Q13d: Were you ever arrested or stopped by the police because of drunk driving or drunken
behaviour?
AUD_Q13e: How many times were you arrested or stopped by the police due to drinking?
AUD_Q19a: Was there ever a time in your life when you often had such a strong desire to drink that
you couldn’t stop yourself from taking a drink or found it difficult to think of anything else?
AUD_Q19a1: Did you ever need to drink a larger amount of alcohol to get an effect, or did you ever
find that you could no longer get a “buzz” or a high on the amount you used to drink?
AUD_Q19b: Did you ever have times when you stopped, cut down, or went without drinking and then
experienced withdrawal symptoms like fatigue, headaches, diarrhea, the shakes, or emotional
problems?
AUD_Q19c: Did you ever have times when you took a drink to keep from having problems like these?
AUD_Q19d: Did you ever have times when you started drinking even though you promised yourself
you wouldn’t, or when you drank a lot more than you intended?
AUD_Q19e: Were there ever times when you drank more frequently or for more days in a row than
you intended?
AUD_Q19f: Did you have times when you started drinking and became drunk when you didn’t want
to?
AUD_Q19g: Were there times when you tried to stop or cut down on your drinking and found that you
were not able to do so?
AUD_Q19h: Did you ever have periods of several days or more when you spent so much time
drinking or recovering from the effects of alcohol that you had little time for anything else?
AUD_Q19i: Did you ever have a time when you gave up or greatly reduced important activities
because of your drinking, like sports, work, or seeing friends and family?
AUD_Q19j: Did you ever continue to drink when you knew you had a serious physical or emotional
problem that might have been caused by or made worse by drinking?
AUD_Q23: Did you ever have three or more of these problems in the same 12-month period?

The National Alcohol Strategy Monitoring Project: A Status Report
Canadian Centre on Substance Use and Addiction • Centre canadien sur les dépendances et l’usage de substances Page 67
Results
2.2.1.1. Alcohol Abuse or Dependence by Province
Percentage Who
Report Alcohol
Abuse or
Dependence by
Province (2012)
Can. N.L. P.E.I. N.S. N.B. Que. Ont. Man. Sask. Alta. B.C.
3.2 2.1 3.2 3.4 3.2 2.7 3.1 5.1 3.7 3.6 3.4
2.2.1.2. Alcohol Abuse or Dependence by Gender
In 2012, 4.7% males met the criteria for alcohol abuse or dependence
In 2012, 1.7% females met the criteria for alcohol abuse or dependence
2.2.1.3 Alcohol Abuse or Dependence by Age
Alcohol Abuse
or Dependence
by Age (2012)
15–24 yrs old 25–44 yrs old 45–64 yrs old 65 and older
8 3.4 2 0.6
Highlights
In Canada, 3.2% of the population aged 15 years and over is meeting the criteria for alcohol
abuse or dependence.
Males are consistently more likely than females to be classified as meeting criteria for
alcohol abuse or dependence.
As people get older, the proportion of those meeting criteria for alcohol abuse or dependence
decreases.
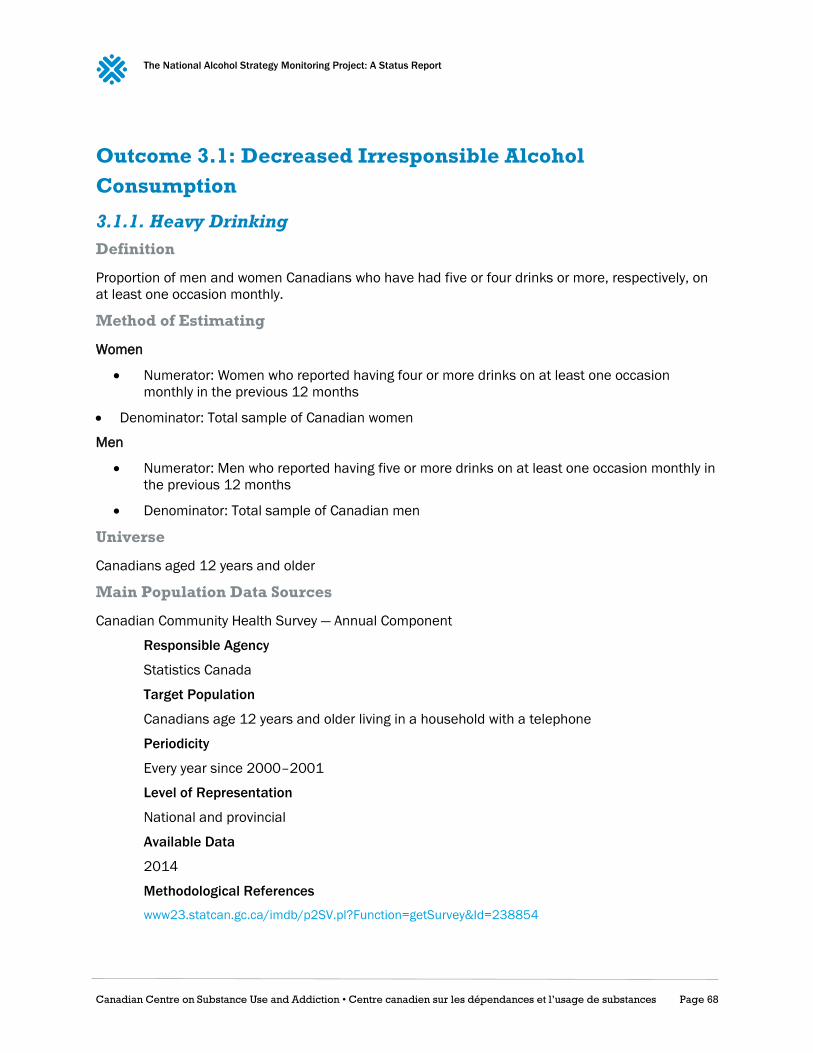
The National Alcohol Strategy Monitoring Project: A Status Report
Canadian Centre on Substance Use and Addiction • Centre canadien sur les dépendances et l’usage de substances Page 68
Outcome 3.1: Decreased Irresponsible Alcohol
Consumption
3.1.1. Heavy Drinking
Definition
Proportion of men and women Canadians who have had five or four drinks or more, respectively, on
at least one occasion monthly.
Method of Estimating
Women
Numerator: Women who reported having four or more drinks on at least one occasion
monthly in the previous 12 months
Denominator: Total sample of Canadian women
Men
Numerator: Men who reported having five or more drinks on at least one occasion monthly in
the previous 12 months
Denominator: Total sample of Canadian men
Universe
Canadians aged 12 years and older
Main Population Data Sources
Canadian Community Health Survey — Annual Component
Responsible Agency
Statistics Canada
Target Population
Canadians age 12 years and older living in a household with a telephone
Periodicity
Every year since 2000–2001
Level of Representation
National and provincial
Available Data
2014
Methodological References
www23.statcan.gc.ca/imdb/p2SV.pl?Function=getSurvey&Id=238854

The National Alcohol Strategy Monitoring Project: A Status Report
Canadian Centre on Substance Use and Addiction • Centre canadien sur les dépendances et l’usage de substances Page 69
Related Questions
ALC_Q3 (women): How often in the past 12 months have you had four or more drinks on one
occasion?
ALC_Q3 (men): How often in the past 12 months have you had five or more drinks on one occasion?
Results
3.1.1.1. Heavy Drinking by Jurisdiction
Percentage of
Population by
Province Who Report
Heavy Drinking (2014)
Can. N.L. P.E.I. N.S. N.B. Que. Ont. Man. Sask. Alta. B.C. Y.T. N.W.T. Nvt.
17.9 25.4 16.9 20.1 21.4 20.2 16.2 17.8 19.5 18.9 15.8 27.8 32.7 14.3
3.1.1.2. Heavy Drinking by Gender
In 2014, 13.2% of women reported having had four or more drinks on one occasion
In 2014, 22.7% of men reported having had five or more drinks on one occasion
3.1.1.3 Heavy Drinking by Age
Percentage of
Population by Age
Who Report Heavy
Drinking (2014)
12–19 yrs old 20–34 yrs old 35–44 yrs old 45–64 yrs old 65 and older
10.7 30.5 20.0 16.6 6.0
Highlights
Based on alcohol consumption in the previous 12 months, the prevalence of heavy drinking
on at least one occasion monthly among Canadians aged 12 years old and older was 17.9%.
Heavy drinking varies across provinces and territories. Four jurisdictions (Prince Edward
Island, Ontario, British Columbia and Nunavut) have a prevalence of heavy drinking on at
least one occasion monthly that is lower than the national average.
A greater proportion of men than women report heavy drinking on a monthly basis.
Young adults aged 20 to 34 years old are those who drink in excess the most. A third of them
do so on a monthly basis.

The National Alcohol Strategy Monitoring Project: A Status Report
Canadian Centre on Substance Use and Addiction • Centre canadien sur les dépendances et l’usage de substances Page 70
3.1.2. Alcohol Use Age of Onset
Definition
Average age of initiation to alcohol among school-aged children.
Universe
School-aged Canadian children (grades 6–12)
Main Data Sources
Canadian Student Tobacco, Alcohol and Drugs Survey
Responsible Agency
Propel Centre for Population Health Impact at the University of Waterloo with the cooperation
and support of Health Canada
Target population
Canadian students (excluding Territories) in grades 7–12 (secondaire I to V in Quebec),
Periodicity
Every two years since 2004
Level of representation
National
Available data
2014–2015
Methodological References
uwaterloo.ca/canadian-student-tobacco-alcohol-drugs-survey/about
Comments
Quebec has a different education system than the rest of Canada. Hence, while the Canadian
Student Tobacco, Alcohol, and Drugs Survey is conducted in secondary I to secondary V in Quebec, it
is conducted in grades 7–12 in the other provinces Canada.
Related Questions
Q30: How old were you when you first had a drink of alcohol that was more than just a sip?
Results
3.1.2.1. Alcohol Use Age of Onset by Gender
In 2014–2015, the average age of initiation to alcohol consumption among school-aged
children was 13.5 years old
In 2014–2015, the average age that boys started drinking was 13.3 years old, while the
average age that girls started drinking was 13.6 years old

The National Alcohol Strategy Monitoring Project: A Status Report
Canadian Centre on Substance Use and Addiction • Centre canadien sur les dépendances et l’usage de substances Page 71
3.1.3. Underage Past-Year Alcohol Use
Definition
Proportion of school-aged children who have consumed any alcohol during the past 12 months.
Method of Estimating
Numerator: Number of past-year alcohol users among school-aged children in grades 7–12
Denominator: Total sample of Canadian school-aged children in grades 7–12
Universe
School-aged Canadian children (grades 7–12)
Main Data Sources
Canadian Student Tobacco, Alcohol and Drugs Survey
Responsible agency
Propel Centre for Population Health Impact at the University of Waterloo with the cooperation
and support of Health Canada
Target Population
Canadian students (excluding Territories) in grades 7–12 (secondaire I to V in Quebec),
Periodicity
Every two years since 2004
Level of Representation
National and provincial
Available Data
2014–2015
Methodological References
uwaterloo.ca/canadian-student-tobacco-alcohol-drugs-survey/about
Comments
Due to low recruitment rate in New Brunswick, provincial estimates cannot be calculated and are
therefore excluded from table 3.1.4.1. However, numbers for New Brunswick are included in the
total for Canada.
Related Questions
Q29: In the last 12 months, how often did you have a drink of alcohol that was more than just a sip?
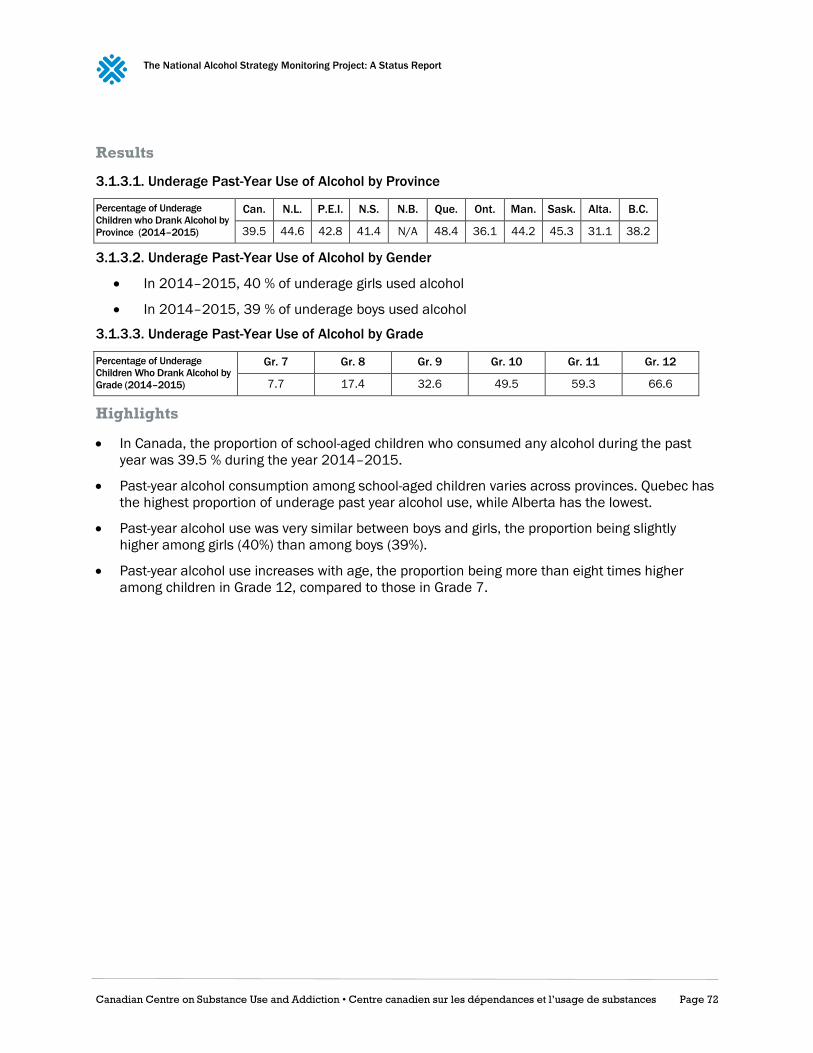
The National Alcohol Strategy Monitoring Project: A Status Report
Canadian Centre on Substance Use and Addiction • Centre canadien sur les dépendances et l’usage de substances Page 72
Results
3.1.3.1. Underage Past-Year Use of Alcohol by Province
Percentage of Underage
Children who Drank Alcohol by
Province (2014–2015)
Can. N.L. P.E.I. N.S. N.B. Que. Ont. Man. Sask. Alta. B.C.
39.5 44.6 42.8 41.4 N/A 48.4 36.1 44.2 45.3 31.1 38.2
3.1.3.2. Underage Past-Year Use of Alcohol by Gender
In 2014–2015, 40 % of underage girls used alcohol
In 2014–2015, 39 % of underage boys used alcohol
3.1.3.3. Underage Past-Year Use of Alcohol by Grade
Percentage of Underage
Children Who Drank Alcohol by
Grade (2014–2015)
Gr. 7 Gr. 8 Gr. 9 Gr. 10 Gr. 11 Gr. 12
7.7 17.4 32.6 49.5 59.3 66.6
Highlights
In Canada, the proportion of school-aged children who consumed any alcohol during the past
year was 39.5 % during the year 2014–2015.
Past-year alcohol consumption among school-aged children varies across provinces. Quebec has
the highest proportion of underage past year alcohol use, while Alberta has the lowest.
Past-year alcohol use was very similar between boys and girls, the proportion being slightly
higher among girls (40%) than among boys (39%).
Past-year alcohol use increases with age, the proportion being more than eight times higher
among children in Grade 12, compared to those in Grade 7.

The National Alcohol Strategy Monitoring Project: A Status Report
Canadian Centre on Substance Use and Addiction • Centre canadien sur les dépendances et l’usage de substances Page 73
3.1.4. Underage Heavy Drinking
Definition
Proportion of school-aged children who have had five drinks or more on at least one occasion in the
past year.
Method of Estimation
Numerator: Number of past year alcohol users among school-aged children in grades 7–12
who reported having five or more drinks on at least one occasion in the previous 12 months
Denominator: Total sample of Canadians school-aged children in grades 7–12
Universe
School-aged Canadian children (grades 7–12)
Main Data Sources
Canadian Student Tobacco, Alcohol and Drugs Survey
Responsible Agency
Propel Centre for Population Health Impact at the University of Waterloo with the cooperation
and support of Health Canada
Target Population
Canadian students (excluding Territories) in grades 7–12 (secondaire I to V in Quebec),
Periodicity
Every two years since 2004
Level of Representation
National and provincial
Available Data
2014–2015
Methodological References
uwaterloo.ca/canadian-student-tobacco-alcohol-drugs-survey/about
Comments
Due to low recruitment rate in New Brunswick, provincial estimates cannot be calculated and are
therefore excluded from table 3.1.5.1. However, numbers for New Brunswick are included in the
total for Canada.
Related Questions
Q32: In the last 12 months, how often did you have five or more drinks of alcohol on one occasion?

The National Alcohol Strategy Monitoring Project: A Status Report
Canadian Centre on Substance Use and Addiction • Centre canadien sur les dépendances et l’usage de substances Page 74
Results
3.1.4.1. Underage Heavy Drinking by Province
Percentage of Underage Children
who Drank Alcohol Heavily by
Province (2014–2015)
Can. N.L. P.E.I. N.S. N.B. Que. Ont. Man. Sask. Alta. B.C.
23.7 30.1 32.2 27.4 N/A 28.0 20.9 28.7 29.6 17.0 24.7
3.1.4.2. Underage Heavy Drinking by Gender
In 2014–2015, 23.6% of underage girls drank alcohol heavily
In 2014–2015, 23.7% of underage boys drank alcohol heavily
3.1.4.3. Underage Heavy Drinking by Grade
Percentage of Underage
Children Who Drank Alcohol
Heavily by Grade (2014–2015)
Gr. 7 Gr. 8 Gr. 9 Gr. 10 Gr. 11 Gr. 12
2.5 6.9 15.4 28.9 38.8 47.2
Highlights
In Canada, the proportion of school-aged children who have consumed five drinks or more on
at least one occasion in the past year was 23.7% during the year 2014–2015.
Underage heavy drinking varies across provinces. Prince Edward Island has the highest
proportion of school-aged children having five drinks or more on at least one occasion in the
past year (32.2%), where the lowest proportion is found in Alberta (17%).
Past year heavy drinking was very similar between school-aged boys and girls.
The proportion of school-aged children that have consumed five drinks or more on at least
one occasion in the past year increases as children grow older, moving from 2.5% in Grade 7
to 47.2% in Grade 12.
The National Alcohol Strategy Monitoring Project: A Status Report
Canadian Centre on Substance Use and Addiction • Centre canadien sur les dépendances et l’usage de substances Page 75
Outcome 3.2: Reduced Alcohol Use
3.2.1. Per Capita Consumption
Definition
Recorded amount of alcohol consumed per capita over a calendar year in Canada in litres of pure
alcohol. The indicator only takes into account consumption recorded through taxation from
production, import, export and sales data.
Method of Estimating
Numerator: The amount of recorded alcohol consumed per capita by those age 15 and older
during a calendar year in litres of pure alcohol
Denominator: Midyear Canadian population, age 15 and older, for the same calendar year
Universe
Canadians aged 15 years and older
Main Data Sources
Control and Sale of Alcoholic Beverages in Canada
Responsible Agency
Statistics Canada — Public Sector Statistics Division
Target Population
Provincial and territorial government liquor authorities
Periodicity
Every year since 2004–2005
Level of Representation
National and provincial
Available Data
2014–2015
Source
CANSIM Table 183-0023
Methodological References
www23.statcan.gc.ca/imdb/p2SV.pl?Function=getSurvey&lang=en&db=imdb&adm=8&dis=2&SDDS
=1726#a2

The National Alcohol Strategy Monitoring Project: A Status Report
Canadian Centre on Substance Use and Addiction • Centre canadien sur les dépendances et l’usage de substances Page 76
Related Questions
Section 3 — Sales within Province/Territory by Type of Beverage (excluding GST/HST, other retail
taxes and container value).
1. Sales by liquor authority
2. Sales by all other retail outlets
3. Sales to licensed establishments (bars, restaurants, etc.)
(1) Report amounts in thousands of dollars and thousands of litres.
(2) Net income in item 7 of section 2 should agree with net income as per your annual report.
(3) If actual financial and non-financial data are not available, estimates may be used in this
report. Indicate estimated data with “E.”
Results
3.2.1.1. Per Capita Consumption by Jurisdiction
Per Capita
Consumption by
Province in Litres of
Pure Alcohol (2014–
2015)
Can. N.L. P.E.I. N.S. N.B. Que. Ont. Man. Sask. Alta. B.C. Y.T. N.W.T. Nvt.
8.1 8.9 7.9 7.7 6.6 8.5 7.3 7.7 8.3 9.4 8.7 12.8 11.9 1.9
Highlights
Based on the recorded amount of alcohol consumed per capita in a calendar year,
Canadians aged 15 years and older had a per capita consumption of 8.1 litres during the
year 2014–2015.
The recorded amount of alcohol consumed per capita varies across provinces, ranging from
6.6 litres of pure alcohol in New Brunswick to 9.4 litres in Alberta.
Focusing on the territories, the Yukon (12.8 litres) and the Northwest Territories (11.9 litres)
present a per capita consumption that is much higher than the national average, while the
per capita consumption in Nunavut (1.9 litres) is minimal.
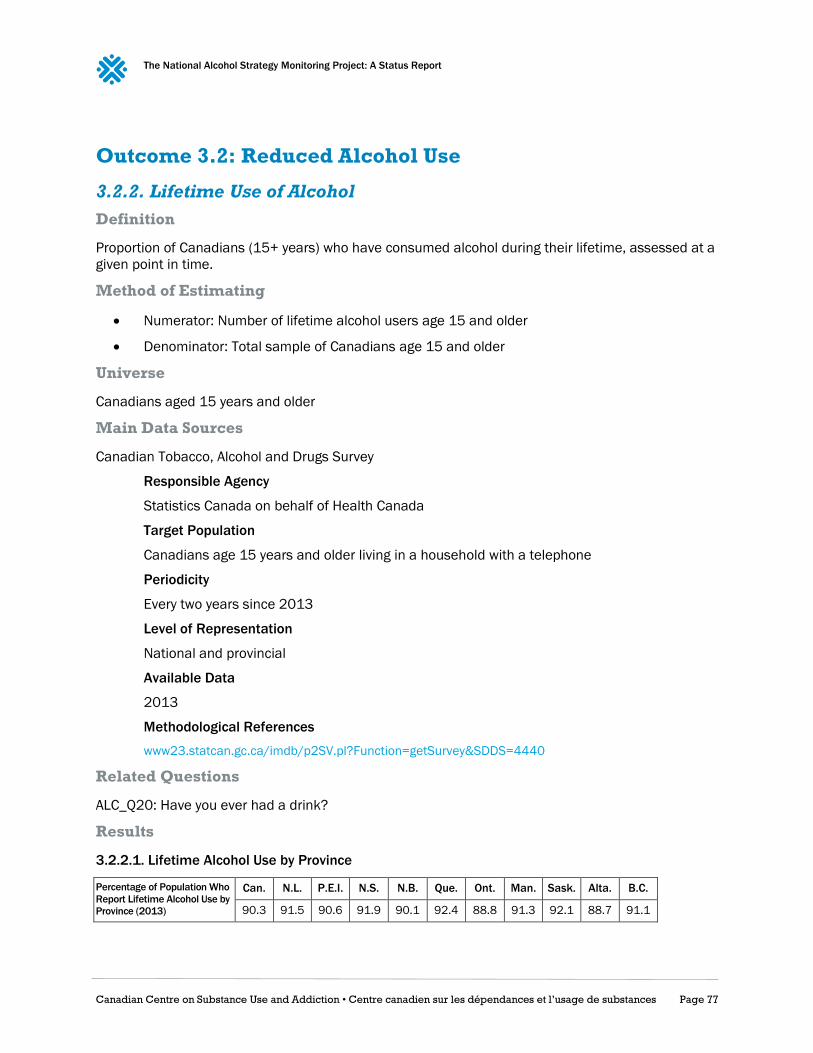
The National Alcohol Strategy Monitoring Project: A Status Report
Canadian Centre on Substance Use and Addiction • Centre canadien sur les dépendances et l’usage de substances Page 77
Outcome 3.2: Reduced Alcohol Use
3.2.2. Lifetime Use of Alcohol
Definition
Proportion of Canadians (15+ years) who have consumed alcohol during their lifetime, assessed at a
given point in time.
Method of Estimating
Numerator: Number of lifetime alcohol users age 15 and older
Denominator: Total sample of Canadians age 15 and older
Universe
Canadians aged 15 years and older
Main Data Sources
Canadian Tobacco, Alcohol and Drugs Survey
Responsible Agency
Statistics Canada on behalf of Health Canada
Target Population
Canadians age 15 years and older living in a household with a telephone
Periodicity
Every two years since 2013
Level of Representation
National and provincial
Available Data
2013
Methodological References
www23.statcan.gc.ca/imdb/p2SV.pl?Function=getSurvey&SDDS=4440
Related Questions
ALC_Q20: Have you ever had a drink?
Results
3.2.2.1. Lifetime Alcohol Use by Province
Percentage of Population Who
Report Lifetime Alcohol Use by
Province (2013)
Can. N.L. P.E.I. N.S. N.B. Que. Ont. Man. Sask. Alta. B.C.
90.3 91.5 90.6 91.9 90.1 92.4 88.8 91.3 92.1 88.7 91.1

The National Alcohol Strategy Monitoring Project: A Status Report
Canadian Centre on Substance Use and Addiction • Centre canadien sur les dépendances et l’usage de substances Page 78
3.2.2.2. Lifetime Alcohol Use by Gender
In 2013, 87.6 percent of females reported having an alcoholic drink at some point in their
lifetime
In 2013, 93 percent of males reported having an alcoholic drink at some point in their
lifetime
3.2.2.3. Lifetime Alcohol Use by Age
Percentage of
Population by Age
Who Report
Lifetime Alcohol
Use (2013)
12–17/18
yrs old
18/19–24
yrs old
25–34
yrs old
35–44
yrs old
45–54
yrs old
55–64
yrs old
65 and
older
61 90.4 91.3 91.3 92.8 93.4 92
Highlights
The great majority of the Canadian population has consumed alcohol at least once in their
lifetime, with the prevalence of lifetime use being 90.3% in 2013.
Across provinces, lifetime alcohol use varies from 83.7% in British Columbia to 92.4% in
Quebec.
Prevalence of lifetime alcohol use is higher among males (93%) than females (87.6%).
Lifetime alcohol use increases with age, with the percentage of use starting at 61% among
underage drinkers, going up to 93.4% among the 55–64 years old and then down to 92%
among the 65 years and older.

The National Alcohol Strategy Monitoring Project: A Status Report
Canadian Centre on Substance Use and Addiction • Centre canadien sur les dépendances et l’usage de substances Page 79
3.2.3. Past-Year Use of Alcohol
Definition
Proportion of Canadians (15+ years) who have consumed any alcohol during the past 12 months,
assessed at a given point in time.
Method of Estimating
Numerator: Number of past year alcohol users age 15 and older
Denominator: Total sample of Canadians age 15 and older
Universe
Canadians aged 15 years and older
Main data sources
Canadian Tobacco, Alcohol and Drugs Survey
Responsible Agency
Statistics Canada on behalf of Health Canada
Target Population
Canadians age 15 years and older living in a household with a telephone
Periodicity
Every two years since 2013
Level of Representation
National and provincial
Available Data
2013
Methodological References
www23.statcan.gc.ca/imdb/p2SV.pl?Function=getSurvey&SDDS=4440
Related Questions
ALC_Q10: How often did you drink alcohol beverages during the past 12 months?
Results
3.2.3.1. Past-Year Alcohol Use, by Province
Percentage of Past-
Year Alcohol Use by
Province (2013)
Can. N.L. P.E.I. N.S. N.B. Que. Ont. Man. Sask. Alta. B.C.
75.9 72.5 74.6 76.2 73.9 82.8 72.7 74.8 75.5 74.5 75.3

The National Alcohol Strategy Monitoring Project: A Status Report
Canadian Centre on Substance Use and Addiction • Centre canadien sur les dépendances et l’usage de substances Page 80
3.2.3.2. Past-Year Alcohol Use by Gender
In 2013, 71.2% of females reported past-year alcohol use
In 2013, 80.6% of males reported past-year alcohol use
3.2.3.3. Past-Year Alcohol Use by Age
Percentage of
Population by Age
Who Report
Lifetime Alcohol
Use (2013)
15–17/18
yrs old
18/19–24
yrs old
25–34
yrs old
35–44
yrs old
45–54
yrs old
55–64
yrs old
65 and
older
51.6 83.5 81.6 80.3 78.8 74.3 67.7
Highlights
In 2013, about three-quarter (76%) of Canadians consumed alcohol in the previous year.
Past-year alcohol use varies between the provinces, ranging from 73% in Newfoundland and
Labrador to 83% in Quebec.
Men (81%) present a higher prevalence of past-year alcohol use than women (71%).
The prevalence of alcohol use in the past year is at its highest among young adults under the
age of 24 years old (84%) and at its lowest among Canadians aged 65 years old and older
(68%), unless we take into account underage drinkers, where the prevalence is at 52%.

The National Alcohol Strategy Monitoring Project: A Status Report
Canadian Centre on Substance Use and Addiction • Centre canadien sur les dépendances et l’usage de substances Page 81
Outcome 4.3: Reduced Impaired Driving
4.3.1. Alcohol-Impaired Driving
Definition
Number of reported incidents of impaired driving where alcohol use has been identified (e.g., by
breath testing, blood or urine analysis, or observational assessment) in Canada in a given year.
Method of Estimating
Reported incidents of impaired driving where alcohol use has been identified in Canada in a given
year, divided by the number of clusters of 100,000 population in the same year.
Universe
Canadian society
Main Data Sources
Uniform Crime Reporting Survey
Responsible Agency
Statistics Canada — Public Sector Statistics Division
Target Population
Crimes that come to the attention of the police
Periodicity
Every year since 1999
Level of Representation
National and provincial
Available Data
2015
Source
CANSIM Table 252-0051 (Code 9230)
Methodological References
www23.statcan.gc.ca/imdb/p2SV.pl?Function=getSurvey&lang=en&db=imdb&adm=8&dis=2&SDDS
=3302#a2
Related Questions
Impaired Operation of Motor Vehicle or Over 80 mg.
a) Only one offence is to be scored for each incident. In cases involving “Impaired Operation” and
“Fail or Refuse” offences, score only the more serious one, if the Refusal takes place at the scene of
the Impaired Operation.
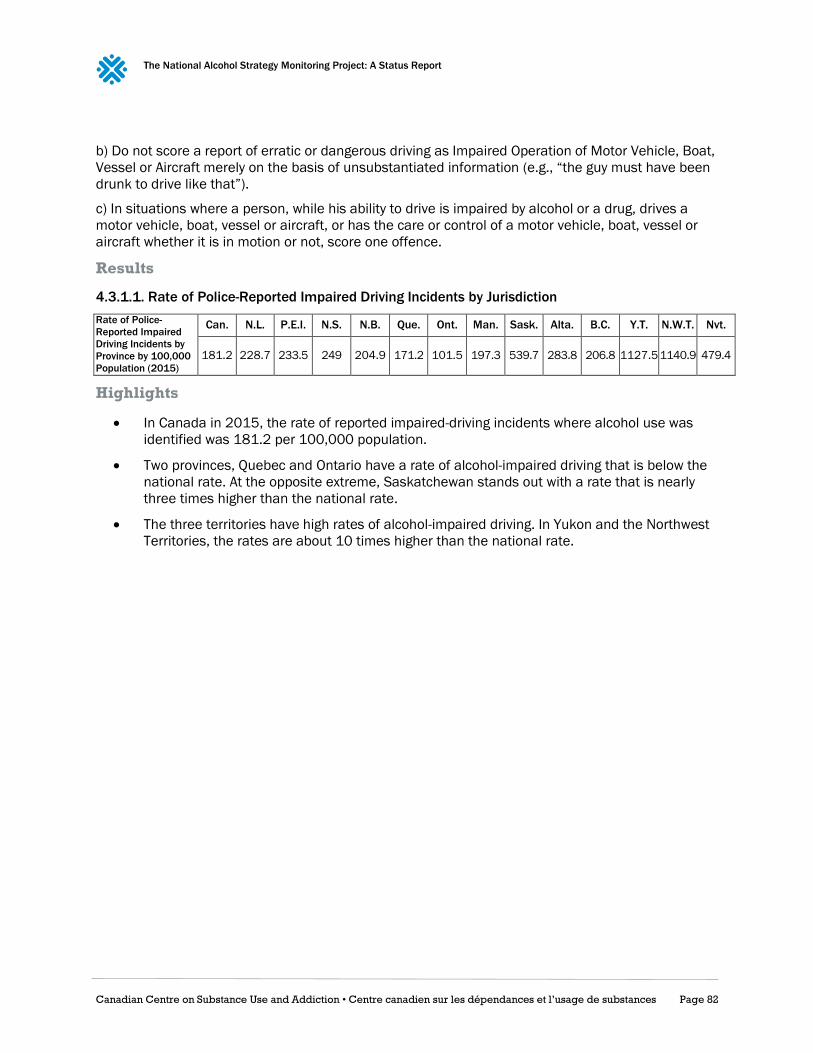
The National Alcohol Strategy Monitoring Project: A Status Report
Canadian Centre on Substance Use and Addiction • Centre canadien sur les dépendances et l’usage de substances Page 82
b) Do not score a report of erratic or dangerous driving as Impaired Operation of Motor Vehicle, Boat,
Vessel or Aircraft merely on the basis of unsubstantiated information (e.g., “the guy must have been
drunk to drive like that”).
c) In situations where a person, while his ability to drive is impaired by alcohol or a drug, drives a
motor vehicle, boat, vessel or aircraft, or has the care or control of a motor vehicle, boat, vessel or
aircraft whether it is in motion or not, score one offence.
Results
4.3.1.1. Rate of Police-Reported Impaired Driving Incidents by Jurisdiction
Rate of Police-
Reported Impaired
Driving Incidents by
Province by 100,000
Population (2015)
Can. N.L. P.E.I. N.S. N.B. Que. Ont. Man. Sask. Alta. B.C. Y.T. N.W.T. Nvt.
181.2 228.7 233.5 249 204.9 171.2 101.5 197.3 539.7 283.8 206.8 1127.5 1140.9 479.4
Highlights
In Canada in 2015, the rate of reported impaired-driving incidents where alcohol use was
identified was 181.2 per 100,000 population.
Two provinces, Quebec and Ontario have a rate of alcohol-impaired driving that is below the
national rate. At the opposite extreme, Saskatchewan stands out with a rate that is nearly
three times higher than the national rate.
The three territories have high rates of alcohol-impaired driving. In Yukon and the Northwest
Territories, the rates are about 10 times higher than the national rate.
The National Alcohol Strategy Monitoring Project: A Status Report
Canadian Centre on Substance Use and Addiction • Centre canadien sur les dépendances et l’usage de substances Page 83
4.3.2. Alcohol-related Driving Charges
Definition
Number of charges registered for impaired driving due to alcohol consumption, both in Canadian
youth courts (age 12–17 years) and adult criminal courts (age 18 years and older), in a given year. A
charge refers to a formal accusation against an accused person or company involving a federal
statute offence that has been processed by the courts and received a final decision (i.e., guilty,
acquitted, stayed or withdrawn).
Method of Estimating
Total number of charges for impaired driving due to alcohol consumption where the accused was
found guilty.
Universe
Canadians aged 12 years and older
Main Data Sources
Integrated Criminal Court Survey
Responsible Agency
Statistics Canada, Canadian Centre for Justice Statistics, in collaboration with provincial and
territorial government departments responsible for criminal courts in Canada.
Target Population
The adult component of the survey includes persons aged 18 years or older at the time of
the offence and companies.
The youth component of the survey includes persons aged 12 to 17 years old at the time of
the offence and companies.
Periodicity
Every year since 1994
Level of Representation
National and provincial
Available Data
2014–2015
Source
CANSIM Table 252-0053 (Code K70)
Methodological References
www23.statcan.gc.ca/imdb/p2SV.pl?Function=getSurvey&lang=en&db=imdb&adm=8&dis=2&SDDS
=3312
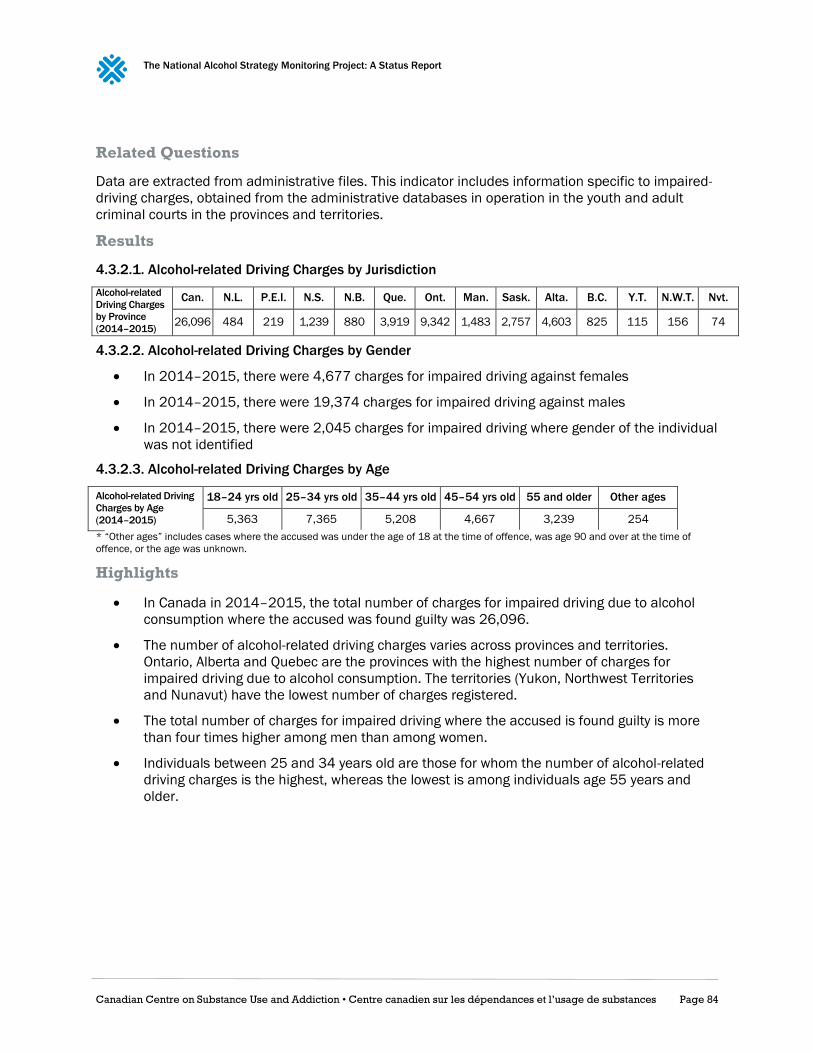
The National Alcohol Strategy Monitoring Project: A Status Report
Canadian Centre on Substance Use and Addiction • Centre canadien sur les dépendances et l’usage de substances Page 84
Related Questions
Data are extracted from administrative files. This indicator includes information specific to impaired-
driving charges, obtained from the administrative databases in operation in the youth and adult
criminal courts in the provinces and territories.
Results
4.3.2.1. Alcohol-related Driving Charges by Jurisdiction
Alcohol-related
Driving Charges
by Province
(2014–2015)
Can. N.L. P.E.I. N.S. N.B. Que. Ont. Man. Sask. Alta. B.C. Y.T. N.W.T. Nvt.
26,096 484 219 1,239 880 3,919 9,342 1,483 2,757 4,603 825 115 156 74
4.3.2.2. Alcohol-related Driving Charges by Gender
In 2014–2015, there were 4,677 charges for impaired driving against females
In 2014–2015, there were 19,374 charges for impaired driving against males
In 2014–2015, there were 2,045 charges for impaired driving where gender of the individual
was not identified
4.3.2.3. Alcohol-related Driving Charges by Age
Alcohol-related Driving
Charges by Age
(2014–2015)
18–24 yrs old 25–34 yrs old 35–44 yrs old 45–54 yrs old 55 and older Other ages
5,363 7,365 5,208 4,667 3,239 254
* “Other ages” includes cases where the accused was under the age of 18 at the time of offence, was age 90 and over at the time of
offence, or the age was unknown.
Highlights
In Canada in 2014–2015, the total number of charges for impaired driving due to alcohol
consumption where the accused was found guilty was 26,096.
The number of alcohol-related driving charges varies across provinces and territories.
Ontario, Alberta and Quebec are the provinces with the highest number of charges for
impaired driving due to alcohol consumption. The territories (Yukon, Northwest Territories
and Nunavut) have the lowest number of charges registered.
The total number of charges for impaired driving where the accused is found guilty is more
than four times higher among men than among women.
Individuals between 25 and 34 years old are those for whom the number of alcohol-related
driving charges is the highest, whereas the lowest is among individuals age 55 years and
older.

The National Alcohol Strategy Monitoring Project: A Status Report
Canadian Centre on Substance Use and Addiction • Centre canadien sur les dépendances et l’usage de substances Page 85
Outcome 4.4: Reduced Intentional and Unintentional
Injuries
4.4.1. Deaths in Alcohol-related Crash
Definition
Number of alcohol-related road traffic deaths where alcohol use has been identified (e.g., by breath
testing, blood or urine analysis, or observational assessment) in Canada, in a given year.
Method of Estimation
Total number of motor vehicle fatalities * Percentage of known alcohol-related deaths
Universe
Canadian population
Main Data Sources
National Fatality Database
Responsible Agency
Traffic Injury Research Foundation
Target Population
Persons fatally injured in motor vehicle crashes occurring on and off public highways in
Canada
Periodicity
Every year since 1973
Level of Representation
• 1973–1986: British Columbia, Alberta, Saskatchewan, Manitoba, Ontario, New Brunswick and
Prince Edward Island • 1987–2010: All jurisdictions
• 2011–2012: All jurisdictions except British Columbia
Available Data
2012
Methodological References
ccmta.ca/images/publications/pdf/2012_Alcohol__Drug_Crash_Problem_Report_ENG.pdf
Related Questions
Police reports on fatal motor vehicle collisions
Coroners and medical examiners reports
In general, both sources must be accessed to obtain complete data on victims, crashes, vehicles and
toxicology.

The National Alcohol Strategy Monitoring Project: A Status Report
Canadian Centre on Substance Use and Addiction • Centre canadien sur les dépendances et l’usage de substances Page 86
Comments
In 2012, the National Fatality Database did not include data from British Columbia. Hence, the
national total number of Canadian crash deaths is underestimated.
Results
4.4.1.1. Deaths in Alcohol-related Crashes by Jurisdiction
Deaths in
Alcohol-related
Crashes by
Province (2012)
Can. N.L. P.E.I. N.S. N.B. Que. Ont. Man. Sask. Alta. Y.T. N.W.T. Nvt.
769 15 8 30 35 140 232 52 94 158 1 2 2
Total number of deaths for Canada excludes British Columbia
4.4.1.2. Deaths in Alcohol-related Crashes by Gender
In 2012, 154 females died in alcohol-related crashes
In 2012, 614 males died in alcohol-related crashes
4.4.1.3. Deaths in Alcohol-related Crashes by Age
Deaths in Alcohol-
related Crashes by
Age (2012)
Under 16 16–19 yrs old 20–25 yrs old 26–35 yrs old 36–45 yrs old 46–55 yrs old Over 55
7 81 164 167 121 128 90
Number of deaths excludes British Columbia
Highlights
In Canada in 2012, a total of 769 deaths resulted from alcohol-related crashes.
The number of fatal alcohol-related road crashes varies among provinces and territories.
Ontario, Alberta and Quebec are the provinces with the highest number of fatal alcohol-
related road crashes. The territories (Yukon, Northwest Territories and Nunavut) have the
lowest number of fatal crashes registered.
Almost four times as many males as females died in alcohol-related crashes in 2012.
The highest number of alcohol-related road traffic deaths was among individuals between 20
and 35 years old.
The National Alcohol Strategy Monitoring Project: A Status Report
Canadian Centre on Substance Use and Addiction • Centre canadien sur les dépendances et l’usage de substances Page 87
4.4.2. Drivers in Alcohol-related Serious Injury Crashes
Definition
Number of drivers that were involved in alcohol-related road traffic crashes in which someone, not
necessarily the driver, was seriously injured in Canada in a given year.
Method of Estimation
Total number of drivers in crashes * the percentage of known alcohol-related crashes
Universe
Canadian population
Main Data Sources
Serious Injury Database
Responsible agency
Traffic Injury Research Foundation
Target Population
Persons seriously injured in crashes and drivers involved in these crashes.
Periodicity
Every year since 1995
Level of Representation
• 1995–1997: All jurisdictions except Yukon and British Columbia.
• 1998–2004: All jurisdictions except British Columbia.
• Since 2005: All jurisdictions
Available data
2012
Methodological References
ccmta.ca/images/publications/pdf//2012_Alcohol__Drug_Crash_Problem_Report_ENG.pdf
Related Questions
Motor vehicle crash reports completed by investigating police officers.
Comments
Data from Nunavut are excluded from the 2012 Serious Injury Database because they were not
available at the time the Traffic Injury Research Foundation report was being prepared.

The National Alcohol Strategy Monitoring Project: A Status Report
Canadian Centre on Substance Use and Addiction • Centre canadien sur les dépendances et l’usage de substances Page 88
Results
4.4.2.1. Drivers in Alcohol-related Serious Injury Crashes by Jurisdiction
Alcohol-related
Serious Injury
Crashes by
Province (2012)
Can. N.L. P.E.I. N.S. N.B. Que. Ont. Man. Sask. Alta. B.C. Y.T. N.W.T.
2,314 32 19 70 59 502 503 48 135 508 434 3 1
Total number for Canada excludes Nunavut
4.4.2.2. Drivers in Alcohol-related Serious Injury Crashes by Gender
In 2012, 490 females were drivers in alcohol-related crashes that resulted in serious injury
In 2012, 1,749 males were drivers in alcohol-related crashes that resulted in serious injury
In 2012, 75 drivers of unknown gender were in alcohol-related crashes that resulted in
serious injury
4.4.2.3. Drivers in Alcohol-related Serious Injury Crashes by Age
Alcohol-related
Serious Injury
Crashes by Age
(2012)
Under 16 16–19
yrs old
20–25
yrs old
26–35
yrs old
36–45
yrs old
46–55
yrs old Over 55 Unknown
8 239 504 534 341 335 222 131
Total numbers exclude Nunavut
Highlights
In Canada in 2012, 2,314 drivers were involved in alcohol-related road traffic crashes where
someone was seriously injured.
The number of drivers involved in alcohol-related crashes where someone was seriously
injured varies among provinces and territories. Alberta, Ontario and Quebec are the
provinces with the highest number of such crashes. The territories (Yukon and Northwest
Territories) have the lowest number of drivers involved in alcohol-related crashes where
someone was seriously injured.
Almost 3.5 times as many male drivers as female drivers were involved in alcohol-related
crashes where someone was seriously injured.
The highest number of drivers involved in alcohol-related crashes where someone was
seriously injured is among individuals between 20 and 35 years of age.