the moving escalator? patterns of residential mobility … ndc moving... · based measures,...
TRANSCRIPT
The Moving Escalator?Patterns of ResidentialMobility in New Deal forCommunities areas
Research Report 32

January 2007Department for Communities and Local Government
Centre for Regional Economic and Social ResearchSheffield Hallam University
Ian ColePaul Lawless
Julie ManningIan Wilson
The Moving Escalator?Patterns of ResidentialMobility in New Deal forCommunities areas
Research Report 32

This report has been produced by Sheffield Hallam University as part of a contract placed by Departmentfor Communities and Local Government. Any views or proposed policies expressed in it are not necessarily thoseof the Department.
On 5th May 2006 the responsibilities of the Office of the Deputy Prime Minister (ODPM)transferred to the Department for Communities and Local Government.
Department for Communities and Local GovernmentEland HouseBressenden PlaceLondon SW1E 5DUTelephone: 020 7944 4400Website: www.communities.gov.uk
© Queen’s Copyright 2007
Copyright in the typographical arrangement rests with the Crown.
This publication, excluding logos, may be reproduced free of charge in any format or medium for research, privatestudy or for internal circulation within an organisation. This is subject to it being reproduced accurately and notused in a misleading context. The material must be acknowledged as Crown copyright and the title of thepublication specified.
Any other use of the contents of this publication would require a copyright licence. Please apply for a Click-UseLicence for core material at www.opsi.gov.uk/click-use/system/online/pLogin.asp or by writing to the Officeof Public Sector Information, Information Policy Team, St Clements House, 2-16 Colegate, Norwich NR3 1BQ.Fax: 01603 723000 or e-mail: [email protected].
If you require this publication in an alternative format please email [email protected]
Communities and Local Government PublicationsPO Box 236WetherbyWest YorkshireLS23 7NBTel: 0870 1226 236Fax: 0870 1226 237Textphone: 0870 1207 405E-mail: [email protected] online via the Communities and Local Government website: www.communities.gov.uk
January 2007
Product Code 06 NRA 004333
CONTENTS
KEY POINTS 2
1. INTRODUCTION 5
2. METHODOLOGY 7
3. WHO IS MOVING? 9
4. WHY DID RESIDENTS MOVE? 12
5. WHERE DID RESIDENTS MOVE TO BY TENURE AND GEOGRAPHY? 19
6. HAS LIFE IMPROVED FOR MOVERS IN THEIR NEW AREAS? 22
7. CONCLUSIONS AND POLICY IMPLICATIONS 32
1
Key points
There is a dearth of evidence about the characteristics of those who moveout of neighbourhoods undergoing regeneration, compared with stayers or inmovers. This analysis is based on a relatively small sample of thosemoving out of New Deal for Communities (NDC) areas between 2002 and2004. Nevertheless, it does provide valuable insights into the differentcharacteristics of, and outcomes for, different ‘mobility’ populations.
A number of key conclusions can be derived from this analysis:
• when compared with inmovers, those leaving the 39 NDC neighbourhoodsare more likely to be older, in employment and to move into owner-occupied accommodation
• inmovers nevertheless provide a potential resource on which to buildlonger term sustainable change in that they are younger, healthier andbetter educated than those who stayed in NDCs between 2002 and 2004
• on the broader canvas, this evidence tends to support the notion of a‘moving escalator’ in neighbourhood renewal: those in jobs and who arein, or who intend to enter, the owner-occupied sector are being replacedby those who are less likely to be in employment and who are morelikely to be relatively less well off and to live in rented accommodation
• those who flagged up an intention to move in 2002 were in the eventmore likely to do so than those who intended to remain; attitudes andaspirations are therefore often realised through subsequent actions: thismay conceivably help Partnerships plan ahead by estimating futureresidential turnover
• people move for a range of area-based, environmental and property-related reasons: the most important specific reasons for leaving were toaccess a better choice and quality of housing, lower crime rates in non-NDC areas, fewer problems of anti-social behaviour, more policing, andthe quality of the local environment; not many leave primarily because of employment related factors
• it is not possible definitively to indicate whether NDC interventions inrelation to say training or job mentoring actually encourage people tomove; what evidence is available is mixed: there are no differencesbetween outmovers and stayers in relation to having heard of, or beinginvolved with, their local NDC; on the other hand outmovers are morelikely than stayers to have undertaken, and to see benefits arising from,personal training and education
• one third of those who left between 2002 and 2004 would have beeninclined to stay in NDC areas if improvements had taken place in termsof local housing and environmental standards
2
The Moving Escalator?

• but once people leave they are unlikely ever to return, both because theyprefer their new location and because they identify continuing problemsin their previous NDC location
• compared with those who stayed in NDC areas between 2002 and 2004,outmovers are more likely to be satisfied with their accommodation, thearea and their overall quality of life and they are much less likely to wantto move again
• there is evidence too that outmovement is associated with improvementsto health and socio-economic status
• Twenty-seven per cent of outmovers had not wanted to move from their2002 NDC accommodation; but by 2004 more improvements had occurred for these ‘forced outmovers’ than was true for those who stayed in NDCs;such changes were not however as positive as had occurred for outmovers as whole
• considerable changes in tenure occurred for outmovers: whereas 38 percent were in owner-occupation in 2002, fully 48 per cent were so twoyears later; moving places is often associated with tenure change; thosewho leave NDC areas, and in turn move into owner-occupation, aremuch more likely to be satisfied than the (admittedly small) group ofoutmovers moving from owner-occupation to renting.
This evidence contains clear policy implications for neighbourhood renewal:
• housing design and tenure are critical factors influencing mobility;policies could seek to maximise opportunities for residents to realise their housing preferences locally, throughout the life cycle, by providing,or facilitating the provision of, more diverse property types, sizes anddesigns in all tenures, but especially in the owner-occupied sector
• encouraging people to stay is not just about housing measures; it alsocentrally bound up with environmental issues and, in particular, thewidespread perceptions of high levels of crime and anti-social behaviourin renewal areas such as NDCs; these are critical key ‘push’ factors forthose leaving NDC areas; the dilemma for Area Based Initiatives (ABIs) is that improvements to housing, environmental infrastructure and crimereduction can take a considerable period of time to introduce because of the complexity of problems and the high capital investment oftenrequired; some households will not wait around until the benefits fromsuch measures start to materialise
• the shift in the ethnic profile between outmovers and inmovers isstriking; this may well reflect a process whereby members of some BME communities are moving into these areas due to more constrainedmobility choices in the housing market; this carries messages about thepotential need to develop pro-active community cohesion strategies toconfront any local tensions which may arise from changes in the ethnic profile
3
Key points

• the characteristics of inmovers in some areas is likely to be increasinglyshaped by economic in-migration, especially from EU accession states;the impact of NASS dispersal policies has emerged as an important localissue in some NDC areas, especially those in London; NDCs have onlylimited resources to deal with housing and social problems arising frommajor influxes of economic migrants
• this evidence suggests that relatively wide geographical areas may beaffected by residential mobility stemming from area based regeneration;only a quarter of outmovers relocate to areas within 2km of the NDCconcerned
• the scale of out-, and in-, moving over time will be strongly affected bythe housing market context for the neighbourhood concerned; ‘tight’housing markets, as in parts of London, are likely to experience less turnover than will other areas, characterised by lower demand; the need to buildin assumptions about residential turnover in regeneration programmeshas often been neglected in the past; but it is a vital ingredient in informing an appropriate balance between place, and people, based measures
• finally, there is the wider issue about the role which NDC areas havetraditionally played in urban housing markets; at least some haveprovided cheaper rented, and indeed owner-occupied, accommodationfor relatively disadvantaged groups and first time buyers; if housingprogrammes in NDCs ultimately reduce the availability of cheaperaccommodation, presumably this demand will increase in other similarneighbourhoods; this has always been a central dilemma for renewal andregeneration: improving one area may displace demand for lower costhousing elsewhere.
Evidence presented here is unable directly to address one key policy issue:do ABI interventions of themselves encourage people to leave? It is notpossible to trace through the impact on these movers of what may, in anyarea, be in excess of over a hundred NDC funded interventions. But it seemsplausible to assume that through time, as an increasing portfolio of NDCfunded training, job mentoring, job search, and educational attainmentprojects are implemented, this may ‘encourage’ some beneficiaries to leave.If this proves to be the case:
• area based renewal programmes may need to look for a sensible balancebetween place-based measures, encouraging people to stay, and person-based measures, stimulating out-migration arising from project beneficiaries seeking economic or educational opportunities beyond the neighbourhood
• there may be a case for thinking through the phasing of interventions: if an intensive push is placed on people-based measures beforeimprovements are made to the local environment and the housingmarket, this may well encourage outmigration
• measures which are probably most likely to encourage people to leaveare those impacting on personal labour market skills and employment-related initiatives; in some instances there may be an argument forthinking radically here and postponing the introduction of new ‘person-based’ initiatives until place based improvements have been put in place.4
The Moving Escalator?

1 Introduction
1.1 Area based initiatives (ABIs), such as New Deal for Communities (NDC),tend to assume two over arching goals:
• improving the beneficiary neighbourhood
• and also the life chances of those living in it.
1.2 But there can be tensions between these two objectives. One of these isaddressed in this report: what will be the impact of renewal policies on thestability of populations living in beneficiary areas?
1.3 On the one hand, regenerating the neighbourhood, through, say, reducingcrime and improving housing and the physical environment, should makethe area more attractive to existing residents1. As fewer residents want toleave the area, and those who do are replaced more rapidly, populationturnover should be lower and, thus, community stability and cohesionimprove2. Evaluations of previous ABIs such as City Challenge have stressedthe importance of developing strong links between housing renewal andother policy dimensions such as crime, environmental improvements,employment and training3.
1.4 On the other hand, improving life chances, through education, healthpromotion, training, job mentoring and so on, may help the job prospectsand material circumstances of local residents. As a result, more may want,and be able to, leave the area. If these outmovers are in turn replaced byrelatively more disadvantaged households NDCs may find themselvesworking with steadily more deprived communities.
1.5 Some evidence of this process, often termed the ‘moving escalator’ problem,was found during Phase 1 of the evaluation. For example, Beatty et al(2005)4, in a study of drivers of mobility in NDC areas using the 2002 and2004 Ipsos MORI NDC Household Surveys, found that:
• thirty-eight per cent of NDC residents want to move out of the area in2004; 16 percentage points higher than the national average
• those most likely to want to move were women; younger people;residents from African-Caribbean communities; those with higherqualifications, those in working households; and those living as socialand private tenants
5
1 Beatty C, Cole I, Grimsley G, Hickman P, and Wilson I (2005) Housing & the Physical Environment:Will residents stay and reap the benefits?http://ndcevaluation.adc.shu.ac.uk/ndcevaluation/Reports.asp
2 Kearns A and Parkes A (2003) ‘Living in and leaving poor neighbourhood conditions in England’.Housing Studies, Vol. 18, No 6: 827-851 Parkes A, Kearnes A, Atkinson R (2002) ‘What makes people dissatisfied with their neighbourhoods?’Urban Studies, Vol. 39, No. 13: 2413-2428
3 ODPM (2005) City Challenge: final national evaluation4 Beatty C, Cole I, Grimsley G, Hickman P, and Wilson I (2005) op.cit

• the diverse and complex motivations behind mobility aspirations could begrouped into four main factors relating to property, the area, personalcircumstances, and work based considerations.
1.6 This paper builds on these broad brush findings from Phase 1 of theevaluation. In particular, this paper considers five key issues:
• who is moving out of NDC areas, who is moving in, and who is staying?
• why are people moving out of NDC areas?
• where are residents moving to by tenure and geography?
• has life improved for outmovers?
• do outcomes differ for ‘forced’ outmovers?
1.7 The wider implications of these findings for area based renewal andregeneration are outlined in the final section.
6
The Moving Escalator?
2 Methodology
2.1 Data used in this analysis are drawn from various Ipsos MORI Surveys:
• 2002 Household Survey (19,574 respondents)
• 2004 Household Survey (19,633 respondents)
• 2002 – 2004 Household Longitudinal element (10,638 respondents)
• 2004 Household Movers’ Survey (459 respondents).
2.2 The 2002 Household Survey provides baseline characteristics for residentsliving in NDC areas, including information about moving intentions andlevels of satisfaction with the area. Used in combination with the 2002Household Survey, the 2004 Survey provides information about thecharacteristics of residents who stayed in the area between 2002 and 2004(the panel). Finally, the 2004 Movers’ Survey provides important insights intothe attitudes, motivations and outcomes for a relatively small group ofresidents who left NDC areas between these two dates.
2.3 In line with previous experience of ABI evaluations, tracking movers proveda challenging and difficult process. A number of methods were usedincluding:
• friends and family contacts (residents were asked to provide these as partof the 2002 Survey)
• the National Change of Address Database
• return of address cards
• calling mobiles
• interviewer tracing at/around previous address
• the electoral register.
2.4 Ipsos MORI successfully tracked and interviewed 459 movers of the 3,515‘potential movers’ who may have re-located between 2002 and 20045. Ofthese 473, 330 had moved outside the NDC area (‘outmovers’) and 129 hadmoved within the NDC area (‘within area movers’).
7
5 Ipsos MORI (2005) Movers’ Survey 2004 Technical Report: the potential mover universe is calculatedusing the household survey contact sheet for those respondents interviewed in 2002 but not in 2004.Briefly, any address NOT coded as respondent: ‘still living in household’; ‘died’; ‘refused/no contact’or ‘other, not needed, withdrawn’ is classified as a ‘potential mover’.

2.5 This paper explores change in relation to three key groups derived fromthese data sources:
• within area stayers: those remaining within NDC areas: a combined group of 10,767 respondents, made up of the panel (10,638 longitudinalrespondents who were interviewed at the same address in 2002 and2004) and within area movers (129 respondents interviewed in 2004 as ‘movers’ but who had not moved outside the NDC area)
• inmovers: those moving into NDC areas and interviewed as part of the2004 NDC Household Survey, constituting 2,225 respondents
• outmovers: the 330 respondents interviewed as part of the 2002 NDCHousehold Survey, who moved out of the 39 areas between 2002 and2004 and who were subsequently traced.
2.6 In addition, outcomes are identified for a subset of outmovers: ‘forcedoutmovers’. Of the 330 outmover respondents interviewed in 2004, 93 (27 per cent) indicate they did not want to move from their old area.
2.7 Finally, moving intentions are explored for ‘trapped’ respondents.Respondents are deemed to be ‘trapped’ if they want to move from theirproperty, but do not think they will do so within the next two years.
2.8 It should be pointed out that because of the small size of the outmoverspopulation, the use of statistical techniques, such as logistic regressionmodelling, is limited. Analysis, therefore, is restricted to descriptivetechniques, and for the forced outmovers, to simple frequencies.
2.9 It should also be noted that a separate Movers’ Survey will not beundertaken in the 2006-2009 Phase 2 of the evaluation. However, furtherevidence regarding outcomes for movers will be forthcoming through:
• individual level administrative data covering worklessness benefits andpossibly educational attainment rates
• the 2006 Household Survey will reveal patterns across different ‘mobility’groups including 2004-2006 stayers and those moving into NDC areabetween 2004 and 2006; it will also be possible to tease out the broadcharacteristics of those who left between 2002 and 2006
• conceivably, via more focussed work on outmigration within some or allof six NDC case study areas.
8
The Moving Escalator?

3 Who is moving?
3.1 The 2005 NDC Interim Evaluation6 briefly addressed the characteristics ofdifferent ‘mobility’ populations. For convenience key conclusions are re-iterated below for the three mobility groups of interest (movers, inmovers,and within area stayers):
3.2 Key findings include (Table 1):
• inmovers and outmovers are younger than stayers: Only 26 cent of withinarea stayers are aged between 16 and 34 compared with 52 per cent ofoutmovers and 76 per cent of inmovers
• a higher proportion of inmovers are from Black and Minority Ethnic (BME)groups: 32 per cent of inmovers are from BME groups compared with 22 per cent of stayers and 14 per cent of outmovers
• outmovers are more likely to be employed: 71 per cent of working ageoutmovers are in employment; 24 percentage points higher than forinmovers (47 per cent) and 16 points higher than for stayers (55 per cent)
• inmovers have lower incomes: 20 per cent of inmovers report a weeklyhousehold income of less than £100 per week compared with 11 per centof stayers and eight per cent of outmovers
• inmovers and outmovers are healthier: 31 per cent of stayers indicatehaving a long term limiting illness, compared with 17 per cent ofoutmovers and only 13 per cent of inmovers
• a lower proportion of inmovers are owner occupiers: 16 per cent ofinmovers are owner occupiers, compared with 38 per cent of stayers and48 per cent of outmovers
• within area stayers have lower educational attainment: approximately athird of working age in-, and out, -movers have at least NVQ level 4qualifications compared with only 17 per cent of stayers.
96 NRU/ODPM (2005) New Deal for Communities: An interim Evaluation: Research Report 17
http://www.neighbourhood.gov.uk/publications.asp?did=1625

3.3 Mobility patterns are not consistent across all NDCs due in part to factorssuch as different populations within NDCs and contrasting ‘roles’ these areasplay in the wider district. Figure 1 presents percentages of 2002 respondentswho are potential movers by 2004 by NDC area. Potential movers arecalculated using the household survey interviewers contact sheet for thoserespondents interviewed in 2002 but not in 2004. Briefly, any address NOTcoded as respondent: ‘still living in household’; ‘died’; ‘refused/no contact’ or ‘other, not needed, withdrawn’ is classified as a ‘potential mover’.
10
The Moving Escalator?
Table 1: Characteristics of mobility populations (2004)
% % %Within area Inmover Outmover
stayer
Age16-34 26 76 5234-44 22 14 2145-55 17 5 1055+ 36 5 17
EthnicityWhite 77 64 85Asian 11 16 8Black 11 16 6
Worklessness & financeEmployed (a) 55 47 71Unemployed (a) 9 13 7Economically active (a) 64 61 78Household income <£100 11 20 8
HealthFeel health good 41 60 59Long term limiting illness 31 13 17
Household compositionLone parent household 15 16 12Large adult household 13 23 17
TenureOwner occupier 38 16 48Private renter 5 36 18Social renter 56 46 31
EducationNVQ 4+ (a) 17 30 33
Participation (2002)Heard of NDC 69 N/A 68Involved in NDC 12 N/A 13Involved in voluntary organisation 13 N/A 13
Base: All; Within area stayers (10,767), Inmovers (2,225), Outmovers (330) (a) Working age only, Within area stayer (7,658), Inmover (2,136), Outmover (288)Source: MORI/NOP

3.5 Although mobility patterns are not consistent across all NDCs, evidence fromthe 2004 Household surveys indicate that, as had generally been assumed inregeneration policy for many years, those moving out of ABIs tend to bereplaced by relatively more disadvantaged groups.
11
3. Who is moving?
0%
5%
10%
15%
20%
25%
30%
35%
40%
45%
Nottingham
Newca
stle
Plym
outh
Bristo
l
Doncaste
r
H’smith
& Fu
lham
Harlep
ool
Liver
pool
Bradfo
rd
Lewish
am
Brighto
n
Salfo
rd
Lam
beth
Tower
Ham
lets
Mid
dlesbro
ugh
Rochdale
Sunder
land
Norwich
Man
ches
ter
Newham
Coventry
Islin
gton
Shef
field
Harin
gey
Birmin
gham K
NLu
ton
Oldham
Leice
ster
Knowsley
Wolve
rham
ton
Hackn
ey Hull
Derby
Wals
all
South
wark
Birmin
gham A
South
ampto
nBre
nt
Sandwell
Figure 1: Potential Movers by NDC
Base: All; NDC aggregate (19,574)Source: MORI/NOP
3.4 Proportions vary considerably across the 39 NDCs. For example, inNottingham and Newcastle, NDCs with large student populations, over 35per cent of respondents in 2002 are classified as potential movers by 2004.This contrasts with, for example, Sandwell and Brent where less than 12 percent of 2002 respondents are potential movers.

4 Why did residents move?
4.1 If NDCs are to encourage more residents to stay within the neighbourhood,it is important to understand why people move out and what, if anything,might be done to reduce this process.
MOVING INTENTIONS
4.2 Table 2 shows responses from the 2002 Household Survey to questionsregarding moving intentions. Survey questions include:
• do you want to move from this property?
• do you think you will move from this property in the next two years? IF YES, ASK: when will you move?
– within next 3 months
– over 3 and up to 6 months from now
– over 6 months and up to a year from now
– over a year and up to 2 years from now
– yes, but don’t know when
4.3 Answers to these questions can be combined to create a ‘trapped’ indicator.Respondents are deemed to be ‘trapped’ if they want to move from theirproperty, but do not think they will do so within the next two years.
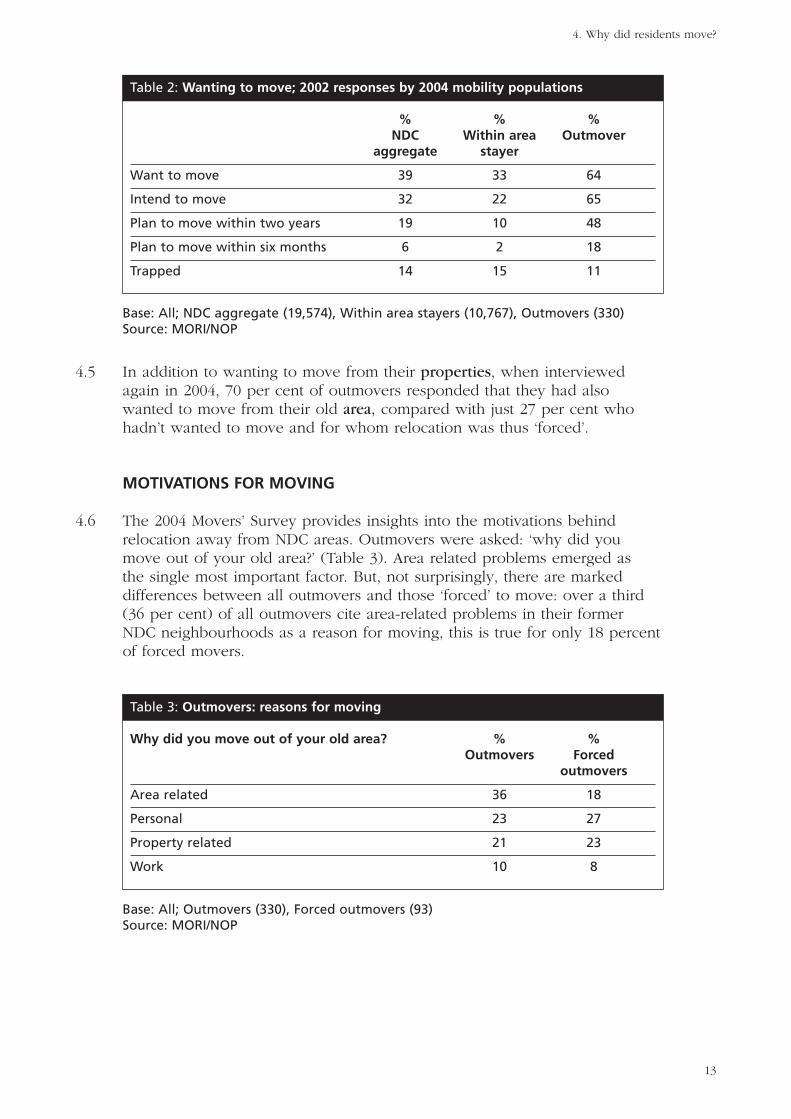
4.4 Responses to these questions provide a strong indication that intentions tomove tend subsequently to be translated into action within the following twoyears. In 2002 39 per cent of all respondents indicated they wanted to movefrom their property. However, this figure rises to fully 64 percent for thosewho had moved out by 2004. And whereas 32 percent of all respondentsintended to move in 2002, this figure again rose to 65 per cent for those whoactually had moved by 2004. Interestingly only 22 per cent of stayers had theintention of moving in 2002. The Survey also indicates that, as would beexpected, outmovers were also less likely to be ‘trapped’: in 2002 11 percent of outmovers indicated being trapped, four percentage points lowerthan for within area stayers.
12
The Moving Escalator?
13
4. Why did residents move?
4.5 In addition to wanting to move from their properties, when interviewedagain in 2004, 70 per cent of outmovers responded that they had alsowanted to move from their old area, compared with just 27 per cent whohadn’t wanted to move and for whom relocation was thus ‘forced’.
MOTIVATIONS FOR MOVING
4.6 The 2004 Movers’ Survey provides insights into the motivations behindrelocation away from NDC areas. Outmovers were asked: ‘why did youmove out of your old area?’ (Table 3). Area related problems emerged as the single most important factor. But, not surprisingly, there are markeddifferences between all outmovers and those ‘forced’ to move: over a third(36 per cent) of all outmovers cite area-related problems in their former NDC neighbourhoods as a reason for moving, this is true for only 18 percentof forced movers.
Table 2: Wanting to move; 2002 responses by 2004 mobility populations
% % %NDC Within area Outmover
aggregate stayer
Want to move 39 33 64
Intend to move 32 22 65
Plan to move within two years 19 10 48
Plan to move within six months 6 2 18
Trapped 14 15 11
Base: All; NDC aggregate (19,574), Within area stayers (10,767), Outmovers (330)Source: MORI/NOP
Table 3: Outmovers: reasons for moving
Why did you move out of your old area? % %Outmovers Forced
outmovers
Area related 36 18
Personal 23 27
Property related 21 23
Work 10 8
Base: All; Outmovers (330), Forced outmovers (93)Source: MORI/NOP

4.7 Area related problems for the 330 outmovers fell into a number of sub-categories including:
• problems with neighbours (eight per cent)
• increase in crime (seven per cent)
• area deteriorating (six per cent)
• drugs (five percent)
• gangs hanging around (four per cent)
• unsafe (three percent)
• noise (two per cent).
4.8 Although area-related problems as a whole proved to be the most importantsingle generic reason for leaving NDC areas, the most frequently mentionedspecific factors were either because of particular work based factors (10 percent) or housing related, especially ‘wanting a bigger property’ (11 per cent).Exploration of household composition for those who moved (Table 4),indicates that some 34 per cent experienced change in the previous twoyears. A large proportion had experienced an expansion in household size:29 per cent saw the birth of a child/children, 14 per cent had a non-relativejoin the household, nine per cent had a relative join the household, and sixper cent had a child/children return to the household.
14
The Moving Escalator?

15
4. Why did residents move?
RETAINING AND RE-ATTRACTING OUTMOVERS
4.9 Could NDC Partnerships have made changes which would have preventedoutmovers from leaving these areas? Some 34 per cent of outmovers whenasked if ‘any improvement or changes could have been made to your oldarea that would have encouraged you to stay’ indicated this to be the case.Better housing (17 per cent), reduced crime (17 per cent), and improvedpolicing (13 per cent) are the most frequently stated improvements whichwould have encouraged movers to stay in their previous NDC location(Table 5).
Table 4: Outmovers, changes to household composition 2002 to 2004
%
Change to household 34
Change(s) (a)
Birth of child/ren 29
Living with different partner/spouse 17
Non-relative joined household 14
Joined different household 12
Other relative joined household 9
Partner/spouse left household 7
Child/ren left household 7
Non-relative left household 7
Child/ren returned to household 6
Other relative left household 5
Death of partner/spouse 3
Death of other household member 0
Other 5
Base: All outmovers (330); (a) All those that have had a change to the household (111)Source: MORI/NOP

4.10 Could NDC areas attract back former residents? In 2004 only 28 per cent ofoutmovers indicated that they would consider moving back to their previousNDC address. Seventy per cent would not. Those who would not consider amove back to their old areas were asked why (Table 6). The most commonlycited reasons proved to be: ‘prefer it/like it better here’ (22 per cent), crimein the NDC areas (13 per cent), NDCs being rough areas (11 per cent),problems with neighbours (8 per cent), and drug use (7 per cent).
16
The Moving Escalator?
Table 5: Retaining outmovers: Improvements to NDC areas
What improvements or changes could have %been made to your old area?
Rebuild/better housing 17
Reduce crime 17
More/improved policing 13
Cleaner/tidier 10
Teenagers/kids had been kept off street 9
Make it safer/better security 9
Less drugs 9
Nicer neighbours/people 9
Property prices 4
Landlords/get rid of landlords 4
CCTV Cameras 3
Others 34
Base: All out of area non temporary movers wishing to see improvements (106)Source: MORI/NOP

17
4. Why did residents move?
DO NDC INTERVENTIONS ENCOURAGE PEOPLE TO LEAVE?
4.11 Is there any evidence that NDC interventions encourage people to leave? The argument is often made that if ABI activities enhance personal skills,experience, and material well-being, beneficiaries will leave, these, usuallydeprived, areas. Renewal agencies will thus be faced with attempting toimprove outcomes for a constantly evolving groups of residents: the ‘movingescalator’ problem. In practice ‘place based’ interventions in themes such asenvironmental improvements, health facilities, crime, constructing new orimproving existing, dwellings, and so on, should help retain people. But it is conceivable that if education, training, job mentoring initiatives and so onare introduced at the same time, they will actually accentuate relocationaway from the area.
Table 6: Outmovers: Why would you not consider moving back to the area aroundyour old home?
%
Prefer it/like it better here 22
Crime in the area 13
Not a nice area/rough area 11
Not nice people/neighbours 8
Too much drug use 7
Unsafe here 7
Has deteriorated/gone down hill 6
Closer to work 5
Near family/my family are here 5
Quieter/peaceful here 5
Too built up/too like London 2
Anti-social people/behaviour 2
Smaller houses/houses too small 2
Not a good place to bring up children 2
Too many gangs/youths hanging about 2
Others 25
DonÕt know 3
Base: All out of area non-temporary movers not considering moving back (224) Source: MORI/NOP

4.12 It is not possible from this evidence definitively to indicate whether specificNDC interventions have positively encouraged out migration. Data does notprovide a direct link between NDC interventions and subsequent behaviour.But it is possible to make inferences from what is available.
4.13 First, as is indicated in Table 3 above, area based factors are the single mostimportant generic reason for encouraging people to leave. Outmovers wereleaving not because of what NDCs were doing, but rather what they weren’t.
4.14 Second, there is nothing to suggest that the 2002 outmovers wereparticipating more in NDC activities than were those who stayed (Table 1).Sixty-nine per cent of stayers had heard of their local NDC, 12 per cent hadbeen involved with it, and 13 per cent had been involved with other localorganisations on a voluntary basis during the previous three years. Theequivalent figures for outmovers were 68 per cent, 13 per cent, and 13 percent respectively. These figures do not suggest that those who left between2002 and 2004 were any more ‘engaged with’, and therefore conceivablybenefiting from, their local NDC than were those who stayed.
4.15 But third, there is some evidence that those who left NDC were moreinclined to undertake, and see benefits arising from, training and education.In 2004, 30 per cent of outmovers were either undertaking education ortraining or had completed it in the previous 12 months, and 54 per centwould like to do more training or education courses. The equivalent figuresfor stayers were 23 per cent and 40 per cent respectively. It is not possibledefinitively to state whether person based interventions encourage outmigration. But maybe there is a hint here that they might. It seems plausibleto assume that as NDCs introduce a raft of person based interventions thesemay collectively further encourage outmigration for those able and willing to move.
4.16 Evidence from the 2004 Movers’ Survey indicates that many outmovers hadwanted, and intended, to leave their NDC location in 2002. Outmovers tendto leave for a mix of area and housing based factors. Had appropriateenvironmental and housing policies been implemented by NDCs about athird of outmovers might have stayed. But once they leave the NDC areaonly about a quarter indicate they would ever return. It is not possibleprecisely to quantify relationships between NDC interventions and anysubsequent out migration. Those who left NDC areas between 2002 and 2004 were no more, or less, engaged with their local NDC than were thosewho stayed.
18
The Moving Escalator?

19
5 Where did residents move toby tenure and geography?
5.1 This section addresses two issues: where did residents move to in relation totenure and how far did they go?
TENURE
5.2 Tenure patterns changed quite sharply across the group of 330 outmovers(Figure 2). Although around two thirds (64 per cent) of outmovers movedinto the same tenure type as they previously occupied in NDC areas, arounda third changed tenure. The most notable flows occurred towards owneroccupation and, in particular, away from social renting. Nine percent ofoutmovers relocated from social rented properties to owner occupied homes,whereas only two per cent of owner occupiers moved into social renting.Flows are also evident from private renting to owner occupation. Six percent of outmovers moved from private renting to owner occupation; justthree per cent moved in the opposite direction.
5.3 This scale of change contrasts with more stable patterns of tenure apparentfor within area stayers. Most (93 per cent) of within area stayers remained inthe same tenure type. For example, 54 per cent of within area stayers weresocial tenants at both points in time. The largest identifiable flow is a shiftfrom social renting to owner occupation: three per cent of within areastayers moved from social renting to owner occupation, whilst only one percent moved from owner occupation to social renting.
5.4 As inmovers were not interviewed in 2002, analysis of this third mobilitygroup is restricted to their 2004 NDC tenure type. Nearly half (46 per cent)of inmovers were accommodated in social rented housing, 36 per cent inprivate rented housing, and only 16 per cent in owner occupied properties.
5.5 However, the overall impact of these flows created only small net changes.In 2002, at the aggregate level, 32 per cent of NDC residents were owneroccupiers, 57 per cent social tenants and 10 per cent private tenants. Twoyears later the equivalent figures were 34 per cent, 55 per cent, and 10 percent respectively.

20
The Moving Escalator?
Owneroccupied
32
Socialrented
24
Privaterented
8
2 6
7
5
39
Owneroccupied
35
Socialrented
54
Privaterented
4
Owneroccupied
Socialrenting
Privaterented
1 0
1
1
46 16 36
13
Outmovers (%)
Within areastayers (%)
Inmovers (%)
Note: Total percentages will not sum to 100 due to ‘some other way’ category not being includedThe within area stayers figures assumes the within area mover group is a representative proportion of the total group.The figures presented are percentages of each group; when looking at overall movements the relative size of each population needs to be considered.
Base: All outmovers (330)
Base: All within area stayers (10,767)
Base: All inmovers (2,225)
Figure 2: Tenure flows 2002-2004

21
5. Where did residents move to by tenure and geography?
DISTANCE MOVED
5.6 Postcode analysis enables a calculation to be made of approximate distancesmoved (Figure 3). Most (58 per cent) outmovers relocated less than fivekilometres away from their old homes. Only a fifth moved more than 15kilometres. But equally so only a quarter moved to new houses less than two kilometres from their previous residence. Once people relocate they do tendto move away from the immediate vicinity of their previous NDC address.
5.7 Relationships between motives for movement and distances involved areillustrated in Table 7. Area-related problems is the most commonly citedfactor for outmovers relocating within 15 kilometres of their current home.However, as would be expected, work related reasons is the drivingmotivation behind 32 per cent of those moving more than 15 kilometres
5.8 Evidence from the 2004 Movers’ Survey indicates that relocation tends to be associated with a marked drift towards owner-occupation. Most do nothowever relocate far from their previous NDC address. Those that do movefurther tend to relocate for work based factors.
0% 5% 10% 15% 20% 25% 30% 35%
Less than2km
2km to lessthan 5km
5km to lessthan 15km
15km or more
25
33
23
19
Figure 3: Distance moved by outmovers
Base: All outmovers (330) Source: MORI/NOP
Table 7: Motivation for relocation by distance moved
% % % %less than 2km to less 5km to less 15km or
2km than 5km than 15km more
Property related 30 26 9 18
Area related 45 31 43 23
Personal reasons 14 25 28 26
Work related 0 7 6 32
Base: All outmovers (330) Source: MORI/NOP

6 Has life improved for movers in their new areas?
6.1 This section explores the contrasting attitudes of outmovers, inmovers andstayers in relation to:
• changes in aspirations to move
• quality of life
• levels of satisfaction with accommodation and the area
• socio-economic and employment status
• health.
Outcomes are also explored for ‘forced outmovers’: the 27 per cent ofoutmover respondents who, when interviewed in 2004 indicated they did notwant to move from their old area.
CHANGES IN ASPIRATIONS TO MOVE
6.2 Table 8 illustrates responses to the question ‘do you want to move from thisproperty?’ The proportion of outmovers wanting to move more than halvedfrom 64 per cent in 2002 (when they were all in NDC areas) to 28 per centin 2004 (when living in their new area). As would probably be expected this2004 outmovers’ figure is lower than for either stayers (37 per cent) orinmovers (39 per cent). Interestingly too those who were forced to movefrom their 2002 property, and who might therefore be more inclined to moveagain, actually recorded lower ‘wanting to move’ totals than did eitherinmovers or stayers.
22
The Moving Escalator?
Table 8: Wanting to move: changes 2002 to 2004 by mobility populations
Want to move % % % %Within area Inmover Outmover Forced
stayer outmover
2002 33 n/a 64 47
2004 37 39 28 33
Base: All; Within area stayers (10,767), Inmovers (2,225), Outmovers (330), Forced outmovers (93) Source: MORI/NOP

23
6. Has life improved for movers in their new areas?
QUALITY OF LIFE
6.3 Table 9 illustrates, for each of the four mobility populations, the proportionof respondents indicating their quality of life is good. Whilst the proportionof stayers for whom the quality of life is good remained stable between 2002 (78 per cent) and 2004 (79 per cent), there was a marked change foroutmovers. Ninety-two percent of outmovers defined their quality of life as‘very good’ or ‘fairly good’ in 2004, 13 percentage points higher than in 2002.Changes are not so marked for forced outmovers but are still higher than for the stayers. They might not have wanted to move, but there was a fivepercentage points increase in those regarding their quality if life as goodonce they had done so.
LEVELS OF SATISFACTION WITH ACCOMMODATION AND THE AREA
6.4 Outmovers are more satisfied with their current, rather than their former,accommodation (Table 10). Ninety-one per cent were satisfied in 2004,compared with 79 per cent in 2002. In terms of flows, twelve per cent ofresidents who were dissatisfied in 2002 were satisfied in 2004, whilst onlyfive per cent moved in the opposite direction.
Table 9: Quality of life good change 2002 to 2004 by mobility populations
Want to move % % % %Within area Inmover Outmover Forced
stayer outmover
2002 78 n/a 79 84
2004 79 78 92 89
Base: All; Within area stayers (10,767), Inmovers (2,225), Outmovers (330), Forced outmovers (93) Source: MORI/NOP
Table 10: Outmovers: Satisfaction with accommodation: change 2002 to 2004
Satisfied with Satisfied with accommodation 2004 (%)accommodation Satisfied Neither Dissatisfied Total2002 (%)
Satisfied 74 1 5 79
Neither 5 0 1 6
Dissatisfied 12 1 2 15
Total 91 2 8 100
Base: All outmovers (330)Source: MORI/NOP

6.5 Whilst satisfaction with accommodation improved for outmovers (12 percentage points), and even more so for forced outmovers (by 13 percentage points),satisfaction for stayers actually declined by one percentage point from 85 percent in 2002 to 84 per cent in 2004 (Table 11).
6.6 Not surprisingly a large majority (78 per cent) of outmovers felt their 2004accommodation was better than was the case in 2002 (Table 12). Only eight per cent considered it worse. In contrast, sixty-one per cent of forcedoutmovers considered it better, but fully 15 per cent (almost double that forall outmovers) thought it worse.
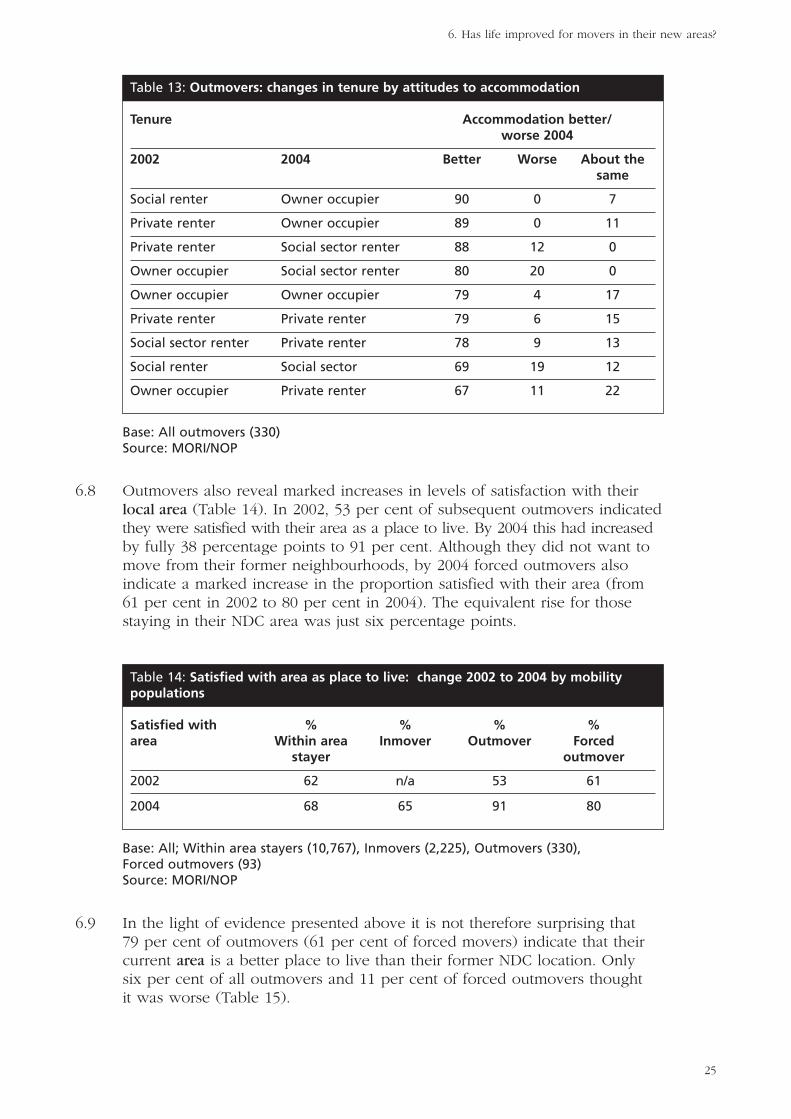
6.7 Table 13 cross-tabulates out-mover perceptions of the quality of theiraccommodation, with tenure change between 2002 and 2004. Those movingfrom social or private renting into owner occupation are most likely toindicate their current accommodation is better (90 per cent and 89 per centrespectively). At the other end of the scale, those in that relatively smallgroup of former owner-occupiers moving to either private or social rentedaccommodation, are least likely to indicate the quality of their accommodationhas improved (67 per cent and 69 per cent respectively).
24
The Moving Escalator?
Table 11: Satisfied with accommodation change 2002 to 2004 by mobility populations
Satisfied with % % % %accommodation Within area Inmover Outmover Forced
stayer outmover
2002 85 n/a 79 73
2004 84 80 91 86
Base: All; Within area stayers (10,767), Inmovers (2,225), Outmovers (330), Forced outmovers (93) Source: MORI/NOP
Table 12: Outmovers: Attitudes to current and previous accommodation
Would you say that this accommodation % %is better, worse or about the same Outmover Forcedthan the accommodation you were in outmoverwhen we last interviewed you
Better 78 61
Worse 8 15
About the same 13 23
Don’t know 1 1
Base: All; Outmovers (330) Forced outmovers (93)Source: MORI/NOP
25
6. Has life improved for movers in their new areas?
6.8 Outmovers also reveal marked increases in levels of satisfaction with theirlocal area (Table 14). In 2002, 53 per cent of subsequent outmovers indicatedthey were satisfied with their area as a place to live. By 2004 this had increased by fully 38 percentage points to 91 per cent. Although they did not want tomove from their former neighbourhoods, by 2004 forced outmovers alsoindicate a marked increase in the proportion satisfied with their area (from61 per cent in 2002 to 80 per cent in 2004). The equivalent rise for thosestaying in their NDC area was just six percentage points.
6.9 In the light of evidence presented above it is not therefore surprising that 79 per cent of outmovers (61 per cent of forced movers) indicate that theircurrent area is a better place to live than their former NDC location. Only six per cent of all outmovers and 11 per cent of forced outmovers thought it was worse (Table 15).
Table 13: Outmovers: changes in tenure by attitudes to accommodation
Tenure Accommodation better/worse 2004
2002 2004 Better Worse About the same
Social renter Owner occupier 90 0 7
Private renter Owner occupier 89 0 11
Private renter Social sector renter 88 12 0
Owner occupier Social sector renter 80 20 0
Owner occupier Owner occupier 79 4 17
Private renter Private renter 79 6 15
Social sector renter Private renter 78 9 13
Social renter Social sector 69 19 12
Owner occupier Private renter 67 11 22
Base: All outmovers (330)Source: MORI/NOP
Table 14: Satisfied with area as place to live: change 2002 to 2004 by mobilitypopulations
Satisfied with % % % %area Within area Inmover Outmover Forced
stayer outmover
2002 62 n/a 53 61
2004 68 65 91 80
Base: All; Within area stayers (10,767), Inmovers (2,225), Outmovers (330), Forced outmovers (93) Source: MORI/NOP
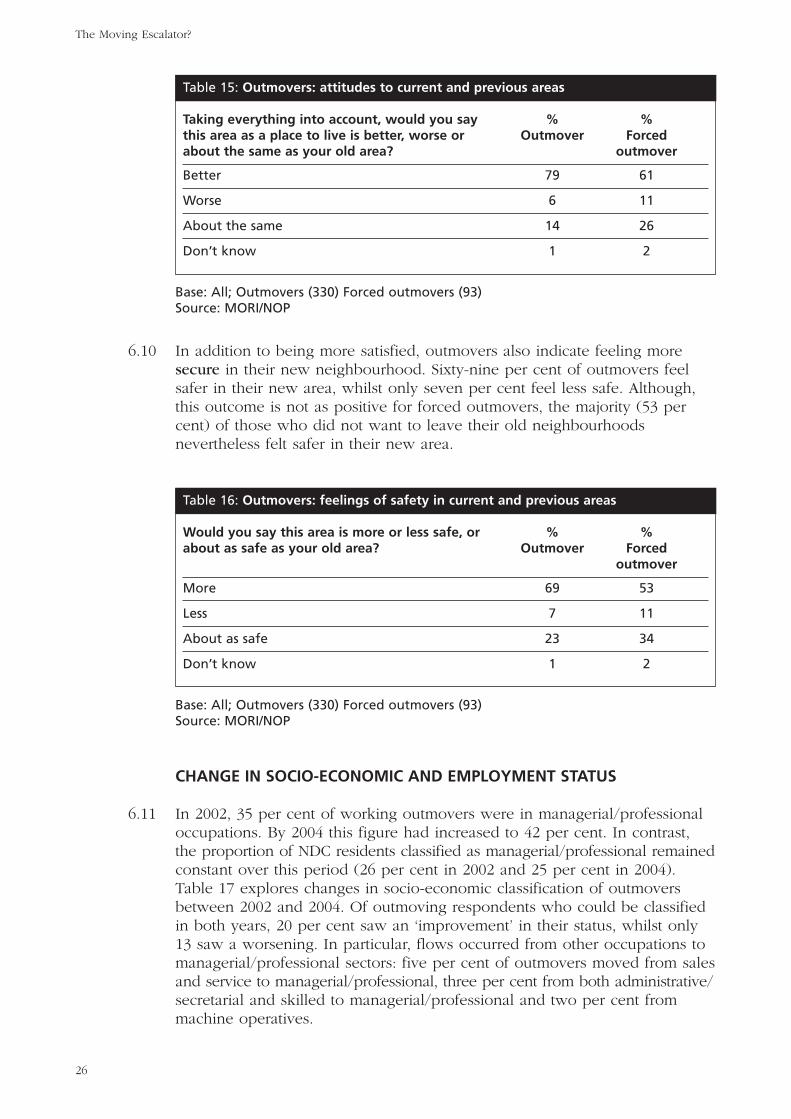
6.10 In addition to being more satisfied, outmovers also indicate feeling moresecure in their new neighbourhood. Sixty-nine per cent of outmovers feelsafer in their new area, whilst only seven per cent feel less safe. Although,this outcome is not as positive for forced outmovers, the majority (53 percent) of those who did not want to leave their old neighbourhoodsnevertheless felt safer in their new area.
CHANGE IN SOCIO-ECONOMIC AND EMPLOYMENT STATUS
6.11 In 2002, 35 per cent of working outmovers were in managerial/professionaloccupations. By 2004 this figure had increased to 42 per cent. In contrast,the proportion of NDC residents classified as managerial/professional remained constant over this period (26 per cent in 2002 and 25 per cent in 2004).Table 17 explores changes in socio-economic classification of outmoversbetween 2002 and 2004. Of outmoving respondents who could be classifiedin both years, 20 per cent saw an ‘improvement’ in their status, whilst only13 saw a worsening. In particular, flows occurred from other occupations tomanagerial/professional sectors: five per cent of outmovers moved from salesand service to managerial/professional, three per cent from both administrative/secretarial and skilled to managerial/professional and two per cent frommachine operatives.
26
The Moving Escalator?
Table 15: Outmovers: attitudes to current and previous areas
Taking everything into account, would you say % %this area as a place to live is better, worse or Outmover Forcedabout the same as your old area? outmover
Better 79 61
Worse 6 11
About the same 14 26
Don’t know 1 2
Base: All; Outmovers (330) Forced outmovers (93)Source: MORI/NOP
Table 16: Outmovers: feelings of safety in current and previous areas
Would you say this area is more or less safe, or % %about as safe as your old area? Outmover Forced
outmover
More 69 53
Less 7 11
About as safe 23 34
Don’t know 1 2
Base: All; Outmovers (330) Forced outmovers (93)Source: MORI/NOP

27
6. Has life improved for movers in their new areas?
6.12 Figures 4 and 5 explore changes in employment and economic activity foroutmovers of working age between 2002 and 2004. Trends in flows aresimilar for both all outmovers and forced outmovers.
6.13 Fifty-eight per cent of all outmovers were in employment in both 2002 and2004, whilst 23 per cent were not in employment at both points. Analysis ofemployment flows indicates an eight percentage points net increase in thoseemployed. Thirteen per cent moved into employment while only five percentmoved out. Whilst not as great for outmovers as whole, comparableimprovements occurred for forced outmovers: twelve per cent moved intoemployment while only six per cent moved out.
Table 17: Outmovers: Socio-economic classification: change 2002 to 2004
SOC 2004
Managerial/ Admin & Skilled Sales & Machine ElementaryProfessional Sec service operatives occupation
SOC 2002
Managerial/ 30 2 0 3 1 1Professional
Admin 3 7 0 1 0 0& Sec
Skilled 3 0 8 0 2 0
Sales & 5 2 1 6 0 1Service
Machine 2 0 2 0 8 1operatives
Elementary 1 0 0 1 2 5occupation
Base: All outmovers currently working in 2002 and 2004 and who could be classified by SOC (160)Source: MORI/NOP

6.14 A similar picture emerges when exploring outmover flows into, and out ofeconomic activity between 2002 and 2004 (Figure 5). Sixty-five percent ofoutmovers and forced outmovers were economically active in both 2002 and2004. Fourteen per cent of outmovers and 12 per cent of forced outmoverswere economically inactive at both points. Flow analysis shows a fivepercentage point net increase in the proportion of both outmovers andforced outmovers in economic activity; approximately half of those whowere economically inactive in 2002 were economically active in 2004.
28
The Moving Escalator?
Inemployment
56
Not inemployment
26
6
12
Forced outmovers
Inemployment
58
Not inemployment
23
5
13
All outmovers
Figure 4: Outmovers: Flows in and out of employment
Base: All working age in both 2002 and 2004; Outmovers (282), Forced outmovers (77)Source: MORI/NOP

29
6. Has life improved for movers in their new areas?
HEALTH
6.15 The final section in this chapter explores how health changed for thosemoving out of NDC areas. Out of area movers were asked whether theythought ‘moving from your old home had a positive or negative impact inyour own or your family’s health?’. Table 18 illustrates that just over half (51per cent) of respondents stated that the move had a positive impact. Of thisgroup, 28 per cent said that the move had left them less stressed or morerelaxed, whilst 18 per cent said they were happier or more settled. Althoughthe proportion of forced outmovers who thought the move had a positiveimpact was slightly lower, fully 45 per cent indicated that it had a positive,only five per cent a negative, effect.
EconomicallyActive
65
EconomicallyInactive
12
9
14
Forced outmovers
EconomicallyActive
65
EconomicallyInactive
14
8
13
All outmovers
Figure 5: Outmovers: Flows in and out of economic activity
Base: All working age in both 2002 and 2004; Outmovers (282), Forced outmovers (77)Source: MORI/NOP

6.16 Changes in the mental health of outmovers has been calculated using amodified SF36 mental health score. Scores on this index range from zero(worse possible mental health related quality of life) to 100. In order tocompare outmovers responses in 2002 to 2004, scores have been classified as ‘low’ (low level of mental health), ‘mid’ or ‘high’. This analysis furtherreinforces evidence that moving had a positive impact on health. Figure 6illustrates that 47 per cent of outmovers were categorised in the same mentalhealth band in both 2002 and 2004, 37 saw an improvement whilst only 17per cent saw a deterioration. The most notable flows are from mid to highmental health scores (22 per cent) and from low to high (eight per cent).
30
The Moving Escalator?
Table 18: Impact of move on ‘your and your family’s health’
% %Outmover Forced
outmover
Positive impact 51 45
Negative impact 3 5
How has it had a positive impact?
Less stress/more relaxed 28
Happier/more settled 18
Healthier now/eating better 12
Take more exercise now (walks/bike rides etc) 10
Safer 9
Better/cleaner air 8
More space 8
Nicer area 4
Close to family/friends 3
Quiet here 2
Better place for kids (can play out/walk more) 2
Last place was cold/damp 2
Nicer house 2
Better people/neighbours 2
All one level/no stairs 1
Others 15
Don’t know 7
Base: All; Outmovers (330) Forced outmovers (93); (a) All outmovers stating a movehad a positive impact on the health of their family (169)Source: MORI/NOP

31
6. Has life improved for movers in their new areas?
6.17 Evidence from the 2004 Movers’ Survey indicates that outmovers generallyexpress higher levels of satisfaction with their accommodation and the areathan is the case for either stayers or inmovers. There is evidence too thattheir health, and their socio-economic status improved after they left theNDC area. In short those who move appear to enjoy a higher ‘quality of life’than either had been the case when they lived in NDC areas, or is true forstayers. Outcomes for forced outmovers are not as positive as for theoutmovers group as whole, but in general are better than for stayers.
High mentalhealth
22
Low mentalhealth
11
Mid mentalhealth
14
3 22
7
6
88
Base: All outmovers (330)Source: MORI/NOP
Figure 6: Outmovers: Flows in SF36 Mental Scores bands

7 Conclusions and policyimplications
7.1 There is a dearth of evidence about the characteristics of those who moveout of neighbourhoods undergoing regeneration, compared with stayers orinmovers. This analysis is based on a relatively small sample of those movingout of NDC areas between 2002 and 2004. Nevertheless, it does providevaluable insights into the different characteristics of, and outcomes for,different ‘mobility’ populations.
7.2 A number of key conclusions can be derived from this analysis:
• when compared with inmovers, those leaving the 39 NDC neighbourhoods are more likely to be older, in employment and to move into owner-occupied accommodation
• inmovers nevertheless provide a potential resource on which to buildlonger term sustainable change in that they are younger, healthier andbetter educated than those who stayed in NDCs between 2002 and 2004
• on the broader canvas, this evidence tends to support the notion of a‘moving escalator’ in neighbourhood renewal: those in jobs and who arein, or who intend to enter, the owner-occupied sector are being replacedby those who are less likely to be in employment and who are morelikely to be relatively less well off and to live in rented accommodation
• those who flagged up an intention to move in 2002 were in the eventmore likely to do so than those who intended to remain; attitudes andaspirations are therefore often realised through subsequent actions: thismay conceivably help Partnerships plan ahead by estimating futureresidential turnover
• people move for a range of area-based, environmental and property-related reasons: the most important specific reasons for leaving were toaccess a better choice and quality of housing, lower crime rates in non-NDC areas, fewer problems of anti-social behaviour, more policing, andthe quality of the local environment; not many leave primarily because of employment related factors
• it is not possible definitively to indicate whether NDC interventions inrelation to say training or job mentoring actually encourage people tomove; the evidence that is available is mixed: there are no differencesbetween outmovers and stayers in relation to having heard of, or beinginvolved with, their local NDC; on the other hand outmovers are morelikely than stayers to have undertaken, and to see benefits arising from,personal training and education
32
The Moving Escalator?

33
7. Conclusions and policy implications
• one third of those who left between 2002 and 2004 would have beeninclined to stay in NDC areas if improvements had taken place in termsof local housing and environmental standards
• but once people leave they are unlikely ever to return, both because theyprefer their new location and because they identify continuing problemsin their previous NDC location
• compared with those who stayed in NDC areas between 2002 and 2004,outmovers are more likely to be satisfied with their accommodation, thearea, and their overall quality of life, and they are much less likely towant to move again
• there is evidence too that outmovement is associated with improvementsto health and socio-economic status
• Twenty-seven per cent of outmovers had not wanted to move from their 2002 NDC accommodation; but by 2004 more improvements hadoccurred for these ‘forced outmovers’ than was true for those who stayedin NDCs; such changes were not however as positive as had occurred foroutmovers as whole
• considerable changes in tenure occurred for outmovers: whereas 38 percent were in owner-occupation in 2002, fully 48 per cent were so twoyears later; moving places is often associated with tenure change; thosewho leave NDC areas, and in turn move into owner-occupation, aremuch more likely to be satisfied than the (admittedly small) group ofoutmovers moving from owner-occupation to renting.
7.3 This evidence contains clear policy implications for neighbourhood renewal:
• housing design and tenure are critical factors influencing mobility;policies could seek to maximise opportunities for residents to realise their housing preferences locally, throughout the life cycle, by providing,or facilitating the provision of, more diverse property types, sizes anddesigns in all tenures, but especially in the owner-occupied sector
• encouraging people to stay is not just about housing measures; it alsocentrally bound up with environmental issues and, in particular, thewidespread perceptions of high levels of crime and anti-social behaviourin renewal areas such as NDCs; these are critical key ‘push’ factors forthose leaving NDC areas; the dilemma for ABIs is that improvements tohousing, environmental infrastructure and crime reduction can take aconsiderable period of time to introduce because of the complexity ofproblems and the high capital investment required; some households willnot wait around until the benefits from such measures start to materialise

• the shift in the ethnic profile between outmovers and inmovers isstriking; this may well reflect a process whereby members of some BME communities are moving into these areas due to more constrainedmobility choices in the housing market; this carries messages about thepotential need to develop pro-active community cohesion strategies toconfront any local tensions which may arise from changes in the ethnic profile
• the characteristics of inmovers in some areas is likely to be increasinglyshaped by economic in-migration, especially from EU accession states;the impact of NASS dispersal policies has emerged as an important localissue in some NDC areas, especially those in London; NDCs have onlylimited resources to deal with housing and social problems arising frommajor influxes of economic migrants
• this evidence suggests that relatively wide geographical areas may beaffected by residential mobility stemming from area based regeneration;only a quarter of outmovers relocate to areas within 2km of the NDC concerned
• the scale of out-, and in-, moving over time will be strongly affected by the housing market context for the neighbourhood concerned; ‘tight’housing markets, as in parts of London, are likely to experience lessturnover than will other areas, characterised by lower demand; the need to build in assumptions about residential turnover in regenerationprogrammes has often been neglected in the past; but it is a vitalingredient in informing an appropriate balance between place, andpeople, based measures
• finally, there is the wider issue about the role which NDC areas havetraditionally played in urban housing markets; at least some haveprovided cheaper rented, and indeed owner-occupied, accommodationfor relatively disadvantaged groups and first time buyers; if housingprogrammes in NDCs ultimately reduce the availability of cheaperaccommodation, presumably this demand will increase in other similarneighbourhoods; this has always been a central dilemma for renewal andregeneration: improving one area may displace demand for lower costhousing elsewhere.
7.4 Evidence presented here is unable directly to address one key policy issue:do ABI interventions of themselves encourage people to leave? It is notpossible to trace through the impact on these movers of what may, in anyarea, be in excess of over a hundred NDC funded interventions. But it seemsplausible to assume that through time, as an increasing portfolio of NDCfunded training, job mentoring, job search, and educational attainmentprojects are implemented, this may ‘encourage’ some beneficiaries to leave.If this proves to be the case:
34
The Moving Escalator?
35
7. Conclusions and policy implications
• area based renewal programmes may need to look for a sensible balance between place-based measures, encouraging people to stay, andperson-based measures, stimulating out-migration arising from projectbeneficiaries seeking economic or educational opportunities beyond theneighbourhood
• there may be a case for thinking through the phasing of interventions: ifan intensive push is placed on people-based measures before improvements are made to the local environment and the housing market, this may wellencourage outmigration
• measures which are probably most likely to encourage people to leaveare those impacting on personal labour market skills and employment-related initiatives; in some instances there may be an argument forthinking radically here and postponing the introduction of new ‘person-based’ initiatives until place based improvements have been put in place.