the mount pavagadh volcanic suite, deccan traps
TRANSCRIPT

Available online at www.sciencedirect.com
www.elsevier.com/locate/jaes
Journal of Asian Earth Sciences 32 (2008) 5–21
The Mount Pavagadh volcanic suite, Deccan Traps:Geochemical stratigraphy and magmatic evolution
Hetu C. Sheth a,*, Leone Melluso b
a Department of Earth Sciences, Indian Institute of Technology (IIT) Bombay, Powai, Mumbai 400 076, Indiab Dipartimento di Scienze della Terra, Universita di Napoli Federico II, Via Mezzocannone 8, 80134 Napoli, Italy
Received 7 March 2007; received in revised form 24 August 2007; accepted 3 October 2007
Abstract
The patterns of eruption and dispersal of flood basalt lavas on the surface, or as magmas in dykes and sills within the crust,determine the volcanological and stratigraphic development of flood basalt provinces. This is a geochemical and Sr-isotopic studyof lavas of varied compositions that outcrop around Mount Pavagadh (829 m), Deccan Traps, an important outlier north of themain basalt outcrop. Most of the �550-m thick exposed section at Pavagadh is made up of subalkalic basalts rich in the incom-patible elements (particularly Nb, Ba, and Sr). Picrite and rhyolite–dacite flows also occur, the latter capping the sequence. Therelatively high initial 87Sr/86Sr ratios (up to 0.7083) and chemical characteristics of the rhyolitic rocks of Pavagadh are consistentwith a small but significant involvement of the granitic basement crust in their genesis. An assimilation–fractional crystallization(AFC) model involving the picrite lava and either a southern Indian or a western Indian granite as the contaminant explainsthe geochemical and Sr-isotopic variation in the basalts and the rhyolites quite well. A systematic comparison of the basaltic lavas(with binary plots, normalized multielement patterns, and discriminant function analysis) to the well-established lava stratigraphy ofthe Western Ghats, 400–500 km to the south, precludes any chemical–genetic relationships between the two. Basalts exposed in sec-tions closer to Pavagadh (�150–200 km), in the Toranmal, Navagam, and Barwani–Mhow areas, have several flows with some sim-ilar chemical characteristics. However, the Pavagadh sequence is significantly different from all of these sequences geochemically,petrogenetically, and in magnetic polarity, to be considered independently built. This result is significant in terms of eruptive modelsfor the Deccan Traps, as it is increasingly apparent that there were separate but possibly coeval eruptive centers with their owndistinctive chemistries developed in various areas of this vast province.� 2007 Elsevier Ltd. All rights reserved.
Keywords: Volcanism; Magma; Lava; Flood basalt; Rhyolite; Deccan Traps; India
1. Introduction
Continental flood basalt (CFB) provinces are vast andthick accumulations of tholeiitic basalt lavas, and oftenalso include variable volumes of alkalic and silicic rocks(e.g., Macdougall, 1988; Mahoney and Coffin, 1997). TheKaroo, the Parana, and the Deccan CFB provinces aregood examples. The lavas are also usually horizontally dis-posed over vast areas, and the techniques of geochemical
1367-9120/$ - see front matter � 2007 Elsevier Ltd. All rights reserved.
doi:10.1016/j.jseaes.2007.10.001
* Corresponding author. Tel.: +91 22 25767264; fax: +91 22 25767253.E-mail address: [email protected] (H.C. Sheth).
and magnetic stratigraphy – long-distance correlation oflavas and lava piles based on their geochemical signaturesand magnetic polarity – have been successfully used tounderstand the stratigraphic and structural make-up ofthese provinces (e.g., Peate, 1997; Marsh et al., 1997).The genesis of the silicic (rhyolitic–dacitic–trachytic) mag-mas in CFBs is also of considerable petrogenetic interest.These have been variably interpreted as products of frac-tional crystallization of mafic magmas, combined assimila-tion and fractional crystallization, partial melting ofunderplated mafic rocks or deep basaltic piles, partial melt-ing of pre-existing altered rhyolites, or anatexis of the con-tinental crust (e.g., Betton, 1979; Bellieni et al., 1984;
6 H.C. Sheth, L. Melluso / Journal of Asian Earth Sciences 32 (2008) 5–21
Garland et al., 1995; Lightfoot et al., 1987; Sheth and Ray,2002; Miller and Harris, 2007).
The addition of flood basalt magmas to the crust, viadykes or sills, and their transport as lavas after eruption,is of interest and significance to understand the physicalgrowth and stratigraphic development of such huge floodbasalt provinces (e.g., Bondre et al., 2006; Sheth, 2006;Vanderkluysen et al., 2006; Ray et al., 2007). The Dec-can, a magnificent CFB province exposed in westernand central India, covers �500,000 km2 after some 65million years of erosion, and a considerable area lies sub-merged in the Arabian Sea to the west (Fig. 1). The Dec-can CFB pile is best exposed in the Western Ghats(Sahyadri) range in the southwest of the province(Fig. 1), where a stratigraphic thickness of �3 km hasbeen divided into various formations and subgroups(Table 1) (e.g., Cox and Hawkesworth, 1985; Beaneet al., 1986; see Subbarao and Hooper, 1988). Severalworkers (e.g., Sreenivasa Rao et al., 1985; Mitchell andWiddowson, 1991; Dhandapani and Subbarao, 1992;Peng et al., 1998; Bilgrami, 1999; Mahoney et al.,2000; Sheth et al., 2004a) have attempted long-distancegeochemical correlations of thick basalt sections in theprovince with the Western Ghats sequence with theaim to develop suitable eruptive models.
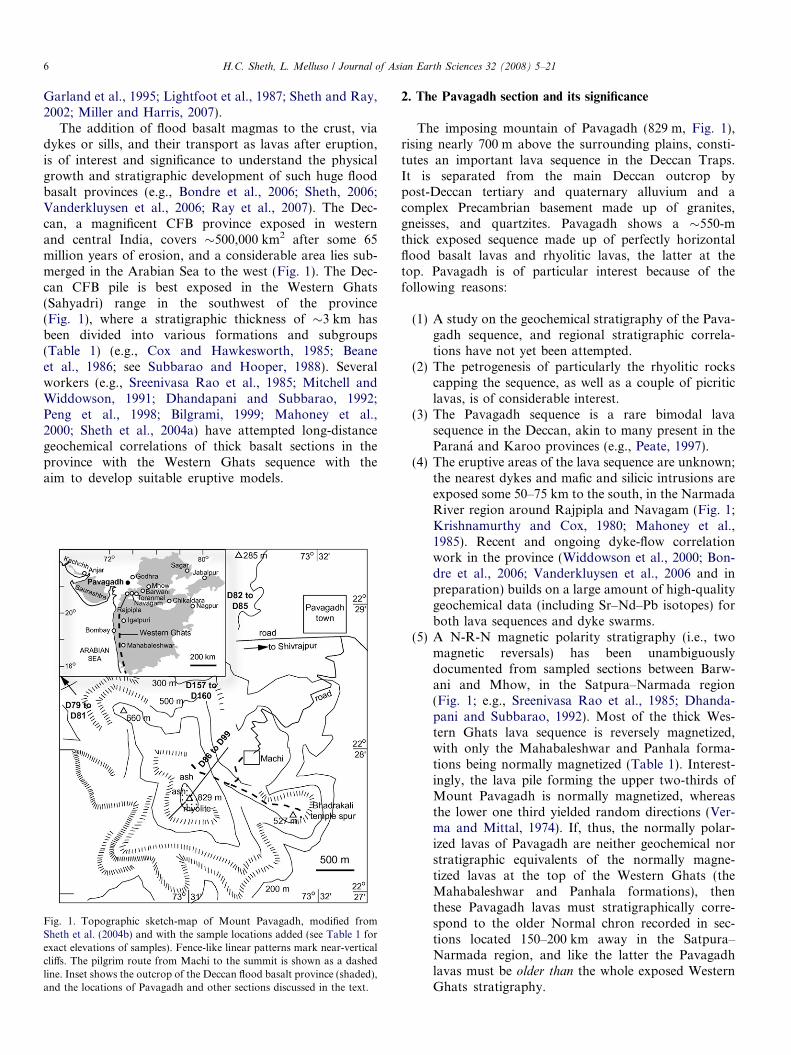
Fig. 1. Topographic sketch-map of Mount Pavagadh, modified fromSheth et al. (2004b) and with the sample locations added (see Table 1 forexact elevations of samples). Fence-like linear patterns mark near-verticalcliffs. The pilgrim route from Machi to the summit is shown as a dashedline. Inset shows the outcrop of the Deccan flood basalt province (shaded),and the locations of Pavagadh and other sections discussed in the text.
2. The Pavagadh section and its significance
The imposing mountain of Pavagadh (829 m, Fig. 1),rising nearly 700 m above the surrounding plains, consti-tutes an important lava sequence in the Deccan Traps.It is separated from the main Deccan outcrop bypost-Deccan tertiary and quaternary alluvium and acomplex Precambrian basement made up of granites,gneisses, and quartzites. Pavagadh shows a �550-mthick exposed sequence made up of perfectly horizontalflood basalt lavas and rhyolitic lavas, the latter at thetop. Pavagadh is of particular interest because of thefollowing reasons:
(1) A study on the geochemical stratigraphy of the Pava-gadh sequence, and regional stratigraphic correla-tions have not yet been attempted.
(2) The petrogenesis of particularly the rhyolitic rockscapping the sequence, as well as a couple of picriticlavas, is of considerable interest.
(3) The Pavagadh sequence is a rare bimodal lavasequence in the Deccan, akin to many present in theParana and Karoo provinces (e.g., Peate, 1997).
(4) The eruptive areas of the lava sequence are unknown;the nearest dykes and mafic and silicic intrusions areexposed some 50–75 km to the south, in the NarmadaRiver region around Rajpipla and Navagam (Fig. 1;Krishnamurthy and Cox, 1980; Mahoney et al.,1985). Recent and ongoing dyke-flow correlationwork in the province (Widdowson et al., 2000; Bon-dre et al., 2006; Vanderkluysen et al., 2006 and inpreparation) builds on a large amount of high-qualitygeochemical data (including Sr–Nd–Pb isotopes) forboth lava sequences and dyke swarms.
(5) A N-R-N magnetic polarity stratigraphy (i.e., twomagnetic reversals) has been unambiguouslydocumented from sampled sections between Barw-ani and Mhow, in the Satpura–Narmada region(Fig. 1; e.g., Sreenivasa Rao et al., 1985; Dhanda-pani and Subbarao, 1992). Most of the thick Wes-tern Ghats lava sequence is reversely magnetized,with only the Mahabaleshwar and Panhala forma-tions being normally magnetized (Table 1). Interest-ingly, the lava pile forming the upper two-thirds ofMount Pavagadh is normally magnetized, whereasthe lower one third yielded random directions (Ver-ma and Mittal, 1974). If, thus, the normally polar-ized lavas of Pavagadh are neither geochemical norstratigraphic equivalents of the normally magne-tized lavas at the top of the Western Ghats (theMahabaleshwar and Panhala formations), thenthese Pavagadh lavas must stratigraphically corre-spond to the older Normal chron recorded in sec-tions located 150–200 km away in the Satpura–Narmada region, and like the latter the Pavagadhlavas must be older than the whole exposed WesternGhats stratigraphy.

Table 1Stratigraphy of the Deccan flood basalts in the Western Ghats, with formation thicknesses, magnetic polarity, and Sr isotopic values (at 66 Ma)
Group Sub-group Formation Magnetic polarity 87Sr/86Sr(66Ma)
Deccan Basalt Wai Desura (�100 m) N 0.7072–0.7080Panhala (>175 m) N 0.7046–0.7055Mahabaleshwar (280 m) N 0.7040–0.7055Ambenali (500 m) R 0.7038–0.7044Poladpur (375 m) R 0.7053–0.7110
Lonavala Bushe (325 m) R 0.7078–0.7200Khandala (140 m) R 0.7071–0.7124
Kalsubai Bhimashankar (140 m) R 0.7067–0.7076Thakurvadi (650 m) R 0.7067–0.7112Neral (100 m) R 0.7062–0.7104Igatpuri-Jawhar (>700 m) R 0.7085–0.7128
a The Desur is considered by many as a ‘‘Unit’’ of the Panhala formation itself. Table based on Sreenivasa Rao et al. (1985) and references therein, andPeng et al. (1994). N = normal magnetic polarity, R = reversed magnetic polarity.
H.C. Sheth, L. Melluso / Journal of Asian Earth Sciences 32 (2008) 5–21 7
Here, major and trace element and Sr-isotopic data onthe Pavagadh suite of rocks are presented, and their impli-cations for petrogenesis and magmatic evolution as well asthe regional stratigraphy of the Deccan Traps arediscussed.
3. Field work and samples
The lava pile of Mount Pavagadh is exposed between�300 m and 829 m above MSL. No unambiguously in situoutcrops are found in the jungle on the lower slopes of themountain below Machi (Fig. 1) at �300 m elevation. Thelavas were sampled along the pilgrim path from Machi tothe Hindu shrine at the summit, and also in the hills andquarries north and northwest of the mountain, where strati-graphic relationships are very ambiguous. The elevation ofeach sample taken on the mountain was noted with an altim-eter with a precision of ±10 m. Unfortunately, exposure ispoor even along the pilgrim path due to construction, theoutcrops significantly weathered, and flow boundaries rarelyclear. Below Machi, large blocks of rhyolitic rocks are foundon the side of the road, and whether they represent bouldersof the top rhyolite fallen from the summit, or mark a localrhyolite eruption in situ, is unknown.
The rhyolite flow at the top forms cliffs, and shows large,roughly vertical joints and curved sub-horizontal fractures,with some spectacular flow layering and flow folding.There is also a thin layer of pitchstone locally developedwithin the rhyolite, without sharp contacts. Fine, soft, fri-able rhyolitic ash (green or brown) is exposed below therhyolite on the northwest side. Sheth et al. (2004b)reported, from the topmost mafic flow underlying the sum-mit rhyolite and ash, low-relief circular cone-and-craterstructures, which they considered as possible rootless conesformed in the basaltic flow as it would have advancedacross a river or a lake.
4. Analytical methods
The samples were crushed into chips using a steel jawcrusher, and the chips were first washed in distilled water
and then ground in agate. Major and trace elements wereanalyzed at Naples (CISAG) with a Philips PW1400 X-ray fluorescence (XRF) spectrometer (see Melluso et al.,1995, 2004, 2005, 2006 for details). Precision is estimatedat better than 1% for SiO2, TiO2, Al2O3, Fe2O3
*, andCaO, better than 6% for K2O, 0.03 wt% for MnO andP2O5, and better than 5–10% for Sc, V, Cr, Ni, Cu, Ba,Zn, Sr, Y, and Zr for the observed ranges of concentration.Na and Mg were analyzed by atomic absorption spectro-photometry (AAS) at Naples, the precision being betterthan 6% for Na and better than 2% for Mg. The data aregiven in Table 2.
The rare earth elements and U, Th, Pb, Ta, and Hf wereanalyzed for a couple of samples by inductively coupledplasma mass spectrometry (ICPMS) at CRPG Nancy; pre-cision is better than 5–10%. Microprobe analyses of miner-als were performed at Cagliari University, using silicatesand oxides as standards, an ARL-SEMQ instrument andthe MAGIC IV correction method. Strontium-isotopiccompositions were measured at University of Rome, usinga VG54E thermal ionization mass spectrometer; full ana-lytical details can be found in Comin-Chiaramonti et al.(1997). Two samples were also analyzed for Nd–Sr–Pb iso-topes at the University of Hawaii, following methods out-lined in Mahoney et al. (2000) and Melluso et al. (2006).The trace element data are tabulated in Table 3, and Sr-iso-topic ratios in Table 4.
5. Nomenclature, petrography, and mineral chemistry
Previous workers (e.g., Chatterjee, 1961; Hari et al.,2000; Furuyama et al., 2001) have used much non-standardterminology to describe the rock types (e.g., hawaiite,mugearite, dellenite, and ankaramite), the use of which isno longer recommended (IUGS Subcommission on theSystematics of Igneous Rocks, Le Bas et al., 1986; LeBas, 2000). This study uses only the standardized terminol-ogy adopted by this Subcommission and terms such asankaramite are used in addition, where required. Table 2shows the major element compositions (calculated on ananhydrous basis) and normative compositions of the suite,

Table 2Major oxide (wt%) and normative compositions of the Pavagadh volcanic suite
Sample D86 D87 D88 D89 D99 D92 D93 D94 D95 D96 D97 D98Location 829 m 800 m 770 m 770 m 765 m 705 m 685 m 665 m 645 m 580 m 565 m 480 mRock type R R R R D B, subal B, subal B, subal B, subal B, subal PIC B, subal
SiO2 79.68 70.56 77.24 70.31 72.57 50.20 48.91 49.23 49.81 47.57 46.20 50.74TiO2 0.35 0.69 0.41 0.67 0.63 2.67 2.96 2.83 3.19 2.43 2.49 2.67Al2O3 10.01 13.79 11.05 13.29 13.53 16.66 17.02 16.97 14.30 13.78 13.45 15.06Fe2O3 0.72 1.54 0.90 1.72 1.56 1.90 2.05 1.91 2.20 1.98 1.95 1.85FeO 1.44 3.08 1.81 3.44 3.89 9.48 10.26 9.56 10.98 9.89 9.74 9.23MnO 0.05 0.08 0.04 0.13 0.19 0.12 0.17 0.16 0.20 0.20 0.15 0.18MgO 0.07 0.16 0.06 0.63 1.73 4.47 4.18 4.46 5.44 8.54 13.16 5.62CaO 0.15 1.25 0.33 2.17 3.93 9.16 9.38 9.55 9.28 12.67 9.94 10.39Na2O 1.64 3.40 2.09 4.37 0.90 3.12 3.15 3.22 2.87 2.11 1.77 2.62K2O 5.87 5.33 6.04 3.18 0.98 1.69 1.47 1.56 1.44 0.62 0.80 1.40P2O5 0.02 0.10 0.01 0.08 0.08 0.54 0.45 0.54 0.28 0.21 0.35 0.24LOI nd 0.91 0.96 2.01 8.31 nd nd nd 2.03 1.43 2.48 1.83Mg# 7.96 8.47 5.58 24.6 44.1 45.6 42.1 45.4 46.9 60.6 70.7 52.0Q 46.57 26.19 40.27 26.18 50.43 – – – – – – 0.36Or 34.69 31.49 35.71 18.80 5.81 9.97 8.67 9.20 8.50 3.65 4.72 8.30Ab 13.90 28.79 17.72 36.94 7.65 26.43 26.62 27.29 24.33 17.88 14.98 22.14An 0.61 5.57 1.58 7.26 18.96 26.45 27.98 27.24 21.88 26.29 26.39 25.21C 0.72 0.38 0.49 – 4.03 – – – – – – –Di – – – 2.53 – 12.83 12.97 13.80 18.47 28.63 16.57 20.33Hy 1.74 3.79 2.12 4.31 9.47 11.96 7.25 5.29 14.34 3.16 7.59 15.35Ol – – – – – 3.29 6.85 7.79 2.59 12.42 21.39 –Mt 1.04 2.24 1.31 2.50 2.26 2.75 2.97 2.77 3.18 2.87 2.82 2.68Il 0.66 1.31 0.78 1.28 1.20 5.07 5.63 5.38 6.06 4.61 4.72 5.07Ap 0.05 0.23 0.02 0.18 0.18 1.24 1.05 1.24 0.66 0.49 0.82 0.56
Sample D157 D158 D159 D160 D79 D81 D80 D85 D84 D82 D83 W2 W2Location 390 m 390 m 355 m 325 m NWP NWP NWP NP NP NP NP Std. Std.Rock type B, subal B, subal B, subal B, subal B, subal PIC B, subal B, subal B, subal PIC B, subal Meas. Ref.
SiO2 48.73 50.77 51.12 46.35 48.75 46.31 51.84 48.94 48.20 44.97 48.00 52.50 52.68TiO2 2.56 3.10 2.74 3.53 2.90 1.92 2.90 2.93 3.37 2.36 2.91 1.03 1.06Al2O3 16.04 13.96 14.57 17.75 16.49 11.98 14.45 17.12 14.82 11.57 15.49 15.57 15.45Fe2O3 1.96 2.06 1.94 2.23 1.92 1.96 2.03 1.80 2.13 1.73 1.94 10.95* 10.79*
FeO 9.82 10.30 9.70 11.17 9.63 9.80 10.14 9.02 10.66 11.53 9.68MnO 0.15 0.16 0.18 0.15 0.17 0.14 0.14 0.14 0.20 0.20 0.23 0.16 0.17MgO 6.19 5.78 5.81 4.10 6.38 14.46 3.15 4.03 6.04 15.60 6.35 6.59 6.37CaO 10.48 9.88 9.79 11.45 9.30 11.24 10.17 12.02 10.67 9.98 11.10 10.73 10.86Na2O 2.64 2.58 2.72 1.52 2.92 1.29 3.54 2.32 2.60 1.21 2.73 2.29 2.20K2O 1.04 1.17 1.18 1.32 1.25 0.63 1.43 1.21 1.07 0.57 1.21 0.65 0.63P2O5 0.38 0.23 0.24 0.42 0.28 0.27 0.21 0.46 0.22 0.27 0.35 0.17 0.14LOI nd 1.70 1.04 nd 2.84 2.84 2.31 nd 1.71 9.84 ndMg# 52.9 50.0 51.6 39.6 54.1 72.4 35.7 44.3 50.2 70.7 53.9Q – 1.784 1.284 0.581 – – 0.667 0.712 – – –Or 6.16 6.93 6.99 7.78 7.40 3.70 8.43 7.16 6.34 3.35 7.17Ab 22.33 21.82 23.01 12.85 24.72 10.95 29.95 19.66 22.01 10.20 23.09An 28.84 23.04 24.04 37.72 28.19 25.02 19.32 32.71 25.61 24.48 26.45C – – – – – – – – – – –Di 16.95 20.13 18.89 13.59 13.17 23.27 25.00 19.79 21.26 18.72 21.55Hy 10.48 16.86 17.21 16.53 8.10 8.40 7.69 10.71 8.06 8.46 0.46Ol 6.64 – – – 9.46 21.52 – – 6.70 27.15 12.12Mt 2.85 2.98 2.81 3.24 2.79 2.84 2.94 2.61 3.09 2.51 2.81Il 4.86 5.90 5.20 6.71 5.51 3.65 5.51 5.56 6.40 4.48 5.53Ap 0.89 0.54 0.56 0.98 0.66 0.63 0.49 1.08 0.52 0.63 0.82
Notes: NWP = northwest of Pavagadh; NP = north of Pavagadh; R = rhyolite, D = dacite, B, subal = basalt (sub-alkalic), PIC = picrite. D89 is apitchstone underlain by D88. D158 is just below D157. D160 is auto-brecciated lava flow just below D159. Normative compositions and the major oxidedata (recalculated on an anhydrous basis, and Fe2O3T separated into Fe2O3 and FeO) obtained using the SINCLAS program of Verma et al. (2002). Forstandard W-2, values with the asterisk * mean Fe2O3T. ‘‘Meas’’ are the measured values, and ‘‘Ref’’ are the reference values recommended by Govindaraju(1989). LOI is reported where available and provides an idea of the sub-aerial alteration suffered by the rocks. nd = not determined. Mg# = [atomic Mg/(Mg+Fe2+)] · 100, assuming Fe3+/Fe2+ = 0.16.
8 H.C. Sheth, L. Melluso / Journal of Asian Earth Sciences 32 (2008) 5–21

Table 3Trace element data for the Pavagadh volcanic suite
Sample D86 D87 D88 D89 D99 D92 D93 D94 D95 D96 D97 D98 D157 D158 D159 D160 D79 D81 D80 D85 D84 D82 D83 W2 W2Elev. (m) 829 800 770 770 765 705 685 665 645 580 565 480 390 390 355 325 NWP NWP NWP NP NP NP NP Std. Std.Rock type R R R R D B B B B B PIC B B B B B B PIC B B B PIC B M R
Sc 10 12 41 28 30 24 36 27 31 35V 4 17 15 3 14 368 391 380 429 423 249 353 455 451 311 294 255 368 255 437 287 369 235 262Cr 4 3 23 23 20 42 174 819 40 178 106 47 58 6 952.2 64 136 48 951 155 90 93Ni 9 6 15 14 12 28 128 381 48 124 81 49 71 50 400.1 49 81 82 421 77 70 70Zn 51 78 113 128 104 114 99 129 101 98 97 95 131 111 128 99 87 134 101 123 89 107 78 77Rb 192 190 214 189 46 42 39 38 29 12 23 33 29 22 22 16 34 18 46 22 23 26 24 20Sr 77 165 50 192 1961 492 497 524 465 364 297 522 407 429 410 106 510 300 317 138 491 508 190 194Y 48 61 62 63 112 34 33 34 38 26 21 27 27 37 33 31 27 21 27 32 33 18 27 21 24Zr 154 552 451 536 458 235 230 229 250 161 160 172 184 232 216 203 186 121 127 235 225 135 204 94 94Nb 40 60 59 60 45 42 39 39 52 30 26 36 27 37 37 37 33 20 42 63 57 25 43 6.8 7.9Ba 345 875 472 947 1766 503 478 474 416 249 364 439 403 317 376 574 347 372 278 375 349 190 182La 94.3 105 21.1 31.2 30.4 15.2 22Ce 178 210 50.1 72.8 59.5 33.8 41.7Pr 21.2 6.21 4.06nd 77.2 92.8 25.1 36.2 29.9 17.4 20.8Sm 16.2 21.3 5.98 8.58 6.45 4.22 4.7Eu 3.49 4.17 1.75 2.58 2.13 1.32 1.63Gd 13.5 22.0 5.97 8.03 6.03 4.33 5Tb 1.77 0.72 0.53Dy 11.9 19.2 4.44 6.44 4.99 3.06 3.33Ho 2.17 0.83 0.53Er 5.48 10.3 2.06 3.01 2.27 1.36 1.26Tm 0.89 0.28 0.19Yb 5.51 9.86 1.7 2.48 2.01 1.09 1.26Lu 0.83 1.68 0.28 0.43 0.34 0.23 0.18Ta 4.42 2.10 1.40Pb 26 2.38 1.75Th 31.2 3.45 3.00 6.00 1.99U 7.18 0.65 0.34
Notes: W2 ‘‘M’’ and W2 ‘‘R’’ are the measured and reference values (Govindaraju, 1989), respectively, for the standard W2.
H.C
.S
heth
,L
.M
elluso
/J
ou
rna
lo
fA
sian
Ea
rthS
ciences
32
(2
00
8)
5–
21
9

Table 4Isotopic ratios age-corrected to 66 Ma for the Pavagadh volcanic suite
Sample D87 D89 D96 D97 D79 D81
R, 800 m R, 770 m B, 580 m PIC, 565 m B, NWP PIC, NWP
143Nd/144Nd(t) 0.512759 0.512701eNd(t) +4.0 +2.987Sr/86Sr(t) 0.70639 0.70826 0.70495 0.70450 0.70626 0.70444
0.70458*
206Pb/204Pb(t) 18.796 18.608207Pb/204Pb(t) 15.630 15.605208Pb/204Pb(t) 39.064 38.879
Notes: eNd(0) = 0 today corresponds to 143Nd/144Nd = 0.512640; eNd(t) = 0 at 66 Ma corresponds to 143Nd/144Nd = 0.512555. All Sr-isotopic work was atUniversity of Rome, except for D81, where the ratio obtained at Rome (0.70458) differs slightly from that obtained at University of Hawaii (0.70444) byMelluso et al. (2006); the latter is preferred.
10 H.C. Sheth, L. Melluso / Journal of Asian Earth Sciences 32 (2008) 5–21
the latter obtained with the SINCLAS program of Vermaet al. (2002), which has been developed to comply withIUGS nomenclature and also provides a standard rockname for each sample. The Middlemost (1989) option pro-vided within SINCLAS was used for dividing the iron intoferrous and ferric iron. The Pavagadh data (Fig. 2) plot inthe basalt and rhyolite fields, with one picrite and onedacite, on the total alkali–silica (TAS) diagram (Le Baset al., 1986). Here, most data also plot below the alkalic–subalkalic boundary (heavy line) of Irvine and Baragar(1971), showing that most of the lavas are subalkalic(Fig. 2). Greenough et al. (1998) called the suite mildlyalkalic, using plots such as the Zr–TiO2 plot of Floydand Winchester (1978). Not only does this plot shows alarge overlap between tholeiitic and alkali basalts, butGreenough et al.’s data points could belong to either cate-gory (see their Fig. 3). Most important, alkalic or subalka-lic nature of volcanic rocks must be determined purely onthe basis of total alkali and silica contents (see also Shethet al., 2002). As seen in Fig. 2, the TAS diagram, most sam-ples of Greenough et al. (1998) (recalculated on an anhy-
0
2
4
6
8
10
12
40 45 50 55 60 65 70 75 80
BBA
A
D
R
TTPH
PHT
TPH
FOI
TB
BTA
TA
PB
BSN
Pavagadh (this study)Pavagadh (Greenough et al.)Kachchh basanites
SiO2 (wt.%)
Na 2O
+ K
2O (
wt.%
)
alkalic
sub-alkalic
Fig. 2. The Pavagadh data (this study and Greenough et al., 1998) on theTAS diagram (Le Bas et al., 1986). The Western Ghats lavas (624 samples,Beane, 1988) are shown for comparison (shaded area), as are the basanitesof Kachchh (Karmalkar et al., 2005). Curved line is the boundary betweenalkalic and subalkalic rocks proposed by Irvine and Baragar (1971).
drous basis using SINCLAS) are subalkalic. All samplesof the present study are hypersthene-normative (1.74–17.2%), and have variable normative olivine (up to27.2%). The rhyolite and dacite are strongly quartz norma-tive (up to 50.4% in the altered sample D99). Note that thesamples D97 (three-phenocryst basalt) and D81 (ankara-mite) each have MgO > 12 wt%, and therefore are picritesby the standard nomenclature (Le Bas, 2000). Bothare olivine- and clinopyroxene-phyric, with plagioclasephenocrysts also abundant in D97. Olivine is usuallyaltered, and often has chromite inclusions. The ankaramiteD82 to the north of Pavagadh has also chromite, olivine,and clinopyroxene phenocrysts, and is highly altered(LOI = 9.84 wt%). Basalts are generally sparsely phyric,with phenocrysts of plagioclase, clinopyroxene andstrongly altered olivine, in a pilotaxitic mesostasis rich inopaque microlites, in addition to plagioclase and clinopy-roxene. The basalt D79 has fresh Fe-rich olivines and anophitic texture with clinopyroxene enclosing olivine andplagioclase, interstitial opaques and, unusually, phlogopite.
The pitchstone (sample D89) is very fresh and sparselyphyric, with iddingsitized Fe-olivine, plagioclase, opaques,pigeonite, and augite phenocrysts and microphenocrysts ina glassy matrix. The tuffaceous rocks have textures similarto those of pyroclastic flow deposits. The rocks are some-times crystal-rich (mostly plagioclase), and pumice frag-ments are frequently observed in the oriented, oftendevitrified, glassy matrix with flow textures. Representativeanalyses of the most important mineral phases found in thePavagadh rocks are plotted in Fig. 3, and full data tablescan be obtained from the authors. Olivine ranges fromFo88 in the phenocryst cores in D97 to Fo49 in the D79mesostasis. The pitchstone D89 has rare uniformly Fe-richolivines (Fo27–Fo28). Pyroxene in the basalts is Ca-rich,close to diopside-salite (Ca46Mg47Fe7 to Ca46Mg27Fe27),with variable but generally high, TiO2 (0.65–3.03 wt%).Fe-augite (Ca36Mg31Fe32 to Ca46Mg27Fe27) and Fe-pigeon-ite (Ca9Mg37Fe54 to Ca10Mg34Fe56) are present in thepitchstone D89. Basalt-groundmass feldspars range fromAn74 to anorthoclase and sodic sanidine (Or52Ab42An6).Rhyolites have sodic plagioclase (An40) to anorthoclase(Ab64Or24An6). The phlogopite in the basalt D79 is Mg-

Ca
K Na
Feldspars
augite
pigeonite
enstatite-ferrosilite
diopside hedenbergiteCaMg CaFe*
Mg Fe*
Pyroxenes
Olivines
Mg Fe*forsterite fayalite
anorthite
albite orthoclase
Fig. 3. Compositions of feldspars, pyroxenes and olivines in the Pavagadhsuite of rocks. Open squares are the mafic and ultramafic rocks and blacksquares are the silicic rocks. Grey shaded areas cover the hundreds ofunpublished analyses of L. Melluso from the Deccan province.
NNO
QFMMW
HM
log
fO2
Temp. (oC)
-8
-9
-10
-11
-12
-13
-14800 900 1000 1100 1200
Pavagadh silicicPavagadh maficSagar to NagpurIgatpuriMahabaleshwar
Fig. 4. Oxygen fugacity and Fe–Ti oxide equilibration temperatures forthe Pavagadh silicic and mafic lavas. Shown for comparison are data ofSethna et al. (1987) for Deccan basalts of Sagar to Nagpur area (filledcircles), Igatpuri section (open circles) and Mahabaleshwar section (opentriangles). See Fig. 1 inset for locations. The four curves labeled HM,NNO, QFM, and WM represent the buffer curves haematite–magnetite,nickel–nickel oxide, quartz–fayalite–magnetite, and wustite–magnetite,respectively (after Eugster and Wones, 1962).
H.C. Sheth, L. Melluso / Journal of Asian Earth Sciences 32 (2008) 5–21 11
rich (21–22 wt% MgO) and has relatively high TiO2 (2.4–4.4 wt%).
The salitic pyroxenes of the Pavagadh basalts indicate arelatively alkalic affinity of the parental magmas, and differfrom the typical Ca-rich pyroxenes (augitic-ferroaugitic) ofthe largely tholeiitic Deccan Traps (Fig. 3). This alkaline ten-dency is also noted from the presence of anorthoclase in thegroundmass of the basalts and in the rhyolites. This is not tosay that the Pavagadh lavas are alkalic (by normative com-position or on the TAS diagram), of course. The presenceof pigeonite in the rhyolites, and the complete absence ofpigeonite in the basalts is also noteworthy. Fe–Ti oxidesare present as Cr-rich spinels included in olivine, Ti-magne-tites and ilmenites. The equilibration temperatures and oxy-gen fugacities (Fig. 4) calculated using magnetite-ilmeniteanalyses range from 1171 �C, 10�8.82 bars fO2 to 863 �C,10�13.3 bars fO2 (X’Usp and X’Ilm recalculation methodsgiven in LePage, 2003). In comparison, Hari et al. (1991)determined the higher-end range of 1040–1240 �C in theform of homogenization temperatures for olivine-hostedmelt inclusions in some of these rocks (Hari et al., 1991).
6. Magmatic evolution
6.1. Partial melting
Melluso et al. (2006) have recently provided an elemen-tal and isotopic study of the picritic or high-MgO
(P10 wt%) basalts and picrites of Gujarat, including thepicritic lavas at Pavagadh (D97 and D81). Such high-MgO rocks (picrites and ankaramites) can be primitive(high-MgO) liquids formed by melting of mantle rocks athigh temperature and pressure, which evolve to basalticmagmas by pronounced olivine ± clinopyroxene fraction-ation (e.g., Cox, 1980). More commonly, they are the prod-ucts of accumulation of olivine ± clinopyroxene in basalticliquids. Considerations of olivine-liquid and clinopyrox-ene-liquid equilibria using whole-rock geochemical andmineral chemical compositions help to distinguish thetwo situations. It is known, thus, that whereas the picritesand picritic basalts of the Western Ghats are normalevolved basalts enriched in cumulus olivine and clinopy-roxene (Beane and Hooper, 1988; Sheth, 2005), those ofthe Saurashtra peninsula and Pavagadh, and some encoun-tered in the Narmada region, represent near-primitiveliquid compositions (West, 1958; Krishnamurthy andCox, 1977; Melluso et al., 1995, 2006; Peng and Mahoney,1995; Krishnamurthy et al., 2000). Melluso et al. (2006)report that the Sr–Nd–Pb isotopic compositions of thePavagadh picrites are very similar to those of picritic bas-alts in Saurashtra. They modeled the incompatible elementpatterns of these estimated primitive liquids using a primi-tive mantle source and a non-fractional melting model.They assumed that melting of this primitive mantle sourcestarted in the garnet facies, and the melts of both garnetand spinel facies mixed variably to form the calculatedmelts. The Pavagadh picrites, with high TiO2, appear tocontain 23–42% of the total melt from garnet lherzolite,and Melluso et al. (2006) estimate the total percentage ofpartial melting to be between 4.8% and 6.2% for theserocks.

12 H.C. Sheth, L. Melluso / Journal of Asian Earth Sciences 32 (2008) 5–21
6.2. Closed-system fractional crystallization
Fig. 5 shows the chemical variation in some of theimportant elements with MgO. The mafic lavas have a sig-nificant range of variation, with MgO varying from 15 to4 wt%. Correspondingly, Al2O3 increases from 11 to17.5 wt%, SiO2 from 44 to 51 wt%, and TiO2 increases upto 3.5 wt%. Fig. 6 shows the chemical variation in thesequence against stratigraphic height. High concentrationsof Ba and other elements are encountered in the evolvedlavas.
Major element mass balance calculations (with the pro-gram XLFRAC, Stormer and Nicholls, 1978) allow thetransition from magmas such as D81 and D97 to evolvedbasalts through moderate (42–67%) fractionation of assem-blages dominated by clinopyroxene and olivine, with loweramounts of plagioclase and oxides (Table 5). The transitionfrom evolved basalts to rhyolites was modeled throughfractionation of assemblages dominated by relatively sodicplagioclase (roughly half of the crystal extract), with a sig-nificant contribution of clinopyroxene and oxides (Table5). Apatite and Fe-rich olivine are minor. As a result, theevolved rhyolites can be produced after 84–89% total frac-tionation of a solid with the composition of an olivinegabbro.
60
50
40
18
16
12
8
500
300
100
500
300
100
5 10 15 200
0 5 10 15 20
0 5 10 15 20
5 10 15 200MgO
Al 2
O3
VZr
SiO
2
70
Fig. 5. Major and trace element variations with MgO in the Pav
The Sr-isotopic compositions of basalts and rhyolites(Table 4), however, make closed-system fractional crystal-lization untenable. Open-system processes must be invokedin a small but significant degree, besides fractional crystal-lization, to explain the evolved rocks.
6.3. Assimilation and fractional crystallization (AFC)
The process of concurrent assimilation and fractionalcrystallization (AFC, DePaolo, 1981) is more realistic thansimple fractional crystallization or bulk mixing, as the heatrequired for assimilation of contaminant can be suppliedby the latent heat of crystallization of the magma (Bowen,1928). Effects of AFC are often significantly different fromthose of bulk mixing. In the latter, the concentration of anelement in the magma changes in the direction of that inthe contaminant, but not necessarily so in AFC, wherethe change in concentration of residual magma dependsnot only on the concentration of that element in the con-taminant and the degree of contamination, but also thedegree of fractional crystallization and the concentrationof the element in the fractionation assemblage.
AFC modeling was performed for the Pavagadh basaltsand rhyolite in terms of Sr concentrations and 87Sr/86Srratios (Fig. 7), using two distinct crustal contaminants
150
50
250
70
50
30
10
5
10
1
2
3
4
5 10 15 200
5 10 15 200
5 10 15 200
5 10 15 200
MgO
TiO
2C
aON
b
15
Rb
agadh suite of rocks. Oxides are in wt%, elements in ppm.

300
350
400
450
500
550
600
650
700
750
800
850
0 5 10 15 20 25 30 35 40 45 50 55 60 65 70 75 80
SiO2TiO2MgO
K2O
a
300
350
400
450
500
550
600
650
700
750
800
850
0 200 400 600 800 1000 1200 1400 1600 1800 2000
RbBaNbSrZr
b
D86 (rhyolite, 829 m)D87 (rhyolite, 800 m)D88 (rhyolite), D99 (pitchstone), 770 mD99 (dacite, 765 m)
D92 (basalt, 705 m)D93 (basalt, 685 m)D94 (basalt, 665 m)D95 (basalt, 645 m)
D96 (basalt, 580 m)D97 (picrite, 565 m)
D98 (basalt, 480 m)
D157 (basalt, 391 m)D158 (basalt, 389 m)D159 (basalt, 355 m)D160 (basalt, 325 m)
Elev
atio
n (m
)El
evat
ion
(m)
Oxide (wt.%)
Element (ppm)
Fig. 6. Chemical variation with elevation on Mount Pavagadh.
H.C. Sheth, L. Melluso / Journal of Asian Earth Sciences 32 (2008) 5–21 13
and a single starting picritic magma (D97, withSr = 297 ppm, 87Sr/86Sr = 0.70450) for each. It was foundthat a two-stage AFC process with either contaminantexplains the data quite well.
6.3.1. AFC Model 1
In this model (Fig. 7a) the crustal end member is asouthern Indian granite (Peucat et al., 1989) withSr = 160 ppm and 87Sr/86Sr = 0.7258. The generation ofthe final evolved liquid (rhyolite D89, with Sr = 192 ppmand 87Sr/86Sr = 0.70826) was achieved in two stages. Dur-ing the first stage, the basalt magma D97 was contaminatedby the granite and simultaneously underwent fractionalcrystallization (bulk partition coefficient for Sr,DSr = 0.51) to produce the evolved basalt magma D79,with Sr = 510 ppm and 87Sr/86Sr = 0.70626. The value ofr (the ratio of the rate of assimilation to the rate of frac-tional crystallization, DePaolo, 1981) is 0.15, and D79 rep-resents a residual liquid (F = 0.321) left after 67.9%crystallization of the starting D97 magma. This value of
F was determined from DePaolo’s (1981) equation for iso-topic ratio, using the value of the parameter z = (r + D�1)/(r�1) (see Sheth and Ray, 2002).
During the second stage, D79 was contaminated by thesame granite and simultaneously fractionated (DSr = 1.8)to produce the rhyolite D89. The value of r is 0.18, andD89 represents a residual liquid (F = 0.403) left after�59.7% fractional crystallization of the D79 magma. Thefigure also shows that the rhyolite D87 (Sr = 165,87Sr/86Sr = 0.70639) can be derived by nearly pure frac-tional crystallization of the basalt D79.
6.3.2. AFC Model 2
In this model (Fig. 7b) the crustal end member is a wes-tern Indian granite with Sr = 145 ppm and87Sr/86Sr = 0.7690 (Gopalan et al., 1979). This granite out-crops at Godhra (Fig. 1), only �50 km NNE of Pavagadh.The generation of the final evolved liquid (rhyolite D89,with Sr = 192 ppm and 87Sr/86Sr = 0.70826) was achievedin two stages. During the first stage, the basalt magma

Table 5Mass balance calculations for closed-system fractional crystallization
From to ol cpx Cr-Al-sp plP
R2 % Removed solid
D81 D156 36.8 40.3 4.3 18.5 100.0 0.15 50.7D81 D79 32.7 45.1 4.8 17.4 100.0 0.31 52.9D81 D80 33.2 33.8 5.6 27.4 100.0 0.33 67.1D81 D84 37.7 35.4 2.8 24.1 100.0 0.15 53.0D97 D79 37.8 33.0 9.2 20.1 100.0 0.12 42.1
ol cpx Sp pl
D97 D80 38.1 18.2 5.5 38.1 100.0 0.25 62.8D97 SH92 33.8 22.2 5.5 38.5 100.0 0.32 63.7
Fe-ol cpx sp Na-pl ap
D80 D89 2.6 36.1 11.9 48.0 1.4 100.0 0.63 70.3D84 D89 9.7 28.2 11.3 50.0 0.9 100.0 0.53 86.2
From to ol cpx sp pl ap % Removed solid
D81 D80 22.3 22.7 3.7 18.4 67.1D80 D89 1.8 25.4 8.3 33.7 1.0 70.3D81 D89 22.7a 28.6 5.7 26.2 0.2 83.4 16.6 Residual liquidD81 D84 20.0 18.8 1.5 12.8 53.0D84 D89 8.3 24.3 9.7 43.1 0.8 86.2D81 D89 23.4b 28.6 5.4 30.2 0.3 87.9 12.1 Residual liquidD97 D80 24.0 11.5 3.5 24.0 62.8D80 D89 2.6 36.1 11.9 48.0 1.4 100.0D97 D89 25.0c 24.9 7.9 41.8 0.5 100.0
a 22.7 = 22.3 + 1.8 (1–0.671)* 0.703.b 23.4 = 20.0 + 8.3 (1–0.53)* 0.862.c 25.0 = 24.0 + 2.6 (1–0.628)* 1.00.
14 H.C. Sheth, L. Melluso / Journal of Asian Earth Sciences 32 (2008) 5–21
D97 was contaminated by the granite and simultaneouslyunderwent fractional crystallization (bulk partition coeffi-cient for Sr, DSr = 0.51) to produce the evolved basaltmagma D79, with Sr = 510 ppm and 87Sr/86Sr = 0.70626.The value of r is 0.06, and D79 represents a residual liquid(F = 0.326) left after 67.4% crystallization of the startingD97 magma. During the second stage, D79 was contami-nated by the same granite and simultaneously fractionated(DSr = 1.8) to produce the rhyolite D89. The value of r is only0.055, and D89 represents a residual liquid (F = 0.328) leftafter 67.2% fractional crystallization of the D79 magma.Note that bulk mixing of a D97 magma with either the southIndian or the western Indian granite contaminant cannotexplain the compositions of the lavas (Fig. 7a and b).
Alexander (1981) reported a high 87Sr/86Sr ratio of0.7111 in the Pavagadh rhyolite and correctly argued forthe involvement of the continental crust, but did not men-tion from where the sample came (the summit lava, or therhyolite blocks that lie scattered on the lower slopes of themountain, probably a separate eruption). No attempt istherefore made here to explain his isotopic value.
6.4. Degree of crustal contamination
DePaolo (1981) defined the parameter r as the ratio ofthe rate of assimilation (mass assimilated per unit time)to the rate of fractional crystallization (mass fractionatedper unit time). His AFC modeling and equations do notyield a value for the degree or amount of contamination,
however. Sheth and Ray (2002) extended the scope of theAFC modeling by deriving a mathematical expression forthe degree of contamination (C), which is: C% = r (1�F)/(1�r). They meant, by degree of contamination at anygiven instant, the ratio of the mass of total assimilatedmaterial to the initial mass of the magma as at that instant.Using this equation, the degree of crustal contaminationsuffered by the residual liquids D79 and D89 was calcu-lated, for either contaminant. All that is required is valuesof r and F represented by a particular residual liquid. Withthe southern Indian granite as the contaminant (Fig. 7a),the equation of Sheth and Ray (2002) yields a contamina-tion value of 11.98% in the production of the basalt D79from the picrite D97, and a contamination of 13.10% inthe production of the rhyolite D89 from the basalt D79.On the other hand, with the western Indian granite as thecontaminant (Fig. 7b), the equation yields a contaminationvalue of 4.30% in the production of the basalt D79 fromthe picrite D97, and a contamination of 3.91% in the pro-duction of the rhyolite D89 from the basalt D79. The per-centage contamination implied or required by the residualliquids D79, or D89, with the western Indian granite as acontaminant is significantly less (�4%) than that with thesouth Indian granite (12–13%). This is clearly because ofthe much higher 87Sr/86Sr ratio of the western (0.7690) thanthe southern (0.7258) Indian granite. Sr concentration alsoobviously is a factor, but not in this specific case as bothgranites differ by only �10% in their Sr concentration(145 vs. 160 ppm).

0.7040
0.7050
0.7060
0.7070
0.7080
0.7090
150 200 250 300 350 400 450 500 550
SamplesPavagadh sectionD87 = rhyolite (800 m)D89 = rhyolite (770 m)D96 = H-Ti basalt (580 m)D97 = H-Ti basalt (565 m)D79 = H-Ti basalt (NWP)D81 = H-Ti basalt (NWP)
0.7040
0.7050
0.7060
0.7070
0.7080
0.7090
150 200 250 300 350 400 450 500 550
crustal end-membersouthern Indian graniteSr = 160 ppm87Sr/86Sr = 0.7258
bulk mixing (D
97 + crust)
bulk mixing (D79 + crust)
crustal end-memberwestern Indian graniteSr = 145 ppm87Sr/86Sr = 0.7690
bulk mixing (D
97 + crust)
bulk mixing (D
79 + crust)
10%
5%
10%
5%
10%
5%
20%
30%
20%
5%
10%
30%
Sr (ppm)
Sr (ppm)
SamplesPavagadh sectionD87 = rhyolite (800 m)D89 = rhyolite (770 m)D96 = H-Ti basalt (580 m)D97 = H-Ti basalt (565 m)D79 = H-Ti basalt (NWP)D81 = H-Ti basalt (NWP)
a
b
AFC stage 1
r = 0.15, DSr = 0.51
AFC stage 1
r = 0.06, DSr = 0.51
AFC stage 2r = 0.18, DSr = 1.8
AFC stage 2r = 0.055, DSr = 1.8
87Sr
/86Sr
D87
D81D97
D96
D79
D89
D97D81
D96
D87
D89
D79
F = 0.7
F = 0.4
F = 0.9
F = 0.3
F = 0.4
F = 0.7
F = 0.4
F = 0.9
87Sr
/86Sr
Fig. 7. AFC modeling for the Pavagadh basalts and rhyolites, using (a) southern Indian granite as a contaminant and (b) western Indian granite as acontaminant. The DSr values of 0.51 and 1.8 for AFC stage 1 and stage 2, respectively, are based on the following Kd values for Sr (Arth, 1976; Watson andGreen, 1981; Rollinson, 1993): Stage 1 (olivine, 0.014; clinopyroxene, 0.06; plagioclase, 2.1), stage 2 (olivine, 0.014; clinopyroxene, 0.516, sodic plagioclase,3.3; apatite, 1.3).
H.C. Sheth, L. Melluso / Journal of Asian Earth Sciences 32 (2008) 5–21 15
7. Geochemical comparisons and stratigraphic correlations
of the Pavagadh lavas
Geochemical comparisons and geochemical strati-graphic correlations across the Deccan province, that arenow routinely performed (Peng et al., 1998; Mahoneyet al., 2000; Sheth et al., 2004a; Bondre et al., 2006) havecombined three or all of the following four approaches:(i) binary plots of incompatible element concentrationsand concentration ratios, (ii) comparison of the primitive-mantle-normalized multielement patterns of the sampleswith patterns of the southwestern lavas, (iii) comparisonof Sr–Nd–Pb isotopic ratios, and (iv) discriminant functionanalysis employing major elements and several commonly
analyzed trace elements. The same approach is followedhere.
7.1. Binary discrimination diagrams
A useful tabulated summary of key element (Sr, Ba),element ratio (Ba/Y, Zr/Nb), and Sr-isotopic ranges ofvarious formations making up the Western Ghats stratig-raphy can be found in Mitchell and Widdowson (1991).Fig. 8 compares element concentrations and concentra-tion ratios in the Pavagadh basalts and picrites to thoseof the Western Ghats formations (624 samples, Beane,1988), the Bhuj basanites (Karmalkar et al., 2005), thehigh-Nb-Ba Toranmal lavas (Mahoney et al., 2000), as

100
150
200
250
300
350
400
450
500
550
0 100 200 300 400 500 60050
100
150
200
250
300
350
0 100 200 300 400 500 600
Pavagadh basaltsBarwani-Mhow basalts
10
20
30
40
50
60
70
80
90
100
70 120 170 220 270
Pavagadh basaltsPavagadh picritesKachchh basanitesToranmal high-Nb-BaKalsubai Subgroup (n = 236)
Wai Subgroup (n = 185)
a
0.05
0.10
0.15
0.20
0.25
0.30
0.35
30 35 40 45 50 55 60 65 70 75
b
0.05
0.10
0.15
0.20
0.25
0.30
0.35
0 5 10 15 20 25 30 35 40 45 50 55 60 65
Pavagadh basaltsPavagadh picritesKachchh basanitesToranmal high-Nb-BaKalsubai SubgroupLonavala SubgroupWai Subgroup
c
0.05
0.10
0.15
0.20
0.25
0.30
0.35
100 200 300 400 500 600 700 800 900
d
Lonavala Subgroup (n = 203)
Zr (ppm)
Nb
(ppm
)
Nb/
Zr
Mg No.
Nb/
Zr
Nb/
Zr
Ba/Y Sr (ppm)
Sr (p
pm)
Ba (ppm) Ba (ppm)
Zr (p
pm)
Pavagadh basaltsBarwani-Mhow basalts
e f
Fig. 8. Binary geochemical variation diagrams of incompatible elements and element ratios for the Pavagadh mafic rocks (filled circles are basalts, filleddiamonds are picrites). Data for the Western Ghats formations (624 samples, Beane, 1988), the Kachchh basanites (Karmalkar et al., 2005), the high-Nb-Ba lavas at Toranmal (Mahoney et al., 2000), and the Barwani–Mhow basalts (Sreenivasa Rao et al., 1985) are shown for comparison. Throughout the sixpanels, open squares are Kalsubai Subgroup lavas, open circles are Lonavala Subgroup lavas, and open triangles are Wai Subgroup lavas.
16 H.C. Sheth, L. Melluso / Journal of Asian Earth Sciences 32 (2008) 5–21
well as the basalts exposed between Barwani and Mhow(Sreenivasa Rao et al., 1985). The Pavagadh rocks areclearly separated from the Western Ghats formationson a plot of Nb vs. Zr (Fig. 8a). The Pavagadh basaltshave Zr values comparable to or slightly higher than thatof many Western Ghats basalts, but their Nb values areconsiderably higher, like those of a few flows at Toran-mal section for example. Mahoney et al. (2000) couldnot correlate these Toranmal lavas to the Western Ghatslavas.
The Nb/Zr ratio changes little even during extreme sub-aerial alteration, due to both elements having approxi-mately similar mobilities, and is therefore one of themost useful in petrogenetic interpretations and geochemi-cal comparisons of altered Deccan basalts, and in fact eventhe laterites derived from them (e.g., Mitchell and Widdow-son, 1991; Widdowson and Cox, 1996). The Mahabalesh-war Formation basalts have the highest Nb/Zr ratiosamong the Western Ghats lavas, but the Pavagadh basaltshave still higher values. Notably, the Pavagadh and

H.C. Sheth, L. Melluso / Journal of Asian Earth Sciences 32 (2008) 5–21 17
Western Ghats basalt lavas have the same range of MgNumber (Fig. 8b), though their near-total separation interms of Nb/Zr is evident in Fig. 8b, the Pavagadh sampleshaving systematically higher values (>0.15) than the Wes-tern Ghats lavas (mostly 0.05–0.10). Fig. 8c is a plot ofNb/Zr vs. Ba/Y. Y is also resistant to alteration, and Srand Ba are much less mobile than K or Rb; however, withadvanced alteration, Si, Ca, P, Ni, Sr, Y, Ba, and the REEare all modified relative to elements such as Al, Nb, Zr, Fe,Cr, and Ti (e.g., Widdowson and Cox, 1996; Mahoneyet al., 2000). Both Nb/Zr and Ba/Y ratios are also rela-tively insensitive to fractional crystallization of mineralscommon in basaltic liquids. The Pavagadh samples alsohave Ba/Y ratios higher than the Western Ghats lavas,except a few Khandala Formation lavas. The same clearseparation of the Pavagadh basalts from almost all theWestern Ghats lavas persists on a plot of Sr vs. Nb/Zr(Fig. 8d). Thus, the Pavagadh basalts, though mostlysub-alkalic and as evolved as the Western Ghats lavas,have unusually high Nb concentrations and Nb/Zr ratios,and these characteristics cannot be explained by variableamounts of fractional crystallization or subaerial alter-ation. Nb is a strongly incompatible element, with Zr onlyslightly less so. Based on these key element and elementratio plots, none of the Pavagadh section basalts can begrouped with any of the Western Ghats formations includ-ing the uppermost Panhala Formation. Despite having thesame (normal) magnetic polarity as the upper Pavagadhbasalts, all Panhala lavas have Sr < 200 ppm, Ba < 90ppm, and TiO2 < 2.3 wt% (Lightfoot and Hawkesworth,1988; Lightfoot et al., 1990; Mitchell and Widdowson,1991). Most Pavagadh basalts have Sr and Ba values of400–500 ppm, and TiO2 values well over 2.5 wt% (Tables2 and 3).
A thorough geochemical comparison of the Pavagadhbasalts to the basalt lavas forming sizeable sectionsbetween Barwani and Mhow (Fig. 1) cannot be attempted,because published geochemical data for these latter are lim-ited to the major oxides and Ba, Sr and Zr contents (Sree-nivasa Rao et al., 1985); no isotopic data exist. (No directcorrelations of these sections to the Western Ghats havebeen possible either.) Fig. 8e and f compare the Ba-Sr-Zrcontents of the Pavagadh, the Satpura-Narmada, and theWestern Ghats lavas, and show that the Pavagadh basaltscannot be correlated with any of these basalts in terms ofthese three elements combined.
7.2. Normalized multielement patterns
Fig. 9a shows the primitive-mantle-normalized multiele-ment patterns for some of the Pavagadh lavas. The Pava-gadh picrites D81 and D97 have patterns closely similarto the central Saurashtra picrite D44 analyzed by Mellusoet al. (1995). The patterns resemble those of ocean islandbasalts, and the Mahabaleshwar Formation pattern isbroadly similar. The basanites of Kachchh (Karmalkaret al., 2005) have patterns that are very similar in shape,
though displaced at higher incompatible element contents,thus suggesting similarity in the mantle source signature.
Fig. 9b shows the primitive-mantle-normalized multiele-ment patterns of two of the Pavagadh basalts. The patternsof the basalts D158 and D79 are steeply sloping to theright, and are therefore easily distinguished from those ofthe Ambenali and Mahabaleshwar Formations. The basaltpatterns are similar to the Khandala Formation basalt pat-terns, and yet there are significant differences, especially inBa and the heavier elements, so that the patterns cross. It issafe to conclude on the basis of multielement patterns, thatthe Pavagadh basalts do not closely resemble any of theWestern Ghats formations or members or individual lavaflows.
7.3. Discriminant function analysis
Discriminant function analysis would not be helpful inthe present case, given the very clear separations betweenthe Pavagadh and the Western Ghats lavas in many ele-ments, element ratios, and multielement patterns. The anal-ysis was nevertheless executed twice (the first run using themajor oxides SiO2, Al2O3, Fe2O3, FeO, CaO, MgO, K2O,and P2O5, and the second using the trace elements Ni, V,Ba, Rb, Sr, Zr, Y, and Nb), following exactly the method-ology of recent workers who have found it useful or extre-mely useful ( Peng et al., 1998; Mahoney et al., 2000; Shethet al., 2004a; Bondre et al., 2006). As expected, both runsyielded zero probability of any of the Pavagadh lavas beinggrouped with any of the Western Ghats formations. Thetabulated results are available from the authors.
8. Discussion
It is evident that the Pavagadh section is chemically andgenetically unrelated to the Western Ghats lava pile, and tosections in the north and northeast of the province (wherethick lava piles closely resemble the Western Ghats lavapile, in the elements and also Nd–Sr isotopes and some-times Pb isotopes, Peng et al., 1998). In no way does thisreduce the value of chemostratigraphy or magnetic polaritystratigraphy as correlation tools, of course. Rather, itappears that separate but possibly coeval eruptive centers,with their own distinctive chemistries, developed in differ-ent areas.
A few basalts in the northwest have characteristics suchas high Nb concentrations resembling the Pavagadh basalts(e.g., the Anjar basalts, with Nb from 19 to 64 ppm, Shuklaet al., 2001). The Navagam basalts exposed on the Nar-mada River (Mahoney et al., 1985; Melluso et al., 1995)are also notable in having such uniformly high Nb concen-trations. In contrast, only a few flows of the Toranmal sec-tion (Mahoney et al., 2000), Rajpipla (Krishnamurthy andCox, 1980; Mahoney et al., 1985; Melluso et al., 1995) andMhow (Peng et al., 1998) have such high (P30 ppm) Nbvalues. It is noteworthy here that the few high-NbToranmal flows also could not be correlated with any of

1
10
100
Rb Ba Th U K Nb Ta La Ce Pr Pb Sr Nd P Zr SmEu Ti Gd Tb Dy Y Ho Er TmYb Lu
OIB avg.Mahabaleshwar avg.D81 (Pavagadh picrite)D97 (Pavagadh picrite)D44 (C. Saurashtra picrite)
3
10
100
Rb Ba Th K Nb La Ce Sr Nd P Zr Sm Eu Ti Gd Dy Y Er Yb Lu
Mahabaleshwar avg.Khandala Monk. Hill, KOP21Toranmal high-Nb-Ba Pavagadh basalt (D158)Pavagadh basalt (D79)
300
rock
/ pr
imiti
ve m
antle
rock
/ pr
imiti
ve m
antle
Ambenali avg.
a
b
Kachchh basanites
Fig. 9. (a) Primitive-mantle-normalized multielement patterns for Pavagadh picrites, compared to those of ocean island basalts (Sun and McDonough,1989), Kachchh basanites (Karmalkar et al., 2005), and the central Saurashtra picrite (D44, Melluso et al., 1995). Normalizing values are from Sun andMcDonough (1989). (b) Patterns for two of the Pavagadh basalts, compared to those of the high-Nb–Ba flows of Toranmal section (Mahoney et al., 2000)and some Deccan formation averages (courtesy J.J. Mahoney).
18 H.C. Sheth, L. Melluso / Journal of Asian Earth Sciences 32 (2008) 5–21
the Western Ghats formations or lavas on the basis of com-bined multielement and statistical methods (Mahoneyet al., 2000). Notably, published Nb values for basalts ofthe Western Ghats are all <30 ppm, the highest beingknown in the Mahabaleshwar Formation (Kolhapur Unit,Lightfoot et al., 1990). By comparison, basanites ofKachchh, northwest Deccan, contain 38–100 ppm Nband 418–1783 ppm Ba; these are, of course, alkalic andhighly silica-undersaturated rocks (SiO2 = 40.39–43.69%;Fig. 2). The picrites and the basanites could be the productsof somewhat different degrees of partial melting of similar‘‘enriched’’ mantle sources, located below western India inlate Cretaceous time (Melluso et al., 1995).
As also seen, the available geochemical and Sr-isotopicdata for the Pavagadh sequence are consistent with atwo-stage AFC process involving a picritic starting magmaand either of two granite contaminants. During AFC,residual liquids become progressively more contaminatedas they evolve by fractional crystallization, and suchmagma suites show a negative correlation between indicesof crustal contamination (such as 87Sr/86Sr) and of frac-tional crystallization (e.g., Mg Number). On the otherhand, the dramatically different mechanism of tempera-
ture-controlled assimilation (more primitive magmas expe-riencing systematically greater amounts of contaminationdue to being hotter) has been well known from the WesternGhats, particularly the Bushe and Poladpur Formationlavas (e.g., Devey and Cox, 1987; Lightfoot and Hawkes-worth, 1988; Mahoney, 1988). This is another line of evi-dence suggesting that the Pavagadh sequence should beviewed outside of the Western Ghats stratigraphicframework.
No Ar–Ar age data exist for the Pavagadh rocks, andthe only absolute ages in the literature are K–Ar ages of�66 Ma obtained by Kaneoka and Haramura (1973) ona basalt and ankaramite. The authors did not specify theirlocations or sampling heights, but noted on the basis oftheir hydrated nature of the samples (H2O+ � 2.2 wt%)that the K–Ar ages should be considered minimum ages.The Pavagadh lavas then probably belong to the earlyphases of Deccan Trap volcanicity. Even if future Ar–Arage data on Pavagadh rocks fall within the age bracketof eruption of the Western Ghats lavas (itself the matterof considerable debate, see e.g., Kaneoka, 1980; Courtillotet al., 1986; Wensink, 1987; Hofmann et al., 2000; Pande,2002), the differences in geochemistry and magnetic polar-

H.C. Sheth, L. Melluso / Journal of Asian Earth Sciences 32 (2008) 5–21 19
ity between the Pavagadh and the Western Ghats lavasconvincingly rule out any relationship between the two.The normally magnetized Pavagadh sequence is probablyolder than the Jawhar Formation, the oldest in the WesternGhats stratigraphy (Table 1). Feeder dykes for the Pava-gadh sequence should be sought, and these may outcropin the Rajpipla-Navagam region.
The trace element ratios, and rare earth element patternsshow at least three different magma types in the areabetween Pavagadh, Saurashtra to the northwest, and thecentral Deccan: (1) low-Zr/Y basalts (Zr/Y=2.9–5.3, aver-age 3.7 ± 2.0, 2r error) have slightly fractionated light-REE patterns, with flat heavy REE patterns, and abun-dances lower than 60X chondrite; (2) moderate-Zr/Y bas-alts (Zr/Y=3.9–5.7, average 4.7 ± 1.2, 2r), havemoderately fractionated REE patterns, with abundanceslower than 100X chondrite, and (3) high-Zr/Y basalts(Zr/Y=5.9–8.2, average 6.5 ± 1.6, 2r), with highly frac-tionated REE patterns. The mantle normalized diagramsalso show that the rocks with flat heavy REE patterns havenegative Nb peaks, whereas the high-Zr/Y basalts havepeaks at Nb. The Pavagadh basalts have some of the most‘‘enriched’’ trace element compositions among the variousbasalt types of the Deccan province.
The relatively high initial 87Sr/86Sr ratios (0.7064 and0.7083) of Pavagadh rhyolites indicate open-system pro-cesses, with a small chemical contribution from the conti-nental crust, and allow an evaluation of the role ofcrustal melting in the genesis of the silicic rocks of the Dec-can province as a whole. Whereas Lightfoot et al. (1987)argued that the rhyolites and trachytes of Bombay(Fig. 1), on the west coast, were products of fractional crys-tallization of basaltic magmas or partial melting of deep-seated basalt piles, Sheth and Ray (2002) developed anassimilation–fractional crystallization (AFC) model forthese rocks in terms of their Sr-concentrations and Sr-iso-topic compositions, using the same western Indian granitecontaminant as used here. Chatterjee and Bhattacharji(2001, 2004) have also argued for significant crustalinvolvement, based on geochemical criteria, in the genesisof the silicic rocks of eastern and southern Saurashtra.Overall, therefore, the genesis of silicic rocks in the Deccan,the Pavagadh rhyolites included, appears to have involvedat least some anatexis of the basement crust, and this maybe a necessary consequence of the heat conducted andadvected into the crust by large volumes of mafic magmaponded at the base of the crust and periodically passingthrough it (Cox, 1980).
9. Conclusions
Much of the �550-m thick exposed section on MountPavagadh, Deccan Traps, is made up of subalkalic basaltsrich in incompatible elements (especially Nb and Ba), andSr. Rhyolite-dacite flows and pyroclastic rocks also occurat the top of the sequence. The 87Sr/86Sr ratios and chem-ical characteristics of the Pavagadh rhyolites suggest a
small but significant involvement of the granitic basementcrust in their genesis. An assimilation-fractional crystalliza-tion (AFC) model involving the picrite lava and graniticcrustal contaminants explains the geochemical and Sr-iso-topic variation in the basalts and the rhyolites quite well.Systematic comparison of the lavas to the well-establishedlava stratigraphy of the Western Ghats, several hundredkilometers to the south, reveals that no chemical–geneticrelationship is possible between the two. A few sectionsclose to Pavagadh, such as Toranmal and Navagam, showa few to many flows with similar chemical characteristics,but no straightforward correlations are achievable betweenthe Pavagadh sequence and the sequences in the Toran-mal–Navagam–Barwani–Mhow region, especially if theirmagnetic polarities are also considered. The new geochem-ical data on the compositionally varied Pavagadh volcanicsuite are significant in understanding similarly diverse lavasequences elsewhere, the evolution of silicic lavas in floodbasalt provinces, as well as the regional stratigraphy ofthe Deccan Traps, where large individual areas seem tohave developed magmatic systems and lava piles with theirown distinctive chemical and/or isotopic signatures.
Acknowledgments
Surendra Pal Verma kindly provided the SINCLAS pro-gram, and John Mahoney, unpublished geochemical dataon various Deccan formations. Constructive, in-depth re-views by Ninad Bondre and Mike Widdowson and the edi-torial input from Bor-ming Jahn are gratefullyacknowledged.
References
Alexander, P.O., 1981. The Pavagarh rhyolite. J. Geol. Soc. Ind. 21, 453–457.
Arth, J.G., 1976. Behaviour of trace elements during magmatic processes –a summary of theoretical models and their applications. J. Res. U.S.Geol. Surv. 4, 41–47.
Beane, J.E., 1988. Flow Stratigraphy, Chemical Variation and Petrogen-esis of Deccan Flood Basalts from the Western Ghats, India. Ph.D.Dissertation, Washington State University, USA.
Beane, J.E., Hooper, P.R., 1988. A note on the picrite basalts of theWestern Ghats, Deccan Traps. In: Subbarao, K.V. (Ed.), DeccanFlood Basalts. Geol. Soc. Ind. Mem. 10, pp. 117–134.
Beane, J.E., Turner, C.A., Hooper, P.R., Subbarao, K.V., Walsh, J.N.,1986. Stratigraphy, composition and form of the Deccan basalts,Western Ghats, India. Bull. Volcanol. 48, 61–83.
Bellieni, G., Brotzu, P., Comin-Chiaramonti, P., Ernesto, M., Melfi, A.,Pacca, I.G., Piccirillo, E.M., 1984. Flood basalt to rhyolite suites in thesouthern Parana plateau (Brazil): Palaeomagnetism, petrogenesis, andgeodynamic implications. J. Petrol. 25, 579–618.
Betton, P.J., 1979. Isotopic evidence for crustal contamination in theKaroo rhyolites of Swaziland. Earth Planet. Sci. Lett. 45, 263–274.
Bilgrami, S.Z., 1999. A geological map of the eastern part of the DeccanTraps (Bidar-Nagpur). In: Subbarao, K.V. (Ed.), Deccan VolcanicProvince. Geol. Soc. Ind. Mem. 43(1), 219–232.
Bondre, N.R., Hart, W.K., Sheth, H.C., 2006. Geology and geochemistryof the Sangamner mafic dyke swarm, western Deccan volcanicprovince, India: implications for regional stratigraphy. J. Geol. 114,155–170.

20 H.C. Sheth, L. Melluso / Journal of Asian Earth Sciences 32 (2008) 5–21
Bowen, N.L., 1928. The Evolution of the Igneous Rocks. PrincetonUniversity Press, Princeton, New Jersey, pp. 334.
Chatterjee, A.C., 1961. Petrology of the lavas of Pavagad Hill, Gujarat. J.Geol. Soc. Ind. 2, 61–77.
Chatterjee, N., Bhattacharji, S., 2001. Origin of the felsic and basalticdykes and flows in the Rajula–Palitana–Sihor area of the DeccanTraps, Saurashtra, India: a geochemical and geochronological study.Int. Geol. Rev. 43, 1094–1116.
Chatterjee, N., Bhattacharji, S., 2004. A preliminary geochemical study ofzircons and monazites from Deccan felsic dykes, Rajula, Gujarat,India: implications for crustal melting. In: Sheth, H.C., Pande, K.(Eds.), Magmatism in India through Time. Proc. Ind. Acad. Sci.(Earth Planet. Sci.) vol. 113, pp. 533–542.
Comin-Chiaramonti, P., Cundari, A., Piccirillo, E.M., Gomes, C.B.,Castorina, F., Censi, P., De Min, A., Marzoli, A., Speziale, S.,Velazquez, V.F., 1997. Potassic and sodic igneous rocks from easternParaguay: their origin from the lithospheric mantle and geneticrelationships with the associated Parana flood tholeiites. J. Petrol. 38,495–528.
Courtillot, V., Besse, J., Vandamme, D., Montigny, R., Jaeger, J.-J.,Cappetta, H., 1986. Deccan flood basalts at the Cretaceous/Tertiaryboundary? Earth Planet. Sci. Lett. 80, 361–374.
Cox, K.G., 1980. A model for flood basalt vulcanism. J. Petrol. 21, 629–650.Cox, K.G., Hawkesworth, C.J., 1985. Geochemical stratigraphy of the
Deccan Traps at Mahabaleshwar, Western Ghats, India, with impli-cations for open system magmatic processes. J. Petrol. 26, 355–377.
DePaolo, D.J., 1981. Trace element and isotopic effects of combined wallrock assimilation and fractional crystallization. Earth Planet. Sci. Lett.53, 189–202.
Devey, C.W., Cox, K.G., 1987. Relationships between crustal contami-nation and crystallization in continental flood basalt magmas, withspecial reference to the Deccan Traps of the Western Ghats, India.Earth Planet. Sci. Lett. 84, 59–68.
Dhandapani, R., Subbarao, K.V., 1992. Magnetostratigraphy of theDeccan lavas, south of the Narmada River. Geol. Soc. Ind. Mem. 24,63–79.
Eugster, H.P., Wones, D.R., 1962. Stability relations of the ferruginousbiotite, annite. J. Petrol. 3, 82–125.
Floyd, P.A., Winchester, J.A., 1978. Identification and discrimination ofaltered and metamorphosed volcanic rocks using immobile elements.Chem. Geol. 21, 291–306.
Furuyama, K., Hari, K.R., Santosh, M., 2001. Crystallization history ofprimitive Deccan basalt from Pavagadh hill, Gujarat, western India.Gond. Res. 3, 427–436.
Garland, F.E., Hawkesworth, C.J., Mantovani, M.S.M., 1995. Descrip-tion and petrogenesis of the Parana rhyolites. J. Petrol. 36, 1193–1227.
Gopalan, K., Trivedi, J.R., Merh, S.S., Patel, P.P., Patel, S.G., 1979. Rb–Sr age of Godhra and related granites, Gujarat, India. Proc. Ind. Acad.Sci. (Earth Planet. Sci.) 4, 7–17.
Govindaraju, K., 1989. Compilation of working values and sampledescriptions for 272 geostandards. Geostand. Newslett. 13, 1–113.
Greenough, J.D., Hari, K.R., Chatterjee, A.C., Santosh, M., 1998. Mildlyalkaline basalts from Pavagadh hill, India: Deccan flood basalts withan asthenospheric origin. Mineral Petrol 62, 223–245.
Hari, K.R., Santosh, M., Chatterjee, A.C., 1991. Primary silicate-meltinclusions in olivine phenocrysts from the Pavagad igneous suite,Gujarat. J. Geol. Soc. Ind. 37, 343–350.
Hari, K.R., Santosh, M., Furuyama, K., 2000. Melt inclusions inpyroxene and plagioclase phenocrysts from Pavagarh igneous suite,Gujarat, India. J. Geosci. Osaka City Univ. 43, 135–148.
Hofmann, C., Feraud, G., Courtillot, V., 2000. 40Ar/39Ar dating ofmineral separates and whole rocks from the Western Ghats lava pile:further constraints on duration and age of the Deccan Traps. EarthPlanet. Sci. Lett. 180, 13–27.
Irvine, T.N., Baragar, W.R.A., 1971. A guide to the chemical classificationof the common rocks. Can. J. Earth Sci. 8, 523–548.
Kaneoka, I., 1980. 40Ar/39Ar dating on volcanic rocks of the DeccanTraps, India. Earth Planet. Sci. Lett. 46, 233–243.
Kaneoka, I., Haramura, H., 1973. K/Ar ages of successive lava flows fromthe Deccan Traps, India. Earth Planet. Sci. Lett. 18, 229–236.
Karmalkar, N.R., Rege, S., Griffin, W.L., O’Reilly, S.Y., 2005. Alkalinemagmatism from Kutch, NW India: implications for plume–litho-sphere interaction. Lithos 81, 101–119.
Krishnamurthy, P., Cox, K.G., 1977. Picrite basalts and related lavas fromthe Deccan Traps of Western India. Contrib. Mineral. Petrol. 62, 53–75.
Krishnamurthy, P., Cox, K.G., 1980. A potassium-rich alkalic suite fromthe Deccan Traps, Rajpipla, India. Contrib. Mineral. Petrol. 73, 179–189.
Krishnamurthy, P., Gopalan, K., Macdougall, J.D., 2000. Olivinecompositions in picrite basalts and the Deccan volcanic cycle. J.Petrol. 41, 1057–1069.
Le Bas, M.J., 2000. IUGS reclassification of the high-Mg and picriticvolcanic rocks. J. Petrol. 41, 1467–1470.
Le Bas, M.J., LeMaitre, R.W., Streckeisen, A., Zanettin, P., 1986. Achemical classification of volcanic rocks based on the total alkali–silicadiagram. J. Petrol. 27, 745–750.
LePage, L.D., 2003. ILMAT: an Excel worksheet for ilmenite–magnetitegeothermometry and geobarometry. Comput. Geosci. 29, 673–678.
Lightfoot, P.C., Hawkesworth, C.J., Sethna, S.F., 1987. Petrogenesis ofrhyolites and trachytes from the Deccan Trap: Sr, Nd, and Pb isotopeand trace element evidence. Contrib. Mineral. Petrol. 95, 44–54.
Lightfoot, P.C., Hawkesworth, C.J., 1988. Origin of Deccan Trap lavas:evidence from combined trace element and Sr-, Nd- and Pb-isotopestudies. Earth Planet. Sci. Lett. 91, 89–104.
Lightfoot, P.C., Hawkesworth, C.J., Devey, C.W., Rogers, N.W., vanCalsteren, P.W.C., 1990. Source and differentiation of Deccan Traplavas: implications of geochemical and mineral chemical variations. J.Petrol. 31, 1165–1200.
Macdougall, J.D. (Ed.), 1988. Continental Flood Basalts. KluwerAcademic Publisher, Dordrecht, p. 341.
Mahoney, J.J., 1988. Deccan Traps. In: Macdougall, J.D. (Ed.), Conti-nental Flood Basalts. Kluwer Academic Publisher, Dordrecht, pp.151–194.
Mahoney, J.J., Coffin, M.F. (Eds.), 2007. Large Igneous Provinces:continental, Oceanic, and Planetary Flood Volcanism. Am. Geophys.Union Geophys. Monogr., vol. 100, pp. 438.
Mahoney, J.J., Macdougall, J.D., Lugmair, G.W., Gopalan, K., Krish-namurthy, P., 1985. Origin of contemporaneous tholeiitic and K-richalkalic lavas: a case study from the northern Deccan plateau, India.Earth Planet. Sci. Lett. 72, 39–53.
Mahoney, J.J., Sheth, H.C., Chandrasekharam, D., Peng, Z.X., 2000.Geochemistry of flood basalts of the Toranmal section, northernDeccan Traps, India: implications for regional Deccan stratigraphy. J.Petrol. 41, 1099–1120.
Marsh, J.S., Hooper. P.R., Rehacek, J., Duncan, R.A., Duncan, A.R.,1997. Stratigraphy and age of Karoo basalts of Lesotho andimplications for correlations within the Karoo igneous province. In:Mahoney, J.J., Coffin, M.F. (Eds.), Large Igneous Provinces: conti-nental, Oceanic, and Planetary Flood Volcanism. Am. Geophys.Union Geophys. Monogr., vol. 100, pp. 247–272.
Melluso, L., Beccaluva, L., Brotzu, P., Gregnanin, A., Gupta, A.K.,Morbidelli, L., Traversa, G., 1995. Constraints on the mantle sourcesof the Deccan Traps from the petrology and geochemistry of thebasalts of Gujarat State (Western India). J. Petrol. 36, 1393–1432.
Melluso, L., Barbieri, M., Beccaluva, L., 2004. Chemical evolution,petrogenesis, and regional chemical correlations of the flood basaltsequence in the central Deccan Traps, India. In: Pande, K., Sheth,H.C. (Eds.), Magmatism in India through Time. Proc. Indian Acad.Sci. (Earth Planet Sci.), vol. 113, pp. 587–603.
Melluso, L., Morra, V., Brotzu, P., Tommasini, S., Renna, M.R., Duncan,R.A., Franciosi, L., d’Amelio, F., 2005. Geochronology and petro-genesis of the Cretaceous Antampombato–Ambatovy complex andassociated dyke swarm, Madagascar. J. Petrol. 46, 1963–1996.
Melluso, L., Mahoney, J.J., Dallai, L., 2006. Mantle sources and crustalinput in Mg-rich Deccan Trap basalts from Gujarat (India). Lithos 89,259–274.

H.C. Sheth, L. Melluso / Journal of Asian Earth Sciences 32 (2008) 5–21 21
Middlemost, E.A.K., 1989. Iron oxidation ratios, norms and the classi-fication of volcanic rocks. Chem. Geol. 77, 19–26.
Miller, J.A., Harris, C., 2007. Petrogenesis of the Swaziland and NorthernNatal rhyolites of the Lebombo rifted volcanic margin, SoutheastAfrica. J. Petrol. 48, 185–218.
Mitchell, C.H., Widdowson, M., 1991. A geological map of the southernDeccan Traps, India and its structural implications. J. Geol. Soc.Lond. 148, 495–505.
Pande, K., 2002. Age and duration of the Deccan Traps, India: a review ofradiometric and palaeomagnetic constraints. Proc. Ind. Acad. Sci.(Earth Planet. Sci.) 111, 115–123.
Peate, D.W., 1997. The Parana-Etendeka province. In: Mahoney, J.J.,Coffin, M.F. (Eds.), Large Igneous Provinces: continental, Oceanic,and Planetary Flood Volcanism. Am. Geophys. Union Geophys.Monogr., vol. 100, pp. 217–245.
Peng, Z.X., Mahoney, J.J., 1995. Drillhole lavas in the Deccan Traps andthe evolution of the Reunion hotspot mantle. Earth Planet. Sci. Lett.134, 169–185.
Peng, Z.X., Mahoney, J.J., Hooper, P.R., Harris, C., Beane, J.E., 1994. Arole for lower continental crust in flood basalt genesis? Isotopic andincompatible element study of the lower six formations of the westernDeccan Traps. Geochim. Cosmochim. Acta 58, 267–288.
Peng, Z.X., Mahoney, J.J., Hooper, P.R., Macdougall, J.D., Krishna-murthy, P., 1998. Basalts of the northeastern Deccan Traps, India:isotopic and elemental geochemistry and relation to southwesternDeccan stratigraphy. J. Geophys. Res. 103, 29843–29865.
Peucat, J.J., Vidal, P., Bernard-Griffiths, J., Condie, K.C., 1989. Sr, Ndand Pb isotopic systematics in the Archaean low- to high-gradetransition zone of southern India: Syn-accretion vs. post-accretiongranulites. J. Geol. 97, 537–550.
Ray, R., Sheth, H.C., Mallik, J., 2007. Structure and emplacement ofthe Nandurbar-Dhule mafic dyke swarm, Deccan Traps, and thetectonomagmatic evolution of flood basalts. Bull. Volcanol. 69,531–537.
Rollinson, H.R., 1993. Using Geochemical Data: Evaluation, Presenta-tion, Interpretation. Longman, Harlow, UK ( pp. 352).
Sethna, S.F., Czygan, W., Sethna, B.S., 1987. Iron-titanium oxidegeothermometry for some Deccan Trap tholeiitic basalts, India. J.Geol. Soc. Ind. 29, 483–488.
Sheth, H.C., 2005. Were the Deccan flood basalts derived in part fromancient oceanic crust within the Indian continental lithosphere? Gond.Res. 8, 109–127.
Sheth, H.C., 2006. The emplacement of pahoehoe lavas on Kilauea and inthe Deccan Traps. J. Earth Syst. Sci. 115, 615–629.
Sheth, H.C., Ray, J.S., 2002. Rb/Sr-87Sr/86Sr variations in Bombaytrachytes and rhyolites (Deccan Traps): Rb–Sr isochron, or AFCprocess? Int. Geol. Rev. 44, 624–638.
Sheth, H.C., Torres-Alvarado, I.S., Verma, S.P., 2002. What is the ‘‘calc-alkaline rock series’’? Int. Geol. Rev. 44, 686–701.
Sheth, H.C., Mahoney, J.J., Chandrasekharam, D., 2004a. Geochemicalstratigraphy of flood basalts of the Bijasan Ghat section, SatpuraRange, India. J. Asian Earth Sci. 23, 127–139.
Sheth, H.C., Mathew, G., Pande, K., Mallik, S., Jena, B., 2004b. Conesand craters on Mount Pavagadh, Deccan Traps: rootless cones?. In:Sheth, H.C., Pande, K. (Eds.), Magmatism in India through Time.Proc. Ind. Acad. Sci. (Earth Planet Sci.), vol. 113, pp. 831–838.
Shukla, A.D., Bhandari, N., Kusumgar, S., Shukla, P.N., Ghevariya,Z.G., Gopalan, K., Balaram, V., 2001. Geochemistry and magnetos-tratigraphy of Deccan flows at Anjar, Kutch. Proc. Ind. Acad. Sci.(Earth Planet. Sci.) 110, 111–132.
Sreenivasa Rao, M., Reddy, N.R., Subbarao, K.V., Prasad, C.V.R.K.,Radhakrishnamurty, C., 1985. Chemical and magnetic stratigraphy ofparts of Narmada region, Deccan basalt province. J. Geol. Soc. Ind.26, 617–639.
Stormer Jr., J.C., Nicholls, J., 1978. XLFRAC: a program for interactivetesting of magmatic differentiation models. Comput. Geosci. 4, 143–159.
Subbarao, K.V., Hooper, P.R. (Compilers), 1988. Reconnaissance map ofthe Deccan Basalt Group in the Western Ghats, India. In: Subbarao,K.V. (Ed.), Deccan Flood Basalts. Geol. Soc. Ind. Mem., vol. 10,(enclosure).
Sun, S.-s., McDonough, W.F., 1989. Chemical and isotopic systematics ofoceanic basalts: implications for mantle composition and processes. In:Saunders, A.D., Norry, M.J. (Eds.), Magmatism in the Ocean Basins.Geol. Soc. Spec. Publ., vol. 42, pp. 313–345.
Vanderkluysen, L., Mahoney, J.J., Hooper, P.R., Sheth, H.C., Ray, R.,2006. Location and geometry of the Deccan Traps feeder systeminferred from dyke geochemistry. Eos Trans. AGU, 87(52), Fall Meet.Suppl., Abstract V13B-0681.
Verma, R.K., Mittal, G.S., 1974. Palaeomagnetic study of a verticalsequence of Traps from Mount Pavagarh, Gujarat, India. Phys. EarthPlanet. Inter. 8, 63–74.
Verma, S.P., Torres-Alvarado, I.S., Sotelo-Rodriguez, Z.T., 2002. SIN-CLAS: standard igneous norm and volcanic rock classification system.Comput. Geosci. 28, 711–715.
Watson, E.B., Green, T.H., 1981. Apatite/liquid partition coefficients for therare earth elements and strontium. Earth Planet. Sci. Lett. 56, 405–421.
Wensink, H., 1987. Comments on ‘‘Deccan flood basalts at theCretaceous/Tertiary boundary?’’ by V. Courtillot et al. Earth Planet.Sci. Lett. 85, 326–328.
West, W.D., 1958. The petrography and petrogenesis of forty-eight flowsof Deccan Trap penetrated by borings in western India. Trans. Nat.Inst. Sci. 4, 1–56.
Widdowson, M., Cox, K.G., 1996. Uplift and erosional history of theDeccan Traps, India: evidence from laterites and drainage patterns of theWestern Ghats and Konkan coast. Earth Planet. Sci. Lett. 137, 57–69.
Widdowson, M., Pringle, M.S., Fernandez, O.A., 2000. A post K-TBoundary (Early Palaeocene) age for Deccan-type feeder dykes, Goa,India. J. Petrol. 41, 1177–1194.

1
Sheth & Melluso 2008: Additional data tables not in the published paper Table. Selected feldspar analyses from the Pavagadh volcanic suite feldspars SiO2 Al2O3 FeO CaO Na2O K2O Sum An% Or% Ab% D81 C 51.96 30.03 0.69 12.65 3.98 0.33 99.6 62.5 1.9 35.6 D81 Int 65.09 19.88 0.32 1.16 5.60 7.91 100.0 5.6 45.5 48.9 D81 C 49.11 32.02 0.58 14.94 2.81 0.21 99.7 73.7 1.2 25.1 D81 R 49.90 31.37 0.61 14.24 3.19 0.22 99.5 70.2 1.3 28.5 D81 Gm 55.57 27.78 0.46 9.69 5.67 0.59 99.8 46.9 3.4 49.7 D97 Int 50.07 31.12 1.03 13.93 3.33 0.30 99.8 68.6 1.8 29.7 D97 Int 55.13 26.72 0.86 9.18 4.65 3.46 100.0 42.3 19.0 38.8 D97 Int 56.29 26.64 0.92 8.84 5.96 1.07 99.7 42.3 6.1 51.6 D97 Int 53.66 28.68 1.03 11.16 4.79 0.47 99.8 54.7 2.7 42.5 D97 C 51.26 30.64 0.64 13.38 3.63 0.33 99.9 65.8 1.9 32.3 D97 R 58.38 25.00 0.72 7.00 6.35 2.09 99.5 33.4 11.9 54.8 D97 Int 54.90 27.53 1.43 9.93 5.39 0.50 99.7 49.0 2.9 48.1 D97 Int 51.23 30.67 0.65 13.38 3.65 0.30 99.9 65.8 1.8 32.5 D79 Mic 52.30 29.91 0.70 12.58 4.06 0.33 99.9 61.9 1.9 36.2 D79 Mic 49.59 31.21 1.13 14.11 3.28 0.24 99.6 69.4 1.4 29.2 D79 Mic 63.85 20.86 0.32 2.35 6.11 6.05 99.5 11.4 35.0 53.6 D79 Mic 51.75 29.90 0.86 12.66 3.96 0.34 99.5 62.6 2.0 35.4 D79 Mic 53.97 28.71 0.88 10.99 5.07 0.25 99.9 53.7 1.5 44.8 D79 Mic 57.62 26.04 0.56 8.06 6.28 0.98 99.5 39.1 5.7 55.2 D79 Mic 64.94 19.81 0.29 1.23 4.79 8.95 100.0 6.0 51.8 42.2 D79 Mic 63.00 21.63 0.48 3.06 6.09 5.57 99.8 14.8 32.0 53.2 D79 Mic 64.92 19.72 0.41 1.29 5.01 8.64 100.0 6.2 49.8 43.9 D89 C 59.08 25.35 0.33 7.07 6.87 1.08 99.8 34.0 6.2 59.8 D89 M 58.45 25.80 0.37 7.69 6.58 1.01 99.9 37.0 5.8 57.2 D89 R 59.63 25.00 0.39 6.67 7.06 1.17 99.9 32.0 6.7 61.3 D89 Mic 59.17 25.11 0.39 6.64 6.91 1.36 99.6 32.0 7.8 60.2 D89 C 57.71 26.48 0.34 8.38 6.32 0.79 100.0 40.4 4.5 55.1 D89 C 59.20 25.30 0.33 6.92 6.98 1.14 99.9 33.1 6.5 60.4 D89 C 60.48 24.45 0.33 5.94 7.29 1.52 100.0 28.4 8.6 63.0 D89 C 59.39 25.10 0.37 7.11 6.90 1.05 99.9 34.1 6.0 59.9 D89 C 59.13 25.44 0.35 7.25 6.81 0.98 100.0 35.0 5.6 59.4 D89 C 57.85 26.29 0.40 8.29 6.30 0.79 99.9 40.2 4.6 55.3 D89 R 64.03 21.13 0.55 2.49 7.21 4.17 99.6 12.1 24.2 63.6
Note: C = core of phenocryst; R = rim of phenocryst; Int = interstitial; Gm = groundmass; Mic = microlite. Table. Selected olivine analyses from the Pavagadh volcanic suite Olivines SiO2 FeO MnO MgO CaO Sum Fo% Fa% D97 C 38.60 22.57 0.32 38.59 0.36 100.4 75.3 24.7 D97 R 37.23 27.61 0.48 33.95 0.33 99.6 68.7 31.3 D97 C 40.50 11.48 0.19 47.30 0.37 99.8 88.0 12.0 D97 R 37.81 25.41 0.48 36.00 0.33 100.0 71.6 28.4 D97 C 39.91 12.95 0.18 46.29 0.35 99.7 86.4 13.6 D81 C 38.98 17.56 0.26 42.04 0.38 99.2 81.0 19.0 D81 R 39.30 17.16 0.28 42.72 0.38 99.8 81.6 18.4 D81 C 39.90 14.16 0.2 45.21 0.34 99.8 85.1 14.9 D79 C 35.40 38.16 0.49 25.6 0.29 99.9 54.5 45.5 D79 Mic 34.65 40.26 0.64 23.35 0.23 99.1 50.8 49.2 D79 C 35.52 36.88 0.58 26.3 0.31 99.6 56.0 44.0 D79 R 35.59 38.08 0.62 25.87 0.24 100.4 54.8 45.2 D79 Mic 35.10 38.84 0.53 24.82 0.21 99.5 53.2 46.8 D79 Mic 34.56 41.96 0.73 22.21 0.26 99.7 48.5 51.5 D79 Mic 36.01 34.43 0.48 28.47 0.36 99.8 59.6 40.4 D79 Mic 35.11 39.58 0.75 24.27 0.26 100.0 52.2 47.8 D79 R 34.50 41.24 0.67 22.59 0.23 99.2 49.4 50.6 D79 Mic 34.76 41.42 0.69 22.89 0.18 99.9 49.6 50.4 D79 C 36.26 32.62 0.55 29.94 0.34 99.7 62.1 37.9 D79 R 36.23 34.49 0.58 27.88 0.39 99.6 59.0 41.0 D79 C 35.66 37.97 0.62 25.38 0.28 99.9 54.4 45.6 D89 C 32.46 54.59 1.71 11.75 0.29 100.8 27.7 72.3 D89 R 32.33 54.88 1.81 11.34 0.31 100.7 26.9 73.1 D89 R 32.16 54.81 1.85 11.12 0.32 100.3 26.6 73.4 D89 C 32.00 53.81 1.72 11.57 0.28 99.4 27.7 72.3 D89 R 32.14 54.36 1.79 11.38 0.33 100.0 27.2 72.8

2
Table. Selected pyroxene analyses from the Pavagadh volcanic suite pyroxenes SiO2 TiO2 Al2O3 FeO MnO MgO CaO Na2O Cr2O3 Sum Ca% Fe*% Mg% Mg#D81 C 49.96 1.01 3.64 5.37 0.13 15.96 22.38 0.18 0.53 99.16 45.8 8.8 45.4 83.8D81 R 50.45 1.55 1.99 10.83 0.34 13.31 21.02 0.30 99.79 43.6 18.0 38.4 68.0D81 Int 49.04 2.40 3.79 9.76 0.26 12.65 21.28 0.37 99.55 45.6 16.7 37.7 69.2D81 Int 48.24 2.23 2.66 15.80 0.39 8.55 20.84 0.72 99.43 45.9 27.8 26.2 48.5D81 Int 48.55 2.27 2.59 15.61 0.39 8.64 20.72 0.76 99.53 45.8 27.5 26.6 49.0D81 C 50.26 1.29 3.03 7.23 0.16 15.06 21.89 0.24 0.13 99.29 45.0 11.8 43.1 78.4D81 R 51.39 1.24 2.94 6.88 0.17 15.06 21.92 0.21 0.10 99.91 45.3 11.4 43.3 79.2D81 M 50.07 1.08 3.70 5.63 0.13 15.65 22.07 0.25 0.66 99.24 45.7 9.3 45.0 82.9D81 R 50.47 1.55 1.99 10.83 0.34 13.31 21.03 0.30 99.82 43.6 18.0 38.4 68.0D81 R 48.69 1.82 3.88 9.51 0.20 14.06 20.93 0.26 0.09 99.44 43.5 15.7 40.7 72.1D82 Mic 49.94 1.43 3.57 6.49 0.14 15.11 22.10 0.26 0.44 99.48 45.8 10.7 43.5 80.2D82 C 50.56 1.33 3.44 6.02 0.13 15.69 21.94 0.19 0.17 99.47 45.2 9.9 44.9 82.0D82 R 45.69 2.94 7.21 8.06 0.17 12.89 21.59 0.35 0.34 99.24 47.0 14.0 39.0 73.6D82 Gm 50.41 1.49 3.46 7.11 0.15 15.40 21.36 0.16 0.29 99.83 44.1 11.7 44.2 79.1D82 Gm 47.86 2.41 5.26 7.86 0.17 13.76 21.61 0.23 0.26 99.42 46.0 13.3 40.7 75.3D97 C 52.46 0.65 2.31 4.27 0.11 16.45 22.42 0.23 1.01 99.91 46.0 7.0 47.0 87.0D97 R 51.04 1.29 2.50 7.94 0.19 15.11 20.91 0.23 0.24 99.45 43.3 13.1 43.5 76.8D97 R 51.84 1.04 2.65 6.36 0.16 15.88 21.29 0.23 0.43 99.88 43.9 10.5 45.6 81.3D97 C 50.87 1.24 3.35 7.06 0.17 15.23 21.02 0.27 0.44 99.65 43.9 11.8 44.3 79.0D97 R 50.22 1.91 3.18 8.82 0.21 14.26 20.89 0.28 99.77 43.7 14.7 41.5 73.8D97 Int 48.13 3.03 4.02 10.57 0.31 13.01 20.04 0.37 99.48 43.0 18.2 38.8 68.1D97 Int 50.94 1.61 2.51 10.34 0.29 14.76 19.21 0.23 99.89 40.0 17.2 42.7 71.2D97 Int 51.41 1.23 1.71 9.49 0.32 14.57 20.48 0.26 99.47 42.3 15.8 41.9 72.6D79 C 51.37 1.51 1.86 9.32 0.26 14.84 20.25 0.32 99.73 41.9 15.4 42.7 73.4D79 C 48.52 2.65 3.90 8.98 0.17 14.08 20.93 0.38 99.61 43.9 15.0 41.1 73.3D79 R 48.53 2.31 3.59 10.41 0.25 13.54 20.40 0.42 99.45 42.9 17.5 39.6 69.4D79 R 48.20 2.64 4.03 9.66 0.14 13.40 20.86 0.41 99.34 44.2 16.2 39.5 70.9D79 R 47.43 2.55 4.04 10.48 0.19 13.43 19.99 0.41 98.52 42.5 17.7 39.7 69.2D79 R 48.08 2.38 3.98 10.03 0.21 13.60 20.56 0.40 99.24 43.3 16.8 39.9 70.3D79 C 50.83 1.54 1.94 9.17 0.19 14.47 21.27 0.29 99.70 43.7 15.0 41.3 73.4D79 C 47.71 2.52 4.24 9.37 0.13 13.39 21.38 0.40 0.02 99.16 45.1 15.6 39.3 71.5D79 Mic 49.96 1.48 2.12 12.56 0.19 12.87 19.75 0.51 99.44 41.5 20.8 37.6 64.3D79 Mic 48.49 2.17 3.55 9.75 0.15 13.48 21.19 0.39 99.17 44.4 16.2 39.3 70.8D79 Mic 48.17 2.45 3.99 9.70 0.14 13.50 21.16 0.37 99.48 44.4 16.1 39.4 71.0D89 C 50.41 0.48 1.02 18.64 0.81 10.74 17.57 0.19 99.86 36.8 31.7 31.3 49.6D89 C 50.08 0.48 0.92 18.46 0.82 10.69 17.85 0.18 99.48 37.4 31.4 31.1 49.7D89 R 51.39 0.35 0.93 18.93 0.93 9.50 17.18 0.59 99.80 37.4 33.6 28.8 46.0D89 C 50.23 0.36 0.53 31.77 1.23 12.05 4.13 0.34 100.64 8.9 54.8 35.9 39.4D89 C 50.29 0.40 0.93 19.56 0.78 10.49 16.96 0.25 99.66 35.8 33.3 30.8 47.9D89 C 50.06 0.48 0.88 19.29 0.69 10.23 17.54 0.24 99.41 37.0 32.8 30.0 47.7D89 R 49.76 0.47 0.97 20.17 0.78 10.11 16.60 0.27 99.13 35.3 34.6 29.9 46.2D89 C 49.94 0.37 1.02 20.31 0.81 10.30 16.48 0.21 99.44 34.8 34.7 30.3 46.5D89 R 50.33 0.35 0.83 19.94 0.82 10.18 17.06 0.23 99.74 36.0 34.0 29.9 46.6D89 C 50.41 0.33 0.98 19.42 0.83 9.90 17.32 0.24 99.43 36.9 33.6 29.4 46.6D89 R 50.41 0.45 0.85 19.40 0.34 10.01 17.94 0.22 99.62 37.9 32.5 29.5 47.5D89 Gm 51.07 0.41 0.85 19.93 0.90 10.40 16.73 0.24 100.53 35.2 34.1 30.5 47.1D89 Gm 51.20 0.34 0.81 20.10 0.81 9.52 15.72 0.54 99.04 34.7 35.9 29.2 44.8
Table. Selected biotite analyses from the Pavagadh volcanic suite Biotites SiO2 TiO2 Al2O3 FeO MnO MgO CaO Na2O K2O Sum D79 Pec 41.50 4.36 11.80 9.01 0.09 20.79 0.85 9.67 98.10 D79 Pec 42.92 4.22 12.01 8.86 0.01 20.92 0.80 10.10 99.80

3
Table. Selected magnetite, ilmenite, and chrome-spinel analyses from the Pavagadh volcanic suite Magnetites TiO2 Al2O3 FeO MnO MgO Cr2O3 Sum Ulv Fe'' Fe''' Ti D79 Int 21.39 2.22 72.30 1.19 0.98 98.10 0.591 53.3 25.6 21.0 D79 Int 24.49 2.29 69.76 1.22 1.05 98.80 0.673 56.2 19.8 24.0 D89 Int 25.74 1.40 71.78 0.79 1.01 100.70 0.698 56.6 19.0 24.4 D89 Int 24.75 1.64 72.49 0.92 0.87 100.70 0.671 55.9 20.6 23.5 D89 Int 22.58 1.34 74.47 1.01 0.74 100.10 0.615 53.8 24.8 21.4 Ilmenites TiO2 Al2O3 FeO MnO MgO Cr2O3 Sum ilm D79 Int 49.76 0.19 46.27 0.64 3.56 100.40 0.911 D79 Int 49.44 0.15 46.89 0.64 3.31 100.40 0.906 D79 Int 49.17 0.04 45.40 0.49 3.48 98.60 0.918 D79 Int 48.46 0.12 46.29 0.49 3.01 98.40 0.909 D97 Int 48.15 47.11 0.62 2.85 98.70 0.901 D97 Int 49.60 46.52 0.57 2.83 99.50 0.922 Cr-spinels TiO2 Al2O3 FeO MnO MgO Cr2O3 Sum D82 in ol 9.88 10.66 52.67 0.44 7.45 19.08 100.20 66.7 25.0 D82 in ol 4.93 15.45 43.91 0.43 8.00 28.66 101.40 52.7 36.3 D82 in ol 11.69 5.17 53.10 0.66 5.09 25.98 101.70 72.1 35.0 D97 in ol 1.54 11.27 33.95 0.43 5.55 46.61 99.40 46.1 62.6 D97 in ol 3.83 7.92 42.72 0.49 4.90 38.40 98.30 57.3 52.9
Table. Results of discriminant function analysis for the mafic lavas of Pavagadh
RUN 1 RUN 2 Sample Location Best
match p M-
dist Fn 1 Fn 2 Best
match p M-
dist Fn 1 Fn 2
D92 705 m Mah 0.000 241 10.618 -2.220 Mah 0.000 165 8.059 2.340 D93 685 m Mah 0.000 103 9.126 -2.379 Mah 0.000 136 8.066 2.676 D94 665 m Mah 0.000 231 11.787 -1.893 Mah 0.000 137 8.014 2.483 D95 645 m Mah 0.000 384 1.004 -9.038 Mah 0.000 314 12.309 0.012 D96 580 m Mah 0.000 112 3.822 -6.250 Mah 0.000 96 8.882 -0.132 D97 565 m Mah 0.000 116 10.156 1.672 Mah 0.000 86 4.139 3.177 D98 480 m Mah 0.000 126 5.366 -5.247 Mah 0.000 184 8.846 0.465
D157 390 m - - - - - - - - - - D158 390 m Mah 0.000 224 -0.299 -5.189 Mah 0.000 105 8.604 2.929 D159 355 m Mah 0.000 181 -0.379 -6.836 Mah 0.000 113 9.411 0.984 D160 325 m Mah 0.000 175 9.480 -0.205 Mah 0.000 151 3.171 0.562
D79 NWP Mah 0.000 124 7.885 0.427 Mah 0.000 133 5.319 3.488 D81 NWP Neral 0.000 96 8.769 1.305 Mah 0.000 75 3.411 2.476 D80 NWP Mah 0.000 314 5.171 -10.150 Mah 0.000 416 10.121 -4.853 D85 NP Mah 0.000 625 5.506 -10.235 Mah 0.000 674 10.391 -5.334 D84 NP Mah 0.000 609 2.665 -13.045 Mah 0.000 524 16.110 -2.008 D82 NP - - - - - - - - - - D83 NP Mah 0.000 181 8.048 -6.922 Mah 0.000 226 11.410 -0.196
Notes: p = probability; M-dist = Mahalanobis distance; Mah = Mahabaleshwar Formation. Discriminant function analysis was carried out twice, with the following variables: RUN 1: SiO2, Al2O3, Fe2O3, FeO, CaO, MgO, K2O, P2O5, Ni, V, Ba, Rb, Sr, Zr, Y, Nb; RUN 2: Ni, V, Ba, Rb, Sr, Zr, Y, Nb. No results were obtained for D157 and D82 because data are not available for some of these elements.