the morro do ferro thorium and rare-earth ore deposit ... · the morro do ferro thorium and...
TRANSCRIPT

The Morro do Ferro Thorium and Rare-Earth Ore Deposit, Pocos de Caldas District, Brazil
GEOLOGICAL SURVEY BULLETIN 1185-D
Prepared on behalf of the U. S. Atomic Energy Commission in cooperation with the Commissao Nacional de Energia Nuclear, Brazil


The Morro do Ferro Thorium and Rare-Earth Ore Deposit, Po9os de Caldas District, BrazilBy HELMUTH WEDOW, JR.
URANIUM INVESTIGATIONS IN BRAZIL
GEOLOGICAL SURVEY BULLETIN 1185-D
Prepared on behalf of the U.S. Atomic Energy Commission in cooperation with the Commissao Nacional de Energia Nuclear, Brazil
UNITED STATES GOVERNMENT PRINTING OFFICE, WASHINGTON : 1967

UNITED STATES DEPARTMENT OF THE INTERIOR
STEWART L. UDALL, Secretary
GEOLOGICAL SURVEY
William T. Pecora, Director
For sale by the Superintendent of Documents, U.S. Government Printing Office Washington, D.C. 20402 - Price 20 cents (paper cover)

CONTENTS
Abstract_________________________________________________________ DlIntroduction. _______________ ______________________________________ 2Geographic and geologic setting____________________________________ 3The thorium and rare-earth deposit________________________________ 7
Lithology_________________________________________________ 7Structure..--______________________________________________ 8Exploration_ __________ _ _______________________ _ ___________ 9Sampling and analyses.-______________________________________ 10
Radioactivity analyses____________________________________ 11Trench samples_____________________________________ 11Bulk sample for beneficiation tests_____________________ 16Test-pit samples___________________________________ 17Gamma-ray logging of drill holes________________________ 18Adit samples______________________________________ 18
Chemical analyses_________-__-________-____-______________ 21Thoria________________________________ 23Total rare-earth oxides_________________________________ 23Uranium._________________________ _ _________________ 23
Semiquantitative spectrographic analyses-____________________ 24Thorium and rare-earth minerals________________________________ 24Relation of rare-earth elements to thorium______________________ 26Grade and size of the deposit___________________________________ 29Beneficiation tests_________________________________________ 30
Economic outlook.____________________________________________ ._ 33References_____________________________________________________ 34
ILLUSTRATIONS
Page FIGURE 1. Index map showing the location of the Po§os de Caldas district. D3
2. Sketch map of the Po§os de Caldas district, showing principal airborne radioactivity anomalies and the location of Morro do Ferro____________________________________________ 4
3. Topographic and geologic sketch map of Morro do Ferro thorium and rare-earth ore deposit, showing the location of trenches, test pits, and selected DNPM drill holes.________ 6
4. Scatter diagram of paired total rare-earth oxide and equiv alent thoria analyses of selected samples from Morro do Ferro___________________________ 27
in

IV CONTENTS
TABLES
TABLE 1. Radioactivity data and lengths of samples taken from trenches. Dll2. Equivalent thoria analyses of composite samples and related
data of trench samples-__-_-____-____--__--_-__--_---_- 173. Data on samples from test pits____________-___--___-_-__-_ 194. Results of gamma-ray logging of selected drill holes__________ 205. Data on samples taken from the Cia. Geral de Minas adit at
1,450 meters____________________________________ 216. Chemical and radioactivity analyses and related data of se
lected samples_______________________--____-_-_______- 227. Comparison of analyses of five selected composite group samples. 248. Semiquantitative spectrographic analyses of five samples_____ 259. Selected statistics of TREO : eTh02 ratios (from data in table
6) ___________________________________________________ 2810. Equivalent thoria content of selected size, specific gravity, and
magnetic fractions of 11 samples_______-___---__-_-_____ 32

URANIUM INVESTIGATIONS IN BRAZIL
THE MORRO DO FERRO THORIUM AND RARE-EARTH ORE DEPOSIT, POCOS DE GALDAS DISTRICT, BRAZIL
By HELMUTH WEDOW, JR.
ABSTRACT
Rare-earth elements and thorium are closely associated with a large magnetite stockwork cutting alkalic igneous rocks at Morro do Ferro on the Pogos de Caldas Plateau in southern Brazil. The ore deposit was discovered in 1953 by the ground search for an area of very high radioactivity recorded during an airborne survey of the plateau. Shortly after the discovery of the deposit, drilling and tunneling were started to determine the subsurface limits and grade of the ore body. In 1955 a surface exploration program was conducted to determine the character, grade, and tonnage of near-surface material that might be developed by large- scale open-pit mining methods.
The near-surface material at the Morro do Ferro deposit is laterite developed by the deep tropical weathering of syenite-phonolite rocks, locally enriched with thorium and the rear-earth elements in the vicinity of the magnetite veins of the stockwork. The major vein system of the stockwork trends about N. 55° W. and dips steeply to the northeast. Allanite was probably the major primary-rare earth-bearing radioactive mineral impregnating the alkalic rocks in the stock- work; however, laterization has altered most of the allanite to a powdery, porous, yellowish- to reddish-brown claylike material that contains most of the thorium and rare earths. Recognizable secondary minerals produced by the weathering of the allanite include bastnaesite, cerianite, and thorogummite.
The trenching and test-pitting of the exploration program opened enough of the surficial parts of the stockwork to outline a highly radioactive northwest- trending lenticular zone on the southeast side of Morro do Ferro. This zone with a length of about 500 meters and a maximum width of about 130 meters, is surrounded by a halo of moderately radioactive material as much as several tens of meters broad. Gamma-ray probing of open drill holes indicates that both zones extend to depths of 10-15 meters and that radioactivity declines slightly with depth. At greater depths the more highly radioactive material becomes very spotty or pockety. The near-surface part of the central enriched zone is calculated to contain about a million metric tons of material with an average grade approach ing 1 percent thoria and 4 percent total rare-earth oxides. The halo zone surround ing this central area probably contains about half a million metric tons averaging close to ^-percent thoria and 1^-2^ percent total rare-earth oxides.
The Morro do Ferro deposit has promise as a source of thorium and the rare earths. The extremely large tonnages of the enriched, relatively soft, decomposed rock and laterite can be readily worked with mechanized earthmoving equipment. The chief difficulty will be in beneficiating or extracting the thorium and rare earths in a manner that will be competitive with other sources of these elements.
Dl

D2 URANIUM INVESTIGATIONS IN BRAZIL
INTRODUCTION
Mineral rights at Morro do Ferro (Iron Hill) (originally called "Morro Alto e Consulta"), in the Minas Gerais part of the POQOS de Caldas Plateau, Brazil (figs. 1, 2) were acquired by the Companhia Geral de Minas in April 1935 for iron and associated metals. It was not until 1953, however, that the strong radioactivity of the deposit was recognized. The discovery of the radioactivity was made during the airborne scintillation-counter survey made of the POQOS de Caldas Plateau by Levantamentos Ae'rofotogrametricos, S.A. (hereafter re ferred to as LASA) with the technical assistance of Aero Service Corporation, Philadelphia (Tolbert, 1966). The relation of the Morro do Ferro anomaly to the other principal anomalies in the district is shown in figure 2. Preliminary ground investigation of the Morro do Ferro area, made by geologists of the U.S. Geological Survey (USGS) in collaboration with members of the Brazilian Conselho Nacional de Pesquizas (CNPq) and Departamento Nacional da Produgao Mineral (DNPM), showed that the intense surface radioactivity was associated with laterite and other surficial deposits developed on the alkalic igneous rocks of the plateau where these rocks are associated with a stockwork of magnetite veins. Analyses of samples collected during the preliminary surface studies l indicated that the radioactivity is due almost entirely to thorium and its daughter products in a rare- earth deposit. Subsequently, the DNPM began an exploration pro gram to determine the grade and tonnage of the deposit. From June to September 1955 the Cia. Geral de Minas conducted a surface- trenching program with the collaboration of the CNPq and the USGS, primarily to obtain the tonnage and grade of material in the near- surface parts of the deposit.
The information available to the writer, prior to the trenching pro gram, was summarized by G. E. Tolbert (see footnote 1). The present report discusses the results of the trenching program and the gamma- ray logging of those holes drilled by the DNPM that were sufficiently open to permit probing with scintillation-detection equipment. The results of preliminary mineralogical studies are also presented. Short reports summarizing the findings on which this study is based have already been published (Oliveira, 1956; Wedow, 1961a).
The author wishes to express his appreciation to the Companhia Geral de Minas for help extended during the investigation. Dr. H. O. J. Penido, manager, was especially cooperative and placed the full facilities of the company at the disposal of the author. The assistance of the DNPM at POC.OS de Caldas and Rio de Janeiro is also gratefully
1 Tolbert, G. E., 1955, Preliminary report on the Morro do Ferro thorium-bearing rare-earths deposit, Posos de Caldas Plateau, Brazil: Unpub. rept. prepared for Conselho Nacional de Pesquizas, Brazil.

MOERO DO FERRO THORIUM AND RARE-EARTH ORE DEPOSIT D3
POQOS DE CALDAS DISTRICT
FIGURE 1. Location of the Pocos de Caldas district.
acknowledged. Max G. White and Gene E. Tolbert of the USGS were associated with the author in the investigations.
This report concerns work performed by the Brazilian Conselho Nacional de Pesquizas and subsequently by the Brazilian Commissao Nacional de Energia Nuclear and the United States Geological Survey on behalf of the United States Atomic Energy Commission, and it is published with the approval of these agencies.
GEOGRAPHIC AND GEOLOGIC SETTING
The POC.OS de Caldas district lies on the border of the States of Sao Paulo and Minas Gerais in southeastern Brazil (fig. 1). It consists of a roughly circular plateau that has an area of about 1,000 square kilometers (fig. 2) and an average altitude of about 1,300 meters. The rolling, grass-covered hills of the plateau are bordered by a rim of mountains whose peaks attain heights of 1,600-1,800 meters. The low-

D4 URANIUM INVESTIGATIONS IN BRAZIL
D
Pogos de Caldas
Aguas D
Caldas D
D Andradas
Map adapted from Tolbert (1966, plate 1) 10 KILOMETERS
I
I I I I I I10 MILES
_J
EXPLANATION
<2-times background 2-4-times background 4-8-times background >8-times background
Principal areas of anomalous airborne radioacivity
Topographic limit of the Pogos de Caldas Plateau
FIGURE 2. Sketch map of the Pocos de Caldas district, showing principal areas of anomalous airborne radioactivity and the location of Morro do Ferro.
lands surrounding the mountains reach altitudes of 800-900 meters. The relief of the western half of the plateau is less than that of the eastern half. The highest point of the plateau is Morro do Ferro, which has an altitude of 1,541 meters.
POQOS de Caldas (population about 24,000 in 1955), the principal town on the plateau, is connected to Sao Paulo by both rail and high-

MORRO DO FERRO THORIUM AND RARE-EARTH ORE DEPOSIT D5
way. Rail service from Sao Paulo, a distance of about 310 kilometers, is by the Estrada de Ferro Mogiana, a narrow-gage railroad. The highway from Sao Paulo (275 km) is an all-weather road. Regularly scheduled airline flights connect Pogos de Caldas with Rio de Janeiro, Belo Horizonte, and Sao Paulo.
The bedrock of the Pogos de Caldas district consists principally of alkalic intrusive rocks, chiefly nepheline syenite and phonolite; other rocks include breccia, agglomerate, tuff, and sandstone. In many localities on the plateau the bedrock is deeply weathered; as a result, lateritic deposits rich in aluminum, iron, and manganese oxides are common. Zirconium ores are present in significant quantity and, with bauxite, have been the chief mineral exports of the district (Teixeira, 1936 and 1937).
Morro do Ferro (fig. 3) is near the geographic center of the Pogos de Caldas district and is about 15 kilometers due south of the town of Pogos de Caldas (fig. 2). It is roughly elliptical, trends northeasterly, and has a relief of about 140 meters and a maximum diameter of about 1 kilometer. The summit altitude is 1,541 meters. The hill is devoid of vegetation except for grasses and low bushes. A small densely wooded area lies along the small stream draining the base of the south slope. Access to the Morro do Ferro area is by dirt road and trail, a distance of about 21 kilometers from POQOS de Caldas.
At Morro do Ferro the country rock is too decomposed to be iden tified in the field, but it was probably part of the syenite-phonolite complex of alkalic igneous rocks which characterize the Pogos de Caldas district. The syenite-phonolite rocks are cut by a network of magnetite veins which form a northwesterly-trending stockwork. It is likely that the magnetite represents an extremely late stage in the intrusion. During the intrusion of the stockwork the country rock was apparently brecciated and altered. The alkalic rocks cut by the stock- work, and to some extent the magnetite veins themselves, were en riched by mineralizing solutions containing chiefly the rare-earth elements and thorium. Whether the original thorium and rare-earth minerals were deposited contemporaneously with the magnetite, as at the Scrub Oaks mine in New Jersey (Klemic and others, 1959, p. 55), or were deposited later is not known. Subsequent deep weathering, typical of the region as a whole, altered the rare-earth- and thorium- enriched alkalic rocks of the ore deposit and the adjacent unenriched rocks as well, to a compacted clayey lateritic material with local relict structures and textures. The depth of this weathering is not known but may extend more than 100 meters below the present sur face, although remnant blocks of relatively less weathered material may be scattered throughout the weathered mantle of the hill. Eluvial concentrations of magnetite rubble, ranging in depth from a few
271-710 67 2

D6 URANIUM INVESTIGATIONS IN BRAZIL
Dashed line encloses ' area of almost all :moterial containing : ':?.0 percent or more
EXPLANATION
Approximate positionof surface exposures of prominentmagnetite veins
_ 2Trench excevated by
the Cia. Geral de Minas(CGM)
x ivTest pit excavated
by the Cia. Geral de Minas
Adit, showing approx- imate outline of dump
0AE
Location of Depart- amento Nacional da Produgao Min eral drill hole probed with gam ma-ray scintillation logging equipment
A 279
Location of individual trench or other surface sample specifically men tioned in text
O**5Location of grab
sa m pi e from DNPM adit
100 METERS _I
300 FEET _I
CONTOUR INTERVAL 20 METERS
FIGURE 3. Topographic and geologic sketch map of Morro do Ferro thorium and rare-earth ore deposit, showing location of trenches, test pits, and selected DNPM drill boles.

MORRO DO FERRO THORIUM AND RARE-EARTH ORE DEPOSIT D7
centimeters to as much as 2 meters (avg about 30 cm) cover most of the area underlain by the stockwork. Beneath the eluvial mantle of magnetite various weathering processes, chiefly eluviation and lateri- zation, seem to have caused a secondary enrichment of thorium and the rare-earth elements in the near-surface parts of the stockwork. It is with this near-surface enriched zone at Morro do Ferro that this report is primarily concerned.
THE THORIUM AND RARE-EARTH DEPOSIT
The most intense radioactivity at Morro do Ferro is in the near- surface zone of a deeply weathered stockwork in alkalic igneous rocks highly enriched with the rare-earth elements and thorium. The out crop of the more strongly radioactive material is about 500 meters long and attains a maximum width of about 130 meters (fig. 3). It extends from near the base of the hill on the southeast flank (alt about 1,420 m) to the summit (alt 1,541 m) and thence down the northwest flank to an altitude of about 1,520 meters. The maximum width ap pears to be at an altitude of about 1,510 meters on the southeast flank of the hill (fig. 3). Although very little is known about the pos sible depth of the deposit, trenches and test pits show that material containing significant amounts of radioactivity (1.0 percent or more eThO2 2) exists to depths of 4-5 meters. In places probing of the DNPM drill holes with gamma-ray scintillation logging equipment recorded radioactivity that may be equivalent to 1.0 percent or more ThO2 at depths ranging from 5 to 30 meters. Slightly less intense radioactivity that may be equivalent to 0.5-1.0 percent ThO2 occurs from 30 down to about 50 meters. The data from depths below 10 meters, however, are insufficient to determine the depth to which the ore body extends; it is inferred on the basis of the available data that the deposit is chiefly a surficial lateritic enrichment of the stockwork protore.
LITHOLOGY
The country rock at Morro do Ferro seems to have been chiefly phonolite, nepheline syenite, and their porphyritic equivalents. In general, the mineral grains of the original syenite were as much as several millimeters in diameter; where the syenite was porphyritic, the phenocrysts were as much as 1 centimeter long. The phonolites were porphyritic, for the most part, with phenocryst grains as large as several millimeters in diameter in an aphanitic or very finely crystalline groundmass.
2 eThOj is equivalent thorium oxide. It is a measure of the radioactivity and is expressed as the equivalent amount of thorium oxide that would be required to produce the measured radioactivity if the radioactivity were due solely to thorium and its daughter products in equilibrium. __

D8 URANIUM INVESTIGATIONS IN BRAZIL
Although no fresh bedrock has been observed on Morro do Ferro, the same rock types elsewhere on the Pogos de Caldas Plateau gen erally are various shades of gray. In the highly compacted laterite in the vicinity of Morro do Ferro, the colors are commonly white to yellow to red brown, depending on the degree of staining by iron oxides; locally some of the weathered material is black because of disseminated manganese oxides. The enriched material of the Morro do Ferro laterite is similar in color but generally is more deeply iron stained; locally small patches are yellowish green, a color which is possibly caused by a high content of rare-earth minerals.
Intense staining by iron oxides is common in the uppermost few centimeters of the radioactive laterite and locally extends to depths of several meters; much of this iron was probably derived from mag netite in the eluvial cover by solution and was redeposited as hema tite or limonite. Relict structures and textures, where present, are commonly obscured in areas of intense iron-oxide staining.
STBUCTUBE
The radioactive rare-earth deposit at Morro do Ferro is closely associated with the magnetite veins of the stockwork. The major veins strike about N. 50°-60° W. (fig. 3) and dip 50°-85° NE. Although some are as much as 5 meters thick, most are 1-3 meters thick. Other prominent magnetite veins in the stockwork range in thickness from a few tens of centimeters to about 2 meters and have various attitudes, but there is a general tendency for strikes to cluster hi the sector N. 10°-35° Ei. and for dips to range from vertical to 45° either to the northwest or southeast. Numerous magnetite veinlets with thicknesses from a fraction of a millimeter to as much as several centimeters cut randomly through the stockwork and trend in the same general direction as the larger veins. Because of weathering, many of the smaller magnetite veinlets have been altered either completely or partly to limonite. Other limonite veinlets, however, may have been caused by the precipitation of limonite from solutions moving down ward along fractures. Manganese has been similarly concentrated in veinlets, either by alteration of original minerals or by introduction of manganese during weathering.
The fracture system containing the magnetite veins and veinlets seems to have controlled the enrichment and amount of thorium and rare-earth mineralization. Evidence supporting this conclusion may still be recognized despite the modifications imposed by laterization. Thus, one of the variously shaped polyhedral blocks of rock on one side of a vein or veinlet may be more radioactive or contain more rare earths than a similar block on the other side of the vein or veinlet. This structural control is exhibited not only by minor structural

MORRO DO FERRO THORIUM AND RARE-EARTH ORE DEPOSIT D9
features but also by the major magnetite veins. In general, the more radioactive parts of the deposit are nearer to or immediately adjacent to the major veins. The distribution of radioactive materials and other field observations seem to indicate that the magnetite veins had a tendency to dam the rising mineralized solutions so that the rocks on their footwall sides became locally more enriched with radioactive minerals than the rocks on their hanging wall sides.
EXPLORATION
The first ground exploration of the deposit at Morro do Ferro was a radioactivity survey made by Gene E. Tolbert and Helem Bessa in 1953 (see footnote 1, p. D2). This survey outlined an area of radio activity about 400 meters long and 75-100 meters wide of such high intensity that readings could not be recorded by a standard Geiger counter equipped with a 2- by 20-inch gamma probe. At this time the DNPM began exploration of the deposit by drilling more than 100 auger and diamond-drill holes. The auger holes ranged in depth from a few meters to 50 meters, and some of the diamond-drill holes are reported to have reached depths of more than 100 meters. Another phase of the exploration program of the DNPM consisted of driving an adit into the radioactive stockwork at an altitude of about 1,480 meters on the southeast side of Morro do Ferro (fig. 3) and in the general direction of the strike of the major magnetite veins. In July 1956 the working face of the adit was more than 100 meters from the portal.
In April 1955, Tolbert (see footnote 1, p. D2), using scintillation counters, noted a wide variation in the radioactivity over the pre viously determined zone of high radioactivity and recommended that some surface exploration be done.
In June 1955 the Cia. Geral de Minas undertook an exploration program with the primary objective of determining what surficial parts of the deposit would be amenable to large-scale opencut mining methods. This program consisted chiefly of digging five trenches in a direction essentially normal to the trend of the stockwork (fig. 3). The total length of trenching was about 500 meters. The trenches were generally about %-l meter in width and ranged in depth from less than % meter to as much as 2 meters, averaging about 1% meters. The five trenches crosscut the area of surface radioactivity at altitudes of about 1,430, 1,465, 1,510, and 1,540 meters on the southeast flank of the hill and at 1,520 meters on the northwest flank. The trench sites (fig. 3) were located by the author in May 1955 on the basis of scintillation-counter traverses.
The trenching was supplemented by four test pits that ranged in depth from 3 to 5 meters. The sites of the pits, selected 011 the basis of

D10 URANIUM INVESTIGATIONS IN BRAZIL
results of the trench sampling (described under "Sampling and analyses"), were designed primarily to test the vertical variation in radioactivity several meters below the floors of the trenches. Because of caving, depths greater than 5 meters in the test pits were not considered safe, and an attempt was made to crosscut the deposit with an adit at an altitude of about 1,450 meters (fig. 3). The driving of this adit was also abandoned because of caving. The last reported position of the working face was about 39 meters from the portal. (See fig. 3.)
Measuring radiation in the drill holes tested the radiation to greater depths than it was tested in the trenches and the several test pits. The specially designed scintillation-detection equipment used to probe the holes was the type developed by the USGS for similar drill-hole logging in the uranium deposits of the Colorado Plateau. Of the more than 100 auger and diamond-drill holes bored by the DNPM, only 36 were still open to depths of more than 2 meters at the time of the probing. In most of these holes, probe- depths ranged from 5 to 15 meters, although two reached 47 and 53 meters, respectively. The total depth logged amounted to 385% meters in the 36 holes. The locations of the holes logged are shown infigure 3.
SAMPLING AND ANALYSES
Variations in grade of near-surface material were determined by traversing with a scintillation counter and sampling in the trenches excavated by the Cia. Geral de Minas. Channel samples were cut in the uphill wall of each trench at an average distance of about 25-30 centimeters above the floors of the trenches. The test pits were sampled by channels in each of the two uphill corners of the pits. The lengths of both trench and pit samples were determined mostly by the variation in radioactivity along the line of sampling, although color and lithologic variation also were considered. The sample lengths ranged from a minimum of about 20 centimeters to as much as 3 meters; most, however, ranged from 60 centimeters to 1.5 meters. Sample weights varied widely, generally depending on the amount of magnetite included, though most were about 5 kilograms. The samples were dried and crushed by the Cia. Geral de Minas to approximately minus 4-mesh. Because of the caving ground in the company adit at 1,450 meters, only about the first 10 meters of the adit could be sampled before it became inaccessible. The company completed channel sampling of all surface openings by September 1955. More than 500 samples were cut in this phase of the program. By the end of 1955 the trenches had been sampled to obtain a bulk sample for beneficiation tests.

MORRO DO FERRO THORIUM AND RARE-EARTH ORE DEPOSIT Dll
RADIOACTIVITY ANALYSES
TRENCH SAMPLES
Preliminary radioactivity analyses were made on the trench samples with a portable sealer at POQOS de Caldas using as a standard a sample from Morro do Ferro that had been determined to contain 1.5 percent Th02 by the Institute de Pesquizas Tecnol6gicas (IPT) in Sao Paulo. The equivalent thoria content of the 431 trench samples as determined in POQOS de Caldas ranged from a low of less than 0.1 percent to a maximum of 2.8 percent. These analyses are given in table 1 under the column headed PdeC.
TABLE 1. Radioactivity data and lengths of samples taken from trenches at Morrodo Ferro
Sample: Samples are arrayed in sequence from southwest to northeast for each trench. For example, intrench 1, the southwesternmost sample is MF-139, sample MF-1 is contiguous to MF-75 near the middleof the trench, and MF-74 is the northeasternmost sample from this trench.
Percent eThOj: PdeC, analyses of minus 4-mesh material made with a portable sealer at Pocos de Caldas;Bio, radioactivity analyses made on minus 20-mesh material in the DNPM-USGS laboratories at Rio deJaneiro.
Composite group: Groupings of individual trench samples made for calculation of weighted averages andpreparation of composite samples (sec table 2).
Sample MF-
Length (meters)
Percent eThO3
PdeC Rio
Com posite group
Sample MF-
Length (meters)
Percent eTh03
PdeC Rio
Com posite group
Trench 1
139_ __138___._
137___._136 ___135 _____134 __ __
132__ _131_ ____130 ___129 _____128 _____127 _____126 _____
125_. _124__ ___123 _____122 __ __121 _____120 _____
119 _____118 __ _117___._116_ __115 _____
1.51.5
.79 n2.01.5
1.01.01.11.41.01.51.51.5
1.52.01.51.31.51.5
1.01.01.01.51.5
0 0
.3
1.4Q
.9O
1 . O
1.31.21.81.01.3.9
1.9
.6
.51.1.4.8.9
1.51.4
q1.51.5
0.85
i . _sy
1.77
.54
.81
1.30
1-1
1-2
-L O
1-4
1-5
1
114 __ ._113 _____112_ ____
111_..___
110__ ..10Q108__ _.107_____106 __ _.105 _____104103 __ _
1 O9101 __ _100 ____
99QS9796Q^Q4.93 __ __92_ __Q1QO89_____
1.41.41.6
1.8
2.01.21.21.51.51.3
1.1
t/
t7
1.5
1.01.0i ^1 £>
1.01.01.01.01.01.01.0
1.21.31.3
.6
1.01.71.81.71.51.81.52. 1
.7
.7
.5
1 Q1.11.0.7
1 91.71.31.31.31.4.9
.85
1.77
.62
1 91
1.32
a ̂
1-6
1-7
1 Q
1 Q

D12 URANIUM INVESTIGATIONS IN BRAZIL
TABLE 1. Radioactivity data and lengths of samples taken from trenches at Morrodo Ferro Continued
Sample MF-
Length (meters)
Percent eThOj
PdeC Rio
Com posite group
Sample MF-
Length (meters)
Percent eThCh
PdeC Rio
Com posite group
Trench 1 Continued
88____-87_____86____.85__.-_84_____83_____82____.81__ 80____.7Q78-____77_____
76_.__.7c
12 __3 _ _4
7____.8__ 9-___.10____.11_._._12_____13 __ _14__ _
16___-_17_____
18____.19 __ __20___-_
21_.___22__23_____24_____25____.26__ __27__ 28 __ ..29_____
0.8.9.8.8.5.5.5.5.5.5.5.5
q9 ft
1.1.9
1.01. 11.01.01.01.01.01.01.01.01.01.0.5.51.0
1.01.01.0
.91.01.01.01.01.01.01.01.0
2.32.31. 12.12.11.71.42.32. 11.71.71.9
2o
1.21.2
1. 12.11.51.71.01.7
1.8.7. 6
.92. 11.5
.7
.8
.6
1. 11.91.31.51.91.11.31.71.9
2.46
2.32
1Q
1.181.30
1.17
1.501.631.021.67
1.87.811.742.05.97
2.091.38
.69
.75
.65
1.151.751.421.642.011.181.401.861.76
1-10
1-11
1-12
1-13
1-14
30.____31. __ _32___._33_____34_____35____.36__._.37____.
38_____39___._40__.__41_ _ .42_ __ _43. __ _44__.__45_____46_____47 _ _48_____49_____50_____
51_____52 __ _53 __ _54_ _55_____
57_____
59_ __
62_____63___._64..___.65 __ _66 _____67____.68_____69____.70_____
71_____72 __ _73____.74_.___
1.01.01.01. 1.9
1.01. 11.2
1.01. 11.51.51.01.61.51.61.51.5
.8
.7
.81.21.3.7
1.0.9
1.21. 1
1.01.01.21.6i ^i f\1.51.51.51.5.9
1.6
1.0.8
1.52. 11.41.22.82.01.52.3
.8
.6
.8
.81.31.0.4.8
.9
.4
.7
.4
.5
.7
.4
.4
.9
.5
.4
.4
.4K
.4
.5
.5
.4
.3
1.4.5
1.71.0
1.512.031.281.212.932.041.882. 19
.83
.61
.75
.831.311.01.37.87.64
.62
.68
.91
.26
.44
.79
.47
.95
.33
.43
.46CO
.41
.49
.50
.42
.43
1.28.44
1.711.11
a-io
1-15
1-17
Trench 2
140 __141__ __142 _____
1.61.2.2
0.6.6.2
0.62 2 1 143_____144_____145_ __ _
2.02.01.9
0.3.8.7 .55
fO f\

MORRO DO FERRO THORIUM AND RARE-EARTH ORE DEPOSIT D13
TABLE 1. Radioactivity data and lengths of samples taken from trenches at Morrodo Ferro Continued
Sample MF-
Length (meters)
Percent eThOz
PdeC Eio
Com posite group
Sample MF-
Length (meters)
Percent eThO2
PdeC Eio
Com posite group
Trench 2 Continued
146147__ __148___._149. __ .150__ _
i ^i1 ^91 ^3
154_____155___._
157____-
159 __ _
160___-_161 __ ..162__._.163_____164 __ .165 __ __166_ __167____.168_ _ _.169 ____170 __ __
171___-_172_____173_-_-174___._175..-._
1.51.52.01.01.0
1.0.6KK
.951.81.41.2.8.7
.71.51.51.51.51.51.51.01.21.41.0
.41.61.61.6.4
0.7q.5.8.7
1.01 q2 /»
.6
.3
.3
.3
.3
.8
1.41.61.5.6
1.91.62.11.01.8.9.9
.9
.81.01.11.3
.65
.23
1.17
1.661.28
.72
1.69
(2-1)
9 9
2-3
2-4
2-5
176_ __.177_____178 __ _179_____180__---181_ _ _182____183_____184
185 _ _186_____187__--_188_____189____.190___._
192 ____1Q31Q41QC
IQfi
107198iqq200_____9m9 02203-_-_-204 ___205_____206_____207-__._208.____
1.7.9
1.6.351.251.351.851.31.4
1.91.951.152.31.91.31.91.99 11 91 £>1 9
.71 Q1 Q1 91.2
1.82. 11. 92. 01. 91. 9
0.91.4.9
1.2.9.5
1.2.9
1.0
.4
.41.3
.7
.2
.7
.4Q
1.0
q.4.6
.4
.5
. 6
. 5
. 5
.68
.44
qc
.43
.45
(2-5)
2-6
2-7
Trench 3
393392 ____
390_ _._389 _ __388__-__387_____386_____
385_____384_____383__-._382_____
380____.288_____287-____286_-.._
1.31.61. 2
. 91.21. 21.31.2
1.61. 01. 31.2
. 61. 81. 01. 11. 1
0. 7. 7. 81.2
. 5
. 1
. 22
1. 01.01.31.01. 51.71.41.41.2
3-1
3-2
285----.
283-----282_____281 _.280__-_-
278_____277
276275_____274273_--_-272__.__
270__-__269___-_
1. 71. 0
. 91. i1 21. 91.21.21. 0
1. 0.8. 71.61.71.2
. 91. 4
1.72. 51.51. 71. 91.62. 21. 61.7
1. 71.71. 9
. 91.01.01.31. 3
1.44
1.471.91
1.69
1.27
3-3
3-4
1-710 67-

D14 URANIUM INVESTIGATIONS IN BRAZIL
TABLE 1.- -Radioactivity data and lengths of samples taken from trenches at Morro do Ferro Continued
Sample MF-
Length (meters)
Percent eThO3
PdeC Rio
Com posite group
Sample MF-
Length (meters)
Percent eThO 2
PdeC Rio
Com posite group
Trench a Continued
268-____267_____
266_____265_____264_____263__ __262____261_..__260 ___.209-.---210__ __211_____
212__ __213__-__214__.__215__._-216-_.__217___._
218____-219_____220_____221-._. _222. _ __223___-_
224_ ___225. _ _226227_____228--...229_.__-
1. 31.4
1. 82. 12. 11.41. 81.2
. 7
. 55
. 71.0
1. 72. 01. 15
. 951. 11. 7
1.65. 81.21. 51. 01.8
1.81. 81. 91. 72. 0
. 6
1. 51. 5
. 9
. 81.62. 31. 91. 51.92. 11.6.8
.5
. 3
.5
. 6
. 7
.6
1.21. 11. 31. 71. 6
. 9
. 5
. 5
. 5
.5
.3
. 4
. 70
1.78
1.38
. 53
1. 16
.67
(3-4)
3-5
3-6
3-7
3-8
230__-__231.- __232. __ _233__-_-234.. __235 . _236_____237___._238. __ _239__ _240 __ __241_ __
242_ _.243_.__-244_____245____.246_ __247.. ___248 _____249 _____250____.251__ _252 __ .
253____.254 ___255__ _256_____257_____258 __ -_259 __ _.
1. 31.61.2
. 71. 1.4. 8.6.7.9.9.4
1.21.41.4.51.61.31.91.51.41.21.9
1.41.31.21.32.31.32.0
1. 01. 0
. 61. 31. 71. 52. 12. 01. 51.42.71.5
.7
.61.0.9.7.4.4.2.3.2.4
.91.3.8.8.5
1.1.3
0. 90
1. 45
2.88
.87
.24
79
3-9
3-10
3-11
Trench 4
289 __ .290 __ __291 __ .292 _____293 __ .294_ __
295___._296 __ _297 _____298___._299__-_.300 __ __301_____
302 __ __303 __ __
1.01.61.61.81.81.1
.81.2.8.8
1.91.51.5
1.7.8
0.3.2.4.1.2.2
.7
.7
.8
.6
.71.2.7
.92.0
0.35
.66
1.20
4-1
4-2
4-3
304_____305 _____306 _____307 _____308-. _
309____-310__ _311_____312_____
313_ __314 _____315 __ __316-___-317_ ____318_ ____
1.11.01.11.5.8
1.61.92.01.5
1.6.9.9Q
.91.4
2.11.51.2.9
1.0
.5
.3
.4
.5
1.0.9
1.2.6.9
1.0
1.48
0.32
1.24
(4-3)
4-4
4-5

MORRO DO FERRO THORIUM AND RARE-EARTH ORE DEPOSIT D15
TABLE 1. Radioactivity data and lengths of samples taken from trenches at Monodo Ferro Continued
Sample MF-
Length (meters)
Percent eTMh
PdeC Eio
Com posite group
Sample MF-
Length (meters)
Percent eTMh
PdeC Eio
Com posite group
Trench 4 Continued
319__-_320_____
321__ _322 _____323__ _324_ __
326 __ __
328- -
329____.330_.___331 _332 __ __333 _334__.__
337-. _
339_ __340 .341 .___
1.2.8
1.0.9q
1.31.51.81.51.7
.72.22.11.9i fi1 ^
2.01.91.81.91.71.92.0
0.9.9
2.02.22.01.42.0
.9
.9
.4
.1
. 1
.390
.5
.5
.3
.4
.3
.90
.99
(4-5)
4-6
4-7
4-8
342___ _-343_ --344_____345_-__-346. __ ..347_._-..348_-_ 349____-350-_-__351_____352_____353____-354._ _ 9CK
OK«
357_____358-__ 359__. _360--_-_
362-____
364___ 365__-_-366_____
1.91.71.71.81.61.01. 31. 41. 9
1. 81. 71 Q
1. 61. 6
1. 81. 81. 42. 11. 71. 31. 21. 52. 32. 2
0.1.1.1.1. 1. 1. 4. 7. 7. 7
. 71. 01. 2
K
.4
. 3
. 2
. 3
. 6
. o
. 2
. 1
. 1
4-9
4-10
4-11
4-12
Trench 5
394-____395__ _396_____397-_. __398_____399__-__
400-____401_ _. _402__.__403_____404_ ___405___._406_____407_____408-. .
409__-__410-___.411____.412. ___413-_._.414____.415____,416-_...417-_...418--_-_419-____
0. 61. 1.8
1.02.01.2
. 8
. 81. 31. 01.21. 0
. 3
.8
.4
.6
. 91. 01. 71. 51. 11.71. 92. 22. 11. 9
0.3. 5.7. 9.6.5
.91.6
. 81. 0
. 6
. 9
.6
.61. 3
. 3
. 3
. 3
.2
.2
.2
. 2
. 2
.2
.2. 2
5-1
5-2
5-3
420_ __ 421___-_
422__---423-- .424_-__-425 -426__---427 _--_428--- 429__-__430-___-431- -_-432_ -_-433_--_-434. _435_____
436-_-__437_____438_-_-_439-___-440--- 441_____442___-_443___-_444_____
2. 01. 0
2.32. 71. 71. 82. 63.42.32.42. 0
. 5
3. 03. 11. 8
1. 32. 12. 52.52. 72.62. 52.94. 3
0. 29
. 1
. 2
. 1
. 2
. 12
. 1
. 1
. 12
. 1
. 1
. 1
. 2
. 1
. 1
. 1
. 1
. 1
. 1
. 1
. 1
. 1
(5-3)
5-4
5-5

D16 URANIUM INVESTIGATIONS IN BRAZIL
To check the radioactivity analyses made in Po§os de Caldas, 128 samples of minus 4-mesh size were analyzed a second time in the DNPM-USGS laboratory in Rio de Janeiro. The samples selected for these check analyses were crashed to minus 20-mesh. Their eThO2 content was then determined by comparing their radioactivity with a calibration curve constructed from the radiation measurements of a group of 14 samples that previously had been analyzed chemically for thoria by the USGS in Washington, D.C. (See table 6.) These samples had been collected by G. E. Tolbert (see footnote 1, p. D2) from the earlier DNPM exploration holes. The check analyses are also given in table 1 in the column headed Rio. Because these 128 check analyses were in relatively close agreement with the pre liminary analyses made in POQOS de Caldas, the remaining horizontal channel samples were not reanalyzed individually.
For convenience in calculating the overall grade of the Morro do Ferro deposit, contiguous trench samples were combined into groups of varied lengths; the combined groups helped to reduce the number of samples to be submitted for chemical analysis. This grouping was such that broad zones of generally high-grade material were separated by significant intervening zones of lower grade material (table 1). The general cutoff grade for distinguishing between the high- and low-grade zones was arbitrarily put at 1.0 percent eThO2 . The weighted-average values of both the higher and lower grade zones (table 2) were calculated from the radioactivity analyses made at Pogos de Caldas (table 1). Splits of the original samples from the higher grade zones were crushed to minus 20-mesh and then combined on a weighted-volume basis. In each case, the specific volume of the split was directly proportional to the length of each original sample. Portions of each of these composite samples were then crushed to minus 200-mesh and their eThO2 content determined (table 2). Because the differences between these two sets of data, that is, the weighted averages of the composite groups and the analyses of the actual composite samples, did not appear to be significant, the prepara tion of composite samples for the lower grade zones was deemed unnecessary.
BUIK SAMPLE FOB BENEFICIATION TESTS
A bulk sample was taken from the Morro do Ferro ore body by the Cia. Geral de Minas for beneficiation tests. This sample consisted of material scraped from the uphill walls of each trench throughout the lengths of the composite samples (MF-1001 to MF-1019) given in tables 2 and 6. The bulk sample, aggregating several tons of material, was dried, crushed, and split at the company's plant in Pogos de Caldas. The data given in the tables of this report under sample MF-BX-1 are from a small split of this bulk sample.

MORRO DO FERRO THORIUM AND RARE-EARTH ORE DEPOSIT D17
TEST-PIT SAMPLES
As previously indicated the test pits were sampled by channeling the two uphill corners of each pit. These samples, unlike those from the trenches, were taken directly to the DNPM-USGS laboratory in Rio de Janeiro, ground to 20-mesh and assayed for eThO2. The grade variation of the test-pit samples ranged from 0.01 to 2.97 percent eThO2 . The sample data are given in table 3.
TABLE 2. Equivalent thoria analyses of composite samples and related data of trench samples from Morro do Ferro
Composite group 1Composite sample 2
MF-Projected length 3 (meters)
Percent eTh02
Weighted average,
composite group
Composite sample
(-200 mesh)
Trench 1
1-1 _. ___ __ _ ______l-2_ _________________________l-3_-_-_--_-_-__----________.1-4l-5_ _________________________1-61-7. -__-_-___-____-____-___-_1-8-, ________________________l-9_ _ _1-1CL __-_-_-_-_-__-._-_-___-_1-11- ___--_-_-___ __ _---.__--1-12_ ________________________1-13_ ________________________1-14. _ __ _-__--_--__-_-____-1-15 _____ _____________ _ _1-16 _ __1-17
1001
1002
1003
10041005
1006
1007
2.44.57.56.87.51. 59.42.89 76. 12.815.93. 0
16. 816. 421. 33. 3
0. 25. 93
1. 38.71
1. 33. 60
1. 58. 611.281.91.20
1. 47.701.68.76.491.28
1. 52
1. 42
1. 41
1. 412.21
1.61
2. 01
Trench 2
2-1. ________________________2-2 __ _ _ _ _2-3_ _________________________2-4_ _ _ _ _2-5__ __ -_____-_----________2-6 __ _______________________2-7. _ _ --___--__---_-_-___-.
1008
10091010
15.61.96.6
14. 017. 021. 719. 5
0 641 64
391 42
935353
1.53
1. 37.99
Trench 3
3-1 ___ _ ______ __ -_-____-3-2__ __-___---______-__-___-.3-3__ ___-________---___-_-_--3-4._ _______________________3-5___-_--___-_-_-_.___-_-__-3-6--- . -------____-3-7- -___--___-_-_______--____3-83-9____-_-__--__-__--_______-3-10___ __ _ ._ _ ____ _3-11- __ ---_-____ ___ ______
1011101210131014
1015
1016
8.59.49. 9
10. 612. 98.67. 99.710.214. 710.4
0. 531.281.801. 311. 46
. 511.28.50
1. 44.49.75
1. 131.641. 301.24
1.27
1.47
See footnotes at eu<J of table,

D18 URANIUM INVESTIGATIONS IN BRAZIL
TABLE 2. Equivalent thoria analyses of composite samples and related data of trench samples from Morro do Per TO Continued
Composite group 1Composite sample 2
MF-Projected length 3 (meters)
Percent eThOz
Weighted average,
composite group
Composite sample
( 200 mesh)
Trench 4
4-l_ ___---___--__-__.________4-2_ __._._._. -_-___.._...____4-3_ _________________________4-4_ __--__ ___ __4-5__ _.---_ _ . _ ___________4-6 __ ______ ___ _.__ ___4-7_ ____--.__-_________ _____4-8. --__----_-------__-__-___4-9__ ____--___--___-_________4-10_ ________________________4-11. __---_-_----_-__________4-12. ________________________
1017
10181019
5.24.94.74. 25.06.29. 011.68. 413.09.85. 3
0 2379
1 304293
1 56194410724117
1. 26
1.001. 64
Trench 5
5-1-. _______________________5-2_ _________________________5-3. ________ _ -___--__.-____5-45-5 __ _______________________
6. 27. 1
19. 329. 115.6
0 6090211310
* See table 1 for numbers of individual samples included in each composite group.2 Mixture of splits from individual samples combined on a weighted-volume basis directly proportional to
the length of each original sample.3 Length of composite groups adjusted from actual length (table 1) by projection to a line normal to the
strike of the main magnetite vein in trench 1 (fig. 3).
GAMMA-RAY LOGGING OF DRILL HOLES
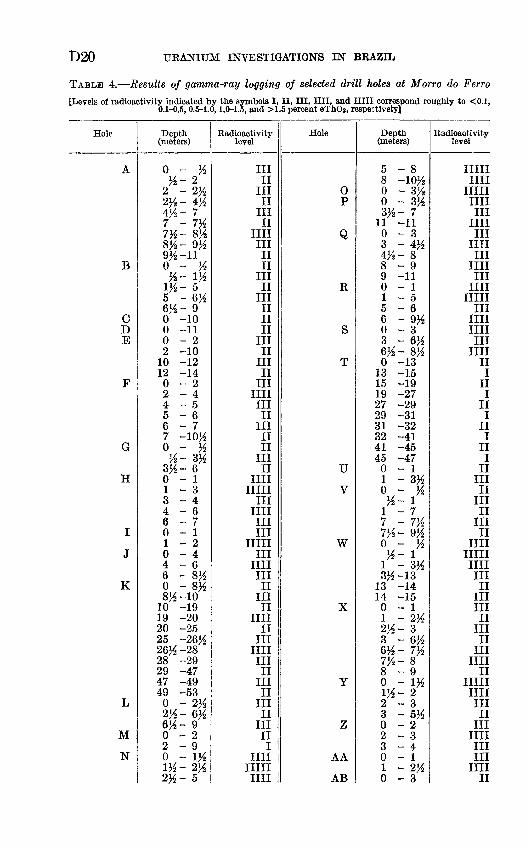
In the gamma-ray logging of the drill holes at Morro do Ferro, difficulties were experienced in calibrating the scintillation-detection equipment, principally because of a lack of adequate sample data from the holes for comparison with the gamma-ray logs. Such data as were available, however, permitted the conversion of the variations shown by the logs into one of five radioactivity levels for every one- half meter of depth. These five levels correspond roughly to the follow ing ranges in equivalent thoria content: less than 0.1; 0.1-0.5; 0.5-1.0; 1.0-1.5; and more than 1.5 percent. The hole-by-hole results of the gamma-ray logging are presented in table 4.
ADIT SAMPLES
Approximately 20 meters of horizontal sampling was done in the company adit at 1,450 meters in the opencut leading to the portal and in the first part of the adit itself (fig. 3). Data on this sampling are

MORRO DO FERRO THORIUM AND RARE-EARTH ORE DEPOSIT D19
TABLE 3. Data on samples from test pits at Morro do Ferro
[Left and right sides refer, respectively, to left and right uphill corners of pits]
Depth (meters) Length (meters)
eTh0 8 (percent)
Left side
Depth (meters) Length (meters)
eThO2 (percent)
Eight side
Test pit 1
0 -0.3. 3- .8. 8-1. 4
1. 4-2. 02. 0-2. 85
2. 85-3. 53. 5-3. 9
0 356685654
1. 251. 352. 182. 41.98
2.632. 97
0 -0. 25. 25- . 55. 55-1. 45
1. 45-1. 951. 95-2. 852. 85-3. 353. 35-3. 85
0 25395955
1. 161. 211.602. 022.44.99
1. 64
Test pit 2
0 -0. 3. 3 - .8. 8 -1. 8
1. 8 -2. 82. 8 -3. 4
0.3. 5
1.01. 0.6
0. 921. 50.53.62.62
0 -0. 25. 25-1. 0
1. 0 -1. 61. 6 -2. 62. 6 -3. 3
0.25. 75.6
1. 0.7
0 751 00
463066
Test pit 3
0 -0. 5. 5 -1. 25
1. 25-2. 02. 0 -2. 752. 75-3. 53. 5 -5. 0
0 575757575
1 5
1 131 731 30
452515
0 -0. 5. 5 -1. 25
1. 25-2. 02. 0 -2. 752. 75-3. 53. 5 -5. 0
0 575757575
1 5
0 952 071 05
453020
Test pit 4
0 -0. 45. 45-1. 3
1. 3 -1. 71. 7 -2. 22. 2 -3. 03. 0 -4. 0
0. 4585458
1 0
0. 581. 271. 10.05.04. 01
0 -0. 15. 15- . 7. 7 -1. 3
1. 3 -1. 81. 8 -2. 62. 6 -3. 5
0 15556589
1 001 58
46010404
given in table 5. This sampling extended to a point where the adit dog-legged to crosscut the 1 percent eThO2 area outlined from the trenching (fig. 3). Although caving in the inner part of the adit pre vented further sampling, a hasty scintillation counter traverse made just prior to the abandonment of the adit indicated no material that exceeds 0.1 percent eThO2 .
Although no systematic sampling of the DNPM adit at 1,480 meters (fig. 3) was attempted, four grab samples were obtained along the trend of the main magnetite vein on its hanging-wall side. These samples represented relative highs and lows in radioactivity.
D20 URANIUM INVESTIGATIONS IN BRAZIL
TABLE 4. Results of gamma-ray logging of selected drill holes at Morro do Ferro
[Levels of radioactivity indicated by the symbols I, II, in, IIII, and HIII correspond roughly to <0.1, 0.1-0,5, 0.5-1.0,1.0-1.5, and >1.5 percent eThOj, respectively]
Hole
A
B
CDE
F
G
H
I
J
K
L
M
N
Depth (meters)
0 - %K- 2
2 - 2%2K~ 4K4K- 71-1%7K- 8%8K- 9K9K-H0 - %K- IK
IK- 55 - 6K6K- 90 -100 -110-22 -10
10 -1212 -140-22-44-55-66-77 -10K0 - %K- 3K3/2- 60 - 11 - 33-44-66-70 - 11-20-44-66 - 8K0 - 8K8K-10
10 -1919 -2020 -2525 -26K26% -2828 -2929 -4747 -4949 -53
o - 2K'2%- 6K6K- 90-22-90 - IKIK- 2K2K- 5
Eadioactivity level
IIIII
IIIII
IIIII
IIIIIIIIIII
IIIII
IIIIIIIII
IIIII
IIIII
IIIIIIIIIIII
IIIIIII
IIIII
IIIImil
mimmm
milm
mimiimii
miii
mmimiimii
mii
miiimi
milmi
Hole
Op
Q
R
S
T
U
V
W
X
Y
Z
AA
AB
Depth (meters)
5-88 -10%0 - 3K0 - 3K3K- 7
11 -110-33 - 4K4K- 88-99 -110 - 11 - 55-66 - 9K0-33 - 6K6K- 8K0 -13
13 -1515 -1919 -2727 -2929 -3131 -3232 -4141 -4545 -47
0 - 11 - 3K0 - KK- 11 - 77 - 7K7K- 9Ko - KK- ii - 3K3^-13
13 -1414 -150 - 11 - 2K2K- 33 - 6K6K- 7K7K- 88-90 - IKIK- 22-33 - 5K0-22-33-40-11 - 2K0-3
Radioactivity level
urnmi
urnmim
mim
mim
mim
miurn
mimmim
miiii
iii
iii
iii
iiiii
mii
mii
mii
miurnmimiimmiimii
mmi
iiurnmimiim
mimm
miii

MORRO DO FERRO THORIUM AND RARE-EARTH ORE DEPOSIT D21
TABLE 4. Results of gamma-ray logging of selected drill holes at Morro doFerro Continued
Hole
AD
AE
AF
Depth (meters)
3 -1010 -uy20-11-33-55-66 -. 7/20-33-55 - 6}£6K- 77 - 1%7% ~ 9%9/2 -10#0-3
Radioactivity level
III
IIIurnmiiniiiii
nin
miin
iii
Hole
AGAH
AI
AJ
AK
Depth (meters)
3-44-55 - 5^0-60 - 1/2
\% - 90-11-22-80 - 1/21/2 -10
0 - 11-22-44 - 6/2
Radioactivity level
IIII
IIIII
IIIIIIIIIIII
IIIIIIII
TABLE 5. Data on samples taken from the Cia. Geral de Minas adit at 1,450 meterson Morro do Ferro
Distance from entrance of cut i (meters)
0- 1. 71. 7- 2. 72. 7- 4. 64. 6- 6. 46. 4- 8. 08. 0- 9. 89. 8-12. 0
12. 0-14. 014. 0-16. 016. 0-18. 018. 0-19. 519. 5-20. 4
Sample length (meters)
Not sa1. 01. 91. 81. 61. 82. 22. 02. 02. 01. 5
. 9
eThOs (percent)
mpled, ground dist0.27
. 13
. 10
. 14
. 10
. 11
.08
. 09
. 08
.08
. 05
Approximate mean depth of sample
below surface (meters)
urbed.233445546477488
1 Portal of adit at 9.8 meters. Samples taken from 1.7 to 9.8 meters were from wall of opencut leading to portal of adit; those from 9.8 to 20.4 meters were from wall of adit.
The radioactivity of these samples is erratic as shown in the table below; percent eThO2 and the relative position of these four samples f oUows:
Sample MF-445-446- 10G. 11G.
Approximate Approximate distance from depth below eThOa
portal (meters) surface (meters) (percent)2564
100110
13263536
2.50. 90
2.56. 78
CHEMICAL ANALYSES
The data on all available samples from Morro do Ferro that were analyzed chemically are given in table 6.

D22 URANIUM INVESTIGATIONS IN BRAZIL
TABLE 6. Chemical and radioactivity analyses, in percent, and related data of selected samples from MOTTO do Ferro
[T EEO=total rare-earth oxides]
Sample TREO+ ThO 2 i TEEO 2 ThO 3 eThO 3 U30 8 Depth
(meters)TEEO: eThOj
Drill-hole samples
DNPM- 1__ 4__ 5__ 7__
10. _ 12__ 13__ 14.. 15__ 16. _ 17. . 18. _ 19. . 20. _
2.22 9. 61 2.89 9. 52
10. 93 11. 21 22. 39 22. 68 2. 02 9. 74
13. 75 22.66 21.66 8. 48
2. 09 8.82 2.04 8. 47 9. 46 9. 09 19.82 19. 89
1. 73 9. 05
12. 16 21. 13 19. 95 7.35
0. 13 .79 .85
1. 05 1. 47 2. 12 2.59 2.79 0.29 0. 69 1. 59 1. 53 1. 71 1. 13
0. 17 .71 . 95 1.31 1.68 2. 15 2. 53 2. 79 0.37 0.63 1. 10 1. 27 1. 71 1. 29
0. 009 . 004 .005 . 002 . 006 .002 . 007 . 007 . 005 . 015 . 013 . 019 . 021 . 006
10.6-11 4-5 11-12 1-2 1-2 7-8 1-2 3-4 1-2 4-6 4-5 1-2 3-4 1-1.6
10.5 11.6 2.0 6.5 5.6 4 1 7.9 7. 1 4.2
15. 0 11. 1 16. 2 11. 8 5.7
Trench samples
MF- 3__ 8__
25. _ 34_. 44. . 133.. 164.. 279. _ 327. _ 374.. 1001.. 1002 __ 1003 .. 1004. _ 1005. _ 1006 __ 1007. _ 1008. _ 1009. _ 1010- _ 1011.. 1012-. 1013.. 1014.. 1015. _ 1016.. 1017.. 1018.- 1019. _1020 3 _
BX-1 *_ WA s-_______.
12.48 4. 76
17. 06 10.77 1. 98 7.00 5. 14 7. 42 7.77
11. 55 8. 91
10. 82 11. 87 9.61
10. 57 7. 57 8. 20 9. 69 4 80 5. 25 5. 51 6.76 3.66 3.49 2. 71 2. 70 4.69 486
10. 72 5. 95 7. 05 8. 13
10.9 3.6 148 7.0 1. 5 5. 74 3.62 5. 63 6. 73 8. 07 7. 39 9. 40
10. 46 8. 20 8.36 5.96 6. 19 8. 16 3. 43 4. 26 4. 38 5. 12 2. 36 2. 25 1.44 1. 23 3. 43 3.86 9. 08 465 5.79 6.69
1.58 1. 16 2.26 3.77 .48
1. 58
2. 65
1. 58
1. 40
1. 70
1.26
1.54 1. 00 1. 96 2. 93 0. 42 1. 261. 521. 791. 043.481. 521.42 1. 411. 412.21 1.612. 011. 531. 37 0. 991. 131. 641. 301. 24 1. 271.471. 261. 001.64 1. 301.25 1. 44
0.026 . 012 . 024 . 012 . 004
. 007
. 007
. 006
. 005
. Oil
.002 0-2
7.3 3.6 7.4 2.4 3.8 44 2. 4 3. 1 6.7 2.3 49 6.7 7.5 5.9 3.8 3.8 3. 1 5.5 2. 4 4 3 4.0 3.2 1.8 1.8 1. 1 0. 8 2.6 3. 9 5. 7 3. 6 46 4 6
i TEEO+ThOa calculated from separate chemical analyses of TEEO and ThOa for DNPM samples, samples MF-3, -8, -25, -34, and -44, and sample MF-BX-1.
» TEEO calculated [(TEEO+ThO2)-eThO2] for samples MF-133, -164, -279, -327, -374, and -1001 through -1020.
» Sample MF-1020 is a composite sample prepared by mixing splits of samples MF-1001 through -1019 on a weighted-volume basis.
4 Sample MF-BX-1 is a small split of a bulk sample taken for benefication tests and represents about the same part of the ore body as sample MF-1020.
WA, average (weighted by projected sample length) of composite group samples MF-1001 through -1019.

MORRO DO FERRO THORIUM AND RARE-EARTH ORE DEPOSIT D23
THORIA
Because of the close correlation between thoria and equivalent thoria shown in the 14 DNPM drill-hole samples analyzed as standards (see table 6), only 10 trench samples were analyzed chemically for thoria. Of these samples, 5 were from among the first 50 samples (MF-1 through -50, table 1) taken from trench 1, and 5 more were selected from the 19 composite group samples (table 2). The eThO2 and ThO2 values determined for these 10 samples can be compared in table 6 (samples MF-3, -8, -25, -34, -44, -1002, -1005, -1009,-1014, and -1019). In these samples all thoria values are slightly higher than the equivalent thoria values. The deviations (that is, ThO2 minus eThO2) range from -f-0.04 to +0.84 with an average of +0.24 percent. These differences between thoria and equivalent thoria values were not considered significant; hence, the equivalent thoria data were not increased correspondingly for the calculation of the overall thoria grade of the deposit.
TOTAL RARE-EARTH OXIDES
The 19 composite group samples (samples MF-1001 through -1019, table 6) were analyzed chemically for total rare-earth oxides plus thoria (TREO+Th02) at the DNPM laboratory in Rio de Janeiro. The TREO content of each of these samples was then computed by subtracting the respective equivalent thoria values. A check on the reliability of this method of obtaining the TREO values was made by submitting duplicates of five of these samples simultaneously to the U.S. Geological Survey in Washington, D.C., and to the Institute de Pesquizas Tecnol6gicas in Sao Paulo for separate determinations of thoria and total rare-earth oxides. The results of the analyses from the three laboratories, rounded to the nearest 0.1 percent, are given in table 7; because they were so close, it is assumed that the procedure for calculating the TREO content of the Morro do Ferro samples by subtracting eThO2 from the TREO+ThO2 chemical analyses is sufficiently accurate for the purpose of this report.
Other samples analyzed for total rare-earth oxides excluding ThO2 were the 14 DNPM drill-hole samples, originally run for thoria stand ards, and the 5 individual trench samples (MF-3, -8, -25, -34, and-44). Individual trench samples analyzed for TREO+ThO2 were MF-133, -164, -279, -327, and -374. (See table 6.)
URANIUM
Twenty-four samples from Morro do Ferro were analyzed chemically for uranium or uranium oxide. The uranium content of these samples, recalculated where necessary to percent U3O8 , is given in table 6.

D24 URANIUM INVESTIGATIONS IN BRAZIL
TABLE 7. Comparison of analyses of five selected composite group samples fromMorro do Ferro
Sample MF- USGSi DNPM 2 IPT s
Total rare-earth oxides plus thoria
10021005100910141019
11. 011. 14.63. 8
11. 5
10. 810. 64. 83. 5
10. 7
11. 110. 84. 83. 5
11. 5
Total rare-earth oxides
1002-. ____1005___________________. __________1009__-__.____.___ _______________1014__________________________ _ _1019___.---_______________________
9.48.53. 02. 49. 8
9.48. 43. 42. 39. 1
9.58. 22. 92. 09. 9
Thoria
1002____________._________________1005_____._____________ _ ____ __1009 _ ___________________________1014 ___ __________ _____ _ _ ___1019_.__ ____ ____________________
1.62. 61.61. 41. 7
1. 42. 21. 41.21. 6
1. 62.61.81.61.6
1 V.S Geological Survey, Washington, D.C. Analysts: B. Ingrain, L.Jenkins.H Kramer, and E. Moore. 8 Departamento Nacional da Producao Mineral, Rio de Janeiro, D.F. Analyst: Carlos Pires Ferreira. 3 Institute de Pesquizas Tecnologicas, Sao Paulo, S.P. Enalyst: Joao Ricotti Pucci. < Thoria values are by chemical methods for USGS and IPT and by radiometric methods for DNPM.
SEMIQUANTTTATTVE SPECTROGRAPHIC ANALYSES
The five individual trench samples (MF-3, -8, -25, -34, and -44) that were analyzed chemically for thoria and total rare-earth oxides (table 6) were also analyzed semiquantitatively by spectrographic methods in the U.S. Geological Survey. The results are given in table 8. Yttrium and all the lanthanide elements except promethium, terbium, holmium, thulium, and lutetium were identified in one or more of the samples tested. The extreme abundance of the cerium earths relative to the yttrium earths is notable. The low silicon values (1-5 percent) in all samples attest to the laterization of the parent alkalic rock.
THORIUM AND BABE-EARTH MINERALS
Almost all of the bedrock at Morro do Ferro has been altered to a compact clayey laterite by deep weathering. As the depth of this laterite probably exceeds 100 meters, all the available material for mineralogic study, except for the magnetite of the stockwork veins,

MORRO DO FERRO THORIUM AND RARE-EARTH ORE DEPOSIT D25
TABLE 8. Semiquantitative spectrographic analyses of five samples from Morro doFerro
[Analyst: Mona Frank, U.S. Geol. Survey. Sample number is designated by MF. Laboratory number is inparentheses]
Weight percent
5-10-.- ...............1-5-.. .................0.5-1-.. . ............ ...
0.1-0.5..... ............
0.05-0.1.. ..............
0.01-0.05... ............
0.005-0.01...-... ....
0.001-0.005.-.-.. .......
0.0005-0.001 ---..0.0001-0.0005...........
MF-3(144512)
FeCe, AlTh, La, SiNd, K, Ti
Mn, Y, Pr, V,Ca
Sc, Gd, Nb,Pb, Er, Ms, Mo, B, Dy, Eu
Yb, Ga, Sin
Be, Ag
MF-8 (144513)
FeAlSi, Ce, KMn, Th, Ti
La. Nd, Ba,Ca
V, Zr, Y, Sr
Nb, Pb, Mg,Mo, Pr, B, Eu, Gd
Ga, Sin. Yb,Dy, Er
Cr
Ag, Be
Elements
MF-25 (144514)
FeCe, AlLa, Si, K, ThMn, Nd
Ti, Pr, V, Y,Ca
Sr, Zr, Ba
Sc, Gd, Mg,Nb, B, Dy, Er
Yb, Ga. Sm,Mo, Eu, Pb
Cu, Co
CrAg.Be
MF-34 (144515)
AlFeSi, Th, KCe, La, Ti
Mn Nd, Y, Ca
V, Zr, Sr, P,Mg, Pr
Pb, Nb, Ba,Eu, Gd, Er, Sc, B, Dy
Yb, Ga, Sm,Mo
Sn, Cu
CrBe, Ag
MF-44 (144516)
FeAlSi.KTi
Th, V, Mn Zr, Ce, Sr, Ca
Y, Pr, Ba, B,Nb
Ga, Er, Pb,Dy
Yb, Mo, Cr,Sc, Sn, Cu
Be, Ag
has been altered to some extent by the weathering processes. Feldspar phenocrysts of the original porphyritic syenite are completely kaolin- ized, and much of the groundmass now consists of intermixed kaolin and hydromica. Gibbsite and limonite are readily apparent constituents of some samples. In other samples some of the magnetite has been oxidized to hematite.
Among the rare-earth- and thorium-bearing minerals so far identified from Morro do Ferro, the first to be recognized was bastnaesite. It was identified in 1954 by C. J. Spengler, Jerome Stone, and D. D. Riska of the U.S. Geological Survey (written commun., 1954). In 1956, Elisiario Tavora of the Brazilian Department of Mines (DNPM) identified thorogummite and allanite and verified the occurrence of bastnaesite (written commun., 1955). More recently, Frondel and Marvin (1959) reported the presence of cerianite (CeOa) in some yellowish-green material taken from the Morro do Ferro trenches. Cerianite in the natural state had been known previously only from the Sudbury district of Ontario, where it occurs in association with a carbonate dike in nepheline syenite (Graham, 1955). In 1955 Elisiario Tavora (written commun., 1955) identified cerium oxide by X-ray analysis of several samples from Morro do Ferro, but the significance of this identification was not appreciated by the author until the work of Frondel and Marvin on cerianite was published.
In the samples from Morro do Ferro examined by the author, the bastnaesite was found chiefly as small botryoidal or mammillary masses that readily disintegrated to a fine powdery material. The thorogummite generally appears as tiny irregular, conchoidally frac-

D26 URANIUM INVESTIGATIONS IN BRAZIL
tured, waxy fragments that are colorless, white, brick red or black; two or more of these colors were common in the same fragment. Allanite is typically black and vitreous and was observed only as tiny grains at the centers of several reddish or yellowish, porous, powdery, claylike aggregates. These claylike aggregates are apparently the weathered alteration product of allanite and resemble the descriptions of the weathering products derived from allanites in certain Virginia pegmatites (Watson, 1917). The cerianite is also generally very fine grained and, where present in significant amounts, imparts a yellowish-green tinge to the clay and decomposed rock masses.
Allanite is most likely the major rare-earth-bearing radioactive material in the primary ore deposit at Morro do Ferro. The bastnaes- ite, cerianite, and thorogummite are the major recognizable alteration minerals derived from the laterization of the allanite (Wedow, 1961b). Doubtless other oxides, fluorocarbonates, and hydrous silicates con taining the rare-earth elements and thorium will be identified by more detailed mineralogic studies.
RELATION OF BARE-EARTH ELEMENTS TO THORIUM
The scatter diagram of figure 4 shows graphically the relation of total rare-earth oxides (TREO) to equivalent thoria (eThO2 ) in the samples given in table 6. Equivalent thoria has been used for com parison with total rare-earth oxides because the radiometric values were available for all the samples given whereas chemical values were not. Study of the diagram shows that, in spite of a broad general correlation between TREO and eThO2 , individual samples of rela tively small lateral or vertical extent have a much broader scatter than the composite trench samples that are of much greater linear extent. Regression analysis of the data set and subsets in figure 4 shows that the relation between the rare-earth elements and thorium is not particularly consistent and that variation in this relation, expressed, for example, by the ratio TREO: eThO2 , might be due to the interaction of the various geologic processes operative on the deposit during and after its emplacement. The TREO: eThO 2 ratios were calculated from the data in table 6, after the pertinent analyses were rounded to the nearest 0.1 percent. The ratios themselves were also rounded to the nearest tenth and given in table 6.
Several summary statistics, specifically the range, spread, and median, of the total set and selected subsets of the ratios are given in table 9. Comparisons among the subsets of these ratios show sig nificant differences that probably depend on the position of the sample within the deposit and the types of material included in the sample. For example, the first 8 of the 14 DNPM drill-hole samples originally selected for use as radioactivity standards were labeled

MOKRO DO FERRO THORIUM AND RARE-EARTH ORE DEPOSIT D27
t
3PzLL!OccLJQ.
<
IT0 2IH
HZLLl
<>~^
a
n
T XA
T T V V
T
X»
O
X
X
A O
XO
FA y
° A £ AX 0&
O
EXPLANATION
O Drill hole, "clay"'sample Drill hole, concentrate sampleX Individual trench sampleA Trench n A Trench 2 1 _,:,.. V Trench 3 f group.V Trench 4 J sampies
D Weighted average ofcomposite- groupsamples
Sample MF 1020HSample BX 1
XA
C
0
( 1
10 15
TOTAL RARE-EARTH OXIDES (PERCENT)
20 25
FIOURE 4. Scatter diagram of paired total rare-earth oxide and equivalent thoria analyses of selectedsamples from Morro do Ferro.
"clay" and presumably represent unconcentrated material. These "clay" samples, as shown in table 9, have a different range, spread, and median value than the other six drill-hole samples which had been panned in an attempt to concentrate the radioactive minerals. The much higher median TREO:eThO2 ratio for the concentrates suggests that more thorium than rare-earth elements may be in the finer or lighter particles. Consequently, in the panning process more thorium was removed or at least not significantly concentrated, relative to the rare earths. Comparison of the 10 unconcentrated individual trench samples with the drill-hole data further emphasizes the differences between the concentrated and unconcentrated material.
Ordering of the TREO:eThO2 ratios of the 19 composite trench samples (table 6) in subsets by trench (table 9) shows that the trenches have virtually the same spread of ratios but different median values and ranges. The ratios of trench 1 suggest greater concentrations of TREO, relative to the radioactivity, in the surficial materials at the broadest part of the ore body. The extremely low median ratio and range for trench 3 indicates an impoverishment of TREO relative to eThO2 in this area of the ore body because the level of radioactivity

D28 URANIUM INVESTIGATIONS IN BRAZIL
TABLE 9. Selected statistics of TREO:eThO2 ratios in samples from Morro do Ferro (from data in table 6)
Sample groups
All samples 1 . _____ ______Individual trench and drill-hole samples-
Individual trench samples- _Individual drill-hole samples. _ _
"Concentrate" samples. _____Composite trench samples _ _____
Trench 1_ _ .___ _ ___ __Trench 2_ __________ _ _Trench 3______ _ __ _ _ _ _Trench 4 _ ___ _______All composite samples NE. of main
dike ______ __ ___All composite samples SW. of main
dike _Sample MP-1020 ______Sample MF-BX-1 _ _ ___
Number
43 24 10 14
8 6
19 7 3 6 3
6
13 1 1
TREO:eThO 2 ratios
Range
0. 8-16. 2 2. 0-16. 2 2. 3- 7. 4 2. 0-16. 2 2. 0-11. 6 4. 2-16. 2
. 8- 7. 5 3. 1- 7. 5 2. 4- 5. 5 .8-40
2. 6- 5. 7
. 8- 4. 3
1. 8- 7. 5
Spread
15.4 14 2
5. 1 14. 2 9.6
12. 0 6. 7 3. 4 3. 1 3. 2 3. 1
3.5
5. 7
Median
4 3 6.9 3. 7 7.2 6. 8
11. 4 3.8 4.9 4. 3 1.8 3.9
2.8
4 0 3.6 4. 6
i Except MF-1020 and MF-BX-1.
is virtually the same as in trench 1. The similarity of all three statistics of the composite samples from trenches 2 and 4 suggests that in the tapering ends of the ore body concentrations of TREO relative to eThO 2 are intermediate to those shown by trenches 1 and 3. The ratios of the composite trench samples were next reordered into two subsets relative to position northeast or southwest of the main magnetite dike (fig. 3). The statistics of these arrays show that comparable levels of high radioactivity in the trenches are relatively enriched in the rare earths to the southwest of the main dike or relatively impoverished on the northeast side.
Causes of the variations in the relative concentrations of the rare earths and thorium, however, cannot by judged from the infor mation now at hand. Such causes arise from: the initial variations in the primary deposit, whatever its origin; and redistribution of these elements by later hydrothermal solutions and by laterization and erosion as mentioned above. In addition, the above factors must all be considered with respect to such controlling structural features as the joint systems in the original country rock and the veins and dikes of the magnetite stockwork.
The collection and preparation of the samples for analysis, that is, channel sampling followed by crushing of the material to minus 20-mesh, may also be a factor that will cause some variation in the TREO: eThO2 ratios. Such treatment of the highly weathered Morro do Ferro material could tend to produce a greater proportion of the finer grain sizes from the more brittle and powdery minerals than

MORRO DO FERRO THORIUM AND RARE-EARTH ORE DEPOSIT D29
from the tougher ones. Subsequent handling of these samples may then cause shifts in the TREO:eThO 2 ratios by the loss of the finer grain sizes through an inadvertent sifting or winnowing process. The increase in TREO over eThO 2 by washing (panning) has already been indicated in the comparison of the two types of DNPM drill-hole samples (table 9).
GRADE AND SIZE OF THE DEPOSIT
Radiometric analyses supplemented by data from surface traversing with radiation-detection equipment and the gamma-ray logging of drill holes indicate the occurrence of a large body of radioactive material at Morro do Ferro, much of which contains 1.0 percent or more eThO 2 . More than 500 samples were analyzed radiometrically. Because the chemical analyses of selected samples show relatively little uranium compared to thorium (table 6), the radiometric analyses have been calculated as percent equivalent thoria (eThO 2).
The near-surface part of the deposit including almost all the ma terial containing 1.0 or more percent eThO 2 is roughly lenticular in plan (fig. 3). This area has an overall horizontal length of about 500 meters. It tapers from a maximum width of about 130 meters near trench 1 northwestward to about 5 meters in trench 5 and south- westward to about 20 meters in trench 4. Further study of the radio- metric data shows that about 50 percent of the near-surface material in the central area contains 1.0 or more percent eThO 2 and the average of all this shallow material is close to 1 percent. Outward from the higher grade zone the radioactivity declines rapidly, although there is generally a halo as much as several tens of meters broad that contains considerable material ranging from 0.5 to 1.0 percent eThO 2 .
The decline of the radioactivity with depth seems to indicate that the higher grade material is confined to the upper 15 meters of the central zone; below this depth such material becomes spotty and pockety and mostly low-grade material is found.
Specific overall eThCh grade calculations of the near-surface ma terial in the central zone and its surrounding halo were calculated using various data sets. The weighted-average grade of the central zone, as calculated from the original trench-sample data (tables 1,2), is 1.14 percent eThCh. When composite trench sample analyses are substituted where available (table 2), this average changes only to 1.16 percent eThO 2 . Similar weighted averages of only the higher grade zones in the trenches within the central area are 1.39 and 1.44 percent eThO 2 , respectively. A weighted-volume composite sample (MF-1020, table 6) and the large beneficiation sample (MF-BX-1, table 6), also representing the higher grade zones of the central area, assayed 1.30 and 1.25 percent eThO 2 respectively, and thus are

D30 URANIUM INVESTIGATIONS IN BRAZIL
closely comparable to the weighted averages of similar material given previously. The weighted-average grade of the near-surface part of the surrounding less-radioactive halo, using the data of selected trench samples, is calculated as 0.57 percent eThO 2.
Calculations with the meager data afforded by the gamma-ray logs of the drill holes show that the average grade of 5-meter depth inter vals in the central zone are 0.97, 0.81, and 0.63 percent eThCh respec tively, for successive depths of 0-5, 5-10, and 10-15 meters. These data also show an average of 1.17 percent eThCh for the depth range of 1-2 meters, a value closely comparable to the averages for the trenches. In the halo area to a depth of about 15 meters, the drill-hole samples contained an average of 0.4-0.5 percent eThO 2 .
The chemical analyses of the higher grade material from the trenches in the central lenticular zone show a weighted average of combined total rare-earth oxides and thoria as 8.13 percent. If the weighted average equivalent thoria (1.44 percent) is assumed to be thoria then the average total rare-earth oxide content is 6.69 percent (table 6). The TREO:ThO2 ratio, 4.6, calculated from these average values, is used for estimating the average total rare-earth oxide content of the material at Morro do Ferro.
The area of the central lenticular zone of the Morro do Ferro deposit is about 37,000 square meters. The surrounding lower grade halo has an area estimated at about 25,000 square meters. Because the specific gravity of this ore is highly variable as it depends chiefly upon the amount of included iron oxides, the average conversion factor for tonnage calculations has been estimated conservatively at 2.5 metric tons per cubic meter. Tonnages based on these data then amount to about 90,000 and 60,000 metric tons per meter of depth for the central and halo areas, respectively.
The Morro do Ferro deposit is estimated, therefore, to contain over a million and a half metric tons of readily available material at depths not exceeding 15 meters. Two-thirds of this tonnage will be in a central richer zone that will average close to 1 percent thoria and 4 percent total rare-earth oxides; the remainder will be in a lower grade halo averaging close to 3^ percent thoria and 1^-2}^ percent total rare-earth oxides.
BENEFICIATION TESTS
In the attempt to segregate the thorium and rare-earth minerals for identification, 10 samples representing possible different lithologic types, variations in grade, and positions within the deposit were separated into numerous fractions and subfractions by several methods of concentration. After some experimental work, a routine treatment for all the samples was selected. In addition to the 10 samples men-

MORRO DO FERRO THORIUM AND RARE-EARTH ORE DEPOSIT D31
tioned above, a split of the large sample (MF-BX-1), taken by the Cia. Geral de Minas for private beneficiation tests, was fractionated by the same routine. Compilation of the data on these sample frac tions gives some measure of the problems to be met in beneficiating the Morro do Ferro ore. The steps taken in this mineralogical con centration routine are given below.
1. Grinding to minus 20-mesh size of a split from field sample.2. Agitation of 100-500 grams of sample from Step 1 in water until
particles appeared dispersed (time of agitation generally 5-10 minutes).
3. Decantation of material in suspension in Step 2 after allowing about a 2-minute settling period.
4. Drying and screening through 80-, 140-, and 200-mesh sieves of material remaining after decantation of fines in Step 3.
5. Separation with bromoform (specific gravity about 2.8) of plus 80-mesh (minus 20-mesh) material from Step 4 into light and heavy fractions.
6. Removal of highly magnetic material from heavier-than-bromoform fraction of Step 5 with Alnico hand magnet.
7. Separation of remaining material from Step 6 into 0.1-, 0.3-, 0.5-, and 0.7-ampere paramagnetic fractions and an essentially non magnetic residue with a Frantz isodynamic separator.
After each step of the separation procedure, the eThO2 content of the resulting fractions was determined. The percentage by weight of each fraction relative to the total weight of the selected split from the field sample (Step 1 of procedure) was also calculated. These data are given in table 10. The variability of the data indicates that although the methods used (sizing, gravity, and magnetic concentra tion) can aid in isolating the radioactive and rare-earth minerals for identification, the application of such methods alone would not be sufficient to provide economic beneficiation of the Morro do Ferro ores.
The causes for all the variations in the radioactivity of the fractions resulting from the attempt to isolate the radioactive and rare-earth minerals are not yet clearly understood. The radioactive material remaining in the fines after washing and screening are such minerals as bastnaesite, cerianite, thorogummite, and the highly altered allanite all of which powder readily during crushing or which occur originally in a more finely divided state. That most of the radioactive minerals have a relatively high specific gravity is shown by their tendency to concentrate in the heavier-than-bromoform fraction. The radioactivity of the plus 80-mesh lighter-than-bromoform fraction is ascribed to the fact that fine-grained heavier particles of the radio-

D32 URANIUM INVESTIGATIONS IN BRAZIL
TABLE 10. Equivalent ihoria content of selected size, specificOS: Original sample (minus 20-mesh).FW: Fine-wash material recovered from decantation in Step 3.CW: Coarse-wash material remaining after deeantation of suspended flues in Step 3.
200: Minus 200-mesh material from Step 4. +200: Plus 200-mesh (minus 140-mesh) material from Step 4. +140: Plus 140-mesh (minus 80-mesh) material from Step 4. +80: Plus 80-mesh (minus 20-mesh) material from Step 4.
BL: Lighter-than-bromoform material from Step 5.
[Upper number for each entry is percent equivalent thoria
Sample
MF- 25 .
279.... .
75
379-
374....
801. ....
445--
446-.
BX-1--
10G
11G
Average o
Location and type
Trench 1; 23.0-24.0 meters NE. of main magnetite dike; 1.0 meter long horizontal channel at base of trench.
Trench 3; 28.2-29.4 meters NE. of SW. end of trench; 1.2 meter long hori zontal channel at base of trench.
Trench 1; 2.6 meters long horizontal chip sample across part of main magnetite dike.
Trench 1; vertical channel in uphill face of trench 32.5 meters NE. of main magnetite dike sample is 0.2 meters long from 0.0-0.2 meters of depth.
Trench 1; same vertical channel as sample MF-379, but from depth of 0.30-0.42 meters below surface.
Vicinity of trench 4; grab sample of float rock.
DNPM adit; grab sample 25± meters from portal.
DNPM adit; grab sample 64± meters from portal.
Small split of composite sample taken by Cia. Qeral de Minas for ore dressing tests.
DNPM adit; grab sample 100± meters from portal.
DNPM adit; grab sample 110± meters from portal,
f all above samples except MF-BX-1
Description
Reddish-brown iron-stained decom posed rock with few magnetite veinlets.
Dark -reddish-brown heavily iron stained decomposed rock with numerous magnetite veinlets.
Chiefly fresh black magnetite rock.
Eluvial concentration of magnetite and other rock at surface ("canga").
Highly bleached white to tan to yellow decomposed rock.
Decomposed float material showing strong yellow-green color suggestive of high rare-earth mineral content.
Brown decomposed rock; may have been coarse grained originally.
Light-yellow to tan decomposed rock.
Brownish decomposed rock.
Brownish decomposed rock.
OS
2.07 100
1.95 100
0.19 100
1.00 100
3.73 100
1.06 100
2.50 100
0.90 100
1.25 100
2.56 100
0.78 100
1.67 100
active minerals were buoyed up by the lighter porous claylike aggre gates. In the fractions of decreasing magnetic susceptibility, the causes for the variations in radioactivity are exceedingly complex because of mineralogic variability. Generally, the allanite, where fresh, is nonmagnetic at 0.1 ampere but magnetic at 0.3 ampere. As the allanite becomes altered to a powdery claylike aggregate, or as the quantity of allanite in such an aggregate decreases, these aggre gates have decreasing magnetic susceptibility.
The radioactivity of at least part of the material in the nonmagnetic fraction after separation at 0.7 ampere on the Frantz separator is considered to be caused by uranium. Chemical analysis of this fraction of sample MF-BX-l snowed 0.056 percent U3O8 , a considerable concentration of uranium over the 0.002 percent U3O8 obtained in the analysis of the original sample. It is believed that the uranium occurs chiefly in zircon, which, in contrast to the other radioactive minerals identified, is concentrated only in the least magnetic fraction. Thus, the variation in the trace amounts of uranium in the samples analyzed

MORRO DO FERRO THORIUM AND RARE-EARTH ORE DEPOSIT D33
gravity, and magnetic fractions of 11 samples from Morro do Ferro
BH: Heavier-than-bromoform material from Step 5.HM: Highly magnetic material from BH-fractioii in Step 6.0.110 *$Q j:^Magnetic fractions (in amperes) obtained by separation with Frautz isodynamic separator in Step 7.o'.7J0.7N: 0.7 ampere nonmagnetic fraction remaining in Step 7.
(eThOa). Italic number is percent of total sample in fraction]
FW
2.3044K
2.2747
0.42m
1.4835
3.6077
1.0941
2.1370
0.8883
1.4556
3.09a?
0.7266
1.8064K
CW
1.56ssyz
1.2653
0.1380
0.8066
3.7423
1.0859
3.4530
1.0117
0.9944
2.1238
0.850 / 34
1.60451A
-200
1.832M
1.76sy20.12' 2
0.952
2.51
1.1S
3.041
0.81
1.20IK3.45
31.22
11.70
2
+200
1.6441A
1.565
0.134
0.873
3.862
1.093
3.063
1.001
1.15^A
3.093
1.002
1.723
+140
1.52sy21.38PA0.15
10
0.848
3.414
0.998
3.046
0.943
1.047
2.695
0.805
1.586K
+80
1.4540
1.1735
0.1464
0.7752
3.5816
1.0045
3.78SO
0.99IS
0.9933
2.2927
0.8426
1.60S4
BL
0.51ey2
1.514
_0
0.806
1.956
0.52
0.9011
0.307
0.73SK
1.1413
0.5016
0.817
BH
1.68ssy2
1.0731
0.1464
0.7546
4.5810
1.0743
7.869
1.865
1.10WA
3.0014
1.3710
2.3427
HM
0.244
0.4819
0.0448
0.3017
0
_0
0.501A
00.39m_
0
00.16
9
0.1
0.703
1.0m0.13
40.45
6
0
_0
1.30/
00.75m1.3
2
00.34
2
0.3
1.10UK
1.25
0.30PA
0.68IS
0
0.3£
4.00Z
1.35/
0.917
2.1641A
1.183
1.21sy2
0.5
2.397
1.8S1A
0.522
1.50m
3.644
0.74
3.60Z
2.27%1A
0.78ey23.62
41A1.28
62.23
41A
0.7
2.943
3.8X
0.60H
2.601
5.144
1.0m12.48
S1.20
/1.85
IK
4.082M
2.25K
3.61IK
0.7N
3.622
5.3K
0.45K
4.60K
6.32£
1.10ssy25.60IK
1.25K
2.75K
5.6K
7.1K
4.09VA
(table 6) could well be due to variations in the amounts of zircon in the original samples.
ECONOMIC OUTLOOK
The thorium and rare-earth deposit at Morro do Ferro offers some promise as a significant source of these elements. Review of the data presented in this report suggests that the near-surface central zone of the deposit will contain, per meter of depth, over a million metric tons of material that averages close to 1 percent thoria and 4 percent total rare-earth oxides. A significant secondary reserve of lower grade material surrounds the higher grade "core" discussed above. The data available indicate that the tonnage of this peripheral zone will exceed half a million tons averaging about ^-percent thoria and, if the TREO: eThO2 ratios of the central zone can be extended outward, about 1K-2K percent total rare-earth oxides. In actuality, no definite outward limit of the "ore body" has yet been established; mining limits will depend upon the selection of an "economic" cutoff grade.

D34 URANIUM INVESTIGATIONS IN BRAZIL
The depths to which these average grades can be maintained is highly problematical and will not be known until considerably more underground data are available. The vertical variability of radio activity, as measured by the gamma-ray logging of open drill holes, suggests a decreasing average grade downward because the quantity of higher grade material becomes more spotty or pockety with depth.
In spite of the apparent decrease in grade with depth, the amount of readily available "ore" must be considered in millions of metric tons. The bulk of this material should be highly amenable to large- scale open-pit development because of its near-surface occurrence and its highly decomposed, lateritic condition. The main obstacles to open-pit mining with large mechanized earth-moving equipment would be the hard, resistant ledges formed by the larger unweathered magne tite dikes. The chief problem in the utilization of the Morro do Ferro ore will be in devising a scheme of benefication or extraction that will permit this material to be competitive with other sources of these elements. The meager data thus far available suggest that attempts to beneficiate the ore solely by physical methods will not be particu larly successful. Doubtless some method of chemical leaching, perhaps in combination with the prior magnetic removal of most of the magne tite and hematite, may prove more feasible.
REFERENCES
Frondel, Clifford, and Marvin, U. B., 1959, Cerianite, CeO 2, from Pocos de Caldas, Brazil: Am. Mineralogist, v. 44, no. 7-8, p. 882-884.
Graham, A. R., 1955, Cerianite, CeO 2, a new rare-earth oxide mineral: Am. Mineralogist, v. 40, no. 7-8, p. 560-564.
Klemic, Harry, Heyl, A. V., Jr., Taylor, A. R., and Stone, Jerome, 1959, Radio active rare-earth deposit at Scrub Oaks mine, Morris County, New Jersey: U.S. Geol. Survey Bull. 1082-B, p. 29-59.
Oliveira, A. I., 1956, Reservas brasileiras de t6rio: Engenharia, Mineracao e Metalurgia, v. 24, p. 163-164.
Teixeira, E. A., 1936, Zirconio no planalto de Pocos de Caldas, Estados de Sao Paulo e Minas Geraes (Brazil): Brasil, Servico Fomento Producao Mineral Avulso 14, 23 p.
1937, Bauxita no planalto de Pocos de Caldas, Estados de Sao Pauloe Minas Geraes (Brasil): Brasil, Servico Fomento Producao Mineral Avulso15, 19 p.
Tolbert, G. E., 1966, The uraniferous zirconium deposits of Pocos de CaldasPlateau, Brazil: U.S. Geol. Survey Bull. 1185-C, 28 p.
Watson, T. L., 1917, Weathering of allanite: Geol. Soc. America Bull., v. 28, p.463-500.
Wedow, Helmuth, Jr., 1961 a, Thorium and rare earths in the Pogos de Caldaszirconium district, Brazil in Short papers in the geologic and hydrologicsciences (Geological Survey research, 1961): U.S. Geol. Survey Prof. Paper424-D, p. D214-D216.
1961b, "Laterization" of allanite in the Morro do Ferro rare-earth and thorium deposit, Pocos de Caldas Plateau, Brazil [abs.]: Geol. Soc. America Spec. Paper 68, p. 293.
U.S. GOVERNMENT PRINTING OFFICE; 1967


