the missouri solid waste composition study baseline waste composition study. this study examined msw...
TRANSCRIPT

The Missouri Solid WasteComposition Study
THE MISSOURI SOLID WASTECOMPOSITION STUDY
Conducted by:
MIDWEST ASSISTANCE PROGRAM, Inc.The Midwestern Rural Community Assistance Program
Funded by a grant from:
THE MISSOURI DEPARTMENT OFNATURAL RESOURCES
Printed on Recycled Paper

ACKNOWLEDGMENTS
The Midwest Assistance Program, Inc. would like to thank the followingindividuals for their contribution to this study:
The Missouri Department of Natural Resources for their technical support andfunding.Jim Hull Director, Solid Waste Management ProgramKathy einsaft Former Chief of the Planning Unit, Solid Waste ManagementProgramDennis Hanson Current Chief of the Planning Unit, Solid Waste ManagementProgramKaty D'Agostino Solid Waste Planner, Solid Waste Management ProgramJohn Balkenbush Chief of Administration Unit, Solid Waste ManagementProgram
David Overfelt, Executive Director of Recycle Missouri, for his assistance inprocuring sorters, and distributing the results to his organization.
The landfill and transfer station managers who provided locations to set up thesorting facility, access to the tipping areas, and other needed assistancc.
The Solid Waste Management District Planners for their help in obtaining wastesorters and providing waste information.
The waste sorters, who worked in all types of inclement weather and difficultconditions to get the results for this study.
Project Manager.....Dennis Siders
MSW Sort Supervisor.....Kristi Wilson

THE MISSOURI WASTE COMPOSITION STUDY
INTRODUCTION
LANDFILLS OBSERVEDBlack Oak Landfill - HartvilleBridgeton Landfill - Bridgeton/St: LouisButler County Landfill - Butler CountyCity of Columbia Landfill - ColumbiaCity of St. Joseph Landfill - St. JosephCourtney Ridge Landfill - Sugar Creek/Kansas CityFred Weber Landfill - Maryland Heights/St. LouisLamar Landfill - LamarLemons Landfill - DexterMaple Hill Landfill - MaconOak Ridge Landfill - West St. Louis CountyPeerless Landfill - Peerless Park/St. LouisRockhill Landfill - Rockhill/St. LouisSoutheast Landfill - Kansas City
SOLID WASTE COMPONENTSMunicipal Solid Waste (MSW)Construction WasteDemolition WasteIndustrial WasteOther Waste
GEOGRAPHICAL VARIATIONSThe Large Metropolitan Waste Component
St. LouisKansas City
The Small Metropolitan Waste ComponentThe Rural Waste Component
SUMMARY
1
3915212733394551576369758187
9393[23127131135
139141141147ISS159
167

List of Tables
The Black Oak LandfillThe Bridgeton LandfillThe Butler County LandfillThe City of Columbia LandfillThe City of St. Joseph LandfillThe Courtney Ridge LandfillThe Fred Weber LandfillThe Lamar LandfillThe Lemons LandfillThe Maple Hill LandfillThe Oak Ridge LandfillThe Peerless C&D LandfillThe Rockhill C&D LandfillThe Southeast (Ke) LandfillMSW Sample SummaryMSW Sort CategoriesMSW Sort DatesMSW Seasonal Results by WeightChanges in MSW Over TimeMSW Seasonal Results by VolumeMSW Potentially Hazardous Waste found in MSWConstruction Waste ComponentsDemolition Waste ComponentsIndustrial Waste ComponentsOther Waste ComponentsSt. Louis Sanitary Landfill ComponentsSt. Louis Landfill ComponentsKansas City Solid Waste ComponentsLarge Metropolitan Solid Waste ComponentsSmall Metropolitan Solid Waste ComponentsRural Solid Waste ComponentsMissouri Solid Waste Components
121824303642485460667278849094979899104116122125129133137142143148152156160168

List of Maps and Charts
Landfills ObservedThe Black Oak LandfillThe Bridgeton LandfillThe Butler County LandfillThe City of Columbia LandfillThe City of St. JosephThe Courtney Ridge LandfillThe Fred Weber LandfillThe Lamar LandfillThe Lemons LandfillThe Maple Hill LandfillThe Oak Ridge LandfillThe Peerless C&D LandfillThe Rockhill C&D LandfillThe Southeast (KC) LandfillSolid Waste Management RegionsMSW Sort LocationsMSW Composition by WeightChanges in MSW over TimeMSW Composition Within Each Solid Waste Management DistrictComparable MSW Composition StudiesMSW Composition by VolumeRelationship between Weight and Volume for MSWConstruction Waste ComponentsDemolition Waste ComponentsIndustrial Waste ComponentsOther Waste ComponentsSt. Louis Landfill ComponentsKansas City Solid Waste ComponentsLarge Metropolitan Solid waste ComponentsSmall Metropolitan Solid Waste ComponentsRural Solid Waste ComponentsRural Solid Waste ComponentsMissouri Solid Waste ComponentsMissouri Solid Waste ComponentsMissouri Solid Waste Components
513192531374349556167737985919596101105109113117119125129133137145149153157163165169171173

INTRODUCTION
The Missouri Waste Composition Study was a three-year effort to characterize and understandsolid waste disposal in Missouri. The study was divided into two phases.
The first phase examined Municipal Solid Waste (MSW) at 19 landfills and transfer stationsthroughout Missouri. Municipal Solid Waste was separated, weighed, and recorded into 26material categories. The methodology used, and the findings of phase I begin on page 93.
The second phase observed solid waste received at 14 Missouri landfills (actually 15 landfillswere observed but the scale data from the Lee's Summit landfill was not useable and thereforethat data is not included). Each solid waste load was classified into one of five components(Municipal Solid Waste, Construction, Demolition, Industrial, and Other waste) and thepercentage of each material, within that component, was visually estimated and recorded. Themethodology and findings of phase II begin on page 3.
Purpose of the StudyThe Missouri Waste Composition Study was commissioned for the following reasons:• Provide Information on changes in the Missouri solid waste components. In the 1987
Environmental Improvement and Energy Resources Authority (EIERA) commissioned alimited baseline waste composition study. This study examined MSW at four locations in1987and estimated industrial waste based on SIC data. A comparison of the two wastecomponents composition studies is listed on Pg. 113.
• Provide an estimate of the volume of recyclable materials still in the Missouri solid waste.The percentage of recyclable materials presently disposed into Missouri landfills offersopportunities for future recycling and waste reductions effOlts.
• Provide data for the formulation of a statewide solid waste plan. The waste compositiondata provides detailed information, which is essential in planning solid waste policy for thenext decade.
• Provide information on the current solid waste components which can be used by grantapplicants to estimate available waste materials used by state agencies to evaluate grantapplications, and by solid waste planners to target waste materials for future funding.
• Provide essential information for municipal and private recycling programs. Municipal andprivate recycling companies can use the data to predict material flows, route collectionvehicles, plan processing and end market capacities, project revenues and operating expenses,and target educational materials.
Funding, Development, and ImplementationThe Missouri Waste Composition Study was funded through grants from the MissouriDepartment of Natural Resources (DNR). The methodology for the study was developed jointlyby the DNR Solid Waste Planners and the Midwest Assistance Program, Inc.(MAP). MAPconducted the study under the direction of Dennis Siders, Project Manager.
I

LANDFILLS OBSERVED
Landfill observation was actually the second phase of The Missouri Waste Composition Study.The hand sOlting and categorizing of MSW was done prior to observing the landfills. However itis necessary to identify and understand the percentage each of the solid waste components(MSW, Construction, Demolition, Industrial, and. Other) before examining the componentsseparately. Therefore, phase II (landfill observations) will be discussed before phase I (MSWcharacterization).
The ProblemMany studies have been conducted throughout the United States to determine MSWcomposition. Some of these are discussed on page Ill. However MSW is only one componentof the overall solid waste problem. Until the entire solid waste component is examined andquantified, the volume of anyone component cannot be accurately estimated. After completingphase I (MSW) it was known how much of each material was in Missouri's MSW component.For instance, about 18.7% of the MSW was food waste. But what did that percentage mean andwhat percentage of the total waste stream was MSW food waste?
Each landfill and transfer station reports their total waste received to DNR each quarter. Afterestimating impOlt and export waste, DNR publishes a report on the total waste disposed inMissouri. However, it cannot be assumed that 18.7% of this total is food waste because the totalis not exclusively MSW. There are other components of the waste stream included in the total.But how do we know what portion each of these components comprise, and what materials makeup these other components?
MethodologySeveral studies have been conducted to determine the composition of solid waste. Many stateshave conducted MSW waste sorts with methodologies similar to those used in phase I (page 93).This is a great way to characterize the MSW component but does not quantify the MSWcomponent (40% - 90% of the local waste stream), or characterize the remaining solid wastecomponents.
Franklin and Associates have developed a methodology to estimate waste flows based onproduction data. This method assumes that every manufactured item has a limited life cycle andthen becomes waste. This methodology works great for national or international wasteprojections, but become less useful on a smaller scale.
The Missouri Waste Composition Study determined that the best way to estimate wastecomponents (not waste generation or recovery) delivered to Missouri landfills, and the materialswithin these components, was to observe and record waste unloaded at Missouri landfills.
3

Landfill SelectionAs of June lSI 1999, Missouri had 30 active landfills. Fifteen landfills were selected as beingrepresentative of all Missouri landfills (The City of Lee's Summit Landfill was observed but thedata was not useable due to errors in the scale software program). The 14 observed landfills arelisted below with the tonnage they received in 1998. A map of the 14 landfills, that wereobserved, is on page 5.
LandfillsOhst'rvedBlack OakBridgetonButler CountyCity of ColumbiaCity of St. JosephCourtney RidgeFred WeberLamarLemonsMaple HillOak RidgePeerless C&DRockhill C&DSoutheastTotal observed landlills
City of Lee's Summit*City of Springfic1d**14 rural landfills (not observed)***2 C&D landfills (not observed)****Total unobserved landfills
Total for all Missouri Landfills (1998)
1998Tonnage283,475913,621122,185125,867120,158418,625321,269168,591196,092114,982262,365146,249123,849348,2603,665,588
80,682101,284628,51212,557
823,035
4,488,623
% of TotalState Tonnage6.3%20.4%2.7%2.8%2.7%9.3%7.2%3.8%4.4%2.6%5.8%3.3%2.8%7.8%81.7%
1.8%2.3%13.9%00.3%18.3%
100%
*The City of Lee's Summit landfill was observed but the scale data was not useable. A weightedaverage from Southeast and Courtney Ridge was used to estimate waste composition.**The City of Springfield's landfill was not observed. Demographics and waste contracts aresimilar to the City of St. Joseph and therefore the waste composition was estimated to be similarto the City of St. Joseph Landfill.***A weighted average from the 5 rural landfills, which were observed, was used to estimatewaste composition.**** A weighted average from the 2 C&D landfills which were observed was used to estimatewaste composition.
4
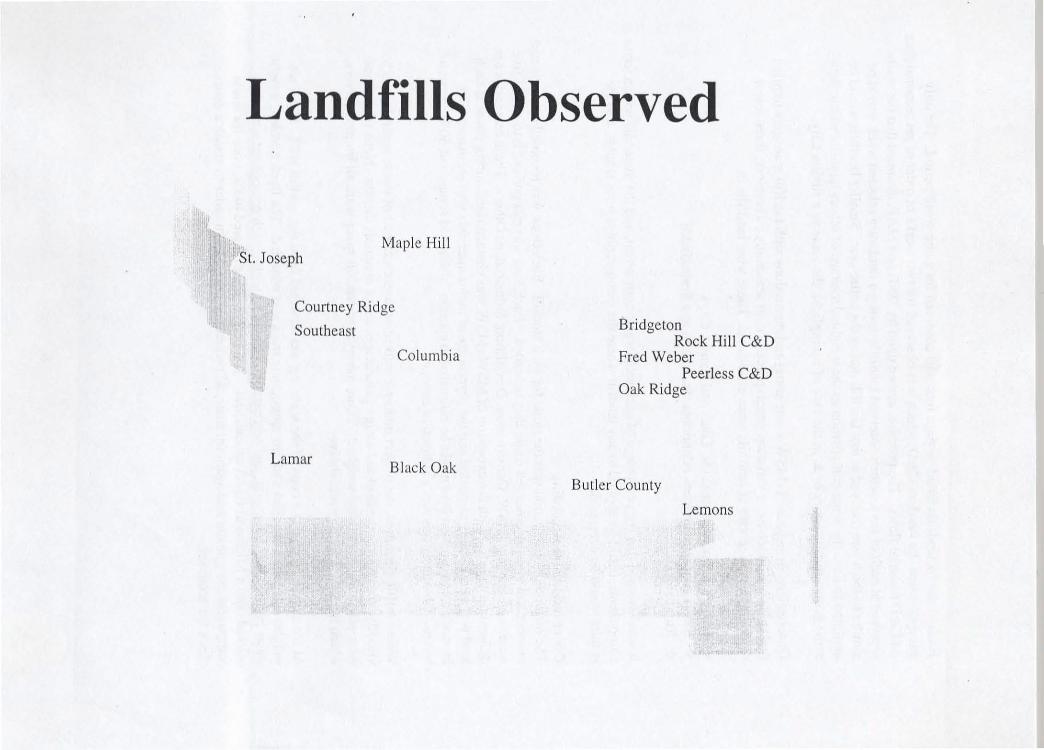
Landfills Observed
"'St. JosephMaple Hill
Courtney Ridge
Southeast
Columbia
BridgetonRock Hill C&D
Fred WeberPeerless C&D
Oak Ridge
Lamar Black OakButler County
Lemons
Each of the 14 landfills listed on page four was observed for a one-week period. The onlyexception was the Peerless C&D, which was observed for two weeks in order to get seasonal dataon C&D material flows. The premise, agreed upon by D R and MAP, assumed that the wastereceived at each of the fourteen observed landfills during a randomly selected week would besimilar to the waste received at that landfill during the entire year. Smaller landfills would beassumed to have the same composition as the weighted average of others landfills within theirsame geographic category or as in the case of Springfield, the same as a similar City.
Observations from phase I (MSW waste sorts) and discussions with landfill managers impliedthat there was much more variation geographically than seasonally. Therefore, three majordemographic categories of landfills were established. These were landfills in:
.:. Large metropolitan areas (St. Louis and Kansas City)
.:. Small metropolitan areas (Columbia, St. Joseph and Springfield)
.:. Rural areas
It was assumed that the percentage of each solid waste component, and the materials within thosecomponents, could be applied to any landfill where the demographics were similar, and theresults would be acceptable.
Observation and RecordingThe method of observation was the same for each landfill. Each truck was recorded by name andnumber and visually observed while they unloaded. Each load was categorized into one of fivewaste components (MSW, Construction, Demolition, Industrial, or Other). These categories aredefined on page 7. With the exception of MSW (MSW was characterized during phase I) eachload was also visually inspected and the percentage of major materials was estimated. Forinstance a construction load might be estimated to contain 50% wood scraps and 50% dry wallscraps. Obviously this was a subjective estimate.
Where traffic permitted, the project manager walked around each load of waste several times tovisually characterize the load and assign percentages to the materials therein. None of the loadswere physically sorted and weighed. Time, money, and landfill space were all limiting factors,which made this activity prohibitive.
At the close of each day a copy of the scale log was obtained from the landfill staff. The scaleweights were then matched with the appropriate truck and recorded. The truck number, weight,waste component assignment, and percentage of materials within each component were thenentered onto a Microsoft Excel spreadsheet. All weights were entered twice, once for wastecomponent assignment and again for material percentage estimates in order to assure a doublecheck for accuracy.
6
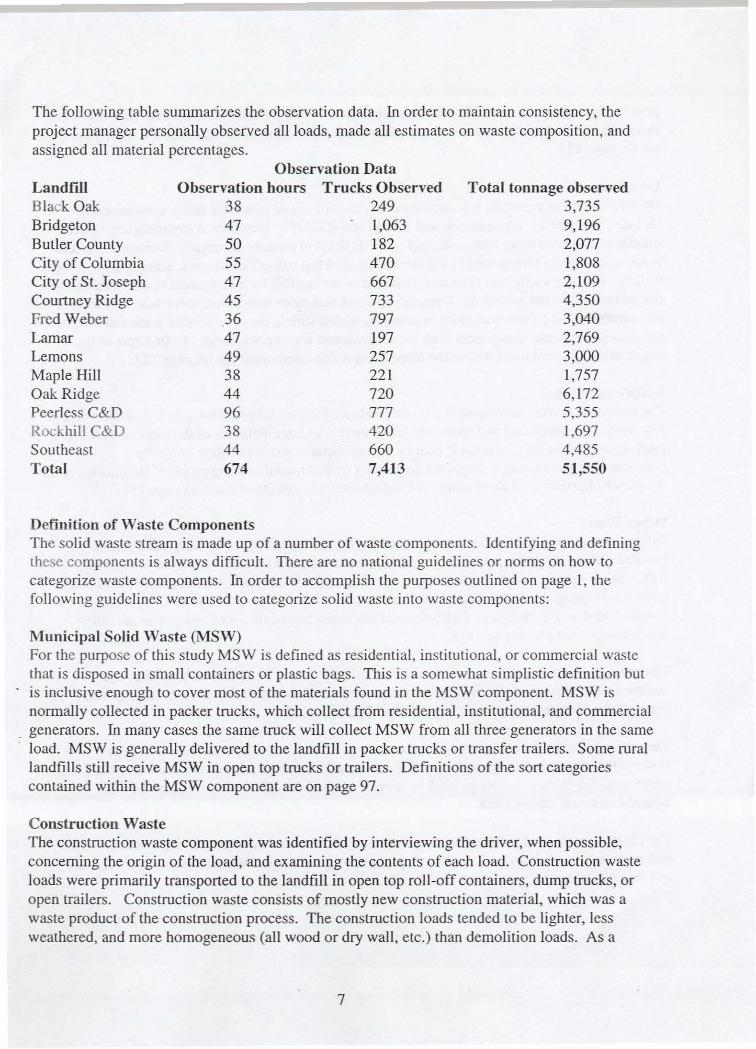
The following table summarizes the observation data. In order to maintain consistency, theproject manager personally observed all loads, made all estimates on waste composition, andassigned all material percentages.
Observation DataLandfillBlack OakBridgetonButler CountyCity of ColumbiaCity of St. JosephCourtney RidgeFred WeberLamarLemonsMaple HillOak RidgePeerless C&DRockhill C&DSoutheastTotal
Observation hours384750554745)647493844963844674
Trucks Observed2491,0631824706677337971972572217207774206607,413
Total tonnage observed3,7359,1962,0771,8082,1094,3503,0402,7693,0001,7576,1725,3551,6974,48551,550
Definition of Waste ComponentsThe solid waste stream is made up of a number of waste components. Identifying and definingthese components is always difficult. There are no national guidelines or norms on how tocategorize waste components. In order to accomplish the purposes outlined on page 1, thefollowing guidelines were used to categorize solid waste into waste components:
Municipal Solid Waste (MSW)For the purpose of this study MSW is defined as residential, institutional, or commercial wastethat is disposed in small containers or plastic bags. This is a somewhat simplistic definition butis inclusive enough to cover most of the materials found in the MSW component. MSW isnormally collected in packer trucks, which collect from residential, institutional, and commercialgenerators. In many cases the same truck will collect MSW from all three generators in the sameload. MSW is generally delivered to the landfill in packer trucks or transfer trailers. Some rurallandfills still receive MSW in open top trucks or trailers. Definitions of the sort categoriescontained within the MSW component are on page 97.
Construction WasteThe construction waste component was identified by interviewing the driver, when possible,concerning the origin of the load, and examining the contents of each load. Construction wasteloads were primarily transported to the landfill in open top roll-off containers, dump trucks, oropen trailers. Construction waste consists of mostly new construction material, which was awaste product of the construction process. The construction loads tended to be lighter, lessweathered, and more homogeneous (all wood or dry wall, etc.) than demolition loads. As a
7

general rule construction waste materials are easier to recover and recycle than demolition wastematerials. Definitions of the major materials contained within the construction waste componentare on page 123.
Demolition WasteDemolition waste materials are similar to construction waste materials and are traditionallyincluded together as "construction and demolition (C&D)". Demolition materials are older,usually mixed with other materials, and more difficult to recover or recycle. Demolition wasteloads were usually transported to the landfill in open top roll-off containers, dump trucks, or opentrailers. Roofing waste was typically delivered to the landfill by independent contractors and wasnot mixed with other materials. Demolition wood was more weathered, there was very little ifany cardboard, and there was more masonry materials (brick, concrete blocks, rock and dirt) inthe demolition waste component than the construction waste component. Definitions of themajor materials contained within the demolition waste component are on page 127.
Industrial WasteThe industrial waste component is a waste product of industrial processing or industrial activity.Materials were identified and estimated when there was large volumes of the same material in apacker, compactor unit, or roll-off container. Industrial waste loads were n01l11allyhomogeneous, containing a single waste product from a manufacturing process. Definitions ofthe major materials contained within the industrial waste component are on page 131.
Other WasteOther waste is defined as waste which does not fit into one of the above categories or washandled differently at the landfill (i.e. soil-like materials used for daily cover, asbestos, etc.).Bulky items such as furniture, mattresses, appliances, bicycles, shelving etc. are included in theother waste category. Commercial yard waste such as brush, stumps, sewage sludge, and hay arealso included in this category. Definitions of the major materials contained within the otherwaste component are on page 135
The results of each landfill observation are included on pages 9- 92. Each landfill profilecontains a description of the facility, information about the observation period, tonnage andpercentages of waste received during the observation period.
The summary table in each profile lists the tonnage of each material received during theobservation period and the percentage of that material. The Percentages are applied to the totalwaste received by that facility in 1998 to provide an estimate of the total tonnage for eachmaterial received during 1998.
The charts in each profile illustrate the percentage of each waste component for that facility, thematerials received within each waste component and percentage comparisons to other landfillsand the state average.
8