the meat atlas
Post on 13-Sep-2014
1.065 views
DESCRIPTION
The predictions for protein demand and its impacts on meat production is going to require extraordinary innovation. The global population is predicted to reach 9 billion by 2050, both demand and prices for meat are set to double, and analysts predict demand will outpace The Meat Atlas, a new report and graphic guide produced by the Heinrich Böll Foundation, leverages data to highlight the devastating effects of global meat and dairy production, on everything from water pollution to obesity.TRANSCRIPT
MEAT ATLASFacts and fi gures about the animals we eat
IMPRINT/IMPRESSUM
The MEAT ATLAS is jointly published by the Heinrich Böll Foundation, Berlin, Germany, and Friends of the Earth Europe, Brussels, Belgium
Executive editors: Christine Chemnitz, Heinrich Böll FoundationStanka Becheva, Friends of the Earth Europe
Managing editor: Dietmar BartzArt director: Ellen Stockmar
English editor: Paul MundyCopy editor: Elisabeth Schmidt-Landenberger Proofreader: Maria LanmanResearch editors: Bernd Cornely, Stefan Mahlke
Contributors: Michael Álvarez Kalverkamp, Wolfgang Bayer, Stanka Becheva, Reinhild Benning, Stephan Börnecke, Christine Chemnitz, Karen Hansen-Kuhn, Patrick Holden, Ursula Hudson, Annette Jensen, Evelyn Mathias, Heike Moldenhauer, Carlo Petrini, Tobias Reichert, Marcel Sebastian, Shefali Sharma, Ruth Shave, Ann Waters-Bayer, Kathy Jo Wetter, Sascha Zastiral
Editorial responsibility (V. i. S. d. P.): Annette Maennel, Heinrich Böll Foundation
This publication is written in International English. First Edition, January 2014
Production manager: Elke Paul, Heinrich Böll Foundation
Printed by möller druck, Ahrensfelde, GermanyClimate-neutral printing on 100 percent recycled paper.
Except for the copyrighted work indicated on pp.64–65, this material is licensed under Creative Commons “Attribution-ShareAlike 3.0 Unported“ (CC BY-SA 3.0). For the licence agreement, see http://creativecommons.org/licenses/by-sa/3.0/legalcode, and a summary (not a substitute) at http://creativecommons.org/licenses/by-sa/3.0/deed.en.
This publication has been produced with the financial assistance of the Development Fields project, funded by the European Commission. The contents of this report are the sole responsibility of Friends of the Earth Europe and the Heinrich Boell Foundation and can under no circumstances be regarded as reflecting the position of the European Commission.
FOR ORDERS AND DOWNLOADHeinrich Böll Foundation, Schumannstr. 8, 10117 Berlin, Germany, www.boell.de/fleischatlas Friends of the Earth Europe, www.foeeurope.org/meat-atlas
MEAT ATLASFacts and figures about the animals we eat
2014
MEAT ATLAS4
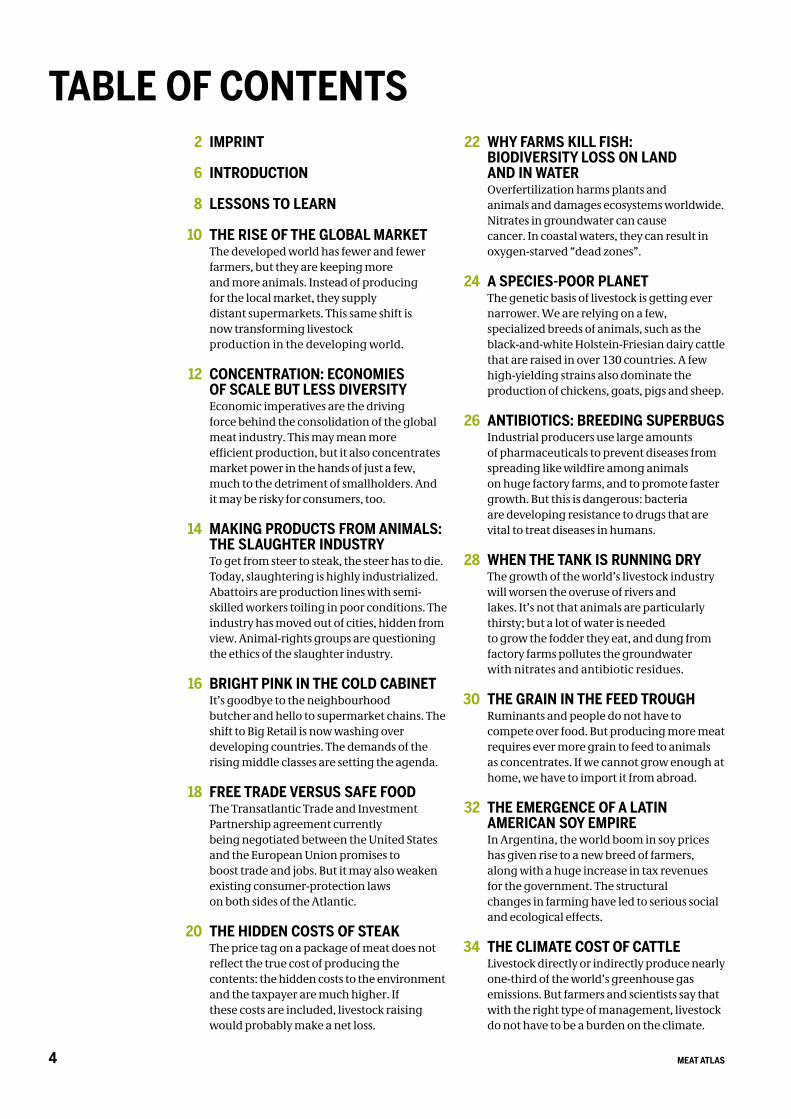
TABLE OF CONTENTSIMPRINT
INTRODUCTION
LESSONS TO LEARN
THE RISE OF THE GLOBAL MARKETThe developed world has fewer and fewer farmers, but they are keeping more and more animals. Instead of producing for the local market, they supply distant supermarkets. This same shift is now transforming livestock production in the developing world.
CONCENTRATION: ECONOMIES OF SCALE BUT LESS DIVERSITYEconomic imperatives are the driving force behind the consolidation of the global meat industry. This may mean more efficient production, but it also concentrates market power in the hands of just a few,much to the detriment of smallholders. And it may be risky for consumers, too.
MAKING PRODUCTS FROM ANIMALS:THE SLAUGHTER INDUSTRYTo get from steer to steak, the steer has to die. Today, slaughtering is highly industrialized. Abattoirs are production lines with semi-skilled workers toiling in poor conditions. The industry has moved out of cities, hidden from view. Animal-rights groups are questioning the ethics of the slaughter industry.
BRIGHT PINK IN THE COLD CABINETIt’s goodbye to the neighbourhood butcher and hello to supermarket chains. The shift to Big Retail is now washing over developing countries. The demands of the rising middle classes are setting the agenda.
FREE TRADE VERSUS SAFE FOODThe Transatlantic Trade and Investment Partnership agreement currently being negotiated between the United States and the European Union promises to boost trade and jobs. But it may also weaken existing consumer-protection laws on both sides of the Atlantic.
THE HIDDEN COSTS OF STEAKThe price tag on a package of meat does not reflect the true cost of producing thecontents: the hidden costs to the environment and the taxpayer are much higher. If these costs are included, livestock raising would probably make a net loss.
WHY FARMS KILL FISH: BIODIVERSITY LOSS ON LAND AND IN WATEROverfertilization harms plants and animals and damages ecosystems worldwide. Nitrates in groundwater can cause cancer. In coastal waters, they can result in oxygen-starved “dead zones”.
A SPECIES-POOR PLANETThe genetic basis of livestock is getting ever narrower. We are relying on a few, specialized breeds of animals, such as the black-and-white Holstein-Friesian dairy cattle that are raised in over 130 countries. A few high-yielding strains also dominate the production of chickens, goats, pigs and sheep.
ANTIBIOTICS: BREEDING SUPERBUGSIndustrial producers use large amounts of pharmaceuticals to prevent diseases from spreading like wildfire among animals on huge factory farms, and to promote faster growth. But this is dangerous: bacteria are developing resistance to drugs that are vital to treat diseases in humans.
WHEN THE TANK IS RUNNING DRYThe growth of the world’s livestock industry will worsen the overuse of rivers and lakes. It’s not that animals are particularly thirsty; but a lot of water is needed to grow the fodder they eat, and dung from factory farms pollutes the groundwater with nitrates and antibiotic residues.
THE GRAIN IN THE FEED TROUGHRuminants and people do not have to compete over food. But producing more meat requires ever more grain to feed to animals as concentrates. If we cannot grow enough at home, we have to import it from abroad.
THE EMERGENCE OF A LATIN AMERICAN SOY EMPIREIn Argentina, the world boom in soy prices has given rise to a new breed of farmers, along with a huge increase in tax revenues for the government. The structural changes in farming have led to serious social and ecological effects.
THE CLIMATE COST OF CATTLELivestock directly or indirectly produce nearly one-third of the world’s greenhouse gas emissions. But farmers and scientists say that with the right type of management, livestock do not have to be a burden on the climate.
22
24
26
28
30
32
34
2
6
8
10
12
14
16
18
20
5MEAT ATLAS
RANCHERS IN THE RAINFORESTIn Brazil’s Amazon region, the world’s second-largest herd of cattle meets the world’s biggest rainforest. This is bad news for the forest. First come the loggers, then come the ranchers.
THE GLYPHOSATE IN YOUR BURGERIf pesticides, herbicides or medicines leave unwanted residues in meat, milk and eggs, we end up consuming them too. Gaps in research leave uncertainty about what glyphosate – a weedkiller used when growing genetically modified soybeans – does to our bodies. Legal loopholes mean we may be eating it without knowing it.
A PLETHORA OF POULTRY: CHICKENSTAKE THE LEADIn developed countries, consumption of chicken is surpassing that of beef, and chicken production is now highly industrialized. Demand in Asia is rising fast, and people who refuse pork and beef are happy to eat chicken.
WHERE KEEPING CHICKENSIS WOMEN’S WORKMany women in Africa and Asia are forced to be dependent on their husbands for big decisions. A few hens, chicks and eggs can build their confidence and self-reliance. Their contribution to the meat supply is often underestimated.
IMPORTED CHICKEN WINGS DESTROY WEST AFRICAN BUSINESSESEuropean poultry firms are not permitted to turn slaughter by-products into animal feed. So they export them to developing countries and sell them cheap. Broiler farms in Ghana and Benin have gone bankrupt.
DISQUIET IN THE DEVELOPED WORLDDemand for meat in the developed world has peaked, and is beginning to declineslowly. Consumers’ worries about food safety are reinforced by scandals in the industry. The industry is trying to improve its image with marketing ploys, but consumers are confused and the product is not necessarily any better.
HALF A BILLION NEW MIDDLE-CLASS CONSUMERS FROM RIO TOSHANGHAIBrazil, Russia, India, China and South Africa – the BRICS – are five big developing countries that are setting out from different starting points. They may not end up with the food consumption patterns of the industrialized West.
URBAN LIVESTOCK KEEPINGFor many, urban livestock is a contradiction in terms. Isn’t livestock-raising a rural activity, and don’t cities ban livestock because of the smell, noise and pollution? Yet urban livestock are crucial for the livelihoods of many poor city dwellers. And they provide nutritious food at lower prices than their country cousins.
TURNING SCRUB INTO PROTEINMuch of the world’s livestock, and much of its meat, milk and eggs, are raised by non-industrial producers. Many of themmanage their animals on land that is unsuited for crops, optimizing the use of local resources. But the existence of these producers is under increasing threat.
IN SEARCH OF GOOD FOODConcerned consumers in the rich world face a dilemma. They want good-quality meat that is produced in an environmentally friendly, ethical manner. How best to ensure this? Here we look at some alternatives.
VEGETARIANISM: MANY ROOTS,MANY SHOOTSOnly a small percentage of the population in the industrialized world describe themselves as vegetarians or vegans. Such lifestyles are more common in parts of the world where religions play a major role. In most faiths, followers are expected to abstain from meat in one way or another.
WHAT TO DO AND HOW TO DO IT: INDIVIDUALS AND GROUPSGiven all the problems with livestock production and meat consumption, is there anything that normal people can do? Yes: individuals can make choices about their consumption patterns, and groups can push for change.
A GREENER POLICY FOR EUROPEThe EU’s Common Agricultural Policy (CAP) has for decades supported, and distorted, farm production. It has evolved from supporting large-scale production to taking the environment increasingly into account. But problems remain. A greener CAP could promote socially and ecologically sound livestock production.
AUTHORS AND SOURCES FOR DATA AND GRAPHICS
RESOURCES
ABOUT US
26 topicsand 80 graphics
on how we produceand cosume
meat
50
52
54
56
58
60
62
64
66
36
38
40
42
44
46
48
MEAT ATLAS6
INTRODUCTION
F ood is very personal. It is not just a need. Food often embodies certain feelings: familiarity, relaxation, routine, or even stress. We eat in
different types of situations and have our own, very personal preferences.
At the same time, however, we are more and more alienated from what is on our plates, on the table and in our hands. Do you sometimes wonder where the steak, sausage or burger you are eating comes from? Personal satisfaction reflects ethical decisions, and private concerns can be very po-litical in nature. Each of us ought to decide what we want to eat. But responsible consumption is something that an increasing number of people demand. Then again, they need information on which to base their decisions.
How can normal consumers understand the global impact caused by their meat consumption? How many people realize that our demand for meat is directly responsible for clearing the Ama-zon rainforest? Who is aware of the consequences of industrial livestock production for poverty and hunger, displacement and migration, animal wel-fare, or on climate change and biodiversity?
N one of these concerns are visible on the meat and sausage packages in the super-market. On the contrary, big agribusinesses
try to play down the adverse effects of our high meat consumption. Advertising and packaging in developed countries convey an image of happy animals on happy farms. In reality, the suffering the animals endure, the ecological damage and the social impacts are swept under the carpet.
One in every seven people in the world does not have adequate access to food. We are a long way from realizing the internationally recognized right to quantitatively and qualitatively sufficient food. On the contrary, almost a billion people in the world go hungry, largely because the middle classes’ craving for meat creates large-scale, inten-sive livestock and food industries.
In many countries, consumers are fed up with being deluded by the agribusiness. Instead of us-ing public money to subsidize factory farms – as in the United States and European Union – con-sumers want reasonable policies that promote ecologically, socially and ethically sound livestock production. As a result, a central concern of the Heinrich Böll Foundation is to provide informa-tion about the effects of meat production and to offer alternatives.
W hile governments in the developed world have to radically change course and strug-gle against the power of the agricultural
lobby, developing countries can avoid repeating the mistakes made elsewhere. If they know about the effects of intensive meat production, they can plan for a future-oriented form of production that is socially, ethically and environmentally respon-sible. Instead of trying to export their failed model, Europe and the United States should attempt to show that change is both necessary and possible.
There are alternatives. Meat can be produced by keeping animals on pasture instead of in build-ings, and by producing feed locally rather than shipping it thousands of kilometres. Manure does not have to burden nature and the health of the local population; it can be spread on the farmer’s own fields to enrich the soil.
Our atlas invites you to take a trip around the world. It gives you insights into the global connec-tions made when we eat meat. Only informed, crit-ical consumers can make the right decisions and demand the political changes needed.
Barbara UnmüßigPresident, Heinrich Böll Foundation
In many countries, consumers are fed up with being deluded by the
agribusiness. Instead of using public money to subsidize factory farms – as in the United States and European Union –, consumers want reasonable policies that promote ecologically, socially and ethically sound livestock production.
THERE ARE ALTERNATIVES„
7MEAT ATLAS
F ood is a necessity, an art, an indulgence. But the global system for producing food is broken. While people in some parts of the
world do not have enough to eat, others suffer from obesity. Millions of tonnes of food are wasted and thrown away, and perversely, crops are con-verted into biofuels to feed cars in Europe and the Americas.
At the same time, the natural world upon which we all depend is being damaged and de-stroyed. Ecological limits are being stretched as our demand for ever more resources takes prec-edence over the need to protect biodiversity and the Earth’s vital ecosystems. Forests and precious habitats are being cleared to make way for vast monocultures to supply industrialized countries. Farming is being intensified and wildlife wiped out at unprecedented rates.
O ver the past 50 years, the global food sys-tem has become heavily dependent on cheap resources, chemical sprays and
drugs. It is increasingly controlled by a handful of multinational corporations. The social impacts of this system are devastating: small-scale farmers worldwide are driven off their land, both obesity and food poverty are rife, and taxpayers and citi-zens are increasingly footing the bill for one food crisis after another. In this corporate-controlled food system, profits always come before people and planet.
Nothing epitomizes what is wrong with our food and farming more than the livestock sector and the quest for cheap and plentiful meat. Many of the world’s health pandemics in the past years have stemmed from factory farms. Livestock rais-ing is one of the biggest greenhouse gas emitters, and is responsible for the use of huge amounts of the world’s grain and water. Worldwide, livestock are increasingly raised in cruel, cramped condi-tions, where animals spend their short lives un-der artificial light, pumped full of antibiotics and growth hormones, until the day they are slaugh-tered.
What is truly scandalous is that it doesn’t have to be like this. We produce enough calories in the world to feed everyone, even with an increasing global population. We know how to farm with-out destroying the environment and without im-posing cruel conditions on the animals we breed, without corporate-owned and controlled seeds
and chemicals. Sustainable farming exists in which farmers produce meat and dairy products from numerous smaller farms, grow their own crops to feed their animals, and allow animals to graze freely.
There are millions of local markets, and nu-merous small, innovative food companies. There is huge public support for sustainable farming: people are building an alternative global food sys-tem that is based on food sovereignty, and ensures everyone’s right to safe, nutritious, sustainable and culturally appropriate food.
There is increasing international recognition that the current industrialized and corporate-led system is unsustainable and doomed to fail. We need a radical overhaul of food and farming if we want to feed a growing world population without destroying the planet. This system needs to have food sovereignty at its heart.
T his publication sheds light on the impacts of meat and dairy production, and aims to catalyse the debate over the need for better,
safer and more sustainable food and farming. We hope to inspire people to look at their own con-sumption, and politicians at all levels to take ac-tion to support those farmers, processors, retailers and networks who are working to achieve change.
As a species, we need to be smarter. It is time to acknowledge that the corporate-controlled food system is broken. It is time to curtail the power of those vested interests that want to keep it. Revolu-tionizing the way we produce and consume meat is just the start. We need to create a world where we use natural resources in a more efficient way. We need to ensure these resources are fairly dis-tributed, and that everyone on this planet, both today and tomorrow, has access to safe, sufficient, sustainable and nutritious food.
Magda StoczkiewiczDirector, Friends of the Earth Europe
The current industrialized and corporate-led system is doomed
to fail. We need a radical overhaul of food and farming if we want to feed a growing world population without destroying the planet.
CATALYZING THE DEBATE„
MEAT ATLAS8
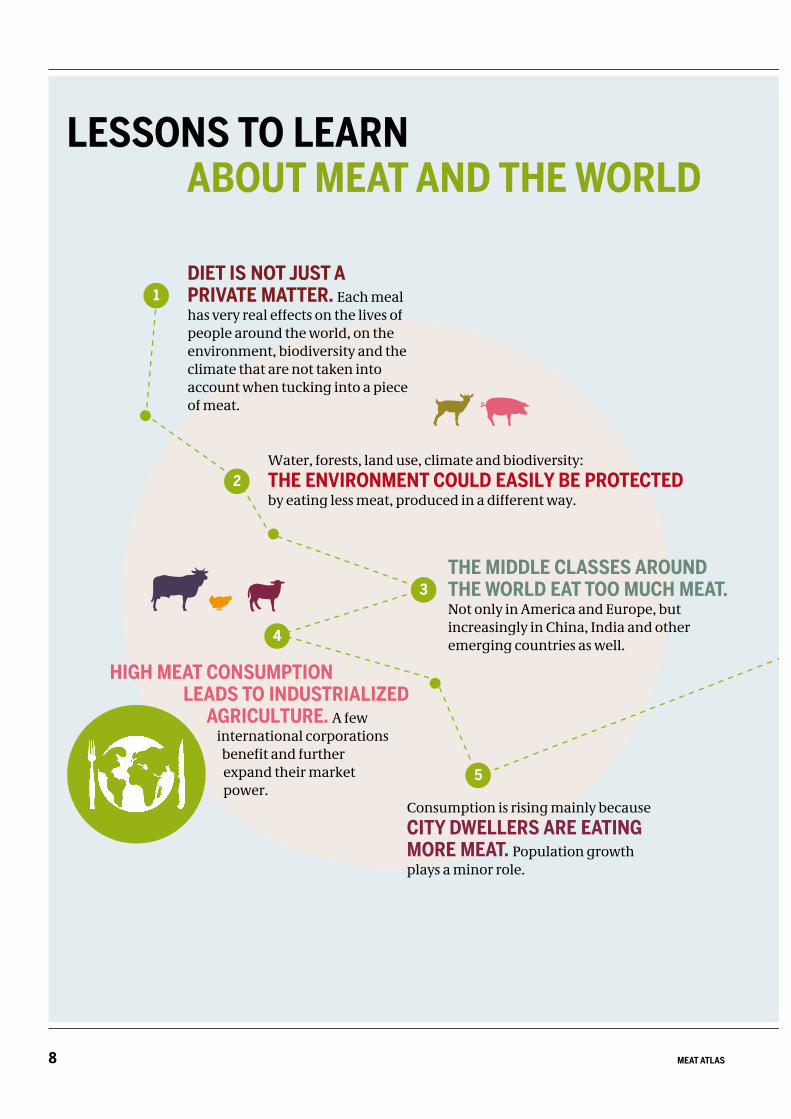
DIET IS NOT JUST A PRIVATE MATTER. Each meal has very real effects on the lives of people around the world, on the environment, biodiversity and the climate that are not taken into account when tucking into a piece of meat.
THE MIDDLE CLASSES AROUND THE WORLD EAT TOO MUCH MEAT. Not only in America and Europe, but increasingly in China, India and other emerging countries as well.
Consumption is rising mainly because CITY DWELLERS ARE EATING MORE MEAT. Population growth plays a minor role.
HIGH MEAT CONSUMPTION LEADS TO INDUSTRIALIZED
AGRICULTURE. A few international corporations
benefit and further expand their market power.
Water, forests, land use, climate and biodiversity:
THE ENVIRONMENT COULD EASILY BE PROTECTED by eating less meat, produced in a different way.
1
2
5
4
LESSONS TO LEARN ABOUT MEAT AND THE WORLD
3
9MEAT ATLAS
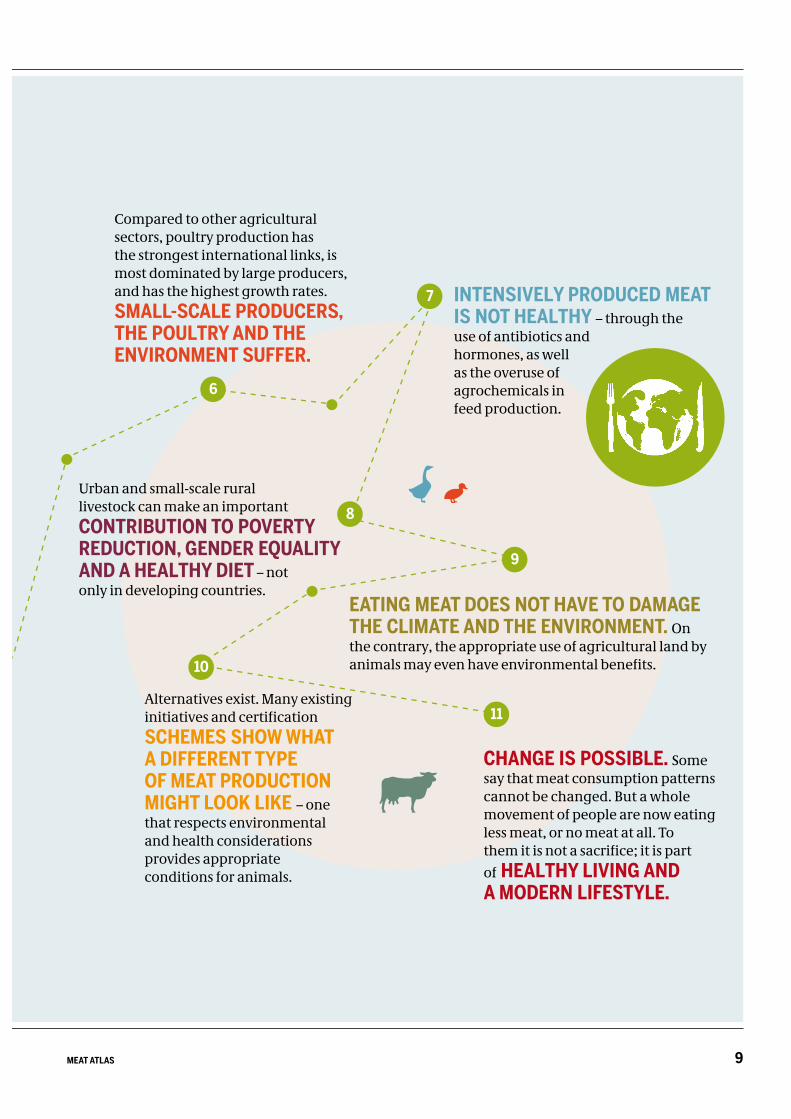
CHANGE IS POSSIBLE. Some say that meat consumption patterns cannot be changed. But a whole movement of people are now eating less meat, or no meat at all. To them it is not a sacrifice; it is part
of HEALTHY LIVING AND A MODERN LIFESTYLE.
Compared to other agricultural sectors, poultry production has the strongest international links, is most dominated by large producers, and has the highest growth rates.
SMALL-SCALE PRODUCERS, THE POULTRY AND THE ENVIRONMENT SUFFER.
INTENSIVELY PRODUCED MEAT IS NOT HEALTHY – through the use of antibiotics and hormones, as well as the overuse of agrochemicals in feed production.
EATING MEAT DOES NOT HAVE TO DAMAGE THE CLIMATE AND THE ENVIRONMENT. On the contrary, the appropriate use of agricultural land by animals may even have environmental benefits.
Alternatives exist. Many existing initiatives and certification
SCHEMES SHOW WHAT A DIFFERENT TYPE OF MEAT PRODUCTION MIGHT LOOK LIKE – one that respects environmental and health considerations provides appropriate conditions for animals.
7
9
10
11
6
8
Urban and small-scale rural livestock can make an important
CONTRIBUTION TO POVERTY REDUCTION, GENDER EQUALITY AND A HEALTHY DIET – not only in developing countries.
MEAT ATLAS10
O verall, the global demand for meat is grow-ing, but at different rates in different re-gions. In Europe and the United States, the
biggest meat producers in the 20th century, con-sumption is growing slowly, or is even stagnating. On the other hand, the booming economies in Asia and elsewhere, will see around 80 percent of the growth in the meat sector by 2022. The biggest growth will be in China and India because of huge demand from their new middle classes.
The pattern of production is following suit. South and East Asia are undergoing the same rap-
id transformation that occurred in many indus-trialized countries several decades ago. In the 1960s in Europe and the USA, many animals were kept in small or medium-sized herds on grazing land. They were slaughtered and pro-
cessed on the farm or in an abattoir nearby. Meat and sausage were produced in the same lo-
cality or region. Today, this mode of livestock pro-duction has almost died out. In the USA, the num-ber of pig raisers fell by 70 percent between 1992 and 2009, while the pig population remained the same. During the same period, the number of pigs sold by a farm rose from 945 to 8,400 a year. And the slaughter weight of an animal has gone up from 67 kilograms in the 1970s, to around 100 kilograms today.
In China, more than half the pigs are still pro-duced by smallholders. This is changing fast. The same technologies and capital investments that dominate livestock production in the developed world are penetrating developing countries – and they are integrated in global value chains. When a piglet is born, its fate is already sealed: in which
supermarket, in which town, and with what type of marketing its pork chops will be sold.
But the production conditions are now very different from before. Industrial livestock pro-duction in Europe and the USA began when feed, energy and land were inexpensive. Nowadays, all three are scarce and costs have gone up. As a re-sult, total meat production is growing less quickly than before. The market is growing only for pigs and poultry. Both species utilize feed well and can be kept in a confined space. This means that they can be used to supply the insatiable demand for cheap meat. By 2022, almost half the additional meat consumed will come from poultry.
Beef production, on the other hand, is scarcely growing. The USA remains the world’s largest beef producer, but the meat industry describes the sit-uation there as dramatic. For 2013, it expects a fall of 4-6 percent compared to 2012 and predicts the decline to continue in 2014. In other traditional producing regions including Brazil, Canada and Europe, production is stagnating or falling.
The star of the day is India, thanks to its buffalo meat production, which nearly doubled between 2010 and 2013. India is forcing its way onto the world market, where 25 percent of the beef is in fact now buffalo meat from the subcontinent. Ac-cording to the US Department of Agriculture, In-dia became the world’s biggest exporter of beef in 2012 – just ahead of Brazil. Buffaloes are inexpen-sive to keep. This makes their meat a dollar a kilo cheaper than beef from cattle. In addition, the Indian government has invested heavily in abat-toirs. Faced with the high price of feed, Brazilian cattle-raisers are switching to growing soybeans.
The developed world has fewer and fewer farmers, but they are keeping more and more animals. Instead of producing for the local market, they supply distant supermarkets. This same shift is now transforming livestock production in the developing world.
THE RISE OF THE GLOBAL MARKET
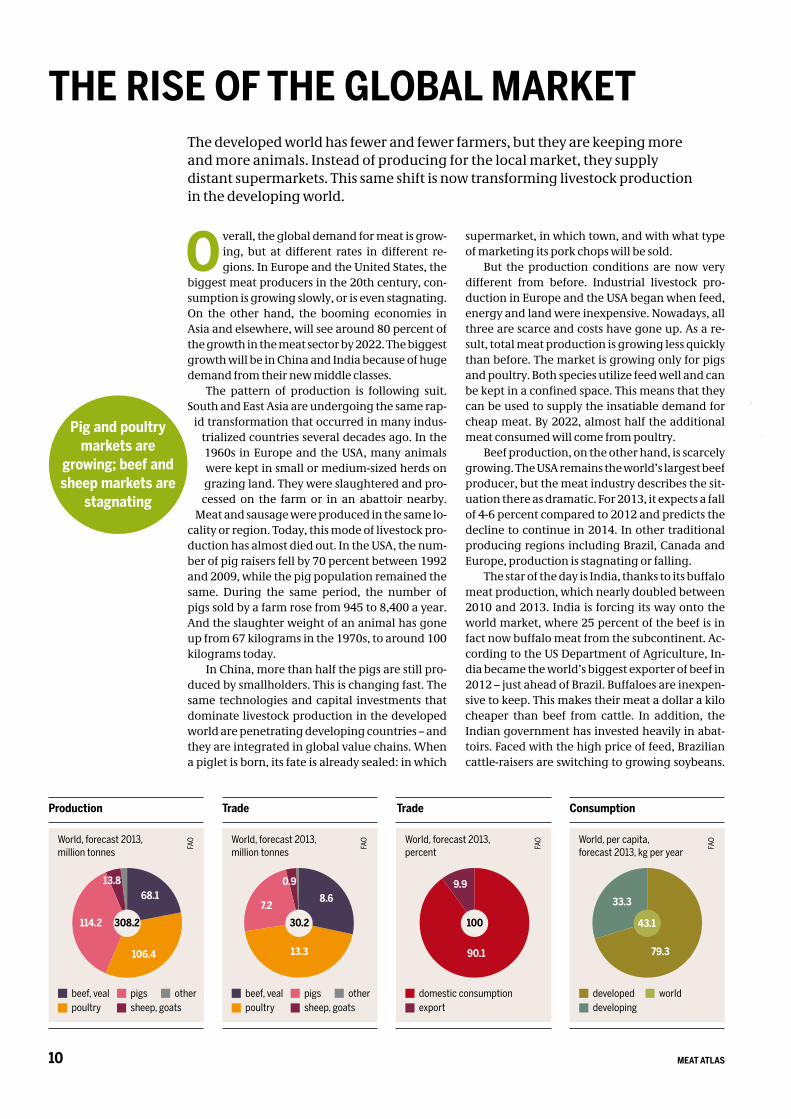
Pig and poultry markets are
growing; beef and sheep markets are
stagnating
Consumption
World, per capita, forecast 2013, kg per year
Trade
World, forecast 2013,million tonnes
Trade
World, forecast 2013,percent
Production
World, forecast 2013,million tonnes
106.4
114.2
68.113.8
13.3
7.28.6
0.9 9.9
90.1
FAO
FAO
FAO
FAO
308.2 30.2 100
79.3
33.3
43.1
beef, veal poultry
pigssheep, goats
other domestic consumptionexport
developed developing
worldbeef, veal poultry
pigssheep, goats
other
11MEAT ATLAS
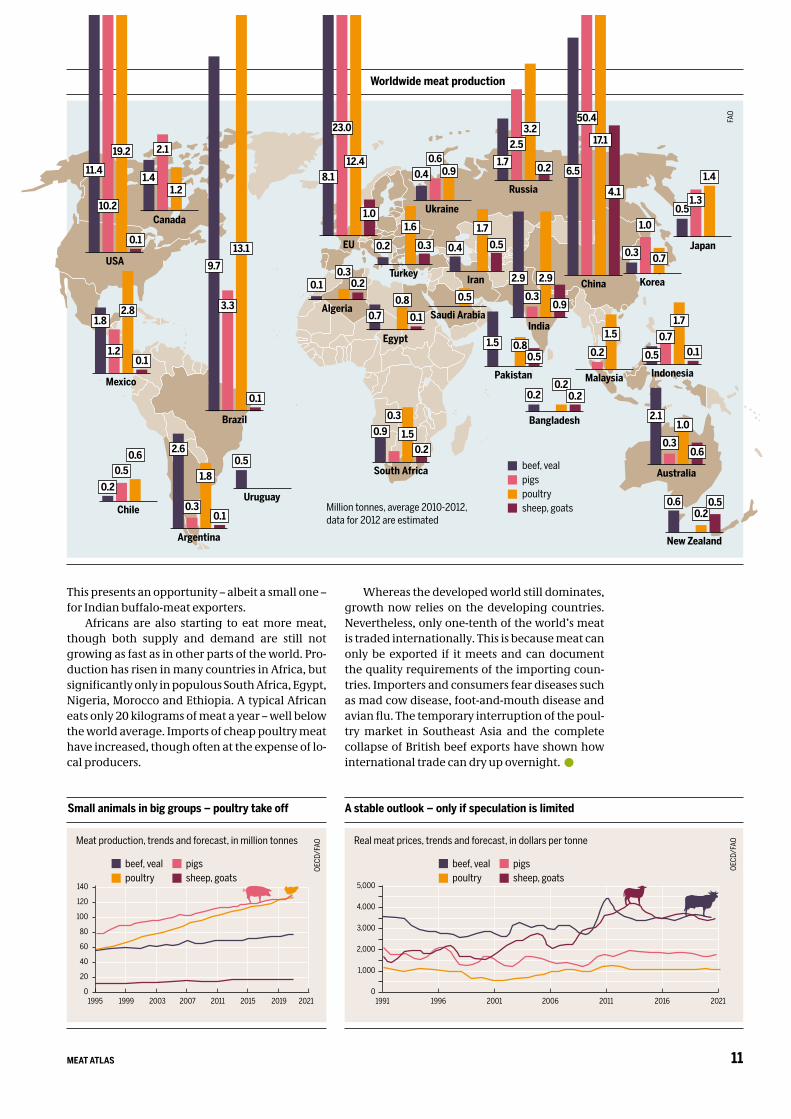
This presents an opportunity – albeit a small one – for Indian buffalo-meat exporters.
Africans are also starting to eat more meat, though both supply and demand are still not growing as fast as in other parts of the world. Pro-duction has risen in many countries in Africa, but significantly only in populous South Africa, Egypt, Nigeria, Morocco and Ethiopia. A typical African eats only 20 kilograms of meat a year – well below the world average. Imports of cheap poultry meat have increased, though often at the expense of lo-cal producers.
Whereas the developed world still dominates, growth now relies on the developing countries. Nevertheless, only one-tenth of the world’s meat is traded internationally. This is because meat can only be exported if it meets and can document the quality requirements of the importing coun-tries. Importers and consumers fear diseases such as mad cow disease, foot-and-mouth disease and avian flu. The temporary interruption of the poul-try market in Southeast Asia and the complete collapse of British beef exports have shown how international trade can dry up overnight.
Small animals in big groups – poultry take off
Meat production, trends and forecast, in million tonnes
OECD
/FAO
A stable outlook – only if speculation is limited
Real meat prices, trends and forecast, in dollars per tonne
1991 1996 2001 2006 2011 2016 20210
1,000
2,000
3,000
4,000
5,000
OECD
/FAO
1995 1999 2003 2007 2011 2015 20190
20
40
60
80
100
120
140
2021
Worldwide meat production
Million tonnes, average 2010-2012, data for 2012 are estimated
FAO
beef, veal poultry
pigssheep, goats
Canada
2.1
1.41.2 Russia
1.7
3.2
0.2
2.5
Ukraine
0.60.4 0.9
New Zealand
0.60.2
0.5
South Africa
0.30.9 1.5
0.2
USA
11.4
19.2
0.1
10.2
Chile
0.5
0.2
0.6
Uruguay
0.5
Egypt
0.70.8
0.1
Korea
1.0
0.3 0.7
Saudi Arabia
0.5
Indonesia
0.5
1.7
0.10.7
EU
8.112.4
1.0
23.0
India
2.9 2.9
0.90.3
Malaysia
1.5
0.2
Pakistan
1.5 0.80.5
Iran
1.7
0.50.4
Turkey
0.2
1.6
0.3
Algeria
0.10.3
0.2
Argentina
2.6
1.8
0.10.3
Brazil
9.7
13.1
0.1
3.3
Mexico
1.82.8
0.11.2
Bangladesh
0.20.2
0.2
China
6.5
17.1
4.1
50.4
Australia
2.11.0
0.60.3
Japan
0.5
1.4
1.3
beef, vealpigspoultrysheep, goats
beef, veal poultry
pigssheep, goats
MEAT ATLAS12
I n September 2013, Shuanghui International Holdings Ltd. – the largest shareholder of Chi-na’s biggest meat processor – completed a 7.1
billion-dollar purchase of US-based Smithfield Foods, Inc., the world’s biggest pork producer. The sale exemplifies a new kind of consolidation that is happening across borders. The direction of invest-ment is changing: it is now heading North from the global South. This reflects related shifts in
economic growth, consumer demand, manage-ment skills and corporate assertiveness over the last two decades.
JBS SA, a beef company based in Brazil, set the stage in the late 2000s, when it acquired
meat companies and poultry producers in the United States, Australia and Europe, as well as
in Brazil. JBS is now the world’s biggest producer of beef. With its 2013 acquisition of Seara Brasil, a unit of rival company Marfrig Alimentos SA, it is also the world’s largest chicken producer. JBS is among the world’s top ten international food and beverage companies, with food sales amounting to 38.7 billion dollars in 2012.
It also has business units in leather, pet prod-ucts, collagen and biodiesel. Though JBS is not a household name, its annual food revenues are higher than those of major global food players such as Unilever, Cargill and Danone. These fig-ures give us an idea of what JBS’s size means on the
ground or at the slaughterhouse: its worldwide capacities can slaughter 85,000 head of cattle, 70,000 pigs, and 12 million birds. Every day. The meat is distributed in 150 countries as soon as the carcasses are “disassembled” , i.e. when the flesh is separated from the bone.
Because profit margins are tight in the meat business, companies chase after economies of scale. This means that they try to produce more with greater efficiency and at a lower cost. For this reason, the meat sector is concentrating in two senses. Companies are getting bigger through mergers and acquisitions – expanding across bor-ders and across species. And meat production is intensifying, so that more animals are housed to-gether and are processed more quickly and with less waste. However, some market analysts point out that the meat business is inherently risky and that, based on recent financial performance, the multi-species strategy may be backfiring due to different cultures and processes that pose chal-lenges to newcomers. In other words, knowing how to grow, slaughter, process and transport cat-tle may not translate easily into managing poultry operations.
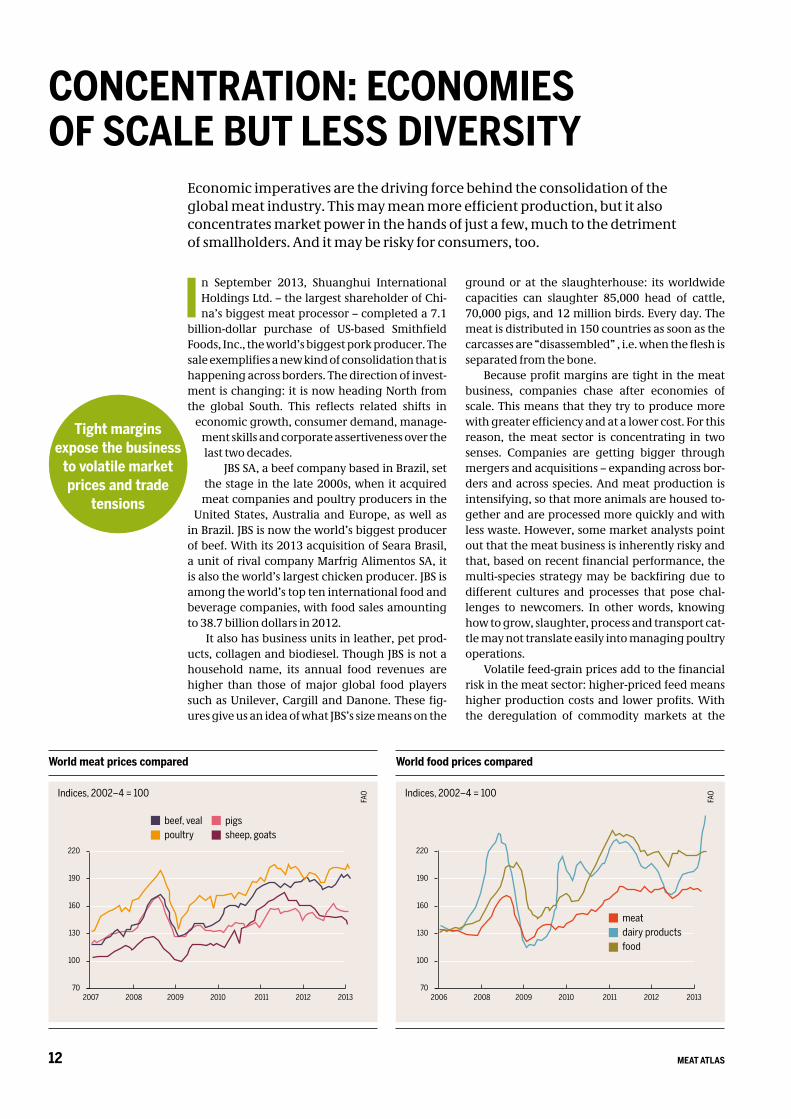
Volatile feed-grain prices add to the financial risk in the meat sector: higher-priced feed means higher production costs and lower profits. With the deregulation of commodity markets at the
World meat prices compared
Indices, 2002–4 = 100
FAO
World food prices compared
Indices, 2002–4 = 100
FAO
FAO
Economic imperatives are the driving force behind the consolidation of the global meat industry. This may mean more efficient production, but it also concentrates market power in the hands of just a few, much to the detriment of smallholders. And it may be risky for consumers, too.
CONCENTRATION: ECONOMIES OF SCALE BUT LESS DIVERSITY
Tight margins expose the business
to volatile market prices and trade
tensions
2007 2009 2010 2011 201270
100
130
160
190
220
2008 2013 2006 2009 2010 2011 201270
100
130
160
190
220
2008 2013
beef, veal poultry
pigssheep, goats
meatdairy productsfood
13MEAT ATLAS
turn of the 21st century, feed prices have become less dependent on supply and demand, and more dependent on the speculative market manipula-tions that create price spikes. Add to that the role biofuels have had on prices for soy and maize, and the volatility in the price of fertilizers. Goldman Sachs, an investment bank and titan of commodity trading, was ever-present in the Shuanghui-Smith-field deal. It had been hired to advise Smithfield on any potential sale, and it owns a 5 percent stake in Shuanghui. In 2012, Goldman made an estimated 1.25 billion dollars from commodity trading.
Why does size matter? The implications of the meat industry’s two-tiered concentration – corpo-rate consolidation and the intensification of meat production – are wide-ranging. It is virtually im-possible for the consolidated industry to coexist with small producers. These multinational struc-tures both wipe out a critical source of income for the global poor, and they radically diminish consumer choices. Through economies of scale, concentration offers greater profit potential for stockholders and financiers; for other stakehold-ers, however, it increases risks to human health
(including antibiotic resistance), food safety, ani-mal welfare, the environment, water security, la-bour security and innovation.
Extreme efficiency itself also carries a risk. One cattle feedlot operator in the United States says that he is unsure where the economies of scale end, because 100,000-head feedlots for cattle are now possible. Several exist in the United States and their production costs are lower than for smaller feedlots. Logistics in large production units are manageable nowadays, but the larg-er the system, the more vulnerable it is. In an in-tensified environment, for example, pathogens can spread more quickly and easily from one animal to another, both on the feedlot and during transport. The same is true for the slaughterhouse as the speed of processing increases. Furthermore, in the event of a disaster, such as a flood, the sys-tem will not be able to maintain its capacity. And if consumer demand declines, companies run with a low margin of safety may risk collapse. There-fore, insurance companies with custom-tailored risk assessments are becoming an important part of the modern meat business.
Consumers may get lower prices, but the
risks to societyare higher
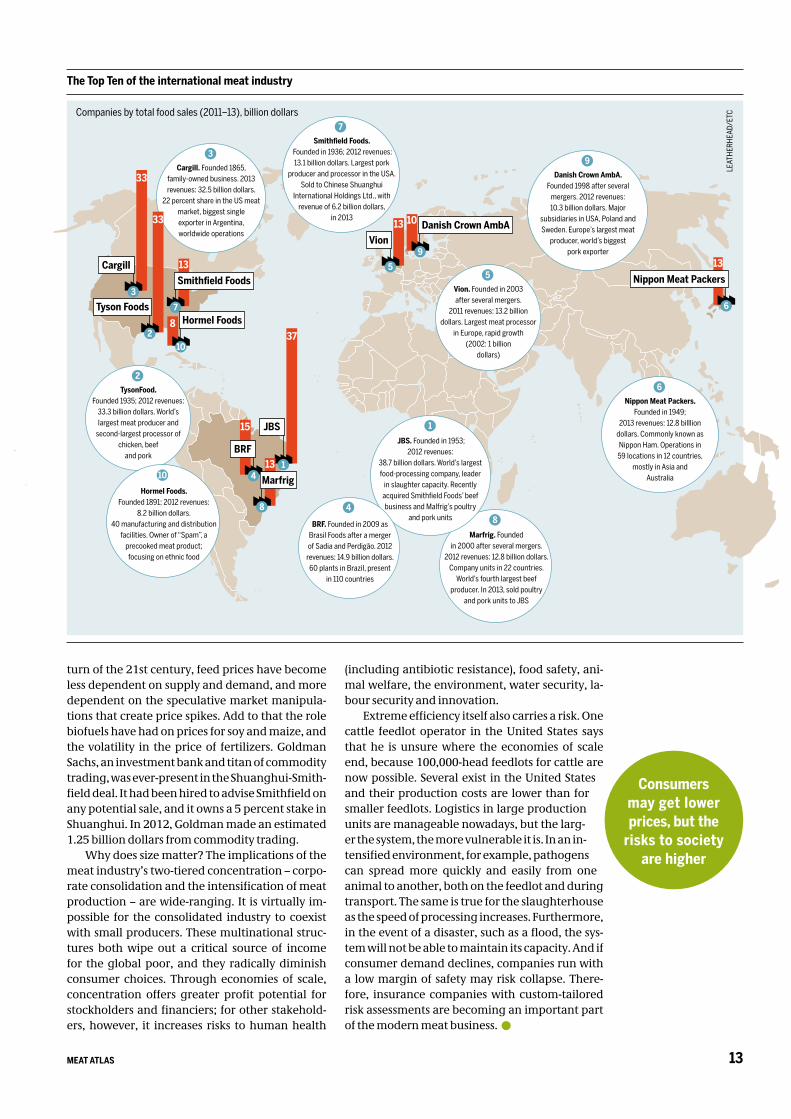
The Top Ten of the international meat industry
Companies by total food sales (2011–13), billion dollars
LEAT
HERH
EAD/
ETC
33
Cargill
3
13Vion
5
15
BRF
4
JBS
1
37
13Nippon Meat Packers
6
13Smithfield Foods
7
13Marfrig
8
10 Danish Crown AmbA
9
8 Hormel Foods
10
Marfrig. Founded in 2000 after several mergers.
2012 revenues: 12.8 billion dollars. Company units in 22 countries.
World’s fourth largest beef producer. In 2013, sold poultry
and pork units to JBS
8
JBS. Founded in 1953; 2012 revenues:
38.7 billion dollars. World’s largest food-processing company, leader
in slaughter capacity. Recently acquired Smithfield Foods’ beef business and Malfrig’s poultry
and pork units
1
BRF. Founded in 2009 as Brasil Foods after a merger of Sadia and Perdigão. 2012 revenues: 14.9 billion dollars. 60 plants in Brazil, present
in 110 countries
4
Vion. Founded in 2003 after several mergers.
2011 revenues: 13.2 billion dollars. Largest meat processor
in Europe, rapid growth (2002: 1 billion
dollars)
5
TysonFood. Founded 1935; 2012 revenues:
33.3 billion dollars. World’s largest meat producer and
second-largest processor of chicken, beef
and pork
2
Hormel Foods. Founded 1891; 2012 revenues:
8.2 billion dollars. 40 manufacturing and distribution
facilities. Owner of “Spam”, a precooked meat product; focusing on ethnic food
10
Nippon Meat Packers. Founded in 1949;
2013 revenues: 12.8 billlion dollars. Commonly known as Nippon Ham. Operations in 59 locations in 12 countries,
mostly in Asia and Australia
6
Danish Crown AmbA. Founded 1998 after several
mergers. 2012 revenues: 10.3 billion dollars. Major
subsidiaries in USA, Poland and Sweden. Europe’s largest meat
producer, world’s biggest pork exporter
9Cargill. Founded 1865,
family-owned business. 2013 revenues: 32.5 billion dollars.
22 percent share in the US meat market, biggest single exporter in Argentina, worldwide operations
3Smithfield Foods.
Founded in 1936; 2012 revenues: 13.1 billion dollars. Largest pork
producer and processor in the USA. Sold to Chinese Shuanghui
International Holdings Ltd., with revenue of 6.2 billion dollars,
in 2013
7
33
Tyson Foods
2
MEAT ATLAS14
A t the start of the 20th century, Chicago was the cradle of the slaughter industry. Using moving production lines, it took just 15
minutes for a cow to be killed, fully eviscerated and cut up. Up to 12 million animals were slaugh-tered annually in the city: this method was so effi-cient that Henry Ford adopted the production-line process to make cars.
With industrialization, the slaughter pro-cess has become centralized worldwide. Dur-ing the Great Depression of the twenties, several dominant conglomerates emerged in the United
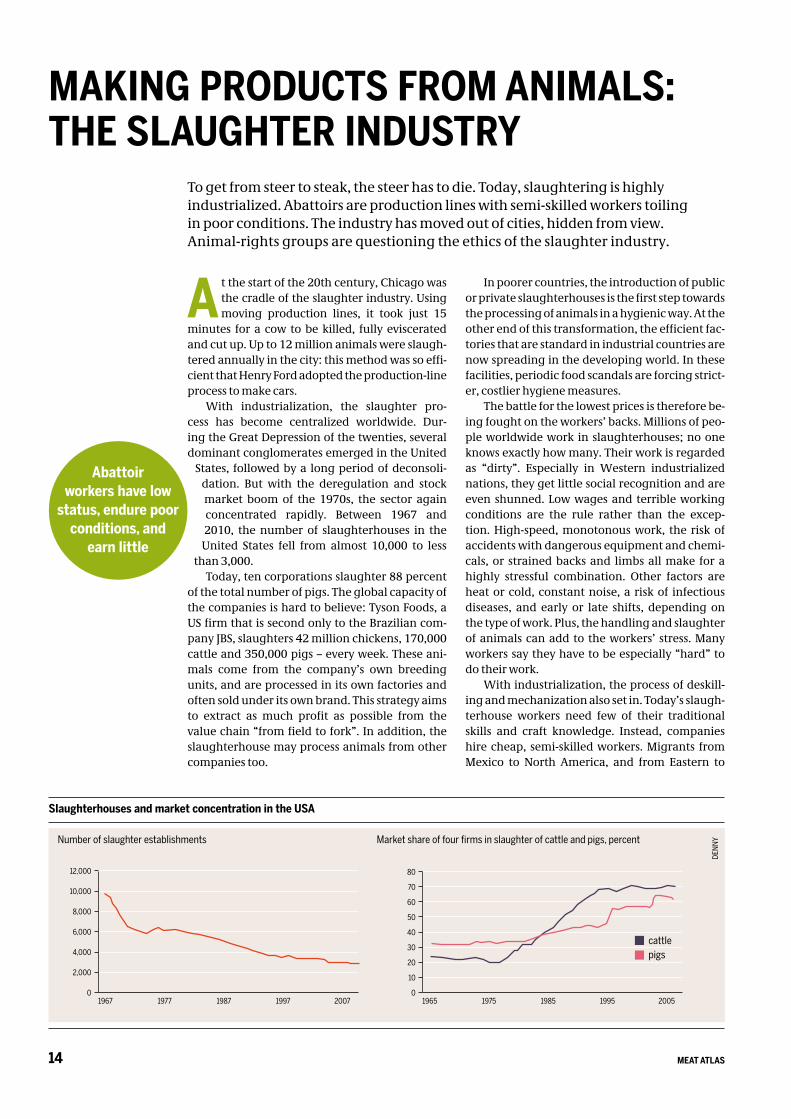
States, followed by a long period of deconsoli-dation. But with the deregulation and stock market boom of the 1970s, the sector again concentrated rapidly. Between 1967 and 2010, the number of slaughterhouses in the
United States fell from almost 10,000 to less than 3,000.
Today, ten corporations slaughter 88 percent of the total number of pigs. The global capacity of the companies is hard to believe: Tyson Foods, a US firm that is second only to the Brazilian com-pany JBS, slaughters 42 million chickens, 170,000 cattle and 350,000 pigs – every week. These ani-mals come from the company’s own breeding units, and are processed in its own factories and often sold under its own brand. This strategy aims to extract as much profit as possible from the value chain “from field to fork”. In addition, the slaughterhouse may process animals from other companies too.
In poorer countries, the introduction of public or private slaughterhouses is the first step towards the processing of animals in a hygienic way. At the other end of this transformation, the efficient fac-tories that are standard in industrial countries are now spreading in the developing world. In these facilities, periodic food scandals are forcing strict-er, costlier hygiene measures.
The battle for the lowest prices is therefore be-ing fought on the workers’ backs. Millions of peo-ple worldwide work in slaughterhouses; no one knows exactly how many. Their work is regarded as “dirty”. Especially in Western industrialized nations, they get little social recognition and are even shunned. Low wages and terrible working conditions are the rule rather than the excep-tion. High-speed, monotonous work, the risk of accidents with dangerous equipment and chemi-cals, or strained backs and limbs all make for a highly stressful combination. Other factors are heat or cold, constant noise, a risk of infectious diseases, and early or late shifts, depending on the type of work. Plus, the handling and slaughter of animals can add to the workers’ stress. Many workers say they have to be especially “hard” to do their work.
With industrialization, the process of deskill-ing and mechanization also set in. Today’s slaugh-terhouse workers need few of their traditional skills and craft knowledge. Instead, companies hire cheap, semi-skilled workers. Migrants from Mexico to North America, and from Eastern to
To get from steer to steak, the steer has to die. Today, slaughtering is highly industrialized. Abattoirs are production lines with semi-skilled workers toiling in poor conditions. The industry has moved out of cities, hidden from view. Animal-rights groups are questioning the ethics of the slaughter industry.
MAKING PRODUCTS FROM ANIMALS: THE SLAUGHTER INDUSTRY
Abattoir workers have low
status, endure poorconditions, and
earn little
Slaughterhouses and market concentration in the USA
Number of slaughter establishments
DENN
YMarket share of four firms in slaughter of cattle and pigs, percent
1967 1977 1987 1997 20070
2,000
4,000
6,000
8,000
10,000
12,000
1965 1975 1985 1995 20050
10
20
30
40
50
60
70
80
cattlepigs
15MEAT ATLAS
Western Europe work in the slaughterhouses for short periods, and are largely defenceless against the companies’ demands. Back in the 1960s, la-bour unions in the meat industry were still strong; in the last two decades they have had a much harder time. Workers have little say in their work conditions, and collective wage agreements are unknown in most parts of the world.
In most industrial countries, the slaughter-houses have been relocated from the cities to the rural periphery. The cruelty of slaughtering and images of blood and squealing animals have to be hidden from consumers’ eyes and ears. This re-fl ects a modern social norm: violence is banished from public view. Slaughtering and butchery are made invisible for the majority. The connection between the meat and the living animal that is trucked to town and dies in the slaughterhouse has been severed. What most consumers now see
is only a vacuum-packed meat product on a su-permarket shelf.
Finally, the treatment of animals in slaughter-houses is subject to criticism on two fronts. The animal welfare movement objects to frequent violations of regulations and cruelty to animals, such as long transports, inadequate anaesthesia, or the beating of animals when they are driven in the slaughterhouse.
The animal rights movement, on the other hand, criticizes the mass-slaughter of animals as a matter of principle: it says that meat pro-duction is always associated with violence against animals. Animal rights activists do not want to reform slaughter; they want to abolish it altogether. They say that the meat industry re-gards animals as mere products, whereas society should recognize their individuality and capacity for suffering.
We severed the link between
living animals and the packaged
products
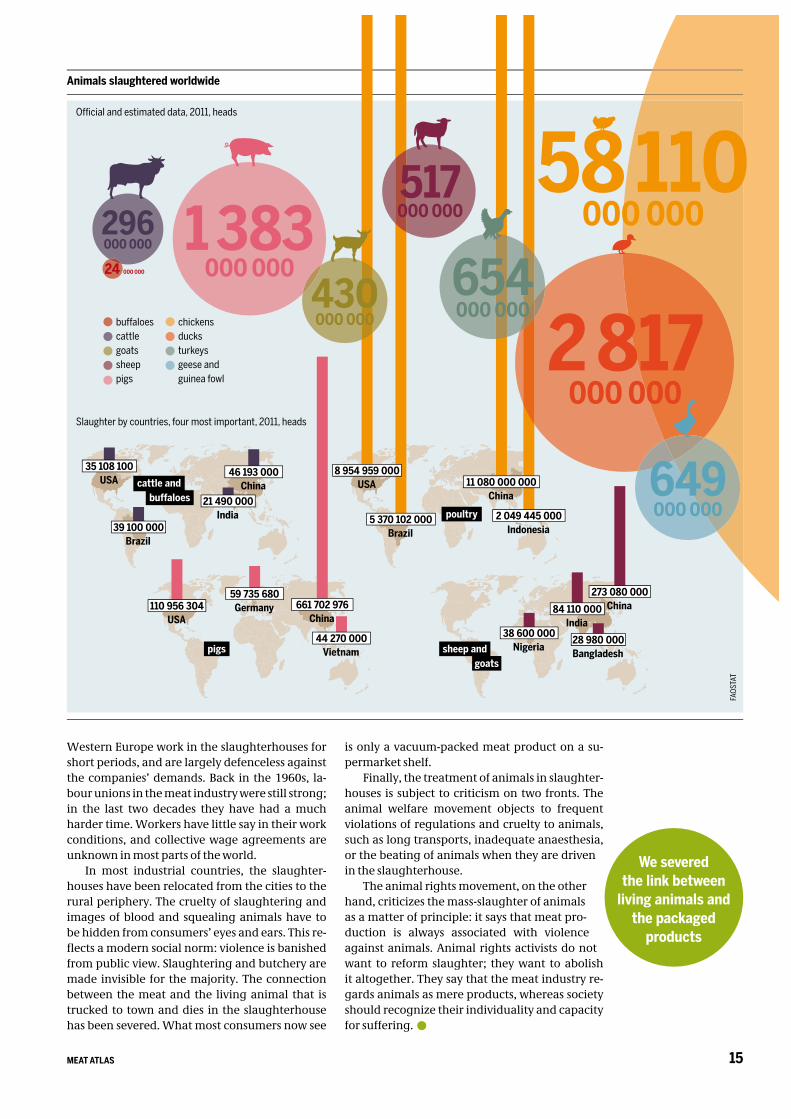
Animals slaughtered worldwide
Offi cial and estimated data, 2011, heads
Slaughter by countries, four most important, 2011, heads
FAOS
TAT
273 080 000China84 110 000
India38 600 000
Nigeria28 980 000Bangladesh
661 702 976China
110 956 304USA
59 735 680Germany
44 270 000Vietnam
46 193 000China
39 100 000Brazil
35 108 100USA
21 490 000India 2 049 445 000
Indonesia
11 080 000 000China
5 370 102 000Brazil
8 954 959 000USAcattle and
poultry
pigs sheep and
296000 000
buffaloescattlegoatssheeppigs
chickensducksturkeysgeese and guinea fowl
1 383000 000
430000 000
654000 000
649000 000
2 817000 000
517000 000
58 110000 000
24 000 000
buffaloes
goats
MEAT ATLAS16
R emember those butchers who cut up sides of beef or pork in a tiled back room, and sold joints and sausages to customers over a
marble counter in a room out front? In nearly all the developed world, they have been consigned to history. Meat today, pre-cooled to 0–4°C, is delivered to supermarkets from the wholesaler or direct from the abattoir. All the supermarket staff have to do is put the goods in refrigerated
display cabinets, and customers can choose the ready-packaged items themselves directly from the shelves. To keep self-service items looking fresh for days on end, pork chops and chicken breasts are vacuum-packed in an environment
that is as kept as germ-free as possible. The packaging is then filled with an oxygen-rich gas.
This gives beef and pork a red colour and suggests freshness – even though they may already have been in storage for several days.
Meat, a luxury in many parts of the world only 10 or 20 years ago, is now a part of the daily diet for a growing number of people in developing coun-tries. Big supermarket chains such as Walmart from the USA, France’s Carrefour, the UK’s Tesco and Germany’s Metro are conquering the globe. Their expansion has sparked huge investments by domestic supermarket companies. The process has been well researched. The first wave began in the early 1990s in South America, in East Asian ti-ger economies like South Korea and Taiwan, and South Africa. Between 1990 and 2005, the mar-
ket share of supermarkets in these countries rose from 10, to 50 or 60 percent. The second wave, in the mid-to-late 1990s, focused on Central America and Southeast Asia. By 2005, supermarkets ac-counted for 30–50 percent of the market share there. The third wave began in 2000 and washed over China and India, as well as big latecomers such as Vietnam. In only a few years, supermarket sales in these countries were growing by 30 to 50 percent a year.
Why this huge shift? It is not only due to the rising purchasing power of the middle classes, but also to more fundamental changes in society. In Pakistan, for example, cities are expanding so quickly that traditional methods of supplying meat and dairy products cannot keep up with the demand. The city of Lahore is growing by 300,000 people a year. The result is product shortages and poor quality, factors that drive the middle classes into the supermarkets, says the Express Tribune, a Pakistani daily. Working women, who are still responsible for cooking for their families, have no time to go from shop to shop to check the meat quality or haggle over prices.
Investing in spacious stores is worthwhile in places with thousands of potential customers. In locations where mobility is high, such as the car-friendly suburbs of US cities, poor people cannot find a grocery store within walking distance that sells fresh produce they can prepare themselves. The only food they can buy is ready-to-eat meals
It’s goodbye to the neighbourhood butcher and hello to supermarket chains. The shift to Big Retail is now washing over developing countries. The demands of the rising middle classes are setting the agenda.
BRIGHT PINK IN THE COLD CABINET
“Food deserts”: where convenience
stores and fast-foodoutlets are the only
source of food
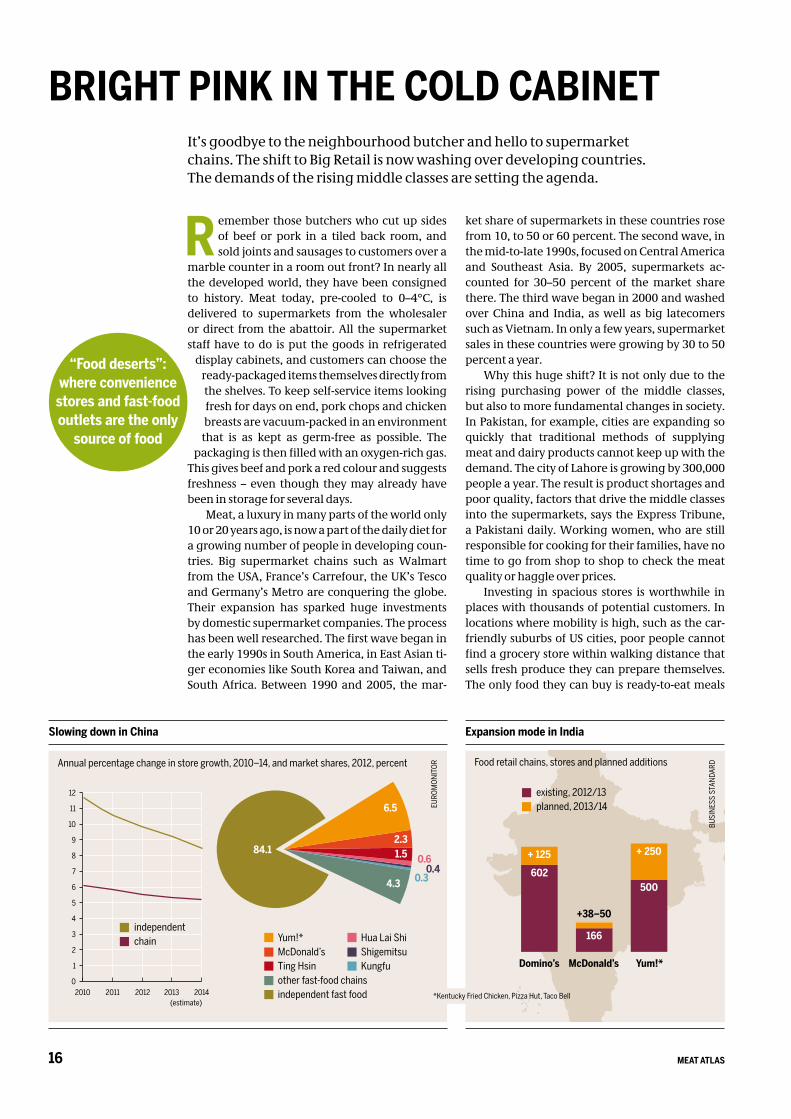
RETAIL
Slowing down in China
Annual percentage change in store growth, 2010–14, and market shares, 2012, percent
EURO
MON
ITOR
Expansion mode in India
Food retail chains, stores and planned additions
BUSI
NESS
STA
NDAR
D
existing, 2012/13planned, 2013/14
Domino’s McDonald’s Yum!*
602
+ 125
500
+ 250
166
+38–50
Yum!*McDonald’sTing Hsinother fast-food chainsindependent fast food
Hua Lai ShiShigemitsuKungfu
84.1
6.5
2.31.5
4.3
0.60.4
0.3
*Kentucky Fried Chicken, Pizza Hut, Taco Bell
0
1
2
3
4
5
6
7
8
9
10
11
12
2010 2011 2012 2013 2014(estimate)
independentchain
17MEAT ATLAS
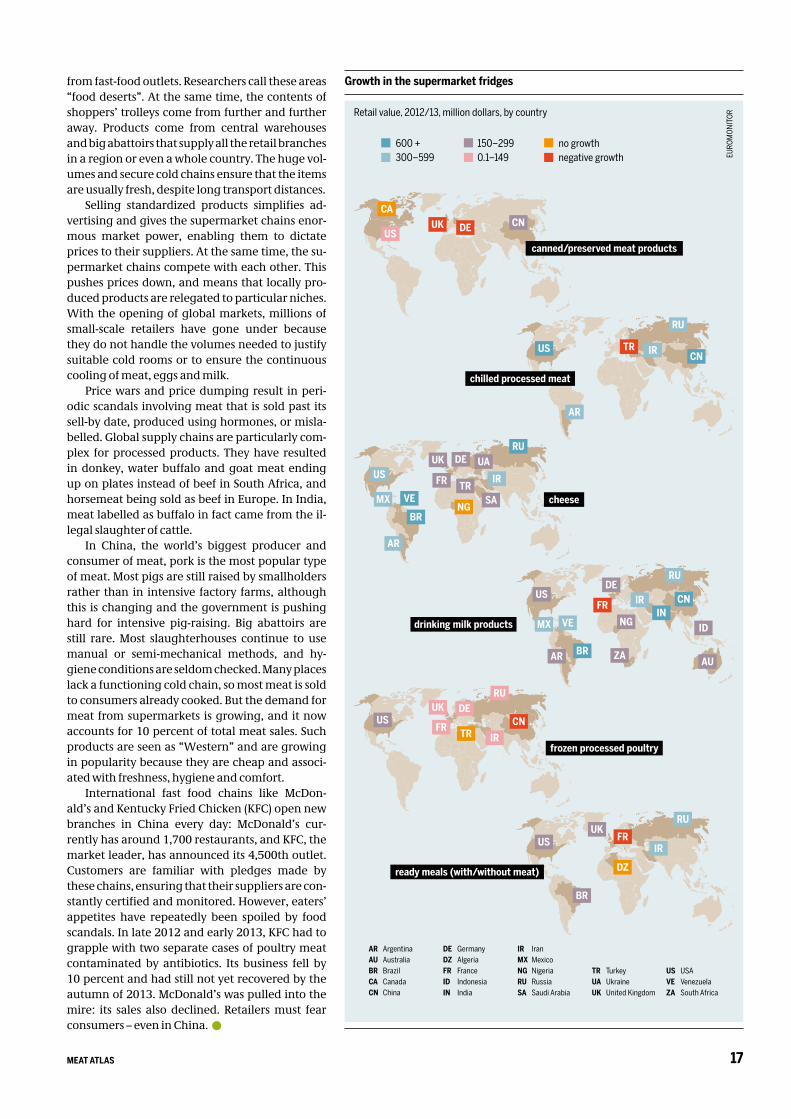
from fast-food outlets. Researchers call these areas “food deserts”. At the same time, the contents of shoppers’ trolleys come from further and further away. Products come from central warehouses and big abattoirs that supply all the retail branches in a region or even a whole country. The huge vol-umes and secure cold chains ensure that the items are usually fresh, despite long transport distances.
Selling standardized products simplifies ad-vertising and gives the supermarket chains enor-mous market power, enabling them to dictate prices to their suppliers. At the same time, the su-permarket chains compete with each other. This pushes prices down, and means that locally pro-duced products are relegated to particular niches. With the opening of global markets, millions of small-scale retailers have gone under because they do not handle the volumes needed to justify suitable cold rooms or to ensure the continuous cooling of meat, eggs and milk.
Price wars and price dumping result in peri-odic scandals involving meat that is sold past its sell-by date, produced using hormones, or misla-belled. Global supply chains are particularly com-plex for processed products. They have resulted in donkey, water buffalo and goat meat ending up on plates instead of beef in South Africa, and horsemeat being sold as beef in Europe. In India, meat labelled as buffalo in fact came from the il-legal slaughter of cattle.
In China, the world’s biggest producer and consumer of meat, pork is the most popular type of meat. Most pigs are still raised by smallholders rather than in intensive factory farms, although this is changing and the government is pushing hard for intensive pig-raising. Big abattoirs are still rare. Most slaughterhouses continue to use manual or semi-mechanical methods, and hy-giene conditions are seldom checked. Many places lack a functioning cold chain, so most meat is sold to consumers already cooked. But the demand for meat from supermarkets is growing, and it now accounts for 10 percent of total meat sales. Such products are seen as “Western” and are growing in popularity because they are cheap and associ-ated with freshness, hygiene and comfort.
International fast food chains like McDon-ald’s and Kentucky Fried Chicken (KFC) open new branches in China every day: McDonald’s cur-rently has around 1,700 restaurants, and KFC, the market leader, has announced its 4,500th outlet. Customers are familiar with pledges made by these chains, ensuring that their suppliers are con-stantly certified and monitored. However, eaters’ appetites have repeatedly been spoiled by food scandals. In late 2012 and early 2013, KFC had to grapple with two separate cases of poultry meat contaminated by antibiotics. Its business fell by 10 percent and had still not yet recovered by the autumn of 2013. McDonald’s was pulled into the mire: its sales also declined. Retailers must fear consumers – even in China.
RETAILGrowth in the supermarket fridges
Retail value, 2012/13, million dollars, by country
EURO
MON
ITOR
cheese
IR
BR
RU
US
AR
VE
UK UA
SATR
DE
FR
NG
ready meals (with/without meat)
IR
BR
RU
USUK
FR
DZ
drinking milk products
CNIR
BR
RU
US
AR
INVEMX ID
AU
DE
ZA
FR
frozen processed poultry
CN
IR
RU
USUK
TR
DE
FR
chilled processed meat
CNIR
RU
US
AR
TR
canned/preserved meat products
CNUS
UK DE
CA
600 +300–599
AR ArgentinaAU AustraliaBR BrazilCA CanadaCN China
DE GermanyDZ AlgeriaFR FranceID IndonesiaIN India
IR IranMX MexicoNG NigeriaRU RussiaSA Saudi Arabia
TR TurkeyUA UkraineUK United Kingdom
US USAVE VenezuelaZA South Africa
150–299 0.1–149
no growthnegative growth
MX
NG
MEAT ATLAS18
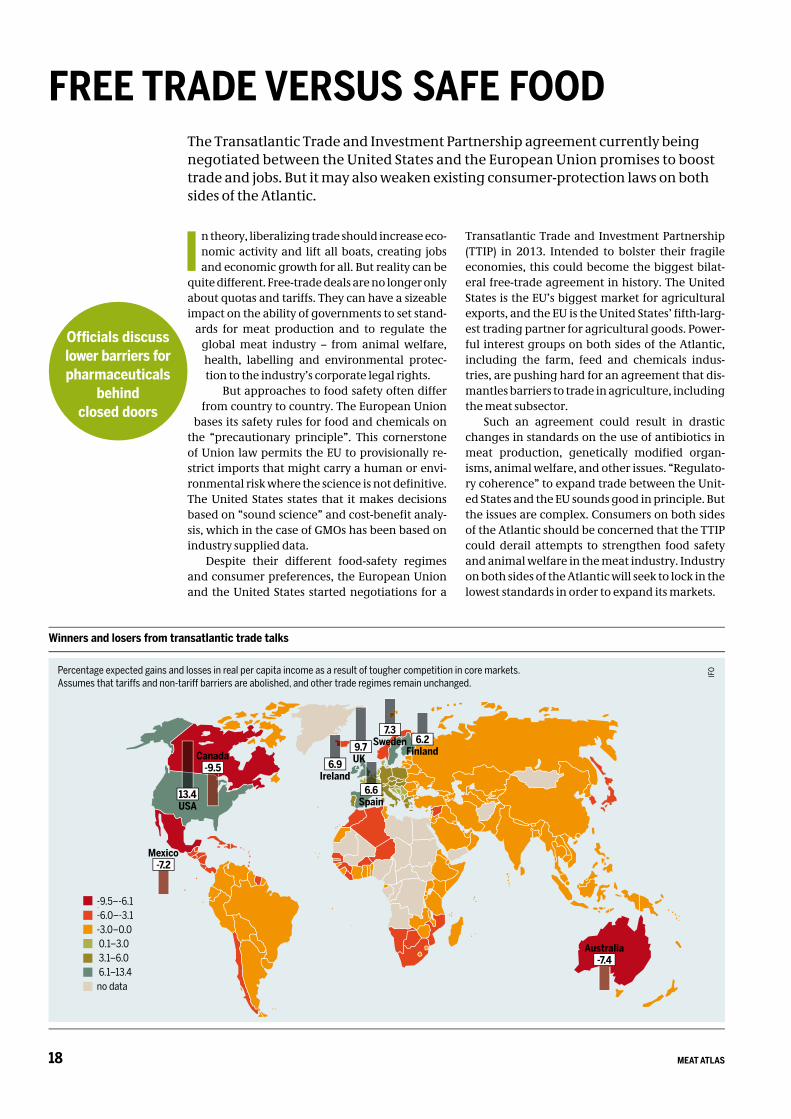
I n theory, liberalizing trade should increase eco-nomic activity and lift all boats, creating jobs and economic growth for all. But reality can be
quite different. Free-trade deals are no longer only about quotas and tariffs. They can have a sizeable impact on the ability of governments to set stand-
ards for meat production and to regulate the global meat industry – from animal welfare, health, labelling and environmental protec-tion to the industry’s corporate legal rights.
But approaches to food safety often differ from country to country. The European Union
bases its safety rules for food and chemicals on the “precautionary principle”. This cornerstone of Union law permits the EU to provisionally re-strict imports that might carry a human or envi-ronmental risk where the science is not defi nitive. The United States states that it makes decisions based on “sound science” and cost-benefi t analy-sis, which in the case of GMOs has been based on industry supplied data.
Despite their different food-safety regimes and consumer preferences, the European Union and the United States started negotiations for a
Transatlantic Trade and Investment Partnership (TTIP) in 2013. Intended to bolster their fragile economies, this could become the biggest bilat-eral free-trade agreement in history. The United States is the EU’s biggest market for agricultural exports, and the EU is the United States’ fi fth-larg-est trading partner for agricultural goods. Power-ful interest groups on both sides of the Atlantic, including the farm, feed and chemicals indus-tries, are pushing hard for an agreement that dis-mantles barriers to trade in agriculture, including the meat subsector.
Such an agreement could result in drastic changes in standards on the use of antibiotics in meat production, genetically modifi ed organ-isms, animal welfare, and other issues. “Regulato-ry coherence” to expand trade between the Unit-ed States and the EU sounds good in principle. But the issues are complex. Consumers on both sides of the Atlantic should be concerned that the TTIP could derail attempts to strengthen food safety and animal welfare in the meat industry. Industry on both sides of the Atlantic will seek to lock in the lowest standards in order to expand its markets.
The Transatlantic Trade and Investment Partnership agreement currently being negotiated between the United States and the European Union promises to boost trade and jobs. But it may also weaken existing consumer-protection laws on both sides of the Atlantic.
FREE TRADE VERSUS SAFE FOOD
Offi cials discuss lower barriers for pharmaceuticals
behind closed doors
Winners and losers from transatlantic trade talks
Percentage expected gains and losses in real per capita income as a result of tougher competition in core markets. Assumes that tariffs and non-tariff barriers are abolished, and other trade regimes remain unchanged.
IFO
-9.5–-6.1-6.0–-3.1-3.0–0.0 0.1–3.0 3.1–6.0 6.1–13.4no data
13.4USA
6.6Spain
6.2Finland
7.3Sweden
-9.5Canada
-7.2Mexico
-7.4Australia
6.9Ireland
9.7UK
19MEAT ATLAS
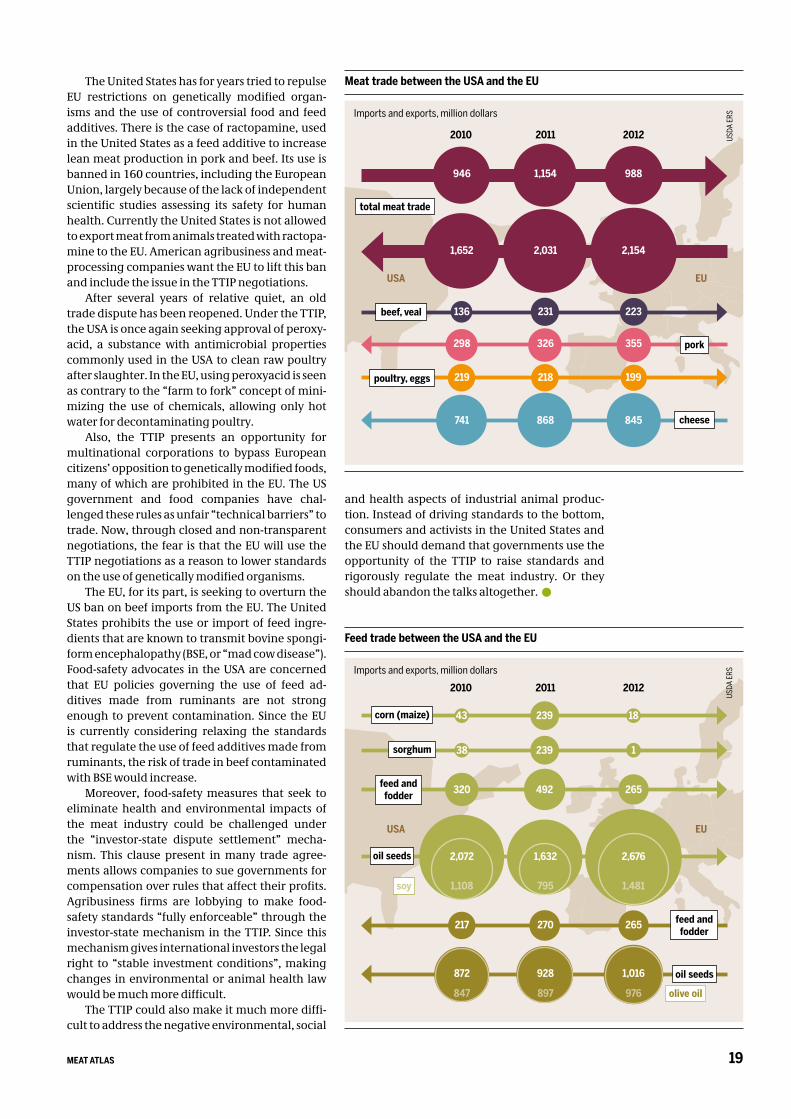
The United States has for years tried to repulse EU restrictions on genetically modified organ-isms and the use of controversial food and feed additives. There is the case of ractopamine, used in the United States as a feed additive to increase lean meat production in pork and beef. Its use is banned in 160 countries, including the European Union, largely because of the lack of independent scientific studies assessing its safety for human health. Currently the United States is not allowed to export meat from animals treated with ractopa-mine to the EU. American agribusiness and meat-processing companies want the EU to lift this ban and include the issue in the TTIP negotiations.
After several years of relative quiet, an old trade dispute has been reopened. Under the TTIP, the USA is once again seeking approval of peroxy-acid, a substance with antimicrobial properties commonly used in the USA to clean raw poultry after slaughter. In the EU, using peroxyacid is seen as contrary to the “farm to fork” concept of mini-mizing the use of chemicals, allowing only hot water for decontaminating poultry.
Also, the TTIP presents an opportunity for multinational corporations to bypass European citizens’ opposition to genetically modified foods, many of which are prohibited in the EU. The US government and food companies have chal-lenged these rules as unfair “technical barriers” to trade. Now, through closed and non-transparent negotiations, the fear is that the EU will use the TTIP negotiations as a reason to lower standards on the use of genetically modified organisms.
The EU, for its part, is seeking to overturn the US ban on beef imports from the EU. The United States prohibits the use or import of feed ingre-dients that are known to transmit bovine spongi-form encephalopathy (BSE, or “mad cow disease”). Food-safety advocates in the USA are concerned that EU policies governing the use of feed ad-ditives made from ruminants are not strong enough to prevent contamination. Since the EU is currently considering relaxing the standards that regulate the use of feed additives made from ruminants, the risk of trade in beef contaminated with BSE would increase.
Moreover, food-safety measures that seek to eliminate health and environmental impacts of the meat industry could be challenged under the “investor-state dispute settlement” mecha-nism. This clause present in many trade agree-ments allows companies to sue governments for compensation over rules that affect their profits. Agribusiness firms are lobbying to make food-safety standards “fully enforceable” through the investor-state mechanism in the TTIP. Since this mechanism gives international investors the legal right to “stable investment conditions”, making changes in environmental or animal health law would be much more difficult.
The TTIP could also make it much more diffi-cult to address the negative environmental, social
and health aspects of industrial animal produc-tion. Instead of driving standards to the bottom, consumers and activists in the United States and the EU should demand that governments use the opportunity of the TTIP to raise standards and rigorously regulate the meat industry. Or they should abandon the talks altogether.
USA EU
Feed trade between the USA and the EU
Imports and exports, million dollars
USDA
ERS
Meat trade between the USA and the EU
Imports and exports, million dollars
USDA
ERS
cheese
pork
poultry, eggs
beef, veal
total meat trade
298 326 355
219 218 199
741 868 845
136 231 223
1,652 2,031 2,154
946 1,154 988
2010 2011 2012
USA EU
2010 2011 2012
217 270 265
38 239 1sorghum
43 239 18corn (maize)
320 492 265feed and fodder
2,072 1,632 2,676
1,108 795 1,481
oil seeds
soy
872 928 1,016
847 897 976
oil seeds
olive oil
feed and fodder
MEAT ATLAS20
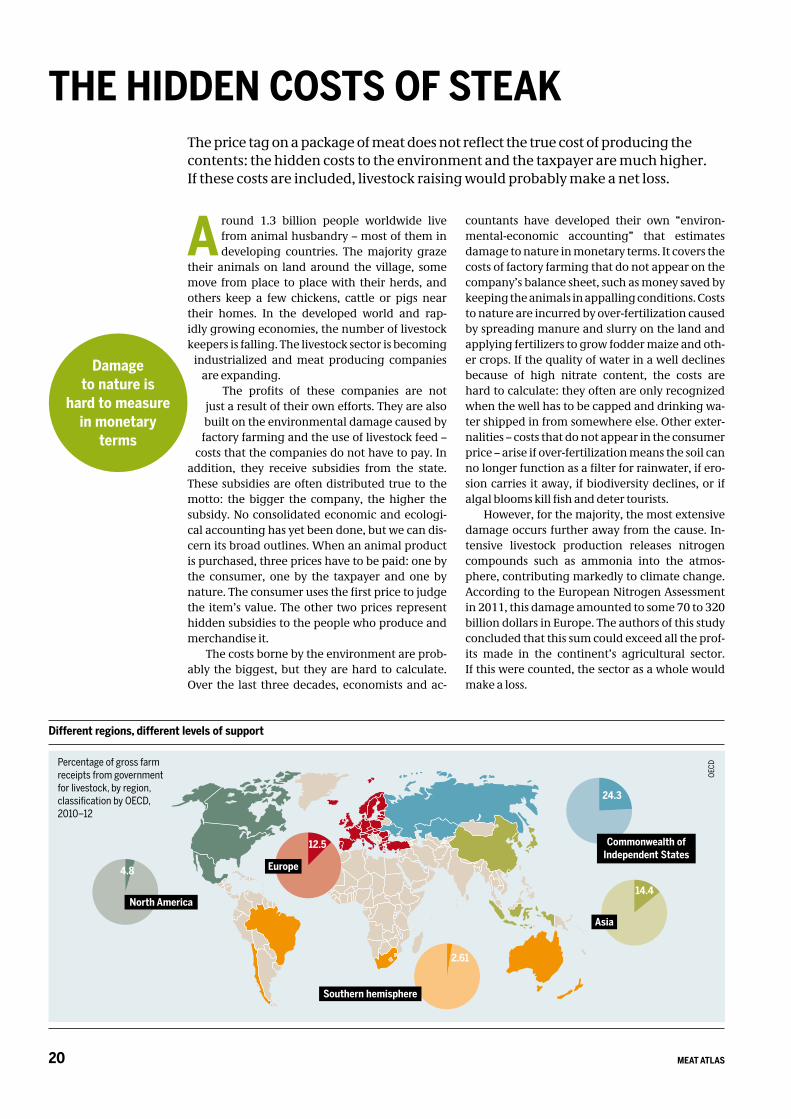
A round 1.3 billion people worldwide live from animal husbandry – most of them in developing countries. The majority graze
their animals on land around the village, some move from place to place with their herds, and others keep a few chickens, cattle or pigs near their homes. In the developed world and rap-idly growing economies, the number of livestock keepers is falling. The livestock sector is becoming
industrialized and meat producing companies are expanding.
The profits of these companies are not just a result of their own efforts. They are also built on the environmental damage caused by
factory farming and the use of livestock feed – costs that the companies do not have to pay. In
addition, they receive subsidies from the state. These subsidies are often distributed true to the motto: the bigger the company, the higher the subsidy. No consolidated economic and ecologi-cal accounting has yet been done, but we can dis-cern its broad outlines. When an animal product is purchased, three prices have to be paid: one by the consumer, one by the taxpayer and one by nature. The consumer uses the first price to judge the item’s value. The other two prices represent hidden subsidies to the people who produce and merchandise it.
The costs borne by the environment are prob-ably the biggest, but they are hard to calculate. Over the last three decades, economists and ac-
countants have developed their own “environ-mental-economic accounting” that estimates damage to nature in monetary terms. It covers the costs of factory farming that do not appear on the company’s balance sheet, such as money saved by keeping the animals in appalling conditions. Costs to nature are incurred by over-fertilization caused by spreading manure and slurry on the land and applying fertilizers to grow fodder maize and oth-er crops. If the quality of water in a well declines because of high nitrate content, the costs are hard to calculate: they often are only recognized when the well has to be capped and drinking wa-ter shipped in from somewhere else. Other exter-nalities – costs that do not appear in the consumer price – arise if over-fertilization means the soil can no longer function as a filter for rainwater, if ero-sion carries it away, if biodiversity declines, or if algal blooms kill fish and deter tourists.
However, for the majority, the most extensive damage occurs further away from the cause. In-tensive livestock production releases nitrogen compounds such as ammonia into the atmos-phere, contributing markedly to climate change. According to the European Nitrogen Assessment in 2011, this damage amounted to some 70 to 320 billion dollars in Europe. The authors of this study concluded that this sum could exceed all the prof-its made in the continent’s agricultural sector. If this were counted, the sector as a whole would make a loss.
The price tag on a package of meat does not reflect the true cost of producing the contents: the hidden costs to the environment and the taxpayer are much higher. If these costs are included, livestock raising would probably make a net loss.
THE HIDDEN COSTS OF STEAK
Damage to nature is
hard to measurein monetary
terms
Different regions, different levels of support
Percentage of gross farm receipts from government for livestock, by region, classification by OECD, 2010–12
OECD
12.5
4.8
2.61
24.3
14.4North America
Asia
Commonwealth of Independent States
Europe
Southern hemisphere
21MEAT ATLAS
In China, the immediate costs of over-fertili-zation are estimated at 4.5 billion dollars a year, mainly because water quality suffers from in-tensive livestock production. The main problem is that in rapidly developing areas of East Asia, farmers and agricultural fi rms are replacing the traditional organic fertilizers – manure and fae-ces – with synthetic nitrogen. Manure, which used to be considered the best type of fertilizer in inte-grated farming, now has to be disposed of some-how – in a river, on a dump, or trucked to where it can be used. To ensure the highest yields, the fi elds are fertilized with commercial agrochemicals containing readily soluble nutrients as well. This results in a double burden on the environment. Cheap meat is made possible only by polluting the environment.
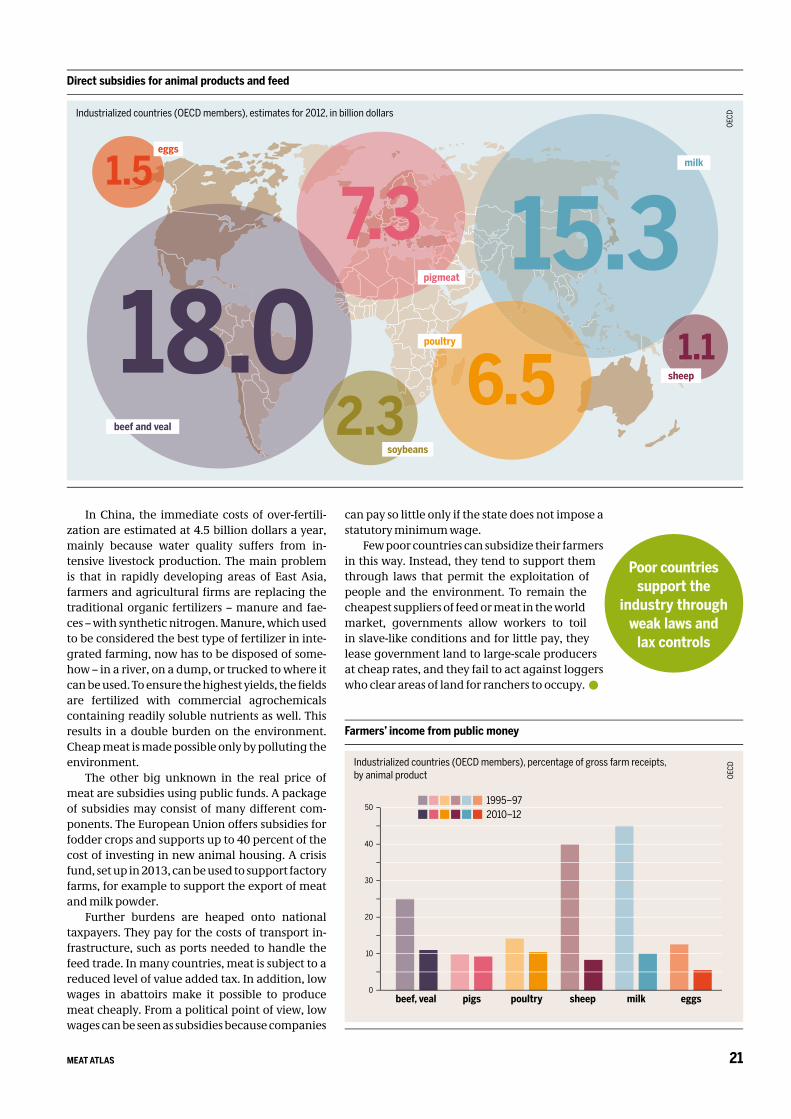
The other big unknown in the real price of meat are subsidies using public funds. A package of subsidies may consist of many different com-ponents. The European Union offers subsidies for fodder crops and supports up to 40 percent of the cost of investing in new animal housing. A crisis fund, set up in 2013, can be used to support factory farms, for example to support the export of meat and milk powder.
Further burdens are heaped onto national taxpayers. They pay for the costs of transport in-frastructure, such as ports needed to handle the feed trade. In many countries, meat is subject to a reduced level of value added tax. In addition, low wages in abattoirs make it possible to produce meat cheaply. From a political point of view, low wages can be seen as subsidies because companies
can pay so little only if the state does not impose a statutory minimum wage.
Few poor countries can subsidize their farmers in this way. Instead, they tend to support them through laws that permit the exploitation of people and the environment. To remain the cheapest suppliers of feed or meat in the world market, governments allow workers to toil in slave-like conditions and for little pay, they lease government land to large-scale producers at cheap rates, and they fail to act against loggers who clear areas of land for ranchers to occupy.
Direct subsidies for animal products and feed
Industrialized countries (OECD members), estimates for 2012, in billion dollars
OECD
Poor countries support the
industry throughweak laws and
lax controls
Farmers’ income from public money
beef, veal pigs poultry milksheep eggs0
10
20
30
40
50
Industrialized countries (OECD members), percentage of gross farm receipts, by animal product OE
CD
1995–972010–12
15.318.0
7.3
6.52.3
1.5
1.1
beef and veal
soybeans
poultry
milk
sheep
pigmeat
eggs
MEAT ATLAS22
P ut lots of nitrogen in a body of water and its oxygen content goes down. How serious a problem that is can be seen in the coastal
waters of the Gulf of Mexico. Around the mouths of the Mississippi, some 20,000 square kilometres
of the sea have so little oxygen that a “dead zone” has formed, in which shrimp and fish cannot sur-vive. In 2011, researchers found that sperms were growing in the sex cells of female fish in the Gulf because a lack of oxygen was interfering with their enzyme balance.
The cause of this marine desolation lies in the over-fertilization of the Mississippi basin, where almost all the United States’ feed production and industrial farms are concentrated. Nitrogen and phosphorus are washed down the river into the Gulf. There these nutrients stimulate the growth of algae, aquatic plants and bacteria, which use up the oxygen dissolved in the seawater. A litre of seawater commonly holds around 7 milligrams of dissolved oxygen; around the mouths of the Mis-sissippi it holds less than 2 milligrams. The only or-ganisms active here are those that do not depend on oxygen to live.
The US marine biologist Peter Thomas says that around 250,000 square kilometres of coastal wa-ters worldwide suffer from severe seasonal oxygen deficiency. In Asia, pig and poultry farms in coast-al China, Vietnam and Thailand pollute the South China Sea with nitrogen. The northern part of the Caspian Sea is loaded with nitrogen that comes down the Volga. Many of the seas surrounding Europe are affected: the Baltic Sea, the Black Sea, the Irish Sea, the Spanish coast and the Adriatic all have dead zones. The problems are caused not only by nitrogen and phosphorus pollution, but also by potassium, drug residues, disease-causing organisms and heavy metals.
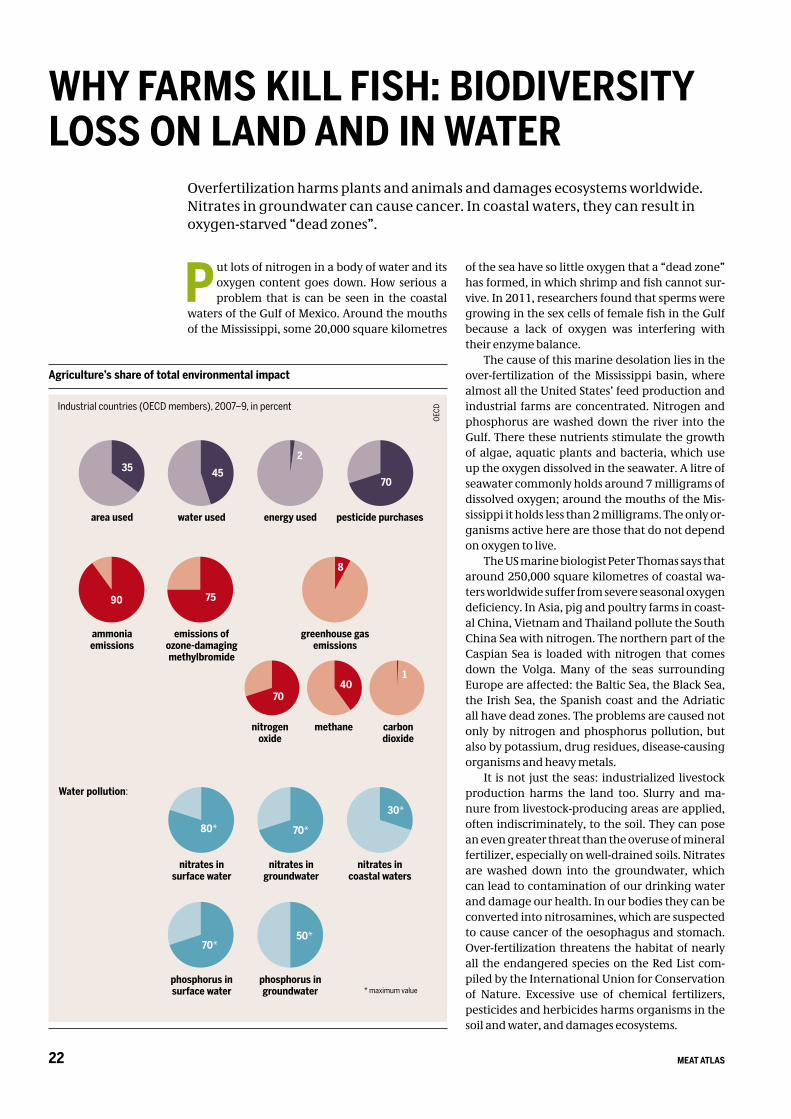
It is not just the seas: industrialized livestock production harms the land too. Slurry and ma-nure from livestock-producing areas are applied, often indiscriminately, to the soil. They can pose an even greater threat than the overuse of mineral fertilizer, especially on well-drained soils. Nitrates are washed down into the groundwater, which can lead to contamination of our drinking water and damage our health. In our bodies they can be converted into nitrosamines, which are suspected to cause cancer of the oesophagus and stomach.Over-fertilization threatens the habitat of nearly all the endangered species on the Red List com-piled by the International Union for Conservation of Nature. Excessive use of chemical fertilizers, pesticides and herbicides harms organisms in the soil and water, and damages ecosystems.
WHY FARMS KILL FISH: BIODIVERSITY LOSS ON LAND AND IN WATER
Agriculture’s share of total environmental impact
Industrial countries (OECD members), 2007–9, in percent
area used water used energy used pesticide purchases
35 4570
2
ammonia emissions
emissions of ozone-damaging methylbromide
greenhouse gas emissions
90 75
8
nitrogen oxide
methane carbon dioxide
nitrates in surface water
nitrates in groundwater
nitrates in coastal waters
phosphorus in surface water
phosphorus in groundwater
Water pollution:
7040
1
80* 70*
30*
70*50*
* maximum value
OECD
Overfertilization harms plants and animals and damages ecosystems worldwide. Nitrates in groundwater can cause cancer. In coastal waters, they can result in oxygen-starved “dead zones”.
23MEAT ATLAS
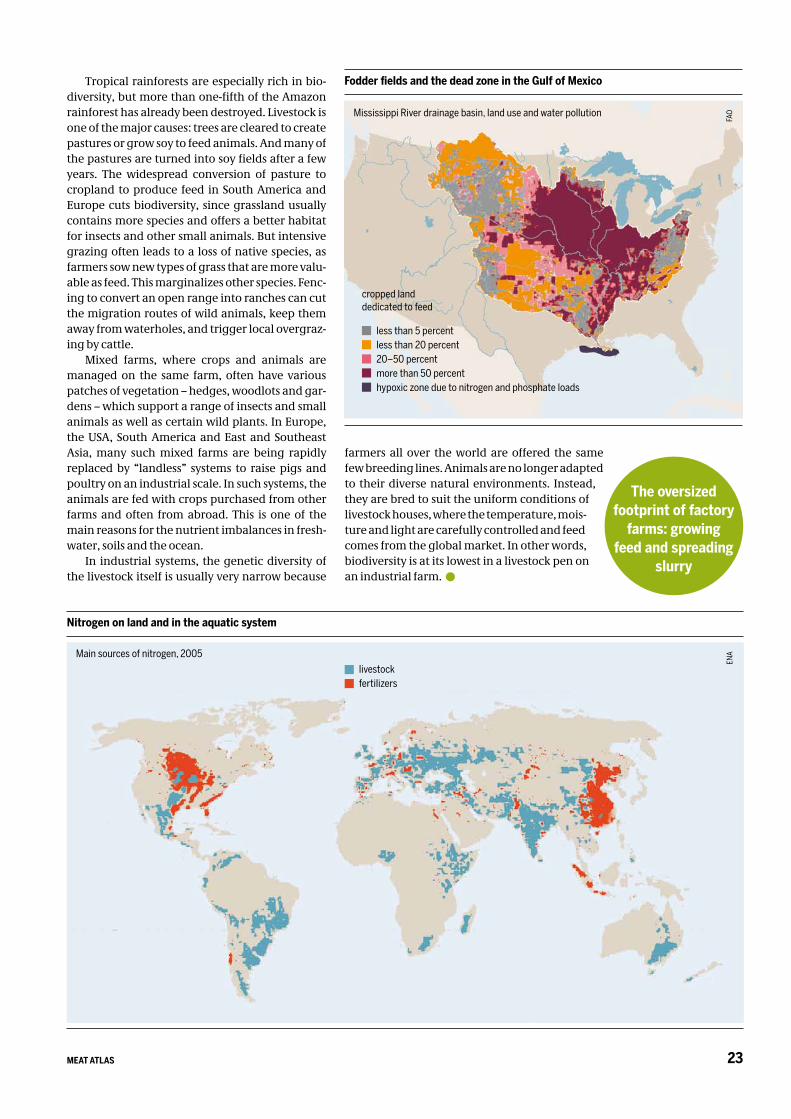
Tropical rainforests are especially rich in bio-diversity, but more than one-fifth of the Amazon rainforest has already been destroyed. Livestock is one of the major causes: trees are cleared to create pastures or grow soy to feed animals. And many of the pastures are turned into soy fields after a few years. The widespread conversion of pasture to cropland to produce feed in South America and Europe cuts biodiversity, since grassland usually contains more species and offers a better habitat for insects and other small animals. But intensive grazing often leads to a loss of native species, as farmers sow new types of grass that are more valu-able as feed. This marginalizes other species. Fenc-ing to convert an open range into ranches can cut the migration routes of wild animals, keep them away from waterholes, and trigger local overgraz-ing by cattle.
Mixed farms, where crops and animals are managed on the same farm, often have various patches of vegetation – hedges, woodlots and gar-dens – which support a range of insects and small animals as well as certain wild plants. In Europe, the USA, South America and East and Southeast Asia, many such mixed farms are being rapidly replaced by “landless” systems to raise pigs and poultry on an industrial scale. In such systems, the animals are fed with crops purchased from other farms and often from abroad. This is one of the main reasons for the nutrient imbalances in fresh-water, soils and the ocean.
In industrial systems, the genetic diversity of the livestock itself is usually very narrow because
farmers all over the world are offered the same few breeding lines. Animals are no longer adapted to their diverse natural environments. Instead, they are bred to suit the uniform conditions of livestock houses, where the temperature, mois-ture and light are carefully controlled and feed comes from the global market. In other words, biodiversity is at its lowest in a livestock pen on an industrial farm.
The oversized footprint of factory
farms: growing feed and spreading
slurry
Fodder fields and the dead zone in the Gulf of Mexico
Mississippi River drainage basin, land use and water pollution
FAO
Nitrogen on land and in the aquatic system
ENA
less than 5 percent less than 20 percent 20–50 percent more than 50 percent hypoxic zone due to nitrogen and phosphate loads
Main sources of nitrogen, 2005livestockfertilizers
cropped landdedicated to feed
MEAT ATLAS24
H umankind has domesticated 30 species of livestock, and in doing so has created an incredible range of breeds: around 8,000
have so far been documented by the Food and Agriculture Organization of the United Nations (FAO). Many of these breeds are kept by small-
scale livestock keepers – the majority of whom are women – who produce most of the world’s meat while conserving the world’s livestock diversity. For many poor households, animals, especially chickens, sheep and goats, are an
important source of livelihood. They choose in-digenous, multipurpose breeds because they are
adapted to local, often harsh conditions. Eight types of livestock are used in heavy indus-
trial production: cattle, pigs, sheep, goats, chick-ens, turkeys, ducks and rabbits. Of these, a few breeds have been developed further. The indus-try has developed these into a few high-yielding breeding lines, which are crossbred to produce the animals that we eat. Such hybrid breeding is used especially in poultry and pigs, further restricting the genetic diversity in these animals.
The 1950s marked the advent of the wide-scale commercial production of meat and a concomi-tant loss of genetic diversity. Corporate breeders focused on maximizing production and commer-cially useful traits such as rapid growth, efficient feed conversion and high yields. The result is high-performance and genetically uniform breeds that require high-protein feeds, costly pharmaceuti-cals and climate-controlled housing to survive.
Now, a small number of transnational firms supply commercial breeds for an ever-increasing share of the world’s meat markets. The companies also dominate research and development in the highly-concentrated animal genetics industry, particularly for poultry, swine and cattle.
One third of the world’s pig supply, 85 percent of the traded eggs and two-thirds of the milk pro-duction come from these breeds.
In the poultry sector, four firms account for 97 percent of poultry research and development. In broilers, three companies control a 95 percent market share. Two companies control an esti-mated 94 percent of the breeding stock of com-mercial layers. Two companies supply virtually all of the commercial turkey genetics.
The top four companies account for two-thirds of the total industry research and development of both swine and cattle.
While aquaculture currently accounts for a small slice of the industry, it is the fastest grow-ing sector. Many of the top animal genetics firms have recently taken the plunge into aquacul-ture. They work with only a handful of species, primarily Atlantic salmon, rainbow trout, tropi-cal shrimp and tilapia.
Most of the global suppliers of livestock genet-ics are privately held and do not publish figures on revenues or investments, nor do they provide an inventory of their proprietary germplasm or breeding stock collections. This means that there is not much information being made publicly available about the size of private-sector animal genetics markets, and the sales and prices of ge-netic materials. But it is clear that the market for commercial animal genetics is tiny compared to the commercial seed market, its crop counterpart.
China is now the world’s largest consumer of meat, with pork being the country’s most popu-lar protein, and demand is rocketing. The vast majority of China’s pork supply still comes from “backyard” pig producers, but Chinese policies favouring vertical integration, where one firm
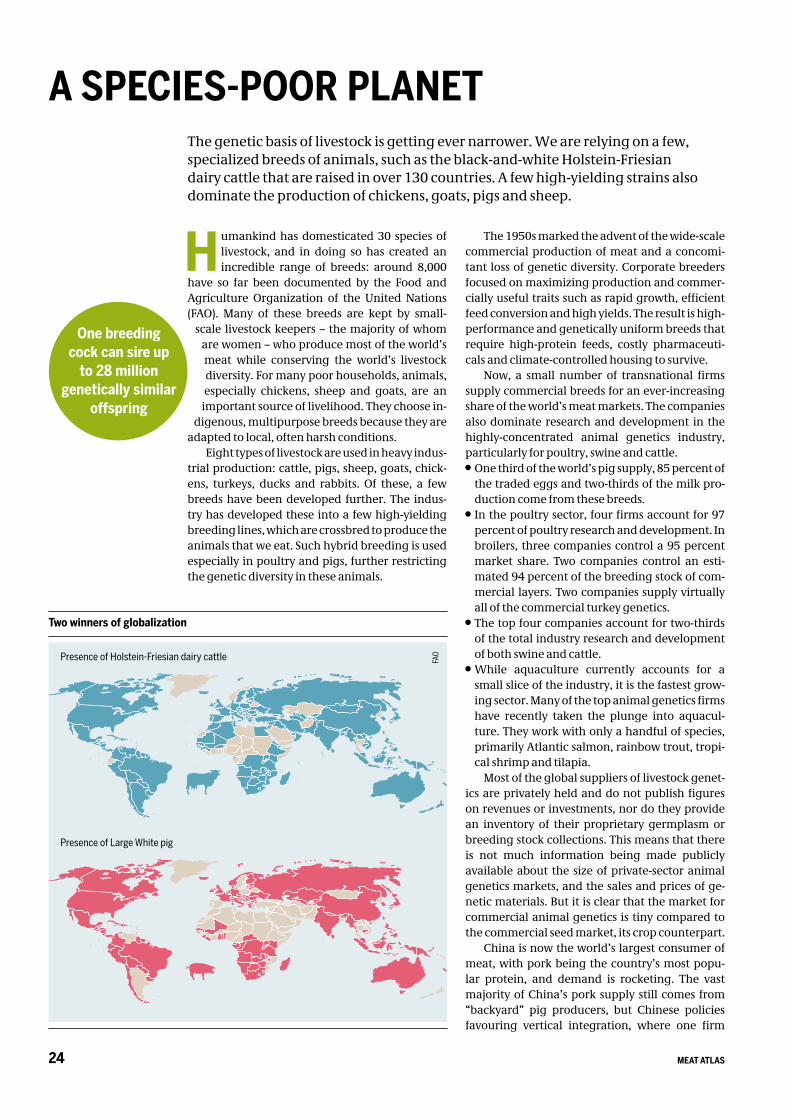
The genetic basis of livestock is getting ever narrower. We are relying on a few, specialized breeds of animals, such as the black-and-white Holstein-Friesian dairy cattle that are raised in over 130 countries. A few high-yielding strains also dominate the production of chickens, goats, pigs and sheep.
A SPECIES-POOR PLANET
Two winners of globalization
Presence of Holstein-Friesian dairy cattle FAO
Presence of Large White pig
One breeding cock can sire up
to 28 million genetically similar
offspring
25MEAT ATLAS
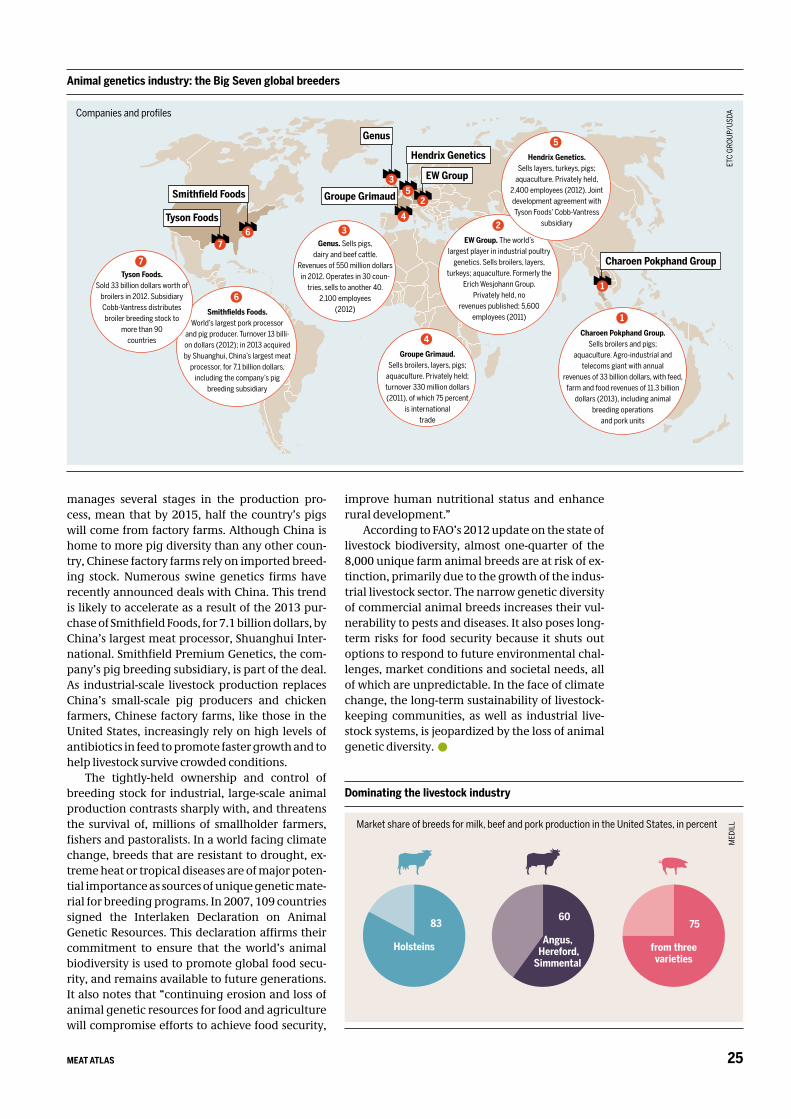
manages several stages in the production pro-cess, mean that by 2015, half the country’s pigs will come from factory farms. Although China is home to more pig diversity than any other coun-try, Chinese factory farms rely on imported breed-ing stock. Numerous swine genetics firms have recently announced deals with China. This trend is likely to accelerate as a result of the 2013 pur-chase of Smithfield Foods, for 7.1 billion dollars, by China’s largest meat processor, Shuanghui Inter-national. Smithfield Premium Genetics, the com-pany’s pig breeding subsidiary, is part of the deal. As industrial-scale livestock production replaces China’s small-scale pig producers and chicken farmers, Chinese factory farms, like those in the United States, increasingly rely on high levels of antibiotics in feed to promote faster growth and to help livestock survive crowded conditions.
The tightly-held ownership and control of breeding stock for industrial, large-scale animal production contrasts sharply with, and threatens the survival of, millions of smallholder farmers, fishers and pastoralists. In a world facing climate change, breeds that are resistant to drought, ex-treme heat or tropical diseases are of major poten-tial importance as sources of unique genetic mate-rial for breeding programs. In 2007, 109 countries signed the Interlaken Declaration on Animal Genetic Resources. This declaration affirms their commitment to ensure that the world’s animal biodiversity is used to promote global food secu-rity, and remains available to future generations. It also notes that “continuing erosion and loss of animal genetic resources for food and agriculture will compromise efforts to achieve food security,
improve human nutritional status and enhance rural development.”
According to FAO’s 2012 update on the state of livestock biodiversity, almost one-quarter of the 8,000 unique farm animal breeds are at risk of ex-tinction, primarily due to the growth of the indus-trial livestock sector. The narrow genetic diversity of commercial animal breeds increases their vul-nerability to pests and diseases. It also poses long-term risks for food security because it shuts out options to respond to future environmental chal-lenges, market conditions and societal needs, all of which are unpredictable. In the face of climate change, the long-term sustainability of livestock-keeping communities, as well as industrial live-stock systems, is jeopardized by the loss of animal genetic diversity.
Dominating the livestock industry
Market share of breeds for milk, beef and pork production in the United States, in percent
MED
ILL
60
Angus, Hereford,
Simmental
75
from three varieties
83
Holsteins
Animal genetics industry: the Big Seven global breeders
Companies and profiles
ETC
GROU
P/US
DA
1
Charoen Pokphand Group
EW Group
2
Hendrix Genetics
5
Genus
3
Tyson Foods
Smithfield Foods Groupe Grimaud
4
67
Charoen Pokphand Group. Sells broilers and pigs;
aquaculture. Agro-industrial and telecoms giant with annual
revenues of 33 billion dollars, with feed, farm and food revenues of 11.3 billion
dollars (2013), including animal breeding operations
and pork units
1
Groupe Grimaud.Sells broilers, layers, pigs;
aquaculture. Privately held; turnover 330 million dollars (2011), of which 75 percent
is international trade
4
EW Group. The world’s largest player in industrial poultry
genetics. Sells broilers, layers, turkeys; aquaculture. Formerly the
Erich Wesjohann Group. Privately held, no
revenues published; 5,600 employees (2011)
2
Hendrix Genetics.Sells layers, turkeys, pigs;
aquaculture. Privately held, 2,400 employees (2012). Joint development agreement with Tyson Foods’ Cobb-Vantress
subsidiary
5
Genus. Sells pigs, dairy and beef cattle.
Revenues of 550 million dollars in 2012. Operates in 30 coun-
tries, sells to another 40. 2,100 employees
(2012)
3
Smithfields Foods.World’s largest pork processor
and pig producer. Turnover 13 billi-on dollars (2012); in 2013 acquired by Shuanghui, China’s largest meat
processor, for 7.1 billion dollars, including the company’s pig
breeding subsidiary
6
Tyson Foods. Sold 33 billion dollars worth of
broilers in 2012. Subsidiary Cobb-Vantress distributes broiler breeding stock to
more than 90 countries
7
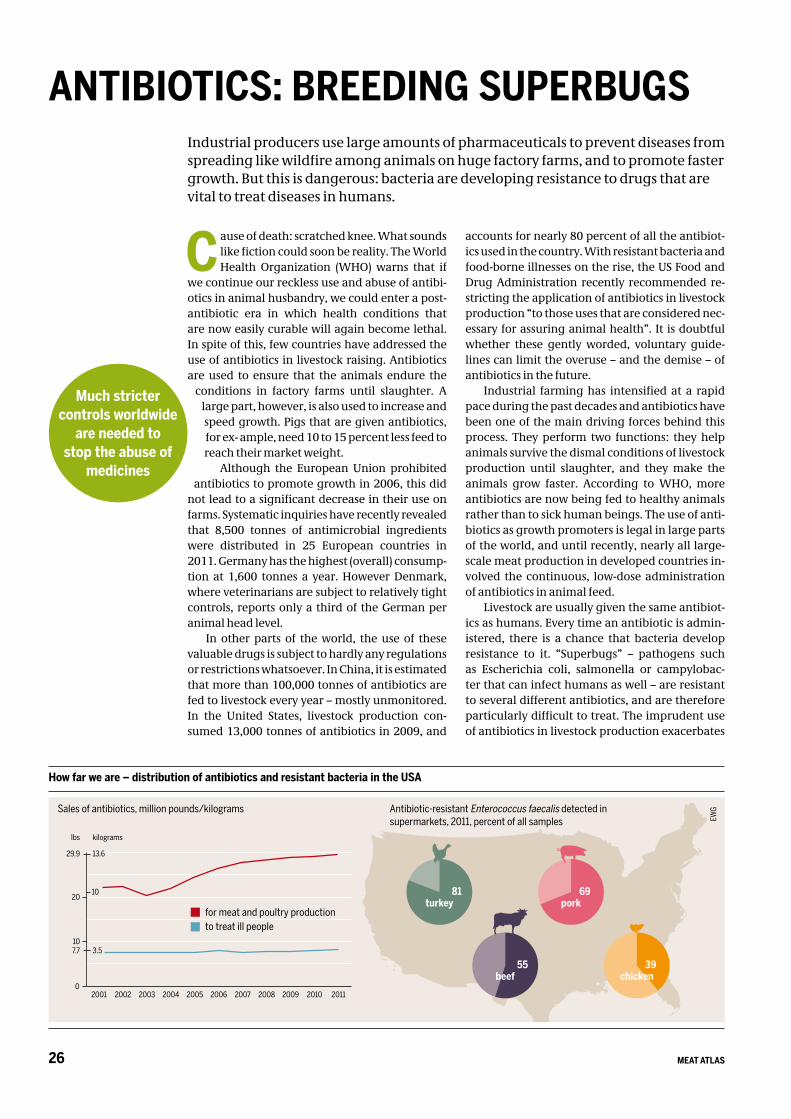
MEAT ATLAS26
C ause of death: scratched knee. What sounds like fiction could soon be reality. The World Health Organization (WHO) warns that if
we continue our reckless use and abuse of antibi-otics in animal husbandry, we could enter a post-antibiotic era in which health conditions that are now easily curable will again become lethal. In spite of this, few countries have addressed the use of antibiotics in livestock raising. Antibiotics are used to ensure that the animals endure the
conditions in factory farms until slaughter. A large part, however, is also used to increase and speed growth. Pigs that are given antibiotics, for ex- ample, need 10 to 15 percent less feed to reach their market weight.
Although the European Union prohibited antibiotics to promote growth in 2006, this did
not lead to a significant decrease in their use on farms. Systematic inquiries have recently revealed that 8,500 tonnes of antimicrobial ingredients were distributed in 25 European countries in 2011. Germany has the highest (overall) consump-tion at 1,600 tonnes a year. However Denmark, where veterinarians are subject to relatively tight controls, reports only a third of the German per animal head level.
In other parts of the world, the use of these valuable drugs is subject to hardly any regulations or restrictions whatsoever. In China, it is estimated that more than 100,000 tonnes of antibiotics are fed to livestock every year – mostly unmonitored. In the United States, livestock production con-sumed 13,000 tonnes of antibiotics in 2009, and
accounts for nearly 80 percent of all the antibiot-ics used in the country. With resistant bacteria and food-borne illnesses on the rise, the US Food and Drug Administration recently recommended re-stricting the application of antibiotics in livestock production “to those uses that are considered nec-essary for assuring animal health”. It is doubtful whether these gently worded, voluntary guide-lines can limit the overuse – and the demise – of antibiotics in the future.
Industrial farming has intensified at a rapid pace during the past decades and antibiotics have been one of the main driving forces behind this process. They perform two functions: they help animals survive the dismal conditions of livestock production until slaughter, and they make the animals grow faster. According to WHO, more antibiotics are now being fed to healthy animals rather than to sick human beings. The use of anti-biotics as growth promoters is legal in large parts of the world, and until recently, nearly all large-scale meat production in developed countries in-volved the continuous, low-dose administration of antibiotics in animal feed.
Livestock are usually given the same antibiot-ics as humans. Every time an antibiotic is admin-istered, there is a chance that bacteria develop resistance to it. “Superbugs” – pathogens such as Escherichia coli, salmonella or campylobac-ter that can infect humans as well – are resistant to several different antibiotics, and are therefore particularly difficult to treat. The imprudent use of antibiotics in livestock production exacerbates
Industrial producers use large amounts of pharmaceuticals to prevent diseases from spreading like wildfire among animals on huge factory farms, and to promote faster growth. But this is dangerous: bacteria are developing resistance to drugs that are vital to treat diseases in humans.
ANTIBIOTICS: BREEDING SUPERBUGS
Much stricter controls worldwide
are needed to stop the abuse of
medicines
How far we are – distribution of antibiotics and resistant bacteria in the USA
Antibiotic-resistant Enterococcus faecalis detected in supermarkets, 2011, percent of all samples E
WGSales of antibiotics, million pounds/kilograms
81turkey
69pork
55beef
39chicken
2001 2002 2003 2004 2005 2006 2007 2008 2009 2010 20110
for meat and poultry production to treat ill people
7.7
29.9 13.6
3.5
lbs kilograms
1020
10
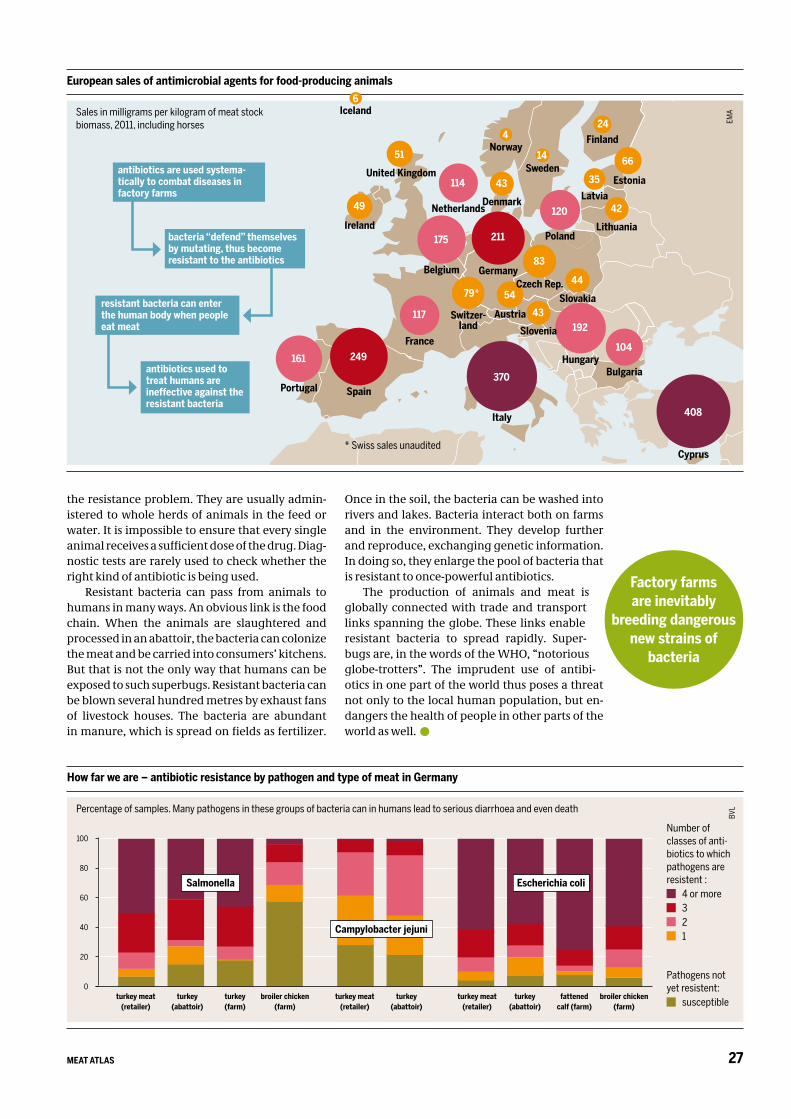
27MEAT ATLAS
the resistance problem. They are usually admin-istered to whole herds of animals in the feed or water. It is impossible to ensure that every single animal receives a sufficient dose of the drug. Diag-nostic tests are rarely used to check whether the right kind of antibiotic is being used.
Resistant bacteria can pass from animals to humans in many ways. An obvious link is the food chain. When the animals are slaughtered and processed in an abattoir, the bacteria can colonize the meat and be carried into consumers’ kitchens. But that is not the only way that humans can be exposed to such superbugs. Resistant bacteria can be blown several hundred metres by exhaust fans of livestock houses. The bacteria are abundant in manure, which is spread on fields as fertilizer.
Once in the soil, the bacteria can be washed into rivers and lakes. Bacteria interact both on farms and in the environment. They develop further and reproduce, exchanging genetic information. In doing so, they enlarge the pool of bacteria that is resistant to once-powerful antibiotics.
The production of animals and meat is globally connected with trade and transport links spanning the globe. These links enable resistant bacteria to spread rapidly. Super-bugs are, in the words of the WHO, “notorious globe-trotters”. The imprudent use of antibi-otics in one part of the world thus poses a threat not only to the local human population, but en-dangers the health of people in other parts of the world as well.
How far we are – antibiotic resistance by pathogen and type of meat in Germany
European sales of antimicrobial agents for food-producing animals
Sales in milligrams per kilogram of meat stock biomass, 2011, including horses
Percentage of samples. Many pathogens in these groups of bacteria can in humans lead to serious diarrhoea and even death
BVL
0
20
40
60
80
100
turkey meat (retailer)
turkey (abattoir)
turkey (farm)
broiler chicken (farm)
turkey meat (retailer)
turkey (abattoir)
turkey meat (retailer)
turkey (abattoir)
broiler chicken (farm)
fattened calf (farm)
Salmonella
Campylobacter jejuni
Escherichia coli
Number of classes of anti-biotics to which pathogens are resistent : 4 or more 3 2 1
Pathogens not yet resistent: susceptible
Factory farms are inevitably
breeding dangerousnew strains of
bacteria
EMA
Austria
54
Belgium
175
Bulgaria
104
Cyprus
408
Czech Rep.
83
Denmark
43
Finland24
France
117
Germany
211
Hungary
192
Iceland6
Ireland
49
Italy
370
Latvia
35
Lithuania
42Netherlands
114
Norway4
Poland
120
Portugal
161
Slovakia
44
Slovenia
43
Spain
249
Sweden14
Switzer-land
79*
United Kingdom
51antibiotics are used systema-tically to combat diseases in factory farms
bacteria “defend” themselves by mutating, thus become resistant to the antibiotics
resistant bacteria can enter the human body when people eat meat
antibiotics used to treat humans are ineffective against the resistant bacteria
Estonia
66
* Swiss sales unaudited
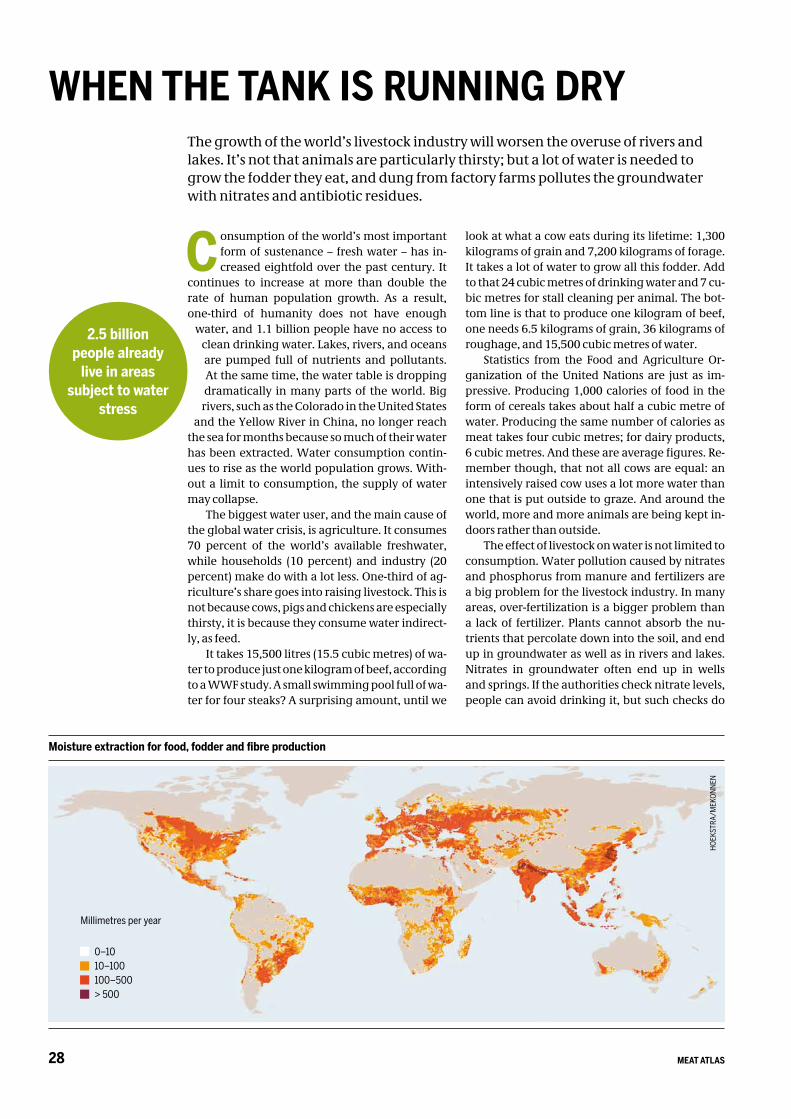
MEAT ATLAS28
C onsumption of the world’s most important form of sustenance – fresh water – has in-creased eightfold over the past century. It
continues to increase at more than double the rate of human population growth. As a result, one-third of humanity does not have enough
water, and 1.1 billion people have no access to clean drinking water. Lakes, rivers, and oceans are pumped full of nutrients and pollutants. At the same time, the water table is dropping dramatically in many parts of the world. Big
rivers, such as the Colorado in the United States and the Yellow River in China, no longer reach
the sea for months because so much of their water has been extracted. Water consumption contin-ues to rise as the world population grows. With-out a limit to consumption, the supply of water may collapse.
The biggest water user, and the main cause of the global water crisis, is agriculture. It consumes 70 percent of the world’s available freshwater, while households (10 percent) and industry (20 percent) make do with a lot less. One-third of ag-riculture’s share goes into raising livestock. This is not because cows, pigs and chickens are especially thirsty, it is because they consume water indirect-ly, as feed.
It takes 15,500 litres (15.5 cubic metres) of wa-ter to produce just one kilogram of beef, according to a WWF study. A small swimming pool full of wa-ter for four steaks? A surprising amount, until we
look at what a cow eats during its lifetime: 1,300 kilograms of grain and 7,200 kilograms of forage. It takes a lot of water to grow all this fodder. Add to that 24 cubic metres of drinking water and 7 cu-bic metres for stall cleaning per animal. The bot-tom line is that to produce one kilogram of beef, one needs 6.5 kilograms of grain, 36 kilograms of roughage, and 15,500 cubic metres of water.
Statistics from the Food and Agriculture Or-ganization of the United Nations are just as im-pressive. Producing 1,000 calories of food in the form of cereals takes about half a cubic metre of water. Producing the same number of calories as meat takes four cubic metres; for dairy products, 6 cubic metres. And these are average figures. Re-member though, that not all cows are equal: an intensively raised cow uses a lot more water than one that is put outside to graze. And around the world, more and more animals are being kept in-doors rather than outside.
The effect of livestock on water is not limited to consumption. Water pollution caused by nitrates and phosphorus from manure and fertilizers are a big problem for the livestock industry. In many areas, over-fertilization is a bigger problem than a lack of fertilizer. Plants cannot absorb the nu-trients that percolate down into the soil, and end up in groundwater as well as in rivers and lakes. Nitrates in groundwater often end up in wells and springs. If the authorities check nitrate levels, people can avoid drinking it, but such checks do
Moisture extraction for food, fodder and fibre production
HOEK
STRA
/MEK
ONNE
N
Millimetres per year
0–1010–100100–500> 500
The growth of the world’s livestock industry will worsen the overuse of rivers and lakes. It’s not that animals are particularly thirsty; but a lot of water is needed to grow the fodder they eat, and dung from factory farms pollutes the groundwater with nitrates and antibiotic residues.
WHEN THE TANK IS RUNNING DRY
2.5 billionpeople already
live in areas subject to water
stress
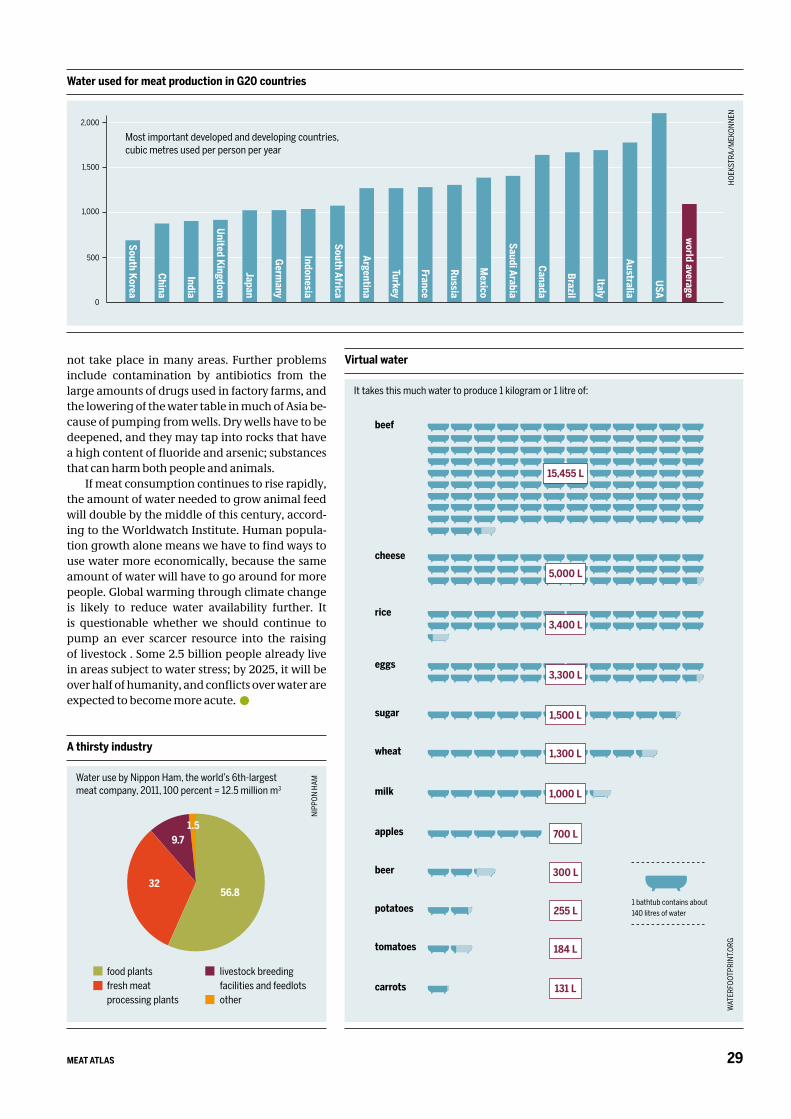
29MEAT ATLAS
not take place in many areas. Further problems include contamination by antibiotics from the large amounts of drugs used in factory farms, and the lowering of the water table in much of Asia be-cause of pumping from wells. Dry wells have to be deepened, and they may tap into rocks that have a high content of fluoride and arsenic; substances that can harm both people and animals.
If meat consumption continues to rise rapidly, the amount of water needed to grow animal feed will double by the middle of this century, accord-ing to the Worldwatch Institute. Human popula-tion growth alone means we have to find ways to use water more economically, because the same amount of water will have to go around for more people. Global warming through climate change is likely to reduce water availability further. It is questionable whether we should continue to pump an ever scarcer resource into the raising of livestock . Some 2.5 billion people already live in areas subject to water stress; by 2025, it will be over half of humanity, and conflicts over water are expected to become more acute.
Virtual water
Water used for meat production in G20 countries
Most important developed and developing countries,cubic metres used per person per year
0
500
1,000
1,500
2,000
South Korea
China
India
United Kingdom
Japan
Germ
any
Indonesia
South Africa
Argentina
Turkey
France
Russia
Mexico
Saudi Arabia
Canada
Brazil
Italy
Australia
USA
world average
It takes this much water to produce 1 kilogram or 1 litre of:
rice3,400 L
eggs3,300 L
sugar 1,500 L
wheat 1,300 L
milk 1,000 L
apples 700 L
beer 300 L
potatoes 255 L
tomatoes 184 L
carrots 131 L
1 bathtub contains about 140 litres of water
WAT
ERFO
OTPR
INT.O
RGHO
EKST
RA/M
EKON
NEN
cheese
5,000 L
beef
15,455 L
A thirsty industry
Water use by Nippon Ham, the world’s 6th-largest meat company, 2011, 100 percent = 12.5 million m3
NIPP
ON H
AM
56.832
9.71.5
food plantsfresh meat processing plants
livestock breeding facilities and feedlotsother
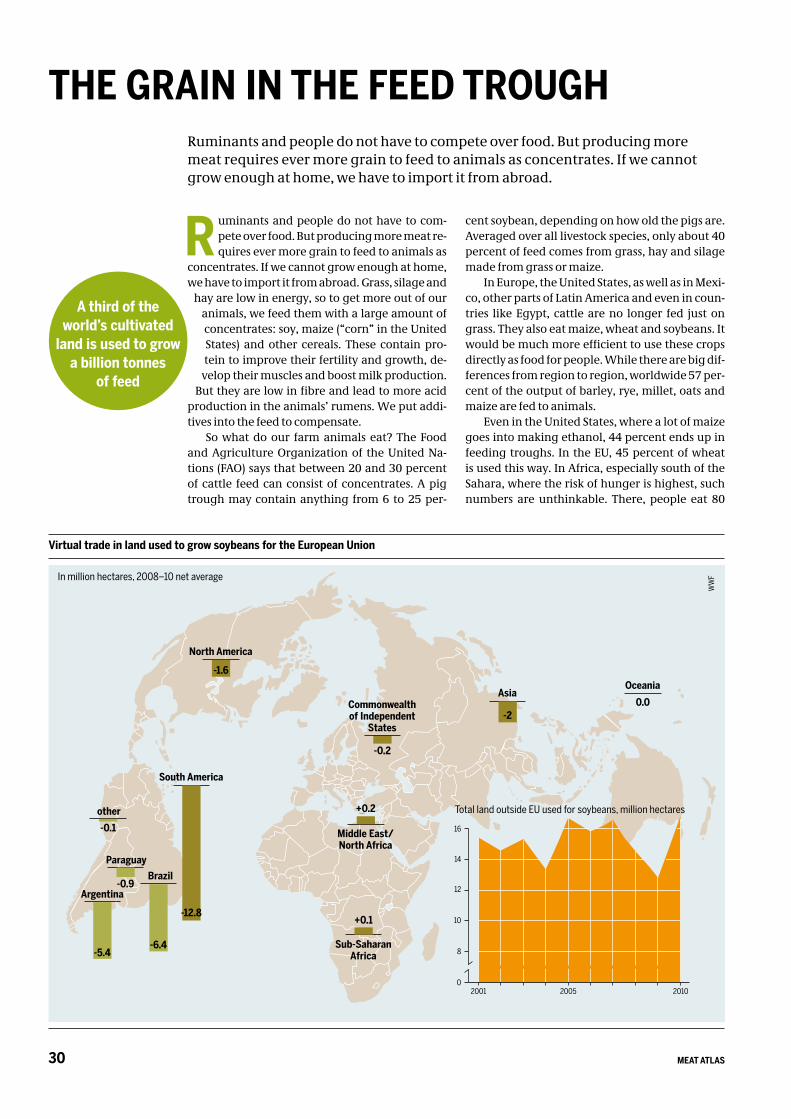
MEAT ATLAS30
R uminants and people do not have to com-pete over food. But producing more meat re-quires ever more grain to feed to animals as
concentrates. If we cannot grow enough at home, we have to import it from abroad. G rass, silage and
hay are low in energy, so to get more out of our animals, we feed them with a large amount of concentrates: soy, maize (“corn” in the United States) and other cereals. These contain pro-tein to improve their fertility and growth, de-
velop their muscles and boost milk production. But they are low in fibre and lead to more acid
production in the animals’ rumens. We put addi-tives into the feed to compensate.
So what do our farm animals eat? The Food and Agriculture Organization of the United Na-tions (FAO) says that between 20 and 30 percent of cattle feed can consist of concentrates. A pig trough may contain anything from 6 to 25 per-
cent soybean, depending on how old the pigs are. Averaged over all livestock species, only about 40 percent of feed comes from grass, hay and silage made from grass or maize.
In Europe, the United States, as well as in Mexi-co, other parts of Latin America and even in coun-tries like Egypt, cattle are no longer fed just on grass. They also eat maize, wheat and soybeans. It would be much more efficient to use these crops directly as food for people. While there are big dif-ferences from region to region, worldwide 57 per-cent of the output of barley, rye, millet, oats and maize are fed to animals.
Even in the United States, where a lot of maize goes into making ethanol, 44 percent ends up in feeding troughs. In the EU, 45 percent of wheat is used this way. In Africa, especially south of the Sahara, where the risk of hunger is highest, such numbers are unthinkable. There, people eat 80
Virtual trade in land used to grow soybeans for the European Union
In million hectares, 2008–10 net average
WW
F
FEED
Ruminants and people do not have to compete over food. But producing more meat requires ever more grain to feed to animals as concentrates. If we cannot grow enough at home, we have to import it from abroad.
THE GRAIN IN THE FEED TROUGH
A third of theworld’s cultivated
land is used to grow a billion tonnes
of feed
Middle East/ North Africa
+0.2
Sub-Saharan Africa
+0.1
Commonwealth of Independent
States
-0.2
-0.9
-5.4
South America
-12.8
Asia
-2
North America
-1.6
Total land outside EU used for soybeans, million hectares
0
8
10
12
2001 2005 2010
14
Oceania
0.0
Argentina
Paraguay
-6.4
Brazil
-0.1
other
16
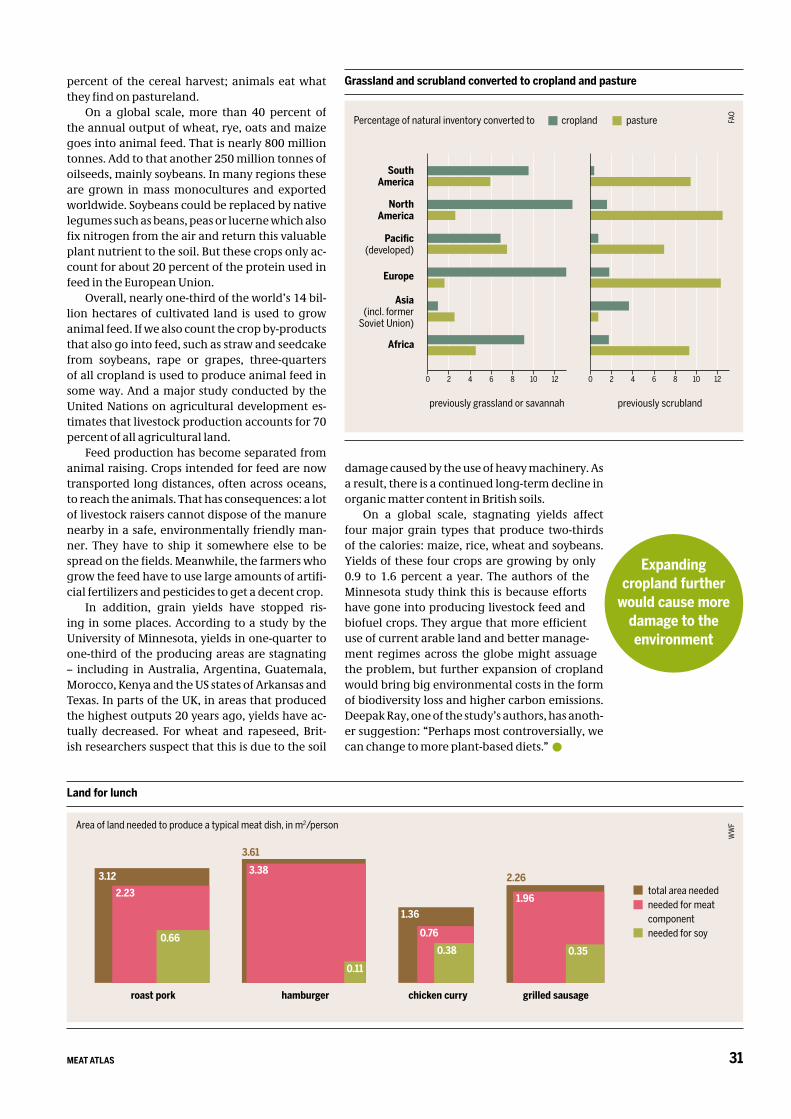
31MEAT ATLAS
percent of the cereal harvest; animals eat what they find on pastureland.
On a global scale, more than 40 percent of the annual output of wheat, rye, oats and maize goes into animal feed. That is nearly 800 million tonnes. Add to that another 250 million tonnes of oilseeds, mainly soybeans. In many regions these are grown in mass monocultures and exported worldwide. Soybeans could be replaced by native legumes such as beans, peas or lucerne which also fix nitrogen from the air and return this valuable plant nutrient to the soil. But these crops only ac-count for about 20 percent of the protein used in feed in the European Union.
Overall, nearly one-third of the world’s 14 bil-lion hectares of cultivated land is used to grow animal feed. If we also count the crop by-products that also go into feed, such as straw and seedcake from soybeans, rape or grapes, three-quarters of all cropland is used to produce animal feed in some way. And a major study conducted by the United Nations on agricultural development es-timates that livestock production accounts for 70 percent of all agricultural land.
Feed production has become separated from animal raising. Crops intended for feed are now transported long distances, often across oceans, to reach the animals. That has consequences: a lot of livestock raisers cannot dispose of the manure nearby in a safe, environmentally friendly man-ner. They have to ship it somewhere else to be spread on the fields. Meanwhile, the farmers who grow the feed have to use large amounts of artifi-cial fertilizers and pesticides to get a decent crop.
In addition, grain yields have stopped ris-ing in some places. According to a study by the University of Minnesota, yields in one-quarter to one-third of the producing areas are stagnating – including in Australia, Argentina, Guatemala, Morocco, Kenya and the US states of Arkansas and Texas. In parts of the UK, in areas that produced the highest outputs 20 years ago, yields have ac-tually decreased. For wheat and rapeseed, Brit-ish researchers suspect that this is due to the soil
damage caused by the use of heavy machinery. As a result, there is a continued long-term decline in organic matter content in British soils.
On a global scale, stagnating yields affect four major grain types that produce two-thirds of the calories: maize, rice, wheat and soybeans. Yields of these four crops are growing by only 0.9 to 1.6 percent a year. The authors of the Minnesota study think this is because efforts have gone into producing livestock feed and biofuel crops. They argue that more efficient use of current arable land and better manage-ment regimes across the globe might assuage the problem, but further expansion of cropland would bring big environmental costs in the form of biodiversity loss and higher carbon emissions. Deepak Ray, one of the study’s authors, has anoth-er suggestion: “Perhaps most controversially, we can change to more plant-based diets.”
Area of land needed to produce a typical meat dish, in m2/person
Land for lunch
WW
F
Percentage of natural inventory converted to cropland pasture
Grassland and scrubland converted to cropland and pasture
FAO
Africa
Asia (incl. former
Soviet Union)
Europe
Pacific (developed)
North America
South America
FEED
Expanding cropland further
would cause more damage to the environment
3.12
2.23
0.66
3.61
3.38
0.11
1.36
0.76
0.38
2.26
1.96
0.35
roast pork hamburger chicken curry grilled sausage
total area neededneeded for meat componentneeded for soy
0 2 4 6 8 10 12
previously scrubland
0 2 4 6 8 10 12
previously grassland or savannah
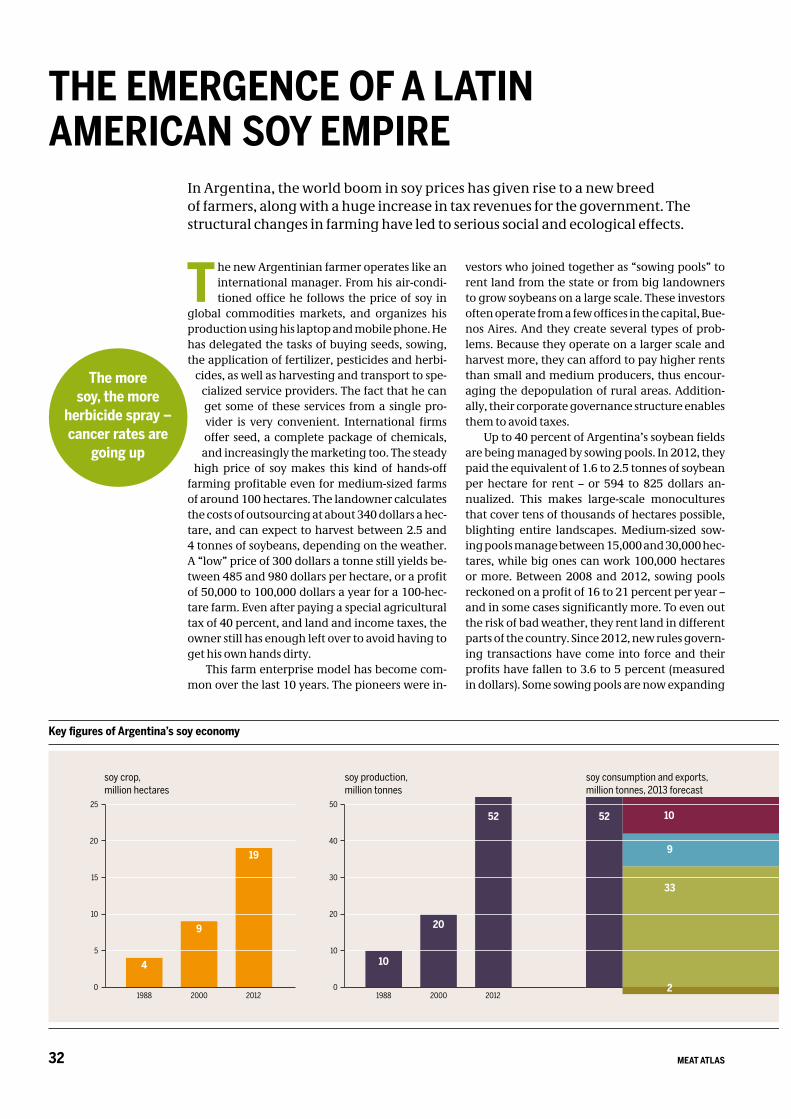
MEAT ATLAS32
T he new Argentinian farmer operates like an international manager. From his air-condi-tioned office he follows the price of soy in
global commodities markets, and organizes his production using his laptop and mobile phone. He has delegated the tasks of buying seeds, sowing, the application of fertilizer, pesticides and herbi-
cides, as well as harvesting and transport to spe-cialized service providers. The fact that he can get some of these services from a single pro-vider is very convenient. International firms offer seed, a complete package of chemicals,
and increasingly the marketing too. The steady high price of soy makes this kind of hands-off
farming profitable even for medium-sized farms of around 100 hectares. The landowner calculates the costs of outsourcing at about 340 dollars a hec-tare, and can expect to harvest between 2.5 and 4 tonnes of soybeans, depending on the weather. A “low” price of 300 dollars a tonne still yields be-tween 485 and 980 dollars per hectare, or a profit of 50,000 to 100,000 dollars a year for a 100-hec-tare farm. Even after paying a special agricultural tax of 40 percent, and land and income taxes, the owner still has enough left over to avoid having to get his own hands dirty.
This farm enterprise model has become com-mon over the last 10 years. The pioneers were in-
vestors who joined together as “sowing pools” to rent land from the state or from big landowners to grow soybeans on a large scale. These investors often operate from a few offices in the capital, Bue-nos Aires. And they create several types of prob-lems. Because they operate on a larger scale and harvest more, they can afford to pay higher rents than small and medium producers, thus encour-aging the depopulation of rural areas. Addition-ally, their corporate governance structure enables them to avoid taxes.
Up to 40 percent of Argentina’s soybean fields are being managed by sowing pools. In 2012, they paid the equivalent of 1.6 to 2.5 tonnes of soybean per hectare for rent – or 594 to 825 dollars an-nualized. This makes large-scale monocultures that cover tens of thousands of hectares possible, blighting entire landscapes. Medium-sized sow-ing pools manage between 15,000 and 30,000 hec-tares, while big ones can work 100,000 hectares or more. Between 2008 and 2012, sowing pools reckoned on a profit of 16 to 21 percent per year – and in some cases significantly more. To even out the risk of bad weather, they rent land in different parts of the country. Since 2012, new rules govern-ing transactions have come into force and their profits have fallen to 3.6 to 5 percent (measured in dollars). Some sowing pools are now expanding
In Argentina, the world boom in soy prices has given rise to a new breed of farmers, along with a huge increase in tax revenues for the government. Thestructural changes in farming have led to serious social and ecological effects.
THE EMERGENCE OF A LATIN AMERICAN SOY EMPIRE
SOY
The moresoy, the more
herbicide spray –cancer rates are
going up
Key figures of Argentina’s soy economy
soy crop, million hectares
0
5
10
15
20
25
4
9
19
1988 2000 20120
10
20
30
40
50
10
20
52
1988 2000 2012
52 10
9
33
soy production, million tonnes
soy consumption and exports,million tonnes, 2013 forecast
2
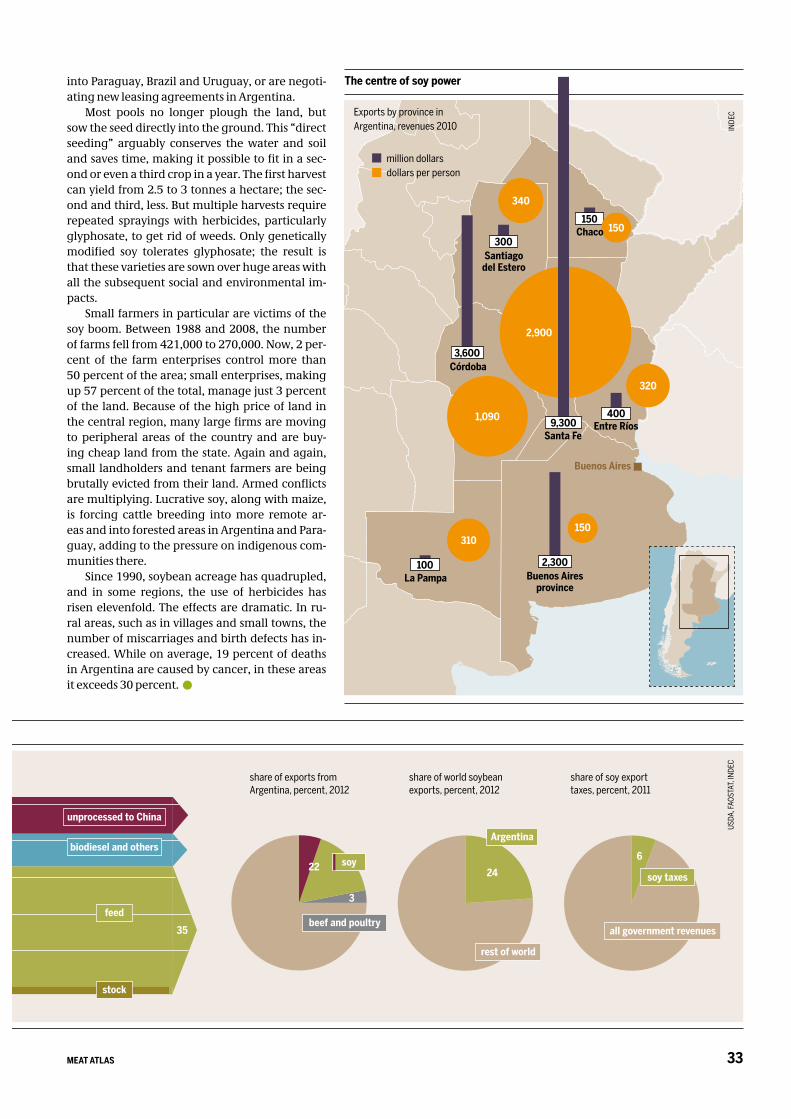
33MEAT ATLAS
SOYinto Paraguay, Brazil and Uruguay, or are negoti-ating new leasing agreements in Argentina.
Most pools no longer plough the land, but sow the seed directly into the ground. This “direct seeding” arguably conserves the water and soil and saves time, making it possible to fit in a sec-ond or even a third crop in a year. The first harvest can yield from 2.5 to 3 tonnes a hectare; the sec-ond and third, less. But multiple harvests require repeated sprayings with herbicides, particularly glyphosate, to get rid of weeds. Only genetically modified soy tolerates glyphosate; the result is that these varieties are sown over huge areas with all the subsequent social and environmental im-pacts.
Small farmers in particular are victims of the soy boom. Between 1988 and 2008, the number of farms fell from 421,000 to 270,000. Now, 2 per-cent of the farm enterprises control more than 50 percent of the area; small enterprises, making up 57 percent of the total, manage just 3 percent of the land. Because of the high price of land in the central region, many large firms are moving to peripheral areas of the country and are buy-ing cheap land from the state. Again and again, small landholders and tenant farmers are being brutally evicted from their land. Armed conflicts are multiplying. Lucrative soy, along with maize, is forcing cattle breeding into more remote ar-eas and into forested areas in Argentina and Para-guay, adding to the pressure on indigenous com-munities there.
Since 1990, soybean acreage has quadrupled, and in some regions, the use of herbicides has risen elevenfold. The effects are dramatic. In ru-ral areas, such as in villages and small towns, the number of miscarriages and birth defects has in-creased. While on average, 19 percent of deaths in Argentina are caused by cancer, in these areas it exceeds 30 percent.
USDA
, FAO
STAT
, IND
EC
The centre of soy power
Exports by province in Argentina, revenues 2010 IN
DEC
2,300100
3,600
300
150
million dollarsdollars per person
150
2,900
1,090
320
340
310
150
4009,300
6
soy consumption and exports,million tonnes, 2013 forecast
unprocessed to China
biodiesel and others
feed
share of exports from Argentina, percent, 2012
share of soy export taxes, percent, 2011
all government revenues
stock
35
Entre RíosSanta Fe
Buenos Aires province
La Pampa
Córdoba
Chaco
Santiago del Estero
Buenos Aires
share of world soybean exports, percent, 2012
22
3
soy
beef and poultry
soy taxes24
Argentina
rest of world
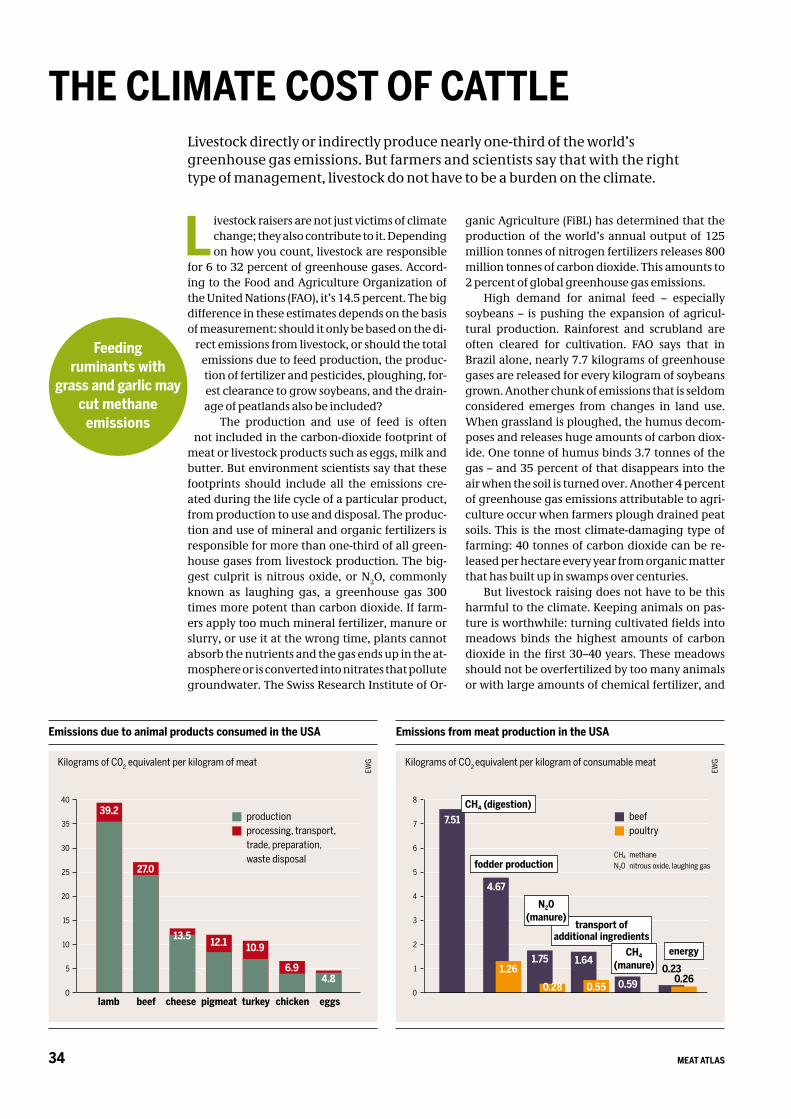
MEAT ATLAS34
L ivestock raisers are not just victims of climate change; they also contribute to it. Depending on how you count, livestock are responsible
for 6 to 32 percent of greenhouse gases. Accord-ing to the Food and Agriculture Organization of the United Nations (FAO), it’s 14.5 percent. The big difference in these estimates depends on the basis of measurement: should it only be based on the di-
rect emissions from livestock, or should the total emissions due to feed production, the produc-tion of fertilizer and pesticides, ploughing, for-est clearance to grow soybeans, and the drain-age of peatlands also be included?
The production and use of feed is often not included in the carbon-dioxide footprint of
meat or livestock products such as eggs, milk and butter. But environment scientists say that these footprints should include all the emissions cre-ated during the life cycle of a particular product, from production to use and disposal. The produc-tion and use of mineral and organic fertilizers is responsible for more than one-third of all green-house gases from livestock production. The big-gest culprit is nitrous oxide, or N2O, commonly known as laughing gas, a greenhouse gas 300 times more potent than carbon dioxide. If farm-ers apply too much mineral fertilizer, manure or slurry, or use it at the wrong time, plants cannot absorb the nutrients and the gas ends up in the at-mosphere or is converted into nitrates that pollute groundwater. The Swiss Research Institute of Or-
ganic Agriculture (FiBL) has determined that the production of the world’s annual output of 125 million tonnes of nitrogen fertilizers releases 800 million tonnes of carbon dioxide. This amounts to 2 percent of global greenhouse gas emissions.
High demand for animal feed – especially soybeans – is pushing the expansion of agricul-tural production. Rainforest and scrubland are often cleared for cultivation. FAO says that in Brazil alone, nearly 7.7 kilograms of greenhouse gases are released for every kilogram of soybeans grown. Another chunk of emissions that is seldom considered emerges from changes in land use. When grassland is ploughed, the humus decom-poses and releases huge amounts of carbon diox-ide. One tonne of humus binds 3.7 tonnes of the gas – and 35 percent of that disappears into the air when the soil is turned over. Another 4 percent of greenhouse gas emissions attributable to agri-culture occur when farmers plough drained peat soils. This is the most climate-damaging type of farming: 40 tonnes of carbon dioxide can be re-leased per hectare every year from organic matter that has built up in swamps over centuries.
But livestock raising does not have to be this harmful to the climate. Keeping animals on pas-ture is worthwhile: turning cultivated fields into meadows binds the highest amounts of carbon dioxide in the first 30–40 years. These meadows should not be overfertilized by too many animals or with large amounts of chemical fertilizer, and
Livestock directly or indirectly produce nearly one-third of the world’s greenhouse gas emissions. But farmers and scientists say that with the right type of management, livestock do not have to be a burden on the climate.
THE CLIMATE COST OF CATTLE
Feedingruminants with
grass and garlic maycut methane
emissions
Kilograms of C02 equivalent per kilogram of meat
Emissions due to animal products consumed in the USA Emissions from meat production in the USA
Kilograms of CO2 equivalent per kilogram of consumable meat
EWG
EWG
0
5
10
15
20
25
30
35
40
lamb beef cheese pigmeat turkey chicken eggs
39.2
27.0
13.5 12.1 10.9
6.94.8
productionprocessing, transport, trade, preparation, waste disposal
0
1
2
3
4
5
6
7
8
beefpoultry
1.26
0.28 0.550.26
7.51
4.67
1.75 1.64
0.590.23
CH4 (digestion)
fodder production
transport of additional ingredients
CH4 (manure)
energy
CH4 methaneN20 nitrous oxide, laughing gas
N20 (manure)
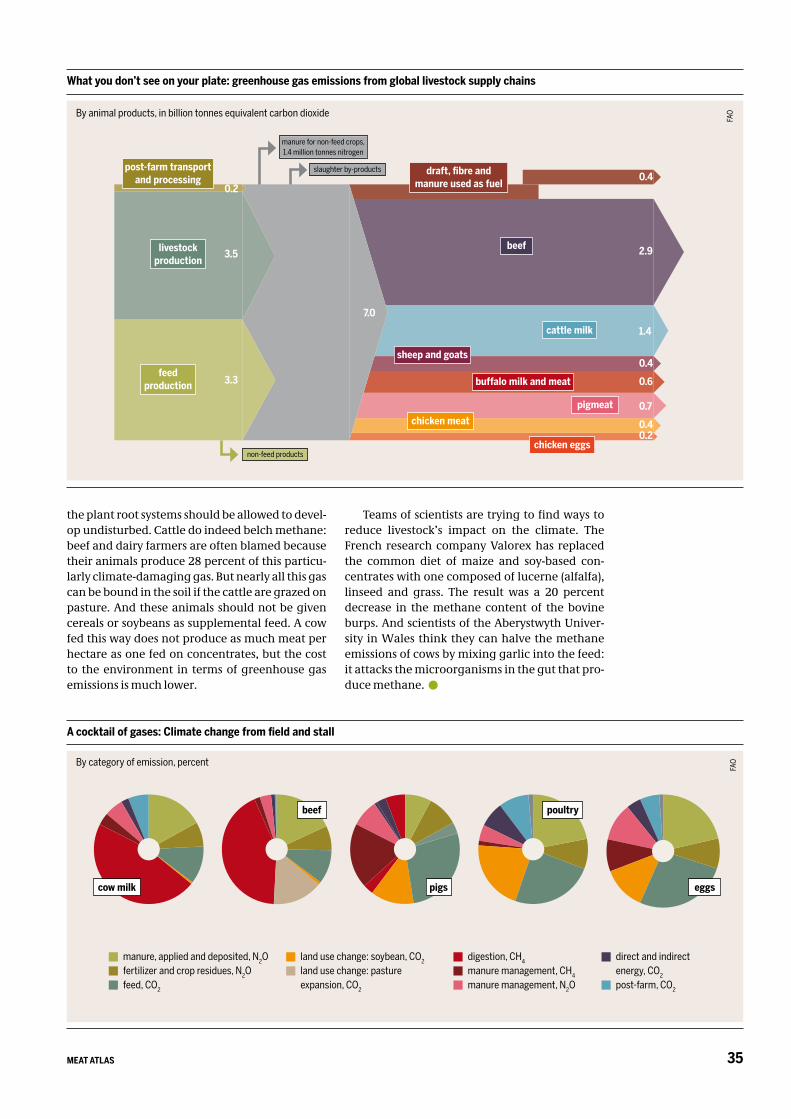
35MEAT ATLAS
the plant root systems should be allowed to devel-op undisturbed. Cattle do indeed belch methane: beef and dairy farmers are often blamed because their animals produce 28 percent of this particu-larly climate-damaging gas. But nearly all this gas can be bound in the soil if the cattle are grazed on pasture. And these animals should not be given cereals or soybeans as supplemental feed. A cow fed this way does not produce as much meat per hectare as one fed on concentrates, but the cost to the environment in terms of greenhouse gas emissions is much lower.
Teams of scientists are trying to find ways to reduce livestock’s impact on the climate. The French research company Valorex has replaced the common diet of maize and soy-based con-centrates with one composed of lucerne (alfalfa), linseed and grass. The result was a 20 percent decrease in the methane content of the bovine burps. And scientists of the Aberystwyth Univer-sity in Wales think they can halve the methane emissions of cows by mixing garlic into the feed: it attacks the microorganisms in the gut that pro-duce methane.
By category of emission, percent
A cocktail of gases: Climate change from field and stallFA
O
eggspigscow milk
beef poultry
manure, applied and deposited, N2Ofertilizer and crop residues, N2Ofeed, CO2
land use change: soybean, CO2
land use change: pasture expansion, CO2
digestion, CH4
manure management, CH4
manure management, N2O
direct and indirect energy, CO2
post-farm, CO2
What you don’t see on your plate: greenhouse gas emissions from global livestock supply chains
By animal products, in billion tonnes equivalent carbon dioxide
FAO
3.5
3.3
post-farm transport and processing
0.20.4
beef 2.9
1.4
0.4
0.6
0.7
0.40.2
chicken eggs
pigmeat
buffalo milk and meat
sheep and goats
cattle milk
chicken meat
draft, fibre and manure used as fuel
livestock production
feed production
7.0
manure for non-feed crops, 1.4 million tonnes nitrogen
slaughter by-products
non-feed products
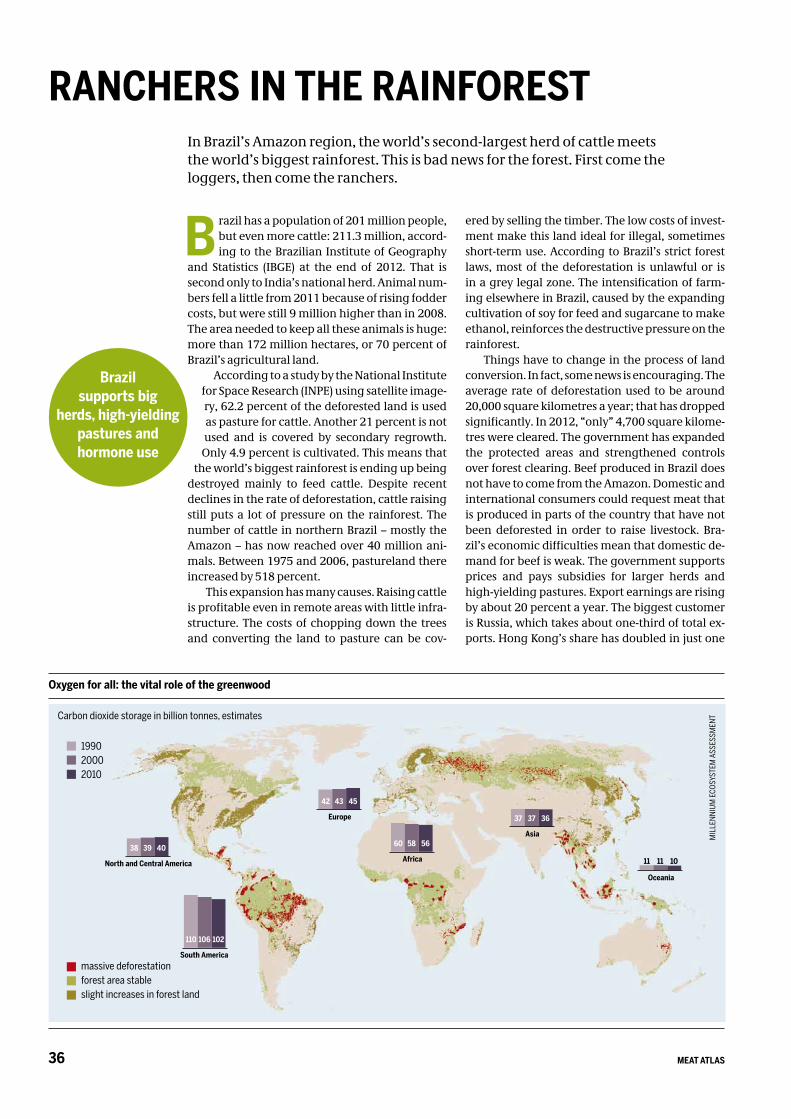
MEAT ATLAS36
B razil has a population of 201 million people, but even more cattle: 211.3 million, accord-ing to the Brazilian Institute of Geography
and Statistics (IBGE) at the end of 2012. That is second only to India’s national herd. Animal num-bers fell a little from 2011 because of rising fodder costs, but were still 9 million higher than in 2008. The area needed to keep all these animals is huge: more than 172 million hectares, or 70 percent of Brazil’s agricultural land.
According to a study by the National Institute for Space Research (INPE) using satellite image-ry, 62.2 percent of the deforested land is used as pasture for cattle. Another 21 percent is not used and is covered by secondary regrowth.
Only 4.9 percent is cultivated. This means that the world’s biggest rainforest is ending up being
destroyed mainly to feed cattle. Despite recent declines in the rate of deforestation, cattle raising still puts a lot of pressure on the rainforest. The number of cattle in northern Brazil – mostly the Amazon – has now reached over 40 million ani-mals. Between 1975 and 2006, pastureland there increased by 518 percent.
This expansion has many causes. Raising cattle is profitable even in remote areas with little infra-structure. The costs of chopping down the trees and converting the land to pasture can be cov-
ered by selling the timber. The low costs of invest-ment make this land ideal for illegal, sometimes short-term use. According to Brazil’s strict forest laws, most of the deforestation is unlawful or is in a grey legal zone. The intensification of farm-ing elsewhere in Brazil, caused by the expanding cultivation of soy for feed and sugarcane to make ethanol, reinforces the destructive pressure on the rainforest.
Things have to change in the process of land conversion. In fact, some news is encouraging. The average rate of deforestation used to be around 20,000 square kilometres a year; that has dropped significantly. In 2012, “only” 4,700 square kilome-tres were cleared. The government has expanded the protected areas and strengthened controls over forest clearing. Beef produced in Brazil does not have to come from the Amazon. Domestic and international consumers could request meat that is produced in parts of the country that have not been deforested in order to raise livestock. Bra-zil’s economic difficulties mean that domestic de-mand for beef is weak. The government supports prices and pays subsidies for larger herds and high-yielding pastures. Export earnings are rising by about 20 percent a year. The biggest customer is Russia, which takes about one-third of total ex-ports. Hong Kong’s share has doubled in just one
In Brazil’s Amazon region, the world’s second-largest herd of cattle meets the world’s biggest rainforest. This is bad news for the forest. First come the loggers, then come the ranchers.
RANCHERS IN THE RAINFOREST
MIL
LENN
IUM
ECO
SYST
EM A
SSES
SMEN
T
199020002010
Oxygen for all: the vital role of the greenwood
Carbon dioxide storage in billion tonnes, estimates
58
Africa
60 56
37
Asia
37 36
43
Europe
42 45
39
North and Central America
38 40
11
Oceania
11 10
106
South America
110 102
massive deforestationforest area stableslight increases in forest land
AMAZON
Brazil supports big
herds, high-yielding pastures andhormone use
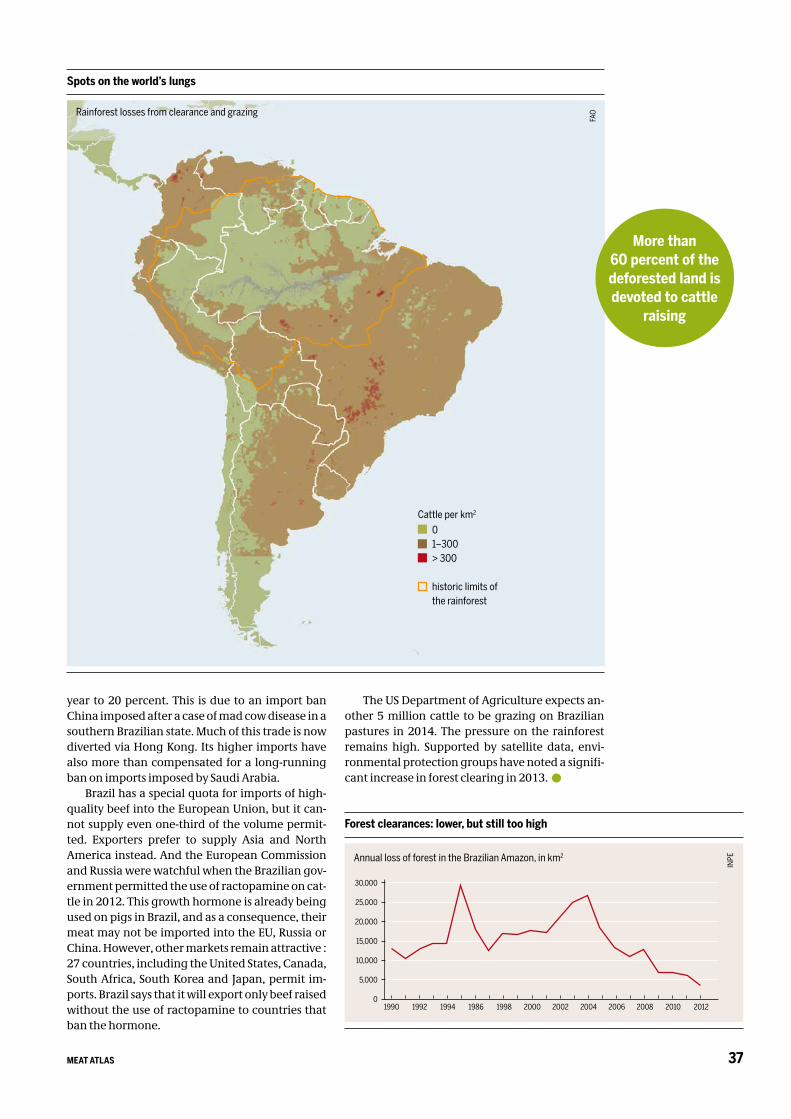
37MEAT ATLAS
year to 20 percent. This is due to an import ban China imposed after a case of mad cow disease in a southern Brazilian state. Much of this trade is now diverted via Hong Kong. Its higher imports have also more than compensated for a long-running ban on imports imposed by Saudi Arabia.
Brazil has a special quota for imports of high-quality beef into the European Union, but it can-not supply even one-third of the volume permit-ted. Exporters prefer to supply Asia and North America instead. And the European Commission and Russia were watchful when the Brazilian gov-ernment permitted the use of ractopamine on cat-tle in 2012. This growth hormone is already being used on pigs in Brazil, and as a consequence, their meat may not be imported into the EU, Russia or China. However, other markets remain attractive : 27 countries, including the United States, Canada, South Africa, South Korea and Japan, permit im-ports. Brazil says that it will export only beef raised without the use of ractopamine to countries that ban the hormone.
The US Department of Agriculture expects an-other 5 million cattle to be grazing on Brazilian pastures in 2014. The pressure on the rainforest remains high. Supported by satellite data, envi-ronmental protection groups have noted a signifi-cant increase in forest clearing in 2013.
Spots on the world’s lungs
01–300> 300
historic limits of the rainforest
Rainforest losses from clearance and grazing
FAO
AMAZON
Forest clearances: lower, but still too high
Annual loss of forest in the Brazilian Amazon, in km2
INPE
1990 1992 1994 1986 1998 2000 2002 2004 2006 2008 20100
5,000
10,000
15,000
20,000
25,000
30,000
More than60 percent of thedeforested land is devoted to cattle
raising
Cattle per km2
2012
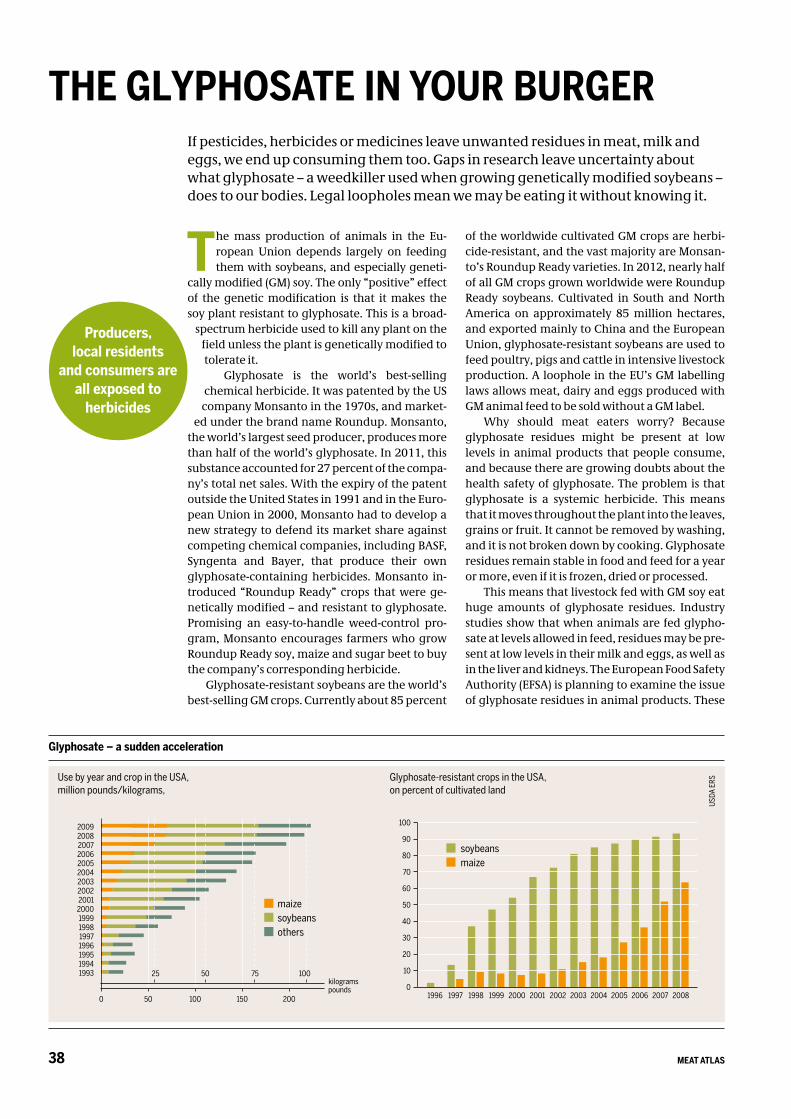
MEAT ATLAS38
T he mass production of animals in the Eu-ropean Union depends largely on feeding them with soybeans, and especially geneti-
cally modified (GM) soy. The only “positive” effect of the genetic modification is that it makes the soy plant resistant to glyphosate. This is a broad-
spectrum herbicide used to kill any plant on the field unless the plant is genetically modified to tolerate it.
Glyphosate is the world’s best-selling chemical herbicide. It was patented by the US
company Monsanto in the 1970s, and market-ed under the brand name Roundup. Monsanto,
the world’s largest seed producer, produces more than half of the world’s glyphosate. In 2011, this substance accounted for 27 percent of the compa-ny’s total net sales. With the expiry of the patent outside the United States in 1991 and in the Euro-pean Union in 2000, Monsanto had to develop a new strategy to defend its market share against competing chemical companies, including BASF, Syngenta and Bayer, that produce their own glyphosate-containing herbicides. Monsanto in-troduced “Roundup Ready” crops that were ge-netically modified – and resistant to glyphosate. Promising an easy-to-handle weed-control pro-gram, Monsanto encourages farmers who grow Roundup Ready soy, maize and sugar beet to buy the company’s corresponding herbicide.
Glyphosate-resistant soybeans are the world’s best-selling GM crops. Currently about 85 percent
of the worldwide cultivated GM crops are herbi-cide-resistant, and the vast majority are Monsan-to’s Roundup Ready varieties. In 2012, nearly half of all GM crops grown worldwide were Roundup Ready soybeans. Cultivated in South and North America on approximately 85 million hectares, and exported mainly to China and the European Union, glyphosate-resistant soybeans are used to feed poultry, pigs and cattle in intensive livestock production. A loophole in the EU’s GM labelling laws allows meat, dairy and eggs produced with GM animal feed to be sold without a GM label.
Why should meat eaters worry? Because glyphosate residues might be present at low levels in animal products that people consume, and because there are growing doubts about the health safety of glyphosate. The problem is that glyphosate is a systemic herbicide. This means that it moves throughout the plant into the leaves, grains or fruit. It cannot be removed by washing, and it is not broken down by cooking. Glyphosate residues remain stable in food and feed for a year or more, even if it is frozen, dried or processed.
This means that livestock fed with GM soy eat huge amounts of glyphosate residues. Industry studies show that when animals are fed glypho-sate at levels allowed in feed, residues may be pre-sent at low levels in their milk and eggs, as well as in the liver and kidneys. The European Food Safety Authority (EFSA) is planning to examine the issue of glyphosate residues in animal products. These
If pesticides, herbicides or medicines leave unwanted residues in meat, milk and eggs, we end up consuming them too. Gaps in research leave uncertainty about what glyphosate – a weedkiller used when growing genetically modified soybeans – does to our bodies. Legal loopholes mean we may be eating it without knowing it.
THE GLYPHOSATE IN YOUR BURGER
Producers, local residents
and consumers are all exposed to
herbicides
Glyphosate – a sudden acceleration
Use by year and crop in the USA, million pounds/kilograms,
Glyphosate-resistant crops in the USA, on percent of cultivated land
USDA
ERS
1993199419951996199719981999
2000200120022003200420052006200720082009
0 50 100 150 2000
10
20
30
40
50
60
70
80
90
100
1996 1997 1998 1999 2000 2001 2002 2003 2004 2005 2006 2007 2008
soybeansmaize
25 50 75 100kilogramspounds
maizesoybeansothers
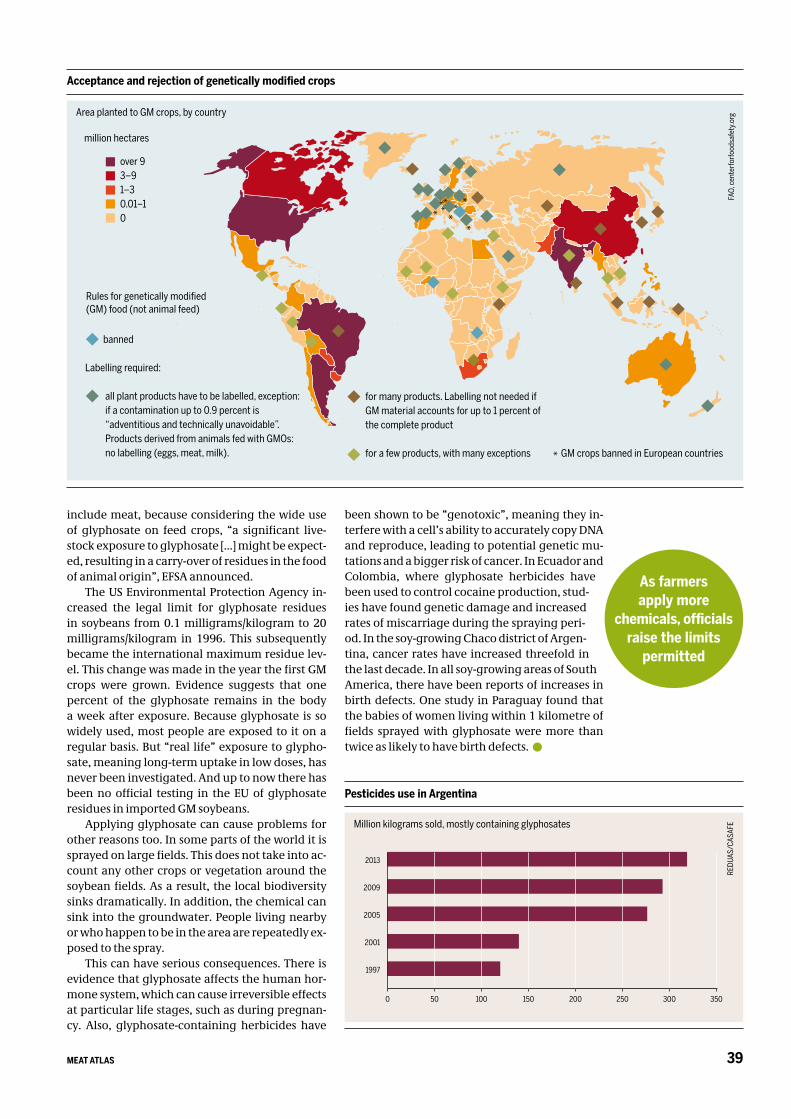
39MEAT ATLAS
include meat, because considering the wide use of glyphosate on feed crops, “a significant live-stock exposure to glyphosate […] might be expect-ed, resulting in a carry-over of residues in the food of animal origin”, EFSA announced.
The US Environmental Protection Agency in-creased the legal limit for glyphosate residues in soybeans from 0.1 milligrams/kilogram to 20 milligrams/kilogram in 1996. This subsequently became the international maximum residue lev-el. This change was made in the year the first GM crops were grown. Evidence suggests that one percent of the glyphosate remains in the body a week after exposure. Because glyphosate is so widely used, most people are exposed to it on a regular basis. But “real life” exposure to glypho-sate, meaning long-term uptake in low doses, has never been investigated. And up to now there has been no official testing in the EU of glyphosate residues in imported GM soybeans.
Applying glyphosate can cause problems for other reasons too. In some parts of the world it is sprayed on large fields. This does not take into ac-count any other crops or vegetation around the soybean fields. As a result, the local biodiversity sinks dramatically. In addition, the chemical can sink into the groundwater. People living nearby or who happen to be in the area are repeatedly ex-posed to the spray.
This can have serious consequences. There is evidence that glyphosate affects the human hor-mone system, which can cause irreversible effects at particular life stages, such as during pregnan-cy. Also, glyphosate-containing herbicides have
been shown to be “genotoxic”, meaning they in-terfere with a cell’s ability to accurately copy DNA and reproduce, leading to potential genetic mu-tations and a bigger risk of cancer. In Ecuador and Colombia, where glyphosate herbicides have been used to control cocaine production, stud-ies have found genetic damage and increased rates of miscarriage during the spraying peri-od. In the soy-growing Chaco district of Argen-tina, cancer rates have increased threefold in the last decade. In all soy-growing areas of South America, there have been reports of increases in birth defects. One study in Paraguay found that the babies of women living within 1 kilometre of fields sprayed with glyphosate were more than twice as likely to have birth defects.
Acceptance and rejection of genetically modified crops
Area planted to GM crops, by country
million hectares
over 93–91–30.01–10
FAO,
cen
terfo
rfood
safe
ty.o
rg
Rules for genetically modified (GM) food (not animal feed)
banned
Labelling required:
all plant products have to be labelled, exception: if a contamination up to 0.9 percent is “adventitious and technically unavoidable”. Products derived from animals fed with GMOs: no labelling (eggs, meat, milk).
Pesticides use in Argentina
Million kilograms sold, mostly containing glyphosates
REDU
AS/C
ASAF
E
As farmersapply more
chemicals, officialsraise the limits
permitted
1997
2001
2005
2009
2013
0 50 100 150 200 250 300 350
for many products. Labelling not needed if GM material accounts for up to 1 percent of the complete product
for a few products, with many exceptions GM crops banned in European countries
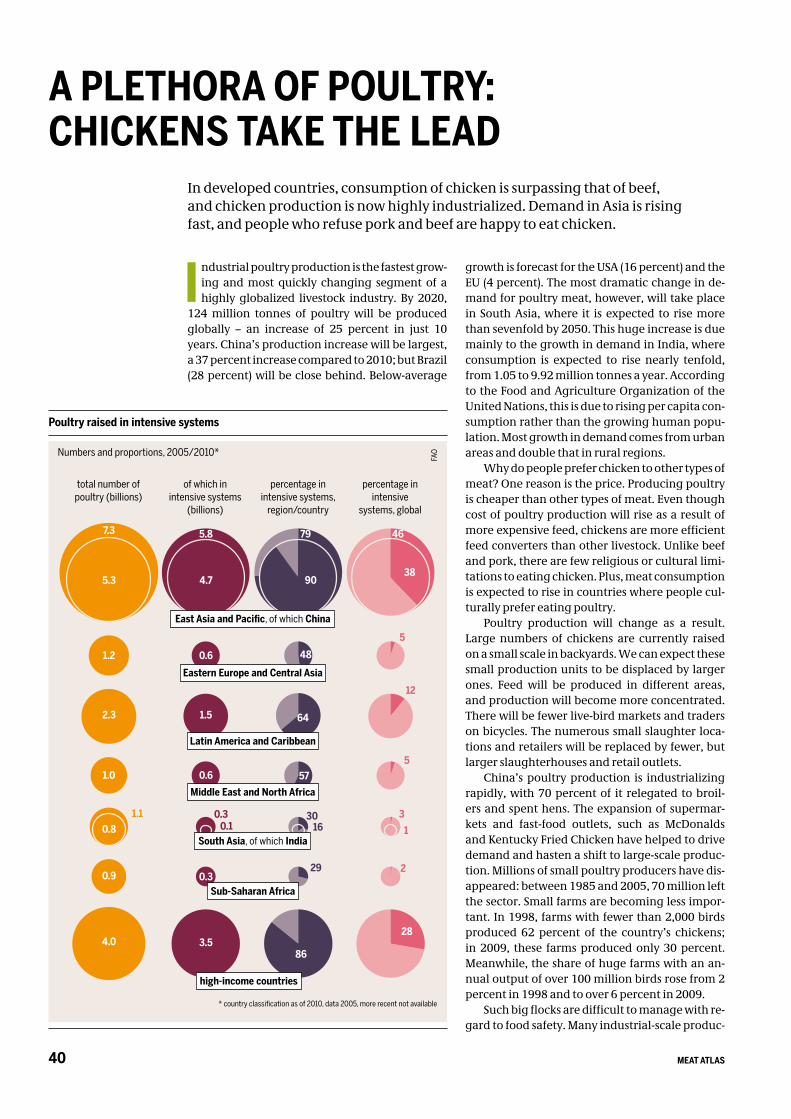
MEAT ATLAS40
I ndustrial poultry production is the fastest grow-ing and most quickly changing segment of a highly globalized livestock industry. By 2020,
124 million tonnes of poultry will be produced globally – an increase of 25 percent in just 10 years. China’s production increase will be largest, a 37 percent increase compared to 2010; but Brazil (28 percent) will be close behind. Below-average
growth is forecast for the USA (16 percent) and the EU (4 percent). The most dramatic change in de-mand for poultry meat, however, will take place in South Asia, where it is expected to rise more than sevenfold by 2050. This huge increase is due mainly to the growth in demand in India, where consumption is expected to rise nearly tenfold, from 1.05 to 9.92 million tonnes a year. According to the Food and Agriculture Organization of the United Nations, this is due to rising per capita con-sumption rather than the growing human popu-lation. Most growth in demand comes from urban areas and double that in rural regions.
Why do people prefer chicken to other types of meat? One reason is the price. Producing poultry is cheaper than other types of meat. Even though cost of poultry production will rise as a result of more expensive feed, chickens are more efficient feed converters than other livestock. Unlike beef and pork, there are few religious or cultural limi-tations to eating chicken. Plus, meat consumption is expected to rise in countries where people cul-turally prefer eating poultry.
Poultry production will change as a result. Large numbers of chickens are currently raised on a small scale in backyards. We can expect these small production units to be displaced by larger ones. Feed will be produced in different areas, and production will become more concentrated. There will be fewer live-bird markets and traders on bicycles. The numerous small slaughter loca-tions and retailers will be replaced by fewer, but larger slaughterhouses and retail outlets.
China’s poultry production is industrializing rapidly, with 70 percent of it relegated to broil-ers and spent hens. The expansion of supermar-kets and fast-food outlets, such as McDonalds and Kentucky Fried Chicken have helped to drive demand and hasten a shift to large-scale produc-tion. Millions of small poultry producers have dis-appeared: between 1985 and 2005, 70 million left the sector. Small farms are becoming less impor-tant. In 1998, farms with fewer than 2,000 birds produced 62 percent of the country’s chickens; in 2009, these farms produced only 30 percent. Meanwhile, the share of huge farms with an an-nual output of over 100 million birds rose from 2 percent in 1998 and to over 6 percent in 2009.
Such big flocks are difficult to manage with re-gard to food safety. Many industrial-scale produc-
In developed countries, consumption of chicken is surpassing that of beef, and chicken production is now highly industrialized. Demand in Asia is rising fast, and people who refuse pork and beef are happy to eat chicken.
A PLETHORA OF POULTRY:CHICKENS TAKE THE LEAD
POULTRY
Poultry raised in intensive systems
Numbers and proportions, 2005/2010*
FAO
* country classification as of 2010, data 2005, more recent not available
1.2
5.3
7.3
2.3
1.0
0.81.1
0.9
4.0
0.6
4.7
5.8
1.5
0.6
0.10.3
0.3
3.5
48
79
90
64
57
30
29
16
86
5
46
38
12
5
3
2
1
28
total number of poultry (billions)
of which in intensive systems
(billions)
percentage in intensive systems,
region/country
percentage in intensive
systems, global
East Asia and Pacific, of which China
Eastern Europe and Central Asia
Latin America and Caribbean
Middle East and North Africa
South Asia, of which India
Sub-Saharan Africa
high-income countries
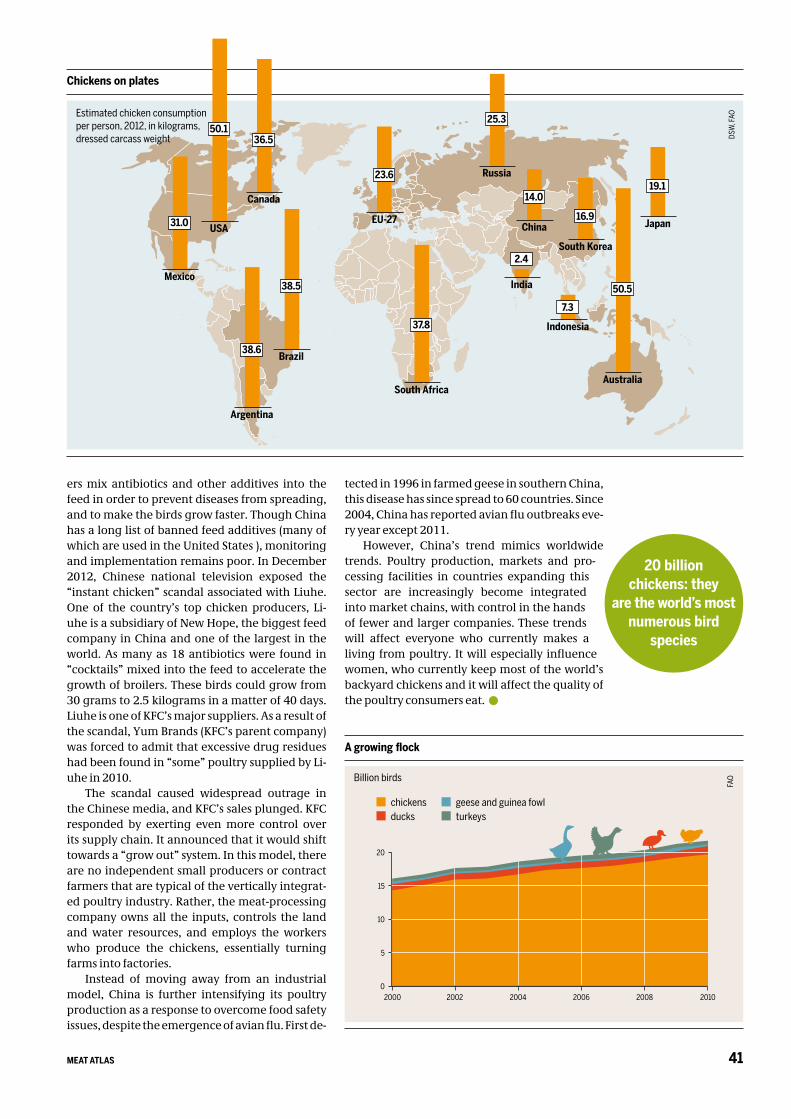
41MEAT ATLAS
ers mix antibiotics and other additives into the feed in order to prevent diseases from spreading, and to make the birds grow faster. Though China has a long list of banned feed additives (many of which are used in the United States ), monitoring and implementation remains poor. In December 2012, Chinese national television exposed the “instant chicken” scandal associated with Liuhe. One of the country’s top chicken producers, Li-uhe is a subsidiary of New Hope, the biggest feed company in China and one of the largest in the world. As many as 18 antibiotics were found in “cocktails” mixed into the feed to accelerate the growth of broilers. These birds could grow from 30 grams to 2.5 kilograms in a matter of 40 days. Liuhe is one of KFC’s major suppliers. As a result of the scandal, Yum Brands (KFC’s parent company) was forced to admit that excessive drug residues had been found in “some” poultry supplied by Li-uhe in 2010.
The scandal caused widespread outrage in the Chinese media, and KFC’s sales plunged. KFC responded by exerting even more control over its supply chain. It announced that it would shift towards a “grow out” system. In this model, there are no independent small producers or contract farmers that are typical of the vertically integrat-ed poultry industry. Rather, the meat-processing company owns all the inputs, controls the land and water resources, and employs the workers who produce the chickens, essentially turning farms into factories.
Instead of moving away from an industrial model, China is further intensifying its poultry production as a response to overcome food safety issues, despite the emergence of avian flu. First de-
tected in 1996 in farmed geese in southern China, this disease has since spread to 60 countries. Since 2004, China has reported avian flu outbreaks eve-ry year except 2011.
However, China’s trend mimics worldwide trends. Poultry production, markets and pro-cessing facilities in countries expanding this sector are increasingly become integrated into market chains, with control in the hands of fewer and larger companies. These trends will affect everyone who currently makes a living from poultry. It will especially influence women, who currently keep most of the world’s backyard chickens and it will affect the quality of the poultry consumers eat.
POULTRYChickens on plates
DSW
, FAO
USA
50.1
Brazil
38.5
Canada
36.5
Mexico
31.0
Russia
25.3
Argentina
38.6
Indonesia
7.3
Japan
19.1
India
2.4
China
14.0
South Korea
16.9EU-27
23.6
Australia
50.5
A growing flock
Billion birds
FAO
chickensducks
0
5
10
15
20
2000 2002 2004 2006 2008 2010
geese and guinea fowlturkeys
20 billionchickens: they
are the world’s most numerous bird
species
Estimated chicken consumption per person, 2012, in kilograms,dressed carcass weight
South Africa
37.8
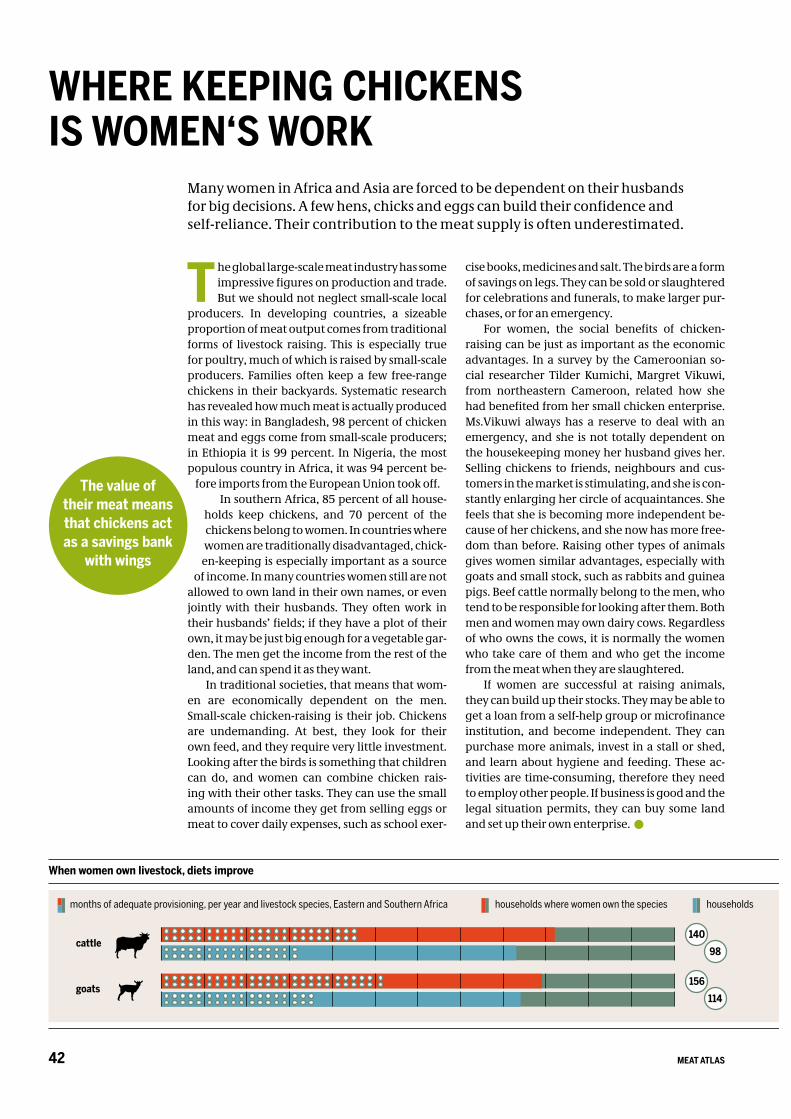
MEAT ATLAS42
T he global large-scale meat industry has some impressive figures on production and trade. But we should not neglect small-scale local
producers. In developing countries, a sizeable proportion of meat output comes from traditional forms of livestock raising. This is especially true for poultry, much of which is raised by small-scale producers. Families often keep a few free-range chickens in their backyards. Systematic research has revealed how much meat is actually produced in this way: in Bangladesh, 98 percent of chicken meat and eggs come from small-scale producers; in Ethiopia it is 99 percent. In Nigeria, the most populous country in Africa, it was 94 percent be-
fore imports from the European Union took off. In southern Africa, 85 percent of all house-
holds keep chickens, and 70 percent of the chickens belong to women. In countries where women are traditionally disadvantaged, chick-
en-keeping is especially important as a source of income. In many countries women still are not
allowed to own land in their own names, or even jointly with their husbands. They often work in their husbands’ fields; if they have a plot of their own, it may be just big enough for a vegetable gar-den. The men get the income from the rest of the land, and can spend it as they want.
In traditional societies, that means that wom-en are economically dependent on the men. Small-scale chicken-raising is their job. Chickens are undemanding. At best, they look for their own feed, and they require very little investment. Looking after the birds is something that children can do, and women can combine chicken rais-ing with their other tasks. They can use the small amounts of income they get from selling eggs or meat to cover daily expenses, such as school exer-
cise books, medicines and salt. The birds are a form of savings on legs. They can be sold or slaughtered for celebrations and funerals, to make larger pur-chases, or for an emergency.
For women, the social benefits of chicken-raising can be just as important as the economic advantages. In a survey by the Cameroonian so-cial researcher Tilder Kumichi, Margret Vikuwi, from northeastern Cameroon, related how she had benefited from her small chicken enterprise. Ms.Vikuwi always has a reserve to deal with an emergency, and she is not totally dependent on the housekeeping money her husband gives her. Selling chickens to friends, neighbours and cus-tomers in the market is stimulating, and she is con-stantly enlarging her circle of acquaintances. She feels that she is becoming more independent be-cause of her chickens, and she now has more free-dom than before. Raising other types of animals gives women similar advantages, especially with goats and small stock, such as rabbits and guinea pigs. Beef cattle normally belong to the men, who tend to be responsible for looking after them. Both men and women may own dairy cows. Regardless of who owns the cows, it is normally the women who take care of them and who get the income from the meat when they are slaughtered.
If women are successful at raising animals, they can build up their stocks. They may be able to get a loan from a self-help group or microfinance institution, and become independent. They can purchase more animals, invest in a stall or shed, and learn about hygiene and feeding. These ac-tivities are time-consuming, therefore they need to employ other people. If business is good and the legal situation permits, they can buy some land and set up their own enterprise.
Many women in Africa and Asia are forced to be dependent on their husbands for big decisions. A few hens, chicks and eggs can build their confidence and self-reliance. Their contribution to the meat supply is often underestimated.
WHERE KEEPING CHICKENSIS WOMEN‘S WORK
The value of their meat means that chickens act as a savings bank
with wings
When women own livestock, diets improve
months of adequate provisioning, per year and livestock species, Eastern and Southern Africa households where women own the species households where women do not own the species number of meals including this meat
cattle
goats
140
98
156
114
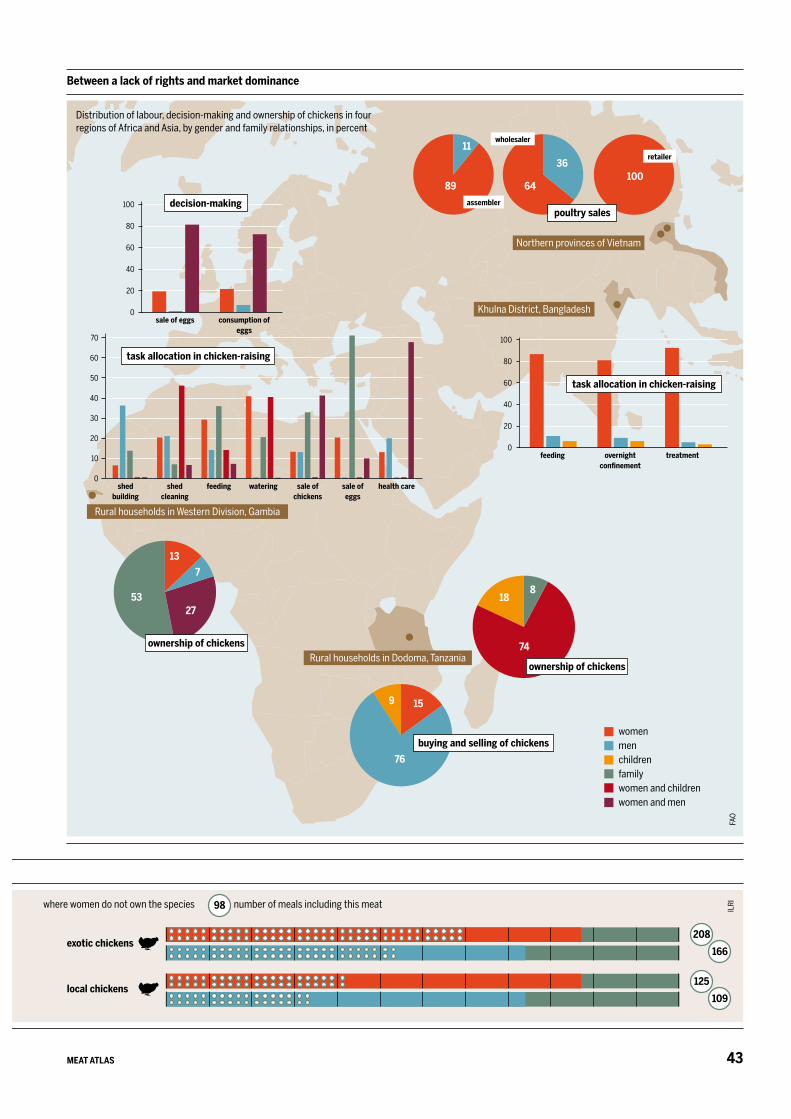
43MEAT ATLAS
Between a lack of rights and market dominance
FAO
sale of eggs consumption of eggs
0
20
40
60
80
100
13
5327
7
818
74
ownership of chickens
ownership of chickens
decision-making
womenmenchildrenfamilywomen and childrenwomen and men
Distribution of labour, decision-making and ownership of chickens in four regions of Africa and Asia, by gender and family relationships, in percent
poultry sales
10089
11
64
36
assembler
wholesaler
retailer
feeding overnight confinement
treatment0
20
40
60
80
100
task allocation in chicken-raising
0
10
20
30
40
50
60
70
shed building
shed cleaning
feeding watering sale of chickens
sale of eggs
health care
task allocation in chicken-raising
Northern provinces of Vietnam
Khulna District, Bangladesh
Rural households in Dodoma, Tanzania
Rural households in Western Division, Gambia
159
76buying and selling of chickens
months of adequate provisioning, per year and livestock species, Eastern and Southern Africa households where women own the species households where women do not own the species number of meals including this meat ILRI
exotic chickens
local chickens
208
166
125
109
98
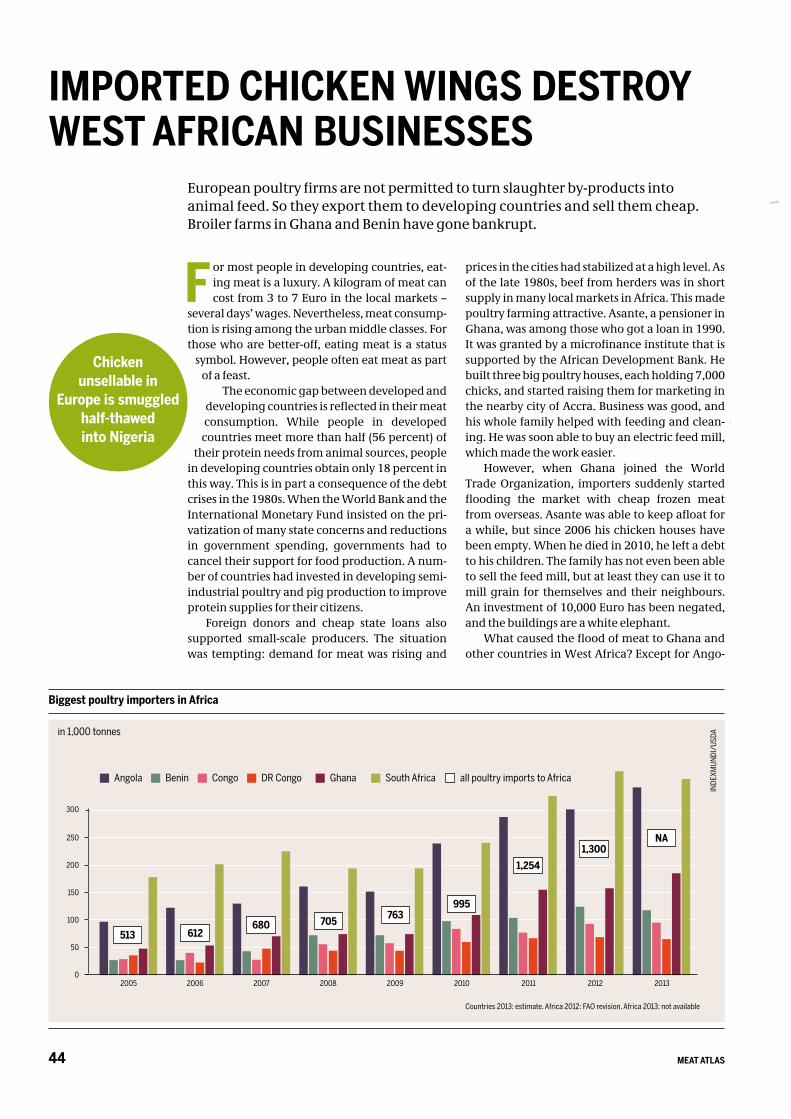
MEAT ATLAS44
F or most people in developing countries, eat-ing meat is a luxury. A kilogram of meat can cost from 3 to 7 Euro in the local markets –
several days’ wages. Nevertheless, meat consump-tion is rising among the urban middle classes. For those who are better-off, eating meat is a status
symbol. However, people often eat meat as part of a feast.
The economic gap between developed and developing countries is reflected in their meat consumption. While people in developed
countries meet more than half (56 percent) of their protein needs from animal sources, people
in developing countries obtain only 18 percent in this way. This is in part a consequence of the debt crises in the 1980s. When the World Bank and the International Monetary Fund insisted on the pri-vatization of many state concerns and reductions in government spending, governments had to cancel their support for food production. A num-ber of countries had invested in developing semi-industrial poultry and pig production to improve protein supplies for their citizens.
Foreign donors and cheap state loans also supported small-scale producers. The situation was tempting: demand for meat was rising and
prices in the cities had stabilized at a high level. As of the late 1980s, beef from herders was in short supply in many local markets in Africa. This made poultry farming attractive. Asante, a pensioner in Ghana, was among those who got a loan in 1990. It was granted by a microfinance institute that is supported by the African Development Bank. He built three big poultry houses, each holding 7,000 chicks, and started raising them for marketing in the nearby city of Accra. Business was good, and his whole family helped with feeding and clean-ing. He was soon able to buy an electric feed mill, which made the work easier.
However, when Ghana joined the World Trade Organization, importers suddenly started flooding the market with cheap frozen meat from overseas. Asante was able to keep afloat for a while, but since 2006 his chicken houses have been empty. When he died in 2010, he left a debt to his children. The family has not even been able to sell the feed mill, but at least they can use it to mill grain for themselves and their neighbours. An investment of 10,000 Euro has been negated, and the buildings are a white elephant.
What caused the flood of meat to Ghana and other countries in West Africa? Except for Ango-
European poultry firms are not permitted to turn slaughter by-products into animal feed. So they export them to developing countries and sell them cheap. Broiler farms in Ghana and Benin have gone bankrupt.
IMPORTED CHICKEN WINGS DESTROY WEST AFRICAN BUSINESSES
Chickenunsellable in
Europe is smuggled half-thawed into Nigeria
Biggest poultry importers in Africa
in 1,000 tonnes
0
50
100
150
200
250
INDE
XMUN
DI/U
SDA
300
Angola Benin DR Congo Ghana South Africa all poultry imports to Africa
2005
513
2006
612
2007
680
2008
705
2009
763
2010 2011 2012 2013
1,254
995
1,300NA
Congo
Countries 2013: estimate. Africa 2012: FAO revision, Africa 2013: not available
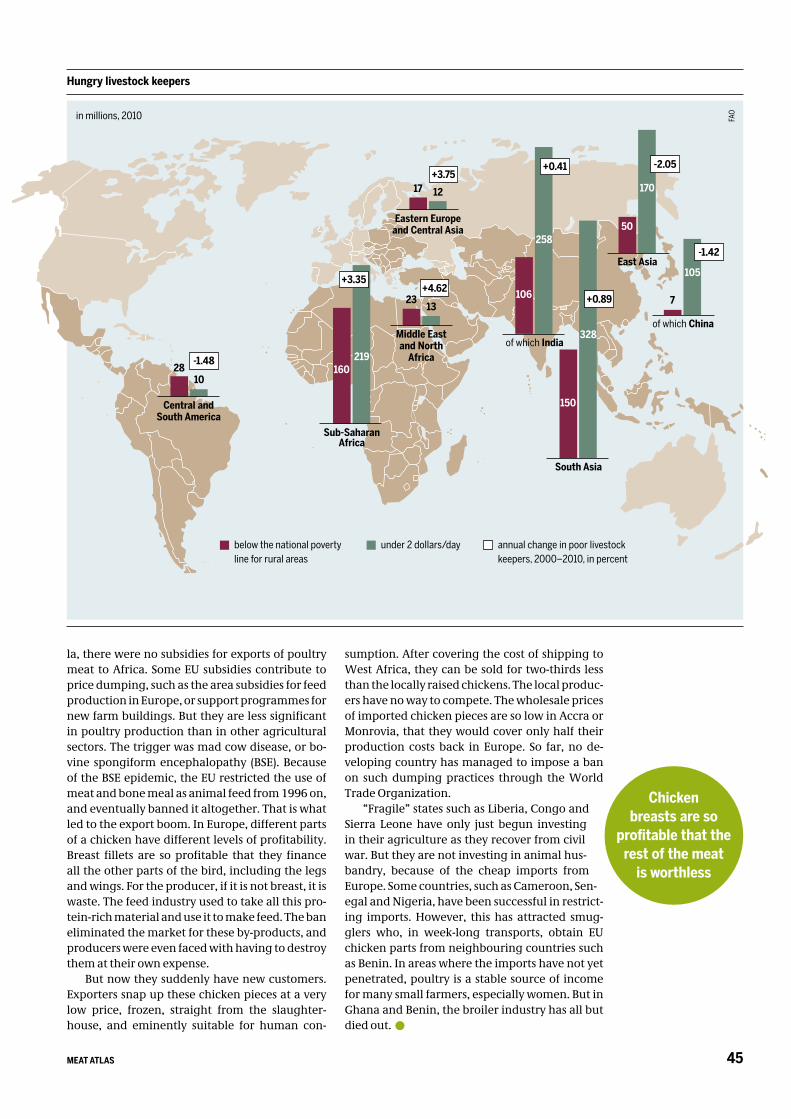
45MEAT ATLAS
la, there were no subsidies for exports of poultry meat to Africa. Some EU subsidies contribute to price dumping, such as the area subsidies for feed production in Europe, or support programmes for new farm buildings. But they are less significant in poultry production than in other agricultural sectors. The trigger was mad cow disease, or bo-vine spongiform encephalopathy (BSE). Because of the BSE epidemic, the EU restricted the use of meat and bone meal as animal feed from 1996 on, and eventually banned it altogether. That is what led to the export boom. In Europe, different parts of a chicken have different levels of profitability. Breast fillets are so profitable that they finance all the other parts of the bird, including the legs and wings. For the producer, if it is not breast, it is waste. The feed industry used to take all this pro-tein-rich material and use it to make feed. The ban eliminated the market for these by-products, and producers were even faced with having to destroy them at their own expense.
But now they suddenly have new customers. Exporters snap up these chicken pieces at a very low price, frozen, straight from the slaughter-house, and eminently suitable for human con-
sumption. After covering the cost of shipping to West Africa, they can be sold for two-thirds less than the locally raised chickens. The local produc-ers have no way to compete. The wholesale prices of imported chicken pieces are so low in Accra or Monrovia, that they would cover only half their production costs back in Europe. So far, no de-veloping country has managed to impose a ban on such dumping practices through the World Trade Organization.
“Fragile” states such as Liberia, Congo and Sierra Leone have only just begun investing in their agriculture as they recover from civil war. But they are not investing in animal hus-bandry, because of the cheap imports from Europe. Some countries, such as Cameroon, Sen-egal and Nigeria, have been successful in restrict-ing imports. However, this has attracted smug-glers who, in week-long transports, obtain EU chicken parts from neighbouring countries such as Benin. In areas where the imports have not yet penetrated, poultry is a stable source of income for many small farmers, especially women. But in Ghana and Benin, the broiler industry has all but died out.
Hungry livestock keepers
in millions, 2010 FAO
50
170
East Asia
7
105
of which China
17 12
Eastern Europe and Central Asia
2810
Central and South America
2313
Middle East and North
Africa
150
328
South Asia
106
258
of which India
160219
Sub-Saharan Africa
below the national poverty line for rural areas
under 2 dollars/day annual change in poor livestock keepers, 2000–2010, in percent
Chicken breasts are so
profitable that the rest of the meat
is worthless
-1.48
+3.35+4.62
+3.75+0.41
+0.89
-2.05
-1.42
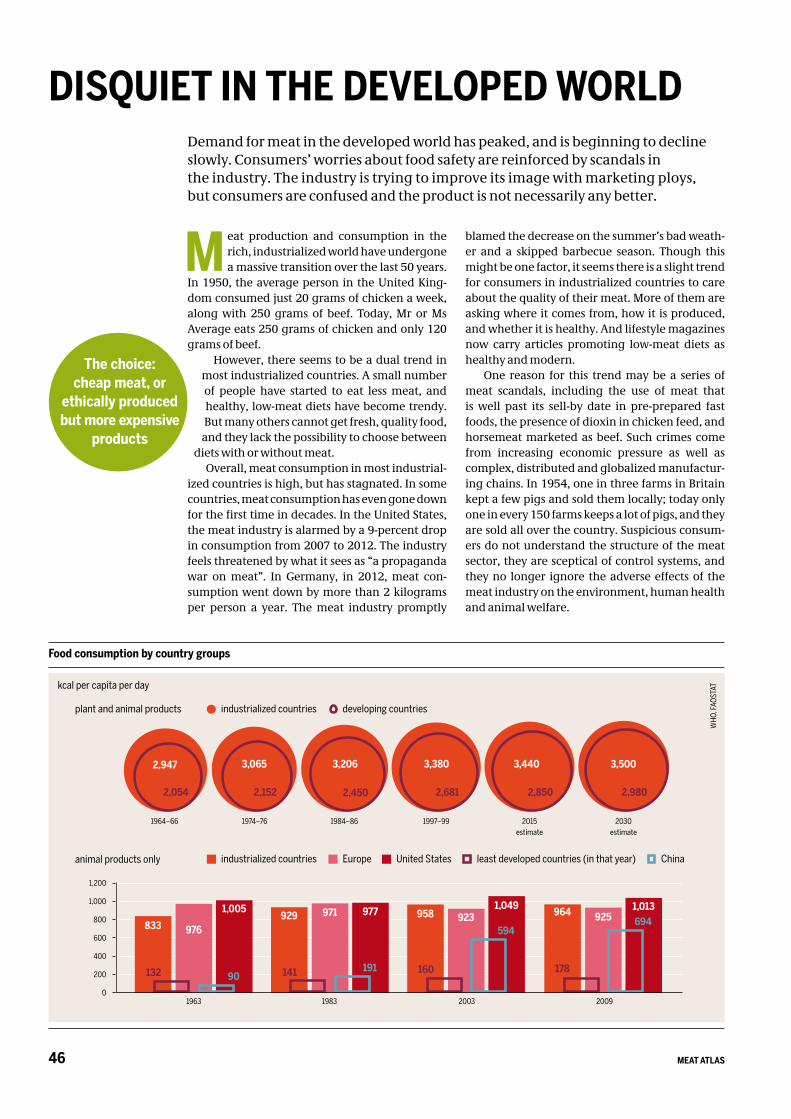
MEAT ATLAS46
M eat production and consumption in the rich, industrialized world have undergone a massive transition over the last 50 years.
In 1950, the average person in the United King-dom consumed just 20 grams of chicken a week, along with 250 grams of beef. Today, Mr or Ms Average eats 250 grams of chicken and only 120 grams of beef.
However, there seems to be a dual trend in most industrialized countries. A small number of people have started to eat less meat, and healthy, low-meat diets have become trendy. But many others cannot get fresh, quality food,
and they lack the possibility to choose between diets with or without meat.
Overall, meat consumption in most industrial-ized countries is high, but has stagnated. In some countries, meat consumption has even gone down for the first time in decades. In the United States, the meat industry is alarmed by a 9-percent drop in consumption from 2007 to 2012. The industry feels threatened by what it sees as “a propaganda war on meat”. In Germany, in 2012, meat con-sumption went down by more than 2 kilograms per person a year. The meat industry promptly
blamed the decrease on the summer’s bad weath-er and a skipped barbecue season. Though this might be one factor, it seems there is a slight trend for consumers in industrialized countries to care about the quality of their meat. More of them are asking where it comes from, how it is produced, and whether it is healthy. And lifestyle magazines now carry articles promoting low-meat diets as healthy and modern.
One reason for this trend may be a series of meat scandals, including the use of meat that is well past its sell-by date in pre-prepared fast foods, the presence of dioxin in chicken feed, and horsemeat marketed as beef. Such crimes come from increasing economic pressure as well as complex, distributed and globalized manufactur-ing chains. In 1954, one in three farms in Britain kept a few pigs and sold them locally; today only one in every 150 farms keeps a lot of pigs, and they are sold all over the country. Suspicious consum-ers do not understand the structure of the meat sector, they are sceptical of control systems, and they no longer ignore the adverse effects of the meat industry on the environment, human health and animal welfare.
Demand for meat in the developed world has peaked, and is beginning to decline slowly. Consumers’ worries about food safety are reinforced by scandals in the industry. The industry is trying to improve its image with marketing ploys, but consumers are confused and the product is not necessarily any better.
DISQUIET IN THE DEVELOPED WORLD
RICH
The choice: cheap meat, or
ethically produced but more expensive
products
animal products only
0
200
400
600
800
1,000
1,200
1963 1983 2003 2009
833929 958 964
976
971 923 9251,005 977 1,049 1,013
132 141 16090
191
594694
178
industrialized countries Europe least developed countries (in that year)United States China
Food consumption by country groups
kcal per capita per day
WHO
, FAO
STAT
1964–66 1974–76 1984–86 1997–99 2015estimate
2030estimate
2,947 3,065 3,206 3,380 3,440 3,500
2,054 2,152 2,450 2,681 2,850 2,980
industrialized countries developing countriesplant and animal products
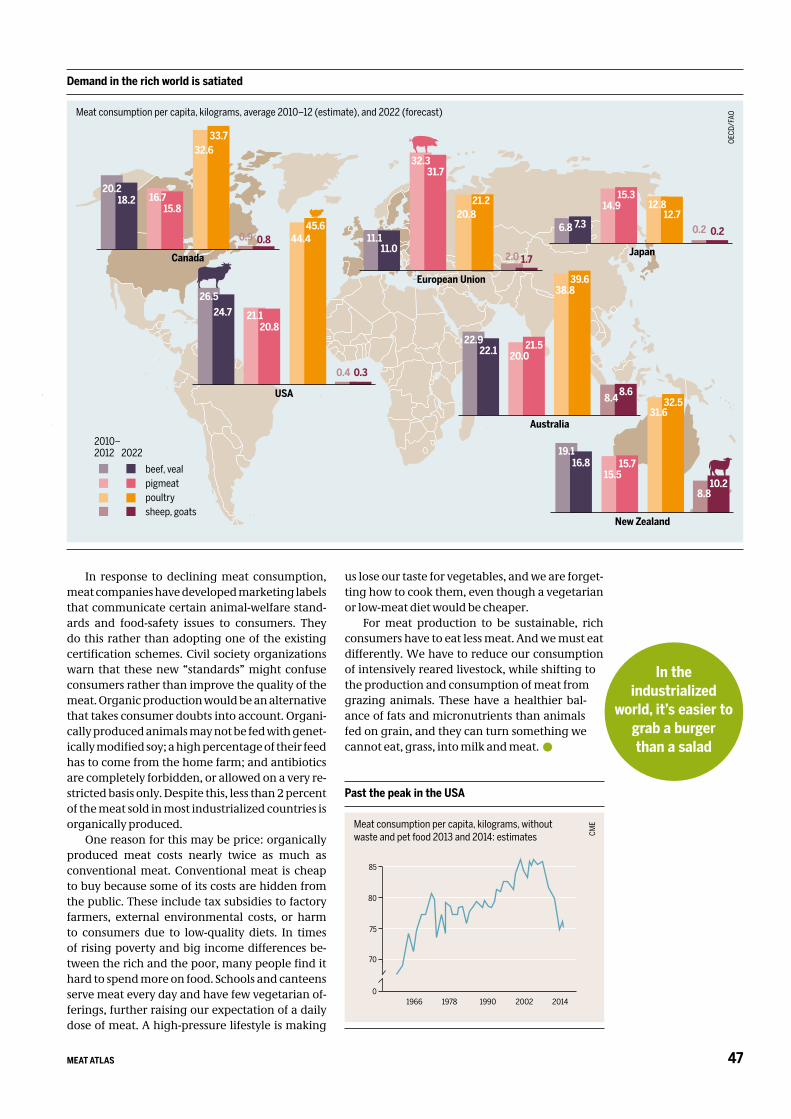
47MEAT ATLAS
In response to declining meat consumption, meat companies have developed marketing labels that communicate certain animal-welfare stand-ards and food-safety issues to consumers. They do this rather than adopting one of the existing certification schemes. Civil society organizations warn that these new “standards” might confuse consumers rather than improve the quality of the meat. Organic production would be an alternative that takes consumer doubts into account. Organi-cally produced animals may not be fed with genet-ically modified soy; a high percentage of their feed has to come from the home farm; and antibiotics are completely forbidden, or allowed on a very re-stricted basis only. Despite this, less than 2 percent of the meat sold in most industrialized countries is organically produced.
One reason for this may be price: organically produced meat costs nearly twice as much as conventional meat. Conventional meat is cheap to buy because some of its costs are hidden from the public. These include tax subsidies to factory farmers, external environmental costs, or harm to consumers due to low-quality diets. In times of rising poverty and big income differences be-tween the rich and the poor, many people find it hard to spend more on food. Schools and canteens serve meat every day and have few vegetarian of-ferings, further raising our expectation of a daily dose of meat. A high-pressure lifestyle is making
us lose our taste for vegetables, and we are forget-ting how to cook them, even though a vegetarian or low-meat diet would be cheaper.
For meat production to be sustainable, rich consumers have to eat less meat. And we must eat differently. We have to reduce our consumption of intensively reared livestock, while shifting to the production and consumption of meat from grazing animals. These have a healthier bal-ance of fats and micronutrients than animals fed on grain, and they can turn something we cannot eat, grass, into milk and meat.
Past the peak in the USA
Meat consumption per capita, kilograms, without waste and pet food 2013 and 2014: estimates CM
E
0
70
1966 1978 1990 2002 2014
75
80
85
RICH
In the industrialized
world, it’s easier to grab a burger than a salad
Demand in the rich world is satiated
Meat consumption per capita, kilograms, average 2010–12 (estimate), and 2022 (forecast)
OECD
/FAO
Canada
20.218.2 16.7
15.8
32.633.7
0.9 0.8
Australia
22.922.1 20.0
21.5
38.839.6
8.68.4
Japan
6.8 7.3
14.915.3
12.812.7
0.20.2
European Union
11.111.0
32.331.7
20.821.2
2.0 1.7
New Zealand
19.116.8
15.515.7
31.632.5
10.28.8
USA
26.524.7 21.1
20.8
44.445.6
0.4 0.3
beef, vealpigmeatpoultrysheep, goats
2010–2012 2022
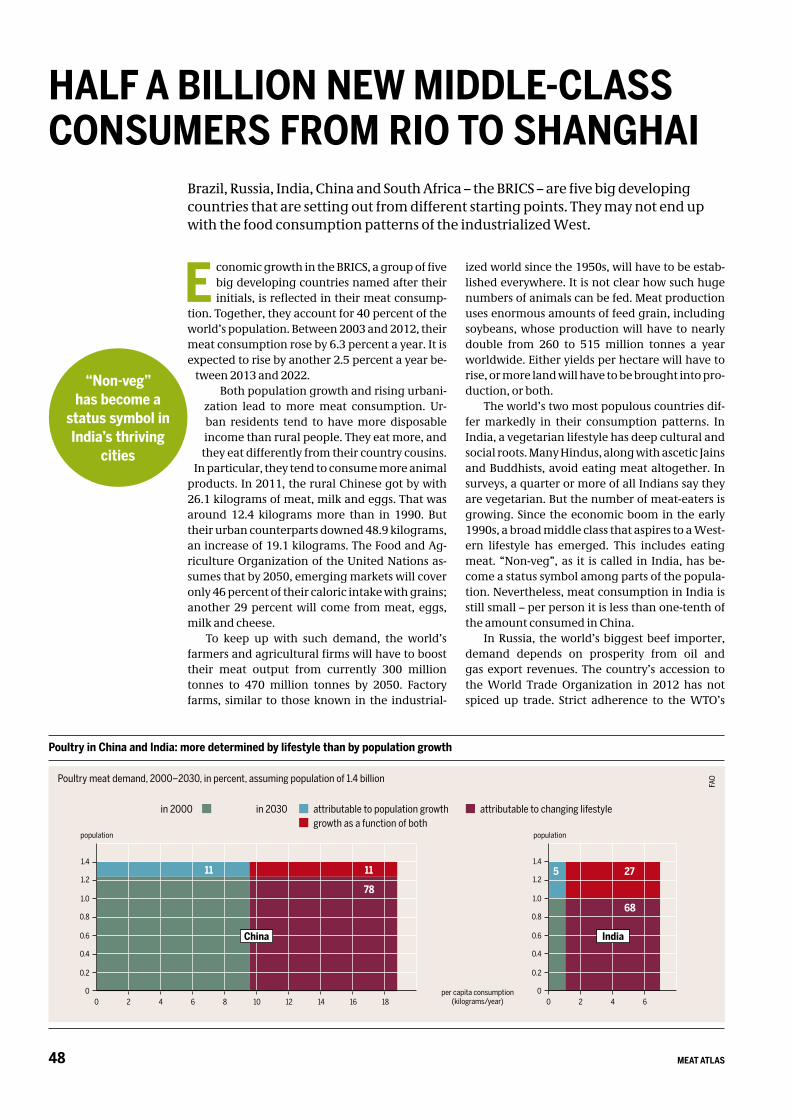
MEAT ATLAS48
E conomic growth in the BRICS, a group of five big developing countries named after their initials, is reflected in their meat consump-
tion. Together, they account for 40 percent of the world’s population. Between 2003 and 2012, their meat consumption rose by 6.3 percent a year. It is expected to rise by another 2.5 percent a year be-
tween 2013 and 2022. Both population growth and rising urbani-
zation lead to more meat consumption. Ur-ban residents tend to have more disposable income than rural people. They eat more, and
they eat differently from their country cousins. In particular, they tend to consume more animal
products. In 2011, the rural Chinese got by with 26.1 kilograms of meat, milk and eggs. That was around 12.4 kilograms more than in 1990. But their urban counterparts downed 48.9 kilograms, an increase of 19.1 kilograms. The Food and Ag-riculture Organization of the United Nations as-sumes that by 2050, emerging markets will cover only 46 percent of their caloric intake with grains; another 29 percent will come from meat, eggs, milk and cheese.
To keep up with such demand, the world’s farmers and agricultural firms will have to boost their meat output from currently 300 million tonnes to 470 million tonnes by 2050. Factory farms, similar to those known in the industrial-
ized world since the 1950s, will have to be estab-lished everywhere. It is not clear how such huge numbers of animals can be fed. Meat production uses enormous amounts of feed grain, including soybeans, whose production will have to nearly double from 260 to 515 million tonnes a year worldwide. Either yields per hectare will have to rise, or more land will have to be brought into pro-duction, or both.
The world’s two most populous countries dif-fer markedly in their consumption patterns. In India, a vegetarian lifestyle has deep cultural and social roots. Many Hindus, along with ascetic Jains and Buddhists, avoid eating meat altogether. In surveys, a quarter or more of all Indians say they are vegetarian. But the number of meat-eaters is growing. Since the economic boom in the early 1990s, a broad middle class that aspires to a West-ern lifestyle has emerged. This includes eating meat. “Non-veg”, as it is called in India, has be-come a status symbol among parts of the popula-tion. Nevertheless, meat consumption in India is still small – per person it is less than one-tenth of the amount consumed in China.
In Russia, the world’s biggest beef importer, demand depends on prosperity from oil and gas export revenues. The country’s accession to the World Trade Organization in 2012 has not spiced up trade. Strict adherence to the WTO’s
Brazil, Russia, India, China and South Africa – the BRICS – are five big developing countries that are setting out from different starting points. They may not end up with the food consumption patterns of the industrialized West.
HALF A BILLION NEW MIDDLE-CLASS CONSUMERS FROM RIO TO SHANGHAI
“Non-veg”has become a
status symbol in India’s thriving
cities
Poultry in China and India: more determined by lifestyle than by population growth
Poultry meat demand, 2000–2030, in percent, assuming population of 1.4 billion
FAO
per capita consumption (kilograms/year)
0
0.2
0.4
0.6
0.8
1.0
1.2
1.4
0 2 4 6 8 10 12 14 16 18
China
11 11
78
0
0.2
0.4
0.6
0.8
1.0
1.2
1.4
0 2 4 6
India
68
275
in 2000 in 2030 attributable to population growthgrowth as a function of both
attributable to changing lifestyle
population population
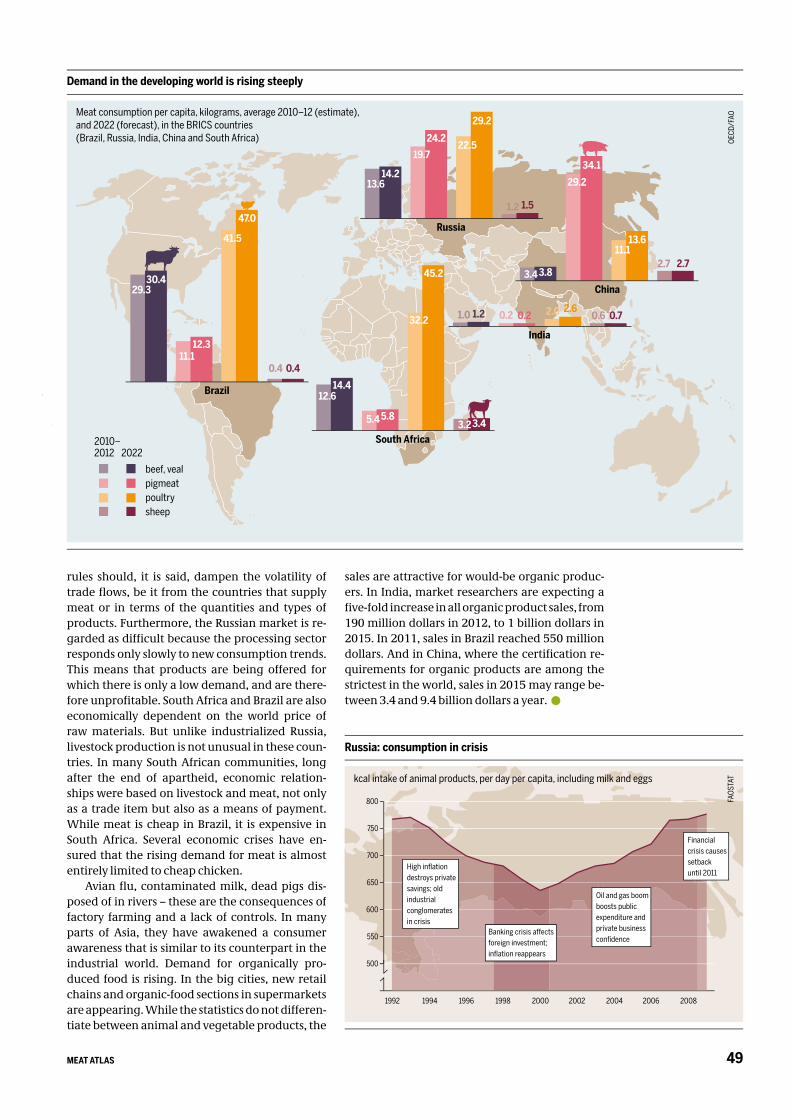
49MEAT ATLAS
rules should, it is said, dampen the volatility of trade fl ows, be it from the countries that supply meat or in terms of the quantities and types of products. Furthermore, the Russian market is re-garded as diffi cult because the processing sector responds only slowly to new consumption trends. This means that products are being offered for which there is only a low demand, and are there-fore unprofi table. South Africa and Brazil are also economically dependent on the world price of raw materials. But unlike industrialized Russia, livestock production is not unusual in these coun-tries. In many South African communities, long after the end of apartheid, economic relation-ships were based on livestock and meat, not only as a trade item but also as a means of payment. While meat is cheap in Brazil, it is expensive in South Africa. Several economic crises have en-sured that the rising demand for meat is almost entirely limited to cheap chicken.
Avian fl u, contaminated milk, dead pigs dis-posed of in rivers – these are the consequences of factory farming and a lack of controls. In many parts of Asia, they have awakened a consumer awareness that is similar to its counterpart in the industrial world. Demand for organically pro-duced food is rising. In the big cities, new retail chains and organic-food sections in supermarkets are appearing. While the statistics do not differen-tiate between animal and vegetable products, the
sales are attractive for would-be organic produc-ers. In India, market researchers are expecting a fi ve-fold increase in all organic product sales, from 190 million dollars in 2012, to 1 billion dollars in 2015. In 2011, sales in Brazil reached 550 million dollars. And in China, where the certifi cation re-quirements for organic products are among the strictest in the world, sales in 2015 may range be-tween 3.4 and 9.4 billion dollars a year.
Russia: consumption in crisis
kcal intake of animal products, per day per capita, including milk and eggs
FAOS
TAT
Demand in the developing world is rising steeply
Meat consumption per capita, kilograms, average 2010–12 (estimate), and 2022 (forecast), in the BRICS countries (Brazil, Russia, India, China and South Africa) OE
CD/F
AO
beef, vealpigmeatpoultrysheep
2010–2012 2022
Russia
13.614.2
19.7
24.222.5
29.2
1.51.2
India
1.0 1.2 0.2 0.2 2.0 2.60.70.6
China3.43.8
29.2
34.1
11.113.6
2.72.7
Brazil
29.330.4
11.112.3
41.5
47.0
0.40.4
500
550
600
650
700
750
800
1992 1994 1996 1998 2000 2002 2004 2006 20080
High infl ation destroys private savings; old industrial conglomerates in crisis
Banking crisis affects foreign investment; infl ation reappears
Oil and gas boom boosts public expenditure and private business confi dence
Financial crisis causes setback until 2011
South Africa
12.614.4
5.45.8
32.2
45.2
3.43.2
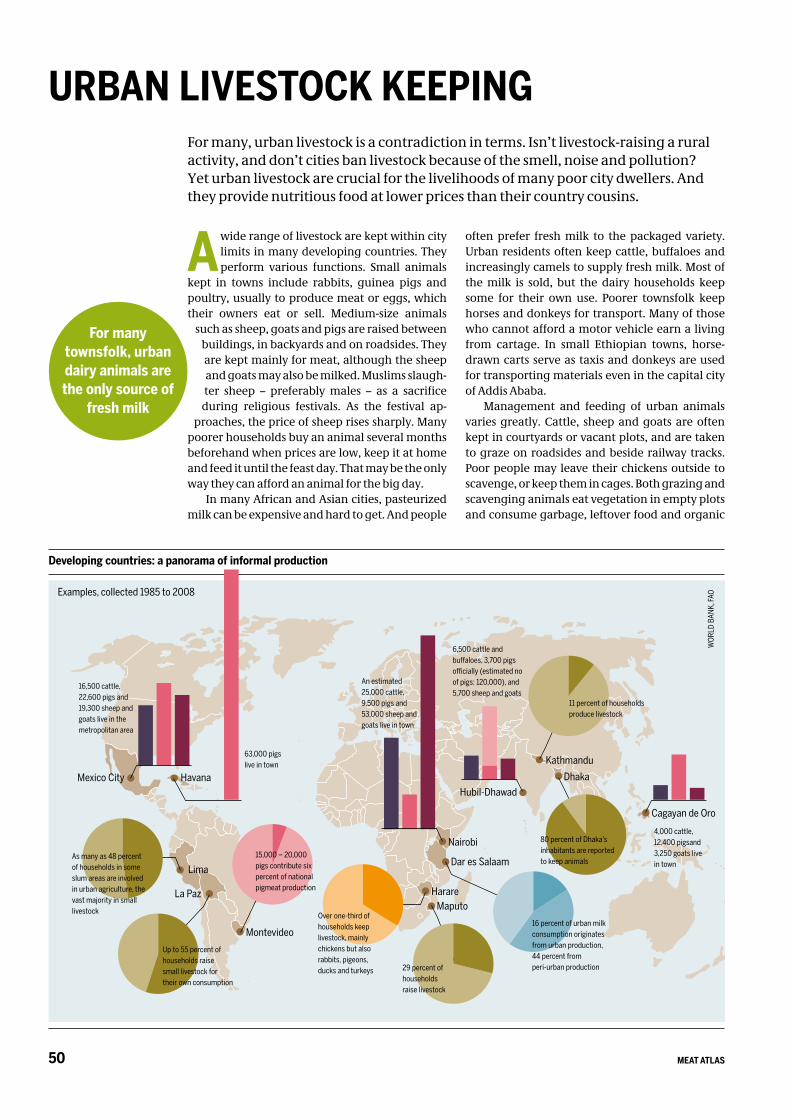
MEAT ATLAS50
A wide range of livestock are kept within city limits in many developing countries. They perform various functions. Small animals
kept in towns include rabbits, guinea pigs and poultry, usually to produce meat or eggs, which their owners eat or sell. Medium-size animals
such as sheep, goats and pigs are raised between buildings, in backyards and on roadsides. They are kept mainly for meat, although the sheep and goats may also be milked. Muslims slaugh-ter sheep – preferably males – as a sacrifice
during religious festivals. As the festival ap-proaches, the price of sheep rises sharply. Many
poorer households buy an animal several months beforehand when prices are low, keep it at home and feed it until the feast day. That may be the only way they can afford an animal for the big day.
In many African and Asian cities, pasteurized milk can be expensive and hard to get. And people
often prefer fresh milk to the packaged variety. Urban residents often keep cattle, buffaloes and increasingly camels to supply fresh milk. Most of the milk is sold, but the dairy households keep some for their own use. Poorer townsfolk keep horses and donkeys for transport. Many of those who cannot afford a motor vehicle earn a living from cartage. In small Ethiopian towns, horse-drawn carts serve as taxis and donkeys are used for transporting materials even in the capital city of Addis Ababa.
Management and feeding of urban animals varies greatly. Cattle, sheep and goats are often kept in courtyards or vacant plots, and are taken to graze on roadsides and beside railway tracks. Poor people may leave their chickens outside to scavenge, or keep them in cages. Both grazing and scavenging animals eat vegetation in empty plots and consume garbage, leftover food and organic
For many, urban livestock is a contradiction in terms. Isn’t livestock-raising a rural activity, and don’t cities ban livestock because of the smell, noise and pollution? Yet urban livestock are crucial for the livelihoods of many poor city dwellers. And they provide nutritious food at lower prices than their country cousins.
URBAN LIVESTOCK KEEPING
For many townsfolk, urban dairy animals are the only source of
fresh milk
Developing countries: a panorama of informal production
WOR
LD B
ANK,
FAOExamples, collected 1985 to 2008
Harare
Nairobi
Maputo
HavanaMexico City
La Paz
Lima
Cagayan de Oro
Dhaka
Kathmandu
Hubil-Dhawad
Montevideo
Dar es Salaam
Over one-third of households keep livestock, mainly chickens but also rabbits, pigeons, ducks and turkeys
An estimated 25,000 cattle, 9,500 pigs and 53,000 sheep and goats live in town
16 percent of urban milk consumption originates from urban production, 44 percent from peri-urban production29 percent of
households raise livestock
63,000 pigs live in town
16,500 cattle, 22,600 pigs and 19,300 sheep and goats live in the metropolitan area
As many as 48 percent of households in some slum areas are involved in urban agriculture, the vast majority in small livestock
Up to 55 percent of households raise small livestock for their own consumption
15,000 – 20,000 pigs contribute six percent of national pigmeat production
11 percent of households produce livestock
4,000 cattle, 12,400 pigsand 3,250 goats live in town
80 percent of Dhaka’s inhabitants are reported to keep animals
6,500 cattle and buffaloes, 3,700 pigs officially (estimated no of pigs: 120,000), and 5,700 sheep and goats
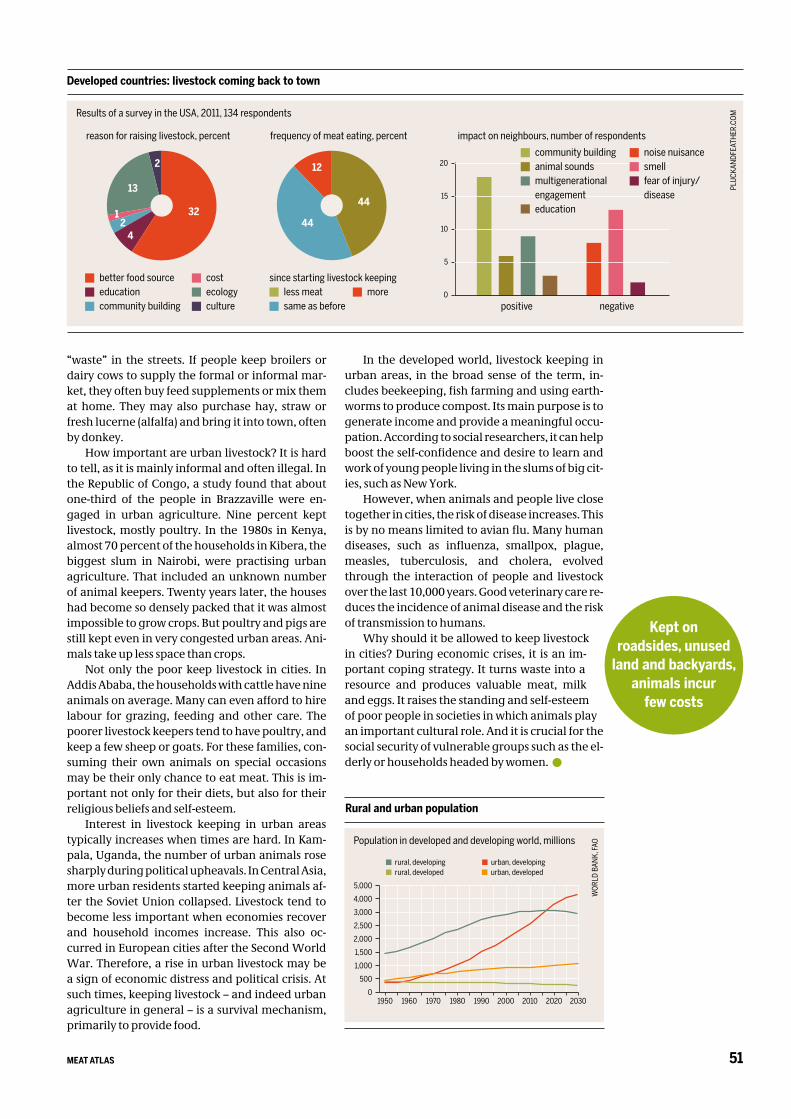
51MEAT ATLAS
“waste” in the streets. If people keep broilers or dairy cows to supply the formal or informal mar-ket, they often buy feed supplements or mix them at home. They may also purchase hay, straw or fresh lucerne (alfalfa) and bring it into town, often by donkey.
How important are urban livestock? It is hard to tell, as it is mainly informal and often illegal. In the Republic of Congo, a study found that about one-third of the people in Brazzaville were en-gaged in urban agriculture. Nine percent kept livestock, mostly poultry. In the 1980s in Kenya, almost 70 percent of the households in Kibera, the biggest slum in Nairobi, were practising urban agriculture. That included an unknown number of animal keepers. Twenty years later, the houses had become so densely packed that it was almost impossible to grow crops. But poultry and pigs are still kept even in very congested urban areas. Ani-mals take up less space than crops.
Not only the poor keep livestock in cities. In Addis Ababa, the households with cattle have nine animals on average. Many can even afford to hire labour for grazing, feeding and other care. The poorer livestock keepers tend to have poultry, and keep a few sheep or goats. For these families, con-suming their own animals on special occasions may be their only chance to eat meat. This is im-portant not only for their diets, but also for their religious beliefs and self-esteem.
Interest in livestock keeping in urban areas typically increases when times are hard. In Kam-pala, Uganda, the number of urban animals rose sharply during political upheavals. In Central Asia, more urban residents started keeping animals af-ter the Soviet Union collapsed. Livestock tend to become less important when economies recover and household incomes increase. This also oc-curred in European cities after the Second World War. Therefore, a rise in urban livestock may be a sign of economic distress and political crisis. At such times, keeping livestock – and indeed urban agriculture in general – is a survival mechanism, primarily to provide food.
In the developed world, livestock keeping in urban areas, in the broad sense of the term, in-cludes beekeeping, fish farming and using earth-worms to produce compost. Its main purpose is to generate income and provide a meaningful occu-pation. According to social researchers, it can help boost the self-confidence and desire to learn and work of young people living in the slums of big cit-ies, such as New York.
However, when animals and people live close together in cities, the risk of disease increases. This is by no means limited to avian flu. Many human diseases, such as influenza, smallpox, plague, measles, tuberculosis, and cholera, evolved through the interaction of people and livestock over the last 10,000 years. Good veterinary care re-duces the incidence of animal disease and the risk of transmission to humans.
Why should it be allowed to keep livestock in cities? During economic crises, it is an im-portant coping strategy. It turns waste into a resource and produces valuable meat, milk and eggs. It raises the standing and self-esteem of poor people in societies in which animals play an important cultural role. And it is crucial for the social security of vulnerable groups such as the el-derly or households headed by women.
Rural and urban population
Kept on roadsides, unused
land and backyards, animals incur
few costs
Developed countries: livestock coming back to town
Results of a survey in the USA, 2011, 134 respondents
PLUC
KAND
FEAT
HER.
COM
reason for raising livestock, percent frequency of meat eating, percent
better food sourceeducationcommunity building
costecologyculture
less meatsame as before
Population in developed and developing world, millions
WOR
LD B
ANK,
FAO
1950 1960 1970 1980 1990 2000 2010 2020 20300
500
1,000
1,500
2,000
2,500
3,000
4,000
5,000
rural, developing urban, developingrural, developed urban, developed
32
13
4
2
21
44
44
12
impact on neighbours, number of respondents
0
5
10
15
20
positive negative
community buildinganimal soundsmultigenerational engagementeducation
noise nuisancesmellfear of injury/disease
since starting livestock keepingmore
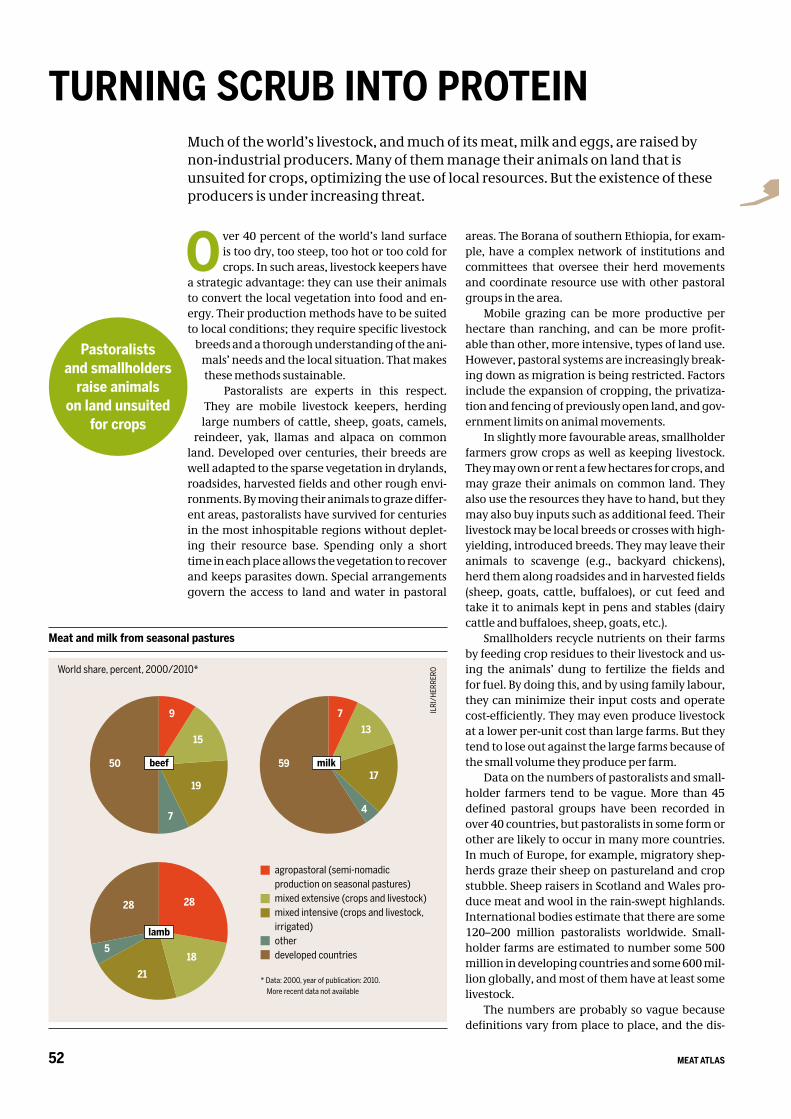
MEAT ATLAS52
O ver 40 percent of the world’s land surface is too dry, too steep, too hot or too cold for crops. In such areas, livestock keepers have
a strategic advantage: they can use their animals to convert the local vegetation into food and en-ergy. Their production methods have to be suited to local conditions; they require specific livestock
breeds and a thorough understanding of the ani-mals’ needs and the local situation. That makes these methods sustainable.
Pastoralists are experts in this respect. They are mobile livestock keepers, herding
large numbers of cattle, sheep, goats, camels, reindeer, yak, llamas and alpaca on common
land. Developed over centuries, their breeds are well adapted to the sparse vegetation in drylands, roadsides, harvested fields and other rough envi-ronments. By moving their animals to graze differ-ent areas, pastoralists have survived for centuries in the most inhospitable regions without deplet-ing their resource base. Spending only a short time in each place allows the vegetation to recover and keeps parasites down. Special arrangements govern the access to land and water in pastoral
areas. The Borana of southern Ethiopia, for exam-ple, have a complex network of institutions and committees that oversee their herd movements and coordinate resource use with other pastoral groups in the area.
Mobile grazing can be more productive per hectare than ranching, and can be more profit-able than other, more intensive, types of land use. However, pastoral systems are increasingly break-ing down as migration is being restricted. Factors include the expansion of cropping, the privatiza-tion and fencing of previously open land, and gov-ernment limits on animal movements.
In slightly more favourable areas, smallholder farmers grow crops as well as keeping livestock. They may own or rent a few hectares for crops, and may graze their animals on common land. They also use the resources they have to hand, but they may also buy inputs such as additional feed. Their livestock may be local breeds or crosses with high-yielding, introduced breeds. They may leave their animals to scavenge (e.g., backyard chickens), herd them along roadsides and in harvested fields (sheep, goats, cattle, buffaloes), or cut feed and take it to animals kept in pens and stables (dairy cattle and buffaloes, sheep, goats, etc.).
Smallholders recycle nutrients on their farms by feeding crop residues to their livestock and us-ing the animals’ dung to fertilize the fields and for fuel. By doing this, and by using family labour, they can minimize their input costs and operate cost-efficiently. They may even produce livestock at a lower per-unit cost than large farms. But they tend to lose out against the large farms because of the small volume they produce per farm.
Data on the numbers of pastoralists and small-holder farmers tend to be vague. More than 45 defined pastoral groups have been recorded in over 40 countries, but pastoralists in some form or other are likely to occur in many more countries. In much of Europe, for example, migratory shep-herds graze their sheep on pastureland and crop stubble. Sheep raisers in Scotland and Wales pro-duce meat and wool in the rain-swept highlands. International bodies estimate that there are some 120–200 million pastoralists worldwide. Small-holder farms are estimated to number some 500 million in developing countries and some 600 mil-lion globally, and most of them have at least some livestock.
The numbers are probably so vague because definitions vary from place to place, and the dis-
Much of the world’s livestock, and much of its meat, milk and eggs, are raised by non-industrial producers. Many of them manage their animals on land that is unsuited for crops, optimizing the use of local resources. But the existence of these producers is under increasing threat.
TURNING SCRUB INTO PROTEIN
Pastoralists and smallholders
raise animals on land unsuited
for crops
Meat and milk from seasonal pastures
World share, percent, 2000/2010*
ILRI
/HER
RERO
* Data: 2000, year of publication: 2010. More recent data not available
28
50
9
15
19
7
59
713
17
4
5
21
18
28
agropastoral (semi-nomadic production on seasonal pastures)mixed extensive (crops and livestock) mixed intensive (crops and livestock, irrigated) otherdeveloped countries
milkbeef
lamb
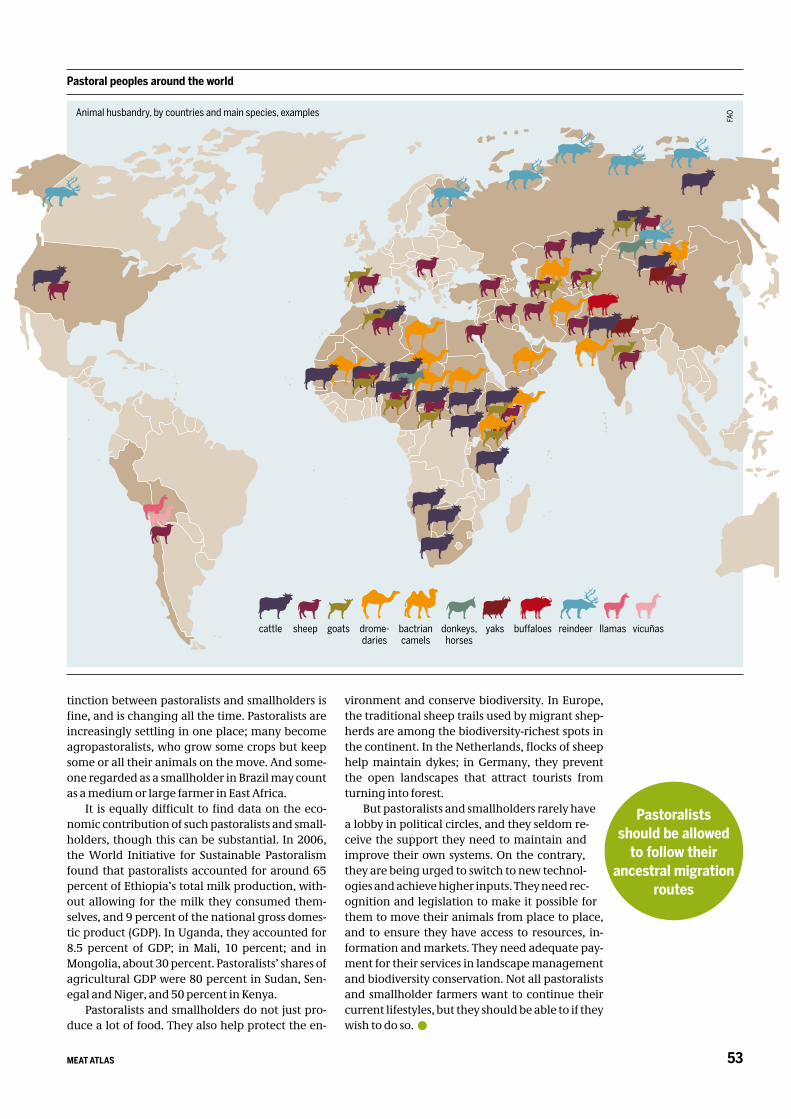
53MEAT ATLAS
tinction between pastoralists and smallholders is fine, and is changing all the time. Pastoralists are increasingly settling in one place; many become agropastoralists, who grow some crops but keep some or all their animals on the move. And some-one regarded as a smallholder in Brazil may count as a medium or large farmer in East Africa.
It is equally difficult to find data on the eco-nomic contribution of such pastoralists and small-holders, though this can be substantial. In 2006, the World Initiative for Sustainable Pastoralism found that pastoralists accounted for around 65 percent of Ethiopia’s total milk production, with-out allowing for the milk they consumed them-selves, and 9 percent of the national gross domes-tic product (GDP). In Uganda, they accounted for 8.5 percent of GDP; in Mali, 10 percent; and in Mongolia, about 30 percent. Pastoralists’ shares of agricultural GDP were 80 percent in Sudan, Sen-egal and Niger, and 50 percent in Kenya.
Pastoralists and smallholders do not just pro-duce a lot of food. They also help protect the en-
vironment and conserve biodiversity. In Europe, the traditional sheep trails used by migrant shep-herds are among the biodiversity-richest spots in the continent. In the Netherlands, flocks of sheep help maintain dykes; in Germany, they prevent the open landscapes that attract tourists from turning into forest.
But pastoralists and smallholders rarely have a lobby in political circles, and they seldom re-ceive the support they need to maintain and improve their own systems. On the contrary, they are being urged to switch to new technol-ogies and achieve higher inputs. They need rec-ognition and legislation to make it possible for them to move their animals from place to place, and to ensure they have access to resources, in-formation and markets. They need adequate pay-ment for their services in landscape management and biodiversity conservation. Not all pastoralists and smallholder farmers want to continue their current lifestyles, but they should be able to if they wish to do so.
Pastoralistsshould be allowed
to follow their ancestral migration
routes
Pastoral peoples around the world
Animal husbandry, by countries and main species, examples
FAO
vicuñasllamasreindeerbuffaloesyaksdonkeys, horses
bactrian camels
drome-daries
goatssheepcattle
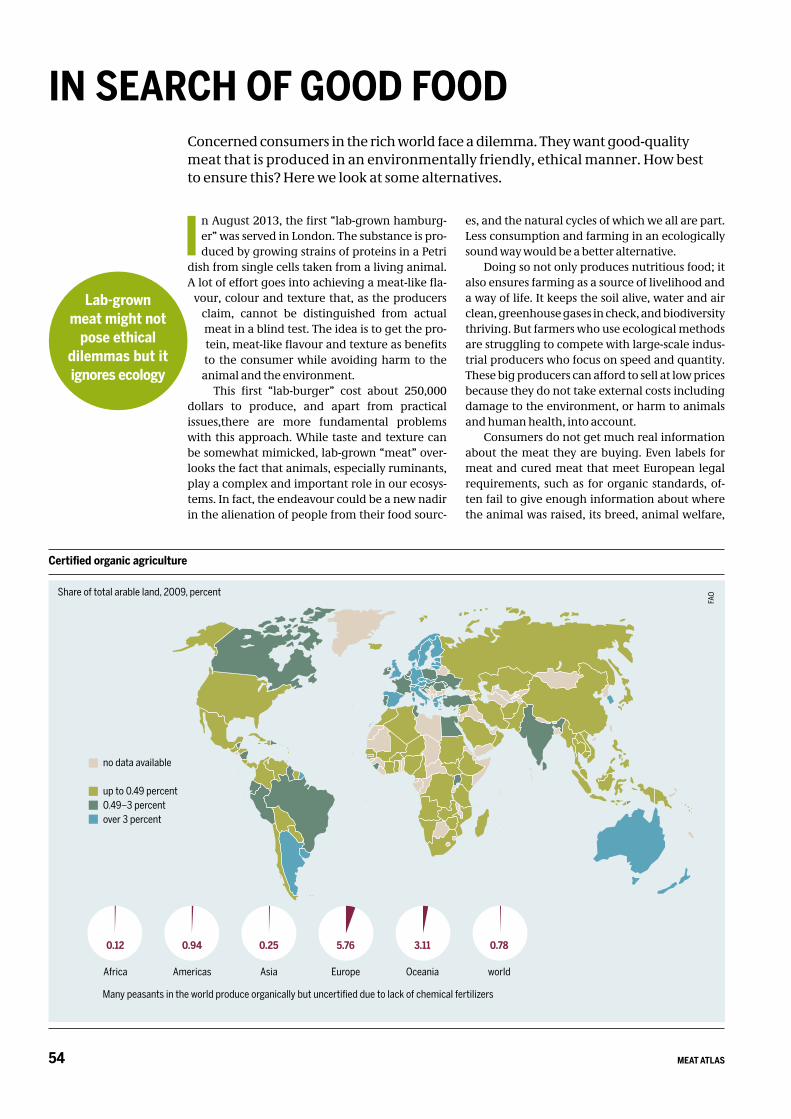
MEAT ATLAS54
I n August 2013, the first “lab-grown hamburg-er” was served in London. The substance is pro-duced by growing strains of proteins in a Petri
dish from single cells taken from a living animal. A lot of effort goes into achieving a meat-like fla-
vour, colour and texture that, as the producers claim, cannot be distinguished from actual meat in a blind test. The idea is to get the pro-tein, meat-like flavour and texture as benefits to the consumer while avoiding harm to the
animal and the environment. This first “lab-burger” cost about 250,000
dollars to produce, and apart from practical issues,there are more fundamental problems with this approach. While taste and texture can be somewhat mimicked, lab-grown “meat” over-looks the fact that animals, especially ruminants, play a complex and important role in our ecosys-tems. In fact, the endeavour could be a new nadir in the alienation of people from their food sourc-
es, and the natural cycles of which we all are part. Less consumption and farming in an ecologically sound way would be a better alternative.
Doing so not only produces nutritious food; it also ensures farming as a source of livelihood and a way of life. It keeps the soil alive, water and air clean, greenhouse gases in check, and biodiversity thriving. But farmers who use ecological methods are struggling to compete with large-scale indus-trial producers who focus on speed and quantity. These big producers can afford to sell at low prices because they do not take external costs including damage to the environment, or harm to animals and human health, into account.
Consumers do not get much real information about the meat they are buying. Even labels for meat and cured meat that meet European legal requirements, such as for organic standards, of-ten fail to give enough information about where the animal was raised, its breed, animal welfare,
Concerned consumers in the rich world face a dilemma. They want good-quality meat that is produced in an environmentally friendly, ethical manner. How best to ensure this? Here we look at some alternatives.
IN SEARCH OF GOOD FOOD
Lab-grown meat might not
pose ethical dilemmas but itignores ecology
Certified organic agriculture
Share of total arable land, 2009, percent
no data available
up to 0.49 percent0.49–3 percentover 3 percent
FAO
Africa Americas Asia Europe Oceania world
0.94 5.76 3.11 0.780.12 0.25
Many peasants in the world produce organically but uncertified due to lack of chemical fertilizers
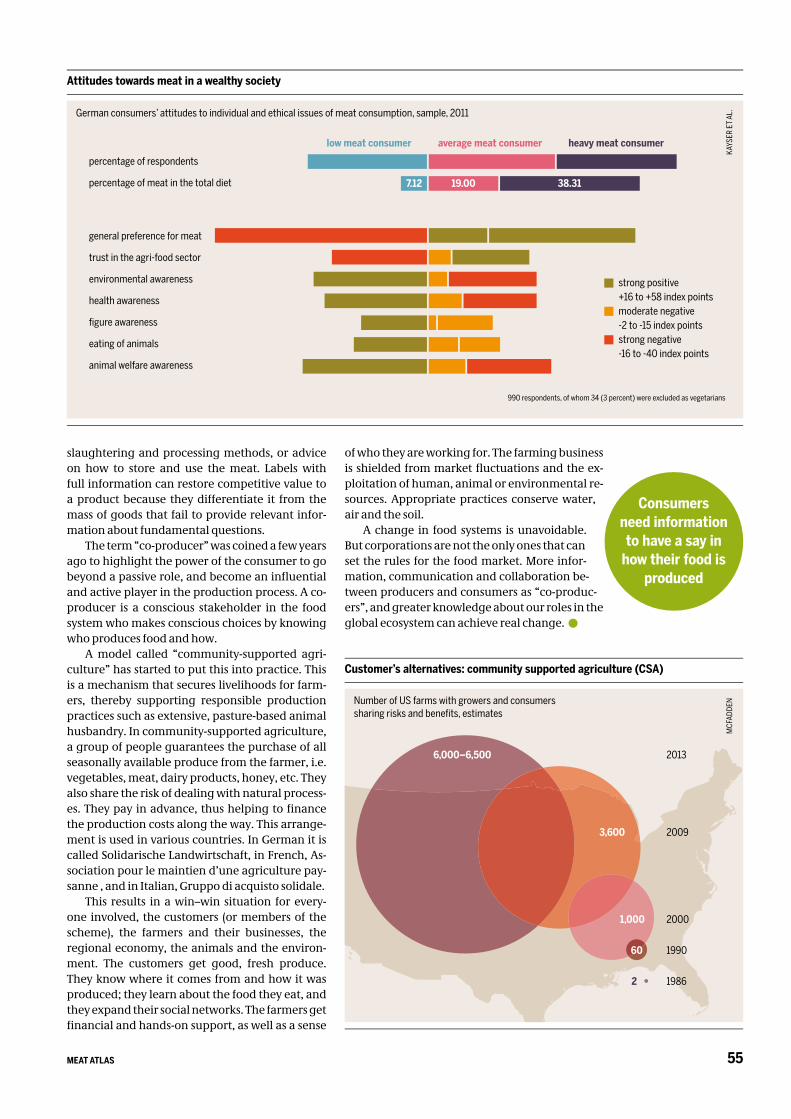
55MEAT ATLAS
slaughtering and processing methods, or advice on how to store and use the meat. Labels with full information can restore competitive value to a product because they differentiate it from the mass of goods that fail to provide relevant infor-mation about fundamental questions.
The term “co-producer” was coined a few years ago to highlight the power of the consumer to go beyond a passive role, and become an infl uential and active player in the production process. A co-producer is a conscious stakeholder in the food system who makes conscious choices by knowing who produces food and how.
A model called “community-supported agri-culture” has started to put this into practice. This is a mechanism that secures livelihoods for farm-ers, thereby supporting responsible production practices such as extensive, pasture-based animal husbandry. In community-supported agriculture, a group of people guarantees the purchase of all seasonally available produce from the farmer, i.e. vegetables, meat, dairy products, honey, etc. They also share the risk of dealing with natural process-es. They pay in advance, thus helping to fi nance the production costs along the way. This arrange-ment is used in various countries. In German it is called Solidarische Landwirtschaft, in French, As-sociation pour le maintien d’une agriculture pay-sanne , and in Italian, Gruppo di acquisto solidale.
This results in a win–win situation for every-one involved, the customers (or members of the scheme), the farmers and their businesses, the regional economy, the animals and the environ-ment. The customers get good, fresh produce. They know where it comes from and how it was produced; they learn about the food they eat, and they expand their social networks. The farmers get fi nancial and hands-on support, as well as a sense
of who they are working for. The farming business is shielded from market fl uctuations and the ex-ploitation of human, animal or environmental re-sources. Appropriate practices conserve water, air and the soil.
A change in food systems is unavoidable. But corporations are not the only ones that can set the rules for the food market. More infor-mation, communication and collaboration be-tween producers and consumers as “co-produc-ers”, and greater knowledge about our roles in the global ecosystem can achieve real change.
Customer’s alternatives: community supported agriculture (CSA)
Number of US farms with growers and consumers sharing risks and benefi ts, estimates
Attitudes towards meat in a wealthy society
German consumers’ attitudes to individual and ethical issues of meat consumption, sample, 2011
KAYS
ER E
T AL
.
990 respondents, of whom 34 (3 percent) were excluded as vegetarians
general preference for meat
trust in the agri-food sector
environmental awareness
health awareness
fi gure awareness
eating of animals
animal welfare awareness
low meat consumer average meat consumer heavy meat consumer
7.12 19.00 38.31
percentage of respondents
percentage of meat in the total diet
strong positive+16 to +58 index points moderate negative-2 to -15 index pointsstrong negative-16 to -40 index points
Consumers need information to have a say in
how their food is produced
MCF
ADDE
N
2013
3,600
1,000
60
6,000–6,500
2
2009
2000
1990
1986
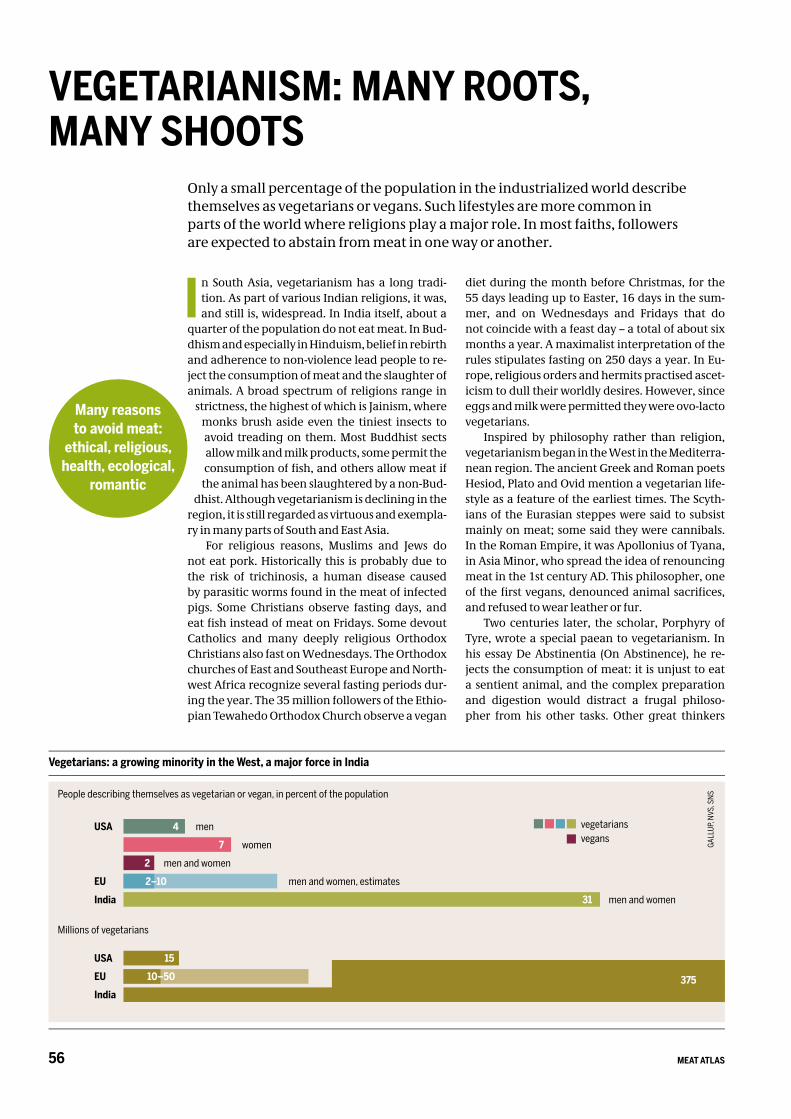
MEAT ATLAS56
I n South Asia, vegetarianism has a long tradi-tion. As part of various Indian religions, it was, and still is, widespread. In India itself, about a
quarter of the population do not eat meat. In Bud-dhism and especially in Hinduism, belief in rebirth and adherence to non-violence lead people to re-ject the consumption of meat and the slaughter of animals. A broad spectrum of religions range in
strictness, the highest of which is Jainism, where monks brush aside even the tiniest insects to avoid treading on them. Most Buddhist sects allow milk and milk products, some permit the consumption of fi sh, and others allow meat if
the animal has been slaughtered by a non-Bud-dhist. Although vegetarianism is declining in the
region, it is still regarded as virtuous and exempla-ry in many parts of South and East Asia.
For religious reasons, Muslims and Jews do not eat pork. Historically this is probably due to the risk of trichinosis, a human disease caused by parasitic worms found in the meat of infected pigs. Some Christians observe fasting days, and eat fi sh instead of meat on Fridays. Some devout Catholics and many deeply religious Orthodox Christians also fast on Wednesdays. The Orthodox churches of East and Southeast Europe and North-west Africa recognize several fasting periods dur-ing the year. The 35 million followers of the Ethio-pian Tewahedo Orthodox Church observe a vegan
diet during the month before Christmas, for the 55 days leading up to Easter, 16 days in the sum-mer, and on Wednesdays and Fridays that do not coincide with a feast day – a total of about six months a year. A maximalist interpretation of the rules stipulates fasting on 250 days a year. In Eu-rope, religious orders and hermits practised ascet-icism to dull their worldly desires. However, since eggs and milk were permitted they were ovo-lacto vegetarians.
Inspired by philosophy rather than religion, vegetarianism began in the West in the Mediterra-nean region. The ancient Greek and Roman poets Hesiod, Plato and Ovid mention a vegetarian life-style as a feature of the earliest times. The Scyth-ians of the Eurasian steppes were said to subsist mainly on meat; some said they were cannibals. In the Roman Empire, it was Apollonius of Tyana, in Asia Minor, who spread the idea of renouncing meat in the 1st century AD. This philosopher, one of the fi rst vegans, denounced animal sacrifi ces, and refused to wear leather or fur.
Two centuries later, the scholar, Porphyry of Tyre, wrote a special paean to vegetarianism. In his essay De Abstinentia (On Abstinence), he re-jects the consumption of meat: it is unjust to eat a sentient animal, and the complex preparation and digestion would distract a frugal philoso-pher from his other tasks. Other great thinkers
Only a small percentage of the population in the industrialized world describe themselves as vegetarians or vegans. Such lifestyles are more common in parts of the world where religions play a major role. In most faiths, followers are expected to abstain from meat in one way or another.
VEGETARIANISM: MANY ROOTS, MANY SHOOTS
Many reasons to avoid meat:
ethical, religious, health, ecological,
romantic
Vegetarians: a growing minority in the West, a major force in India
People describing themselves as vegetarian or vegan, in percent of the population
Millions of vegetarians
GALL
UP, N
VS, S
NS
USA
EU
India
USA
EU
India
4
7
2
2–10
31
15
10–50
men
women
men and women
men and women, estimates
men and women
375
vegetariansvegans
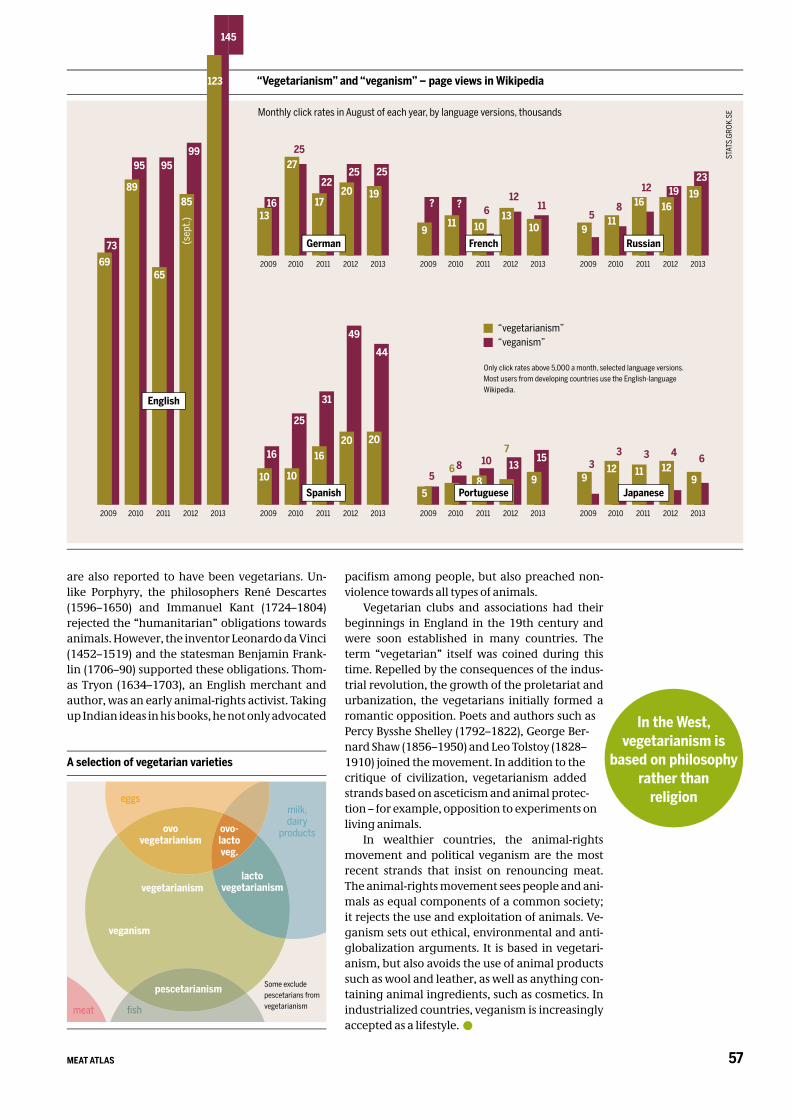
57MEAT ATLAS
are also reported to have been vegetarians. Un-like Porphyry, the philosophers René Descartes (1596–1650) and Immanuel Kant (1724–1804) rejected the “humanitarian” obligations towards animals. However, the inventor Leonardo da Vinci (1452–1519) and the statesman Benjamin Frank-lin (1706–90) supported these obligations. Thom-as Tryon (1634–1703), an English merchant and author, was an early animal-rights activist. Taking up Indian ideas in his books, he not only advocated
pacifi sm among people, but also preached non-violence towards all types of animals.
Vegetarian clubs and associations had their beginnings in England in the 19th century and were soon established in many countries. The term “vegetarian” itself was coined during this time. Repelled by the consequences of the indus-trial revolution, the growth of the proletariat and urbanization, the vegetarians initially formed a romantic opposition. Poets and authors such as Percy Bysshe Shelley (1792–1822), George Ber-nard Shaw (1856–1950) and Leo Tolstoy (1828–1910) joined the movement. In addition to the critique of civilization, vegetarianism added strands based on asceticism and animal protec-tion – for example, opposition to experiments on living animals.
In wealthier countries, the animal-rights movement and political veganism are the most recent strands that insist on renouncing meat. The animal-rights movement sees people and ani-mals as equal components of a common society; it rejects the use and exploitation of animals. Ve-ganism sets out ethical, environmental and anti-globalization arguments. It is based in vegetari-anism, but also avoids the use of animal products such as wool and leather, as well as anything con-taining animal ingredients, such as cosmetics. In industrialized countries, veganism is increasingly accepted as a lifestyle.
“Vegetarianism” and “veganism” – page views in Wikipedia
In the West, vegetarianism is
based on philosophy rather than
religion
A selection of vegetarian varieties
Some exclude pescetarians from vegetarianismfi sh
Only click rates above 5,000 a month, selected language versions. Most users from developing countries use the English-language Wikipedia.
Monthly click rates in August of each year, by language versions, thousands
16
10
2009
25
10
2010
31
16
2011
49
20
2012
44
20
2013
Spanish
5
5
2009
86
2010
10
8
2011
13
7
2012
15
9
2013
Portuguese
39
2009
3
12
2010
3
11
2011
412
2012
6
9
2013
Japanese
1613
2009
2527
2010
22
17
2011
25
20
2012
25
19
2013
German
?
9
2009
?
11
2010
610
2011
12
13
2012
11
10
2013
French
59
2009
811
2010
1216
2011
1916
2012
23
19
2013
Russian
“vegetarianism”“veganism”
7369
2009
95
89
2010
95
65
2011
99
85
2012
123
2013
English
145
meat
veganism
eggsmilk, dairy
productsovovegetarianism
pescetarianism
lactovegetarianism
ovo-lacto veg.
STAT
S.GR
OK.S
E
(sep
t.)
vegetarianism
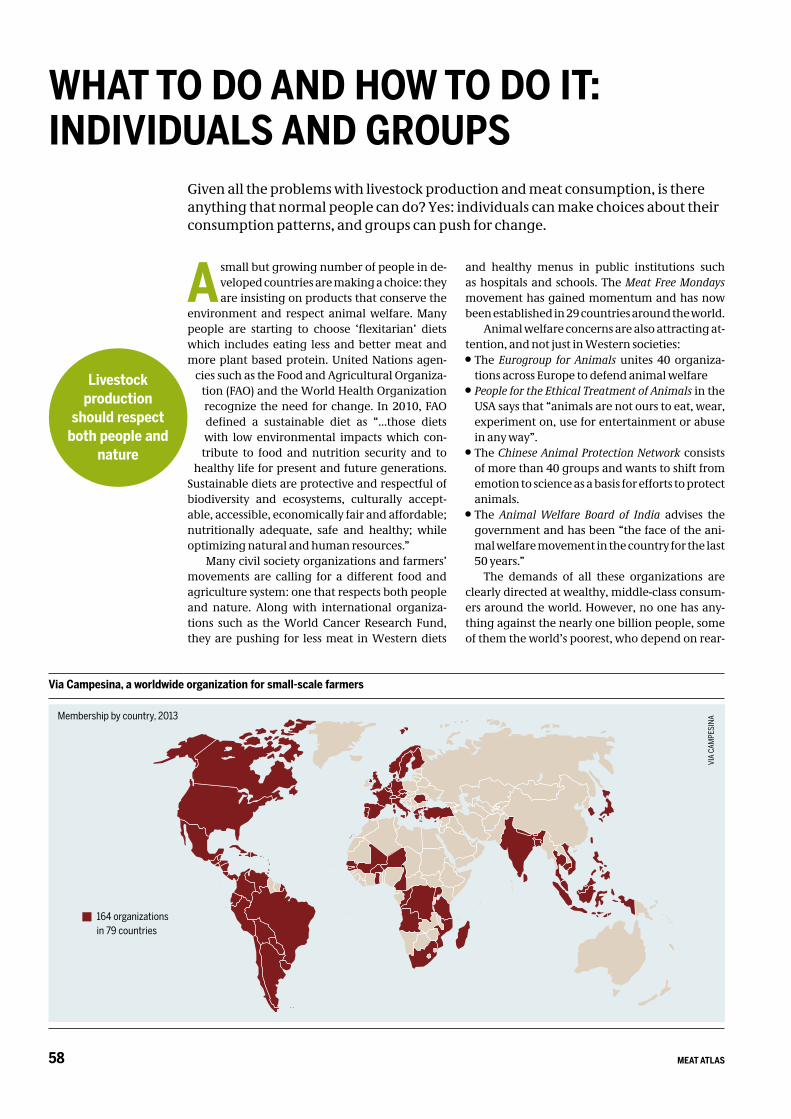
MEAT ATLAS58
A small but growing number of people in de-veloped countries are making a choice: they are insisting on products that conserve the
environment and respect animal welfare. Many people are starting to choose ‘flexitarian’ diets which includes eating less and better meat and more plant based protein. United Nations agen-
cies such as the Food and Agricultural Organiza-tion (FAO) and the World Health Organization recognize the need for change. In 2010, FAO defined a sustainable diet as “…those diets with low environmental impacts which con-
tribute to food and nutrition security and to healthy life for present and future generations.
Sustainable diets are protective and respectful of biodiversity and ecosystems, culturally accept-able, accessible, economically fair and affordable; nutritionally adequate, safe and healthy; while optimizing natural and human resources.”
Many civil society organizations and farmers’ movements are calling for a different food and agriculture system: one that respects both people and nature. Along with international organiza-tions such as the World Cancer Research Fund, they are pushing for less meat in Western diets
and healthy menus in public institutions such as hospitals and schools. The Meat Free Mondays movement has gained momentum and has now been established in 29 countries around the world.
Animal welfare concerns are also attracting at-tention, and not just in Western societies:
The Eurogroup for Animals unites 40 organiza-tions across Europe to defend animal welfare
People for the Ethical Treatment of Animals in the USA says that “animals are not ours to eat, wear, experiment on, use for entertainment or abuse in any way”.
The Chinese Animal Protection Network consists of more than 40 groups and wants to shift from emotion to science as a basis for efforts to protect animals.
The Animal Welfare Board of India advises the government and has been “the face of the ani-mal welfare movement in the country for the last 50 years.”
The demands of all these organizations are clearly directed at wealthy, middle-class consum-ers around the world. However, no one has any-thing against the nearly one billion people, some of them the world’s poorest, who depend on rear-
Given all the problems with livestock production and meat consumption, is there anything that normal people can do? Yes: individuals can make choices about their consumption patterns, and groups can push for change.
WHAT TO DO AND HOW TO DO IT: INDIVIDUALS AND GROUPS
Livestock production
should respect both people and
nature
Via Campesina, a worldwide organization for small-scale farmers
Membership by country, 2013
164 organizations in 79 countries
VIA
CAM
PESI
NA
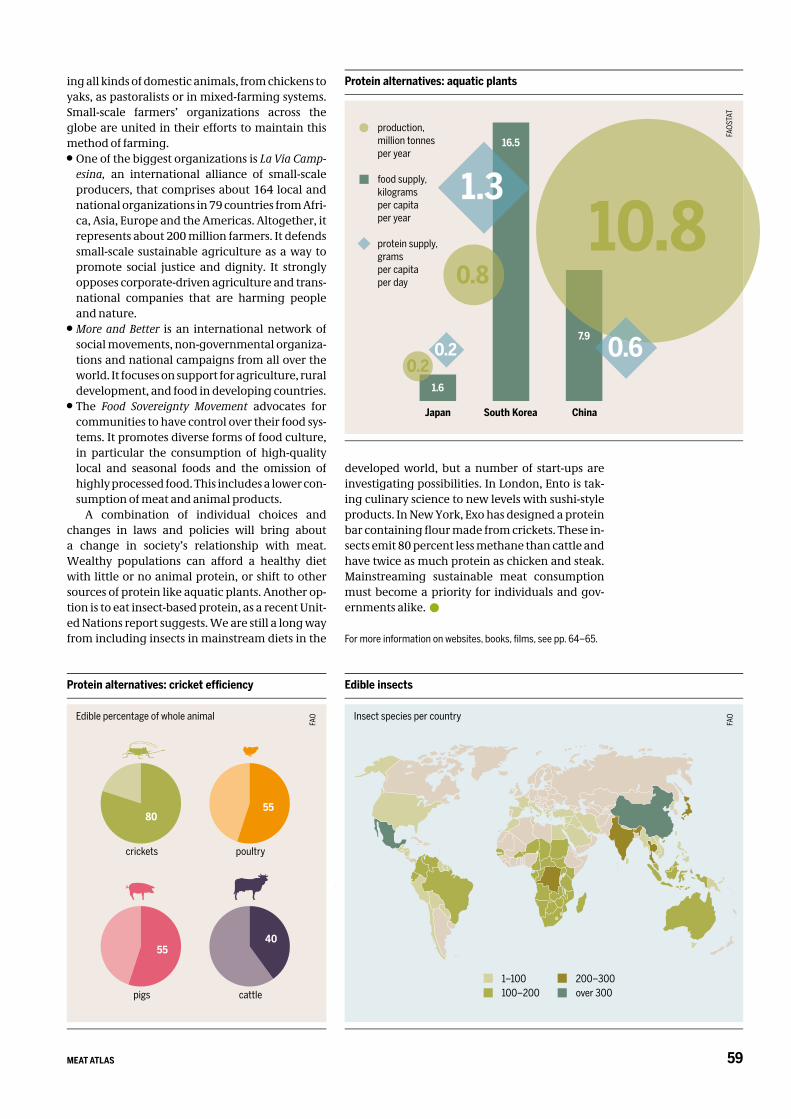
59MEAT ATLAS
ing all kinds of domestic animals, from chickens to yaks, as pastoralists or in mixed-farming systems. Small-scale farmers’ organizations across the globe are united in their efforts to maintain this method of farming.
One of the biggest organizations is La Via Camp-esina, an international alliance of small-scale producers, that comprises about 164 local and national organizations in 79 countries from Afri-ca, Asia, Europe and the Americas. Altogether, it represents about 200 million farmers. It defends small-scale sustainable agriculture as a way to promote social justice and dignity. It strongly opposes corporate-driven agriculture and trans-national companies that are harming people and nature.
More and Better is an international network of social movements, non-governmental organiza-tions and national campaigns from all over the world. It focuses on support for agriculture, rural development, and food in developing countries.
The Food Sovereignty Movement advocates for communities to have control over their food sys-tems. It promotes diverse forms of food culture, in particular the consumption of high-quality local and seasonal foods and the omission of highly processed food. This includes a lower con-sumption of meat and animal products.
A combination of individual choices and changes in laws and policies will bring about a change in society’s relationship with meat. Wealthy populations can afford a healthy diet with little or no animal protein, or shift to other sources of protein like aquatic plants. Another op-tion is to eat insect-based protein, as a recent Unit-ed Nations report suggests. We are still a long way from including insects in mainstream diets in the
developed world, but a number of start-ups are investigating possibilities. In London, Ento is tak-ing culinary science to new levels with sushi-style products. In New York, Exo has designed a protein bar containing fl our made from crickets. These in-sects emit 80 percent less methane than cattle and have twice as much protein as chicken and steak. Mainstreaming sustainable meat consumption must become a priority for individuals and gov-ernments alike.
For more information on websites, books, fi lms, see pp. 64–65.
Protein alternatives: aquatic plants
production, million tonnes per year
food supply, kilograms per capita per year
protein supply,grams per capita per day
FAOS
TAT
Protein alternatives: cricket effi ciency
Edible percentage of whole animal
FAO
crickets
80
poultry
pigs cattle
55
5540
Edible insects
Insect species per countryFA
O
1–100 100–200
200–300 over 300
Japan South Korea
1.6
16.5
China
7.9
10.80.8
0.20.2
1.3
0.6
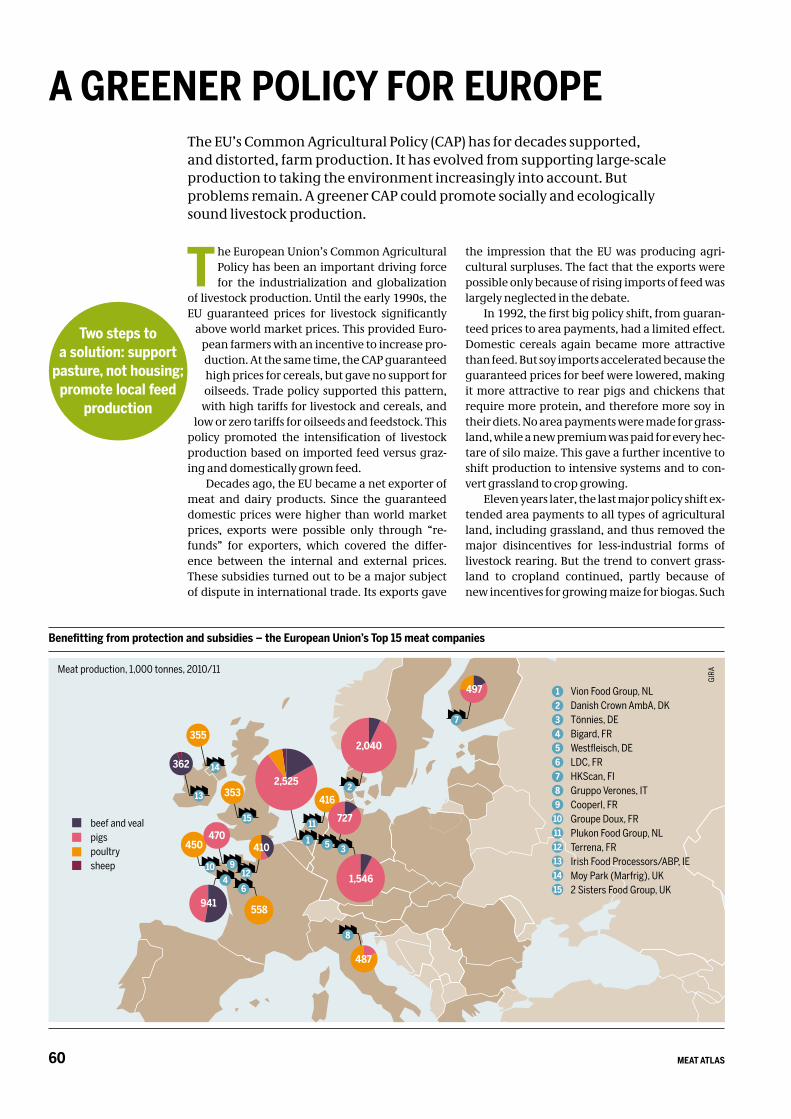
MEAT ATLAS60
T he European Union’s Common Agricultural Policy has been an important driving force for the industrialization and globalization
of livestock production. Until the early 1990s, the EU guaranteed prices for livestock significantly
above world market prices. This provided Euro-pean farmers with an incentive to increase pro-duction. At the same time, the CAP guaranteed high prices for cereals, but gave no support for oilseeds. Trade policy supported this pattern,
with high tariffs for livestock and cereals, and low or zero tariffs for oilseeds and feedstock. This
policy promoted the intensification of livestock production based on imported feed versus graz-ing and domestically grown feed.
Decades ago, the EU became a net exporter of meat and dairy products. Since the guaranteed domestic prices were higher than world market prices, exports were possible only through “re-funds” for exporters, which covered the differ-ence between the internal and external prices. These subsidies turned out to be a major subject of dispute in international trade. Its exports gave
the impression that the EU was producing agri-cultural surpluses. The fact that the exports were possible only because of rising imports of feed was largely neglected in the debate.
In 1992, the first big policy shift, from guaran-teed prices to area payments, had a limited effect. Domestic cereals again became more attractive than feed. But soy imports accelerated because the guaranteed prices for beef were lowered, making it more attractive to rear pigs and chickens that require more protein, and therefore more soy in their diets. No area payments were made for grass-land, while a new premium was paid for every hec-tare of silo maize. This gave a further incentive to shift production to intensive systems and to con-vert grassland to crop growing.
Eleven years later, the last major policy shift ex-tended area payments to all types of agricultural land, including grassland, and thus removed the major disincentives for less-industrial forms of livestock rearing. But the trend to convert grass-land to cropland continued, partly because of new incentives for growing maize for biogas. Such
The EU’s Common Agricultural Policy (CAP) has for decades supported, and distorted, farm production. It has evolved from supporting large-scale production to taking the environment increasingly into account. But problems remain. A greener CAP could promote socially and ecologically sound livestock production.
A GREENER POLICY FOR EUROPE
Two steps to a solution: support
pasture, not housing; promote local feed
production
Benefitting from protection and subsidies – the European Union’s Top 15 meat companies
Meat production, 1,000 tonnes, 2010/11
GIRA
beef and vealpigspoultrysheep
123456789101112131415
Vion Food Group, NLDanish Crown AmbA, DKTönnies, DEBigard, FRWestfleisch, DELDC, FRHKScan, FIGruppo Verones, ITCooperl, FRGroupe Doux, FRPlukon Food Group, NLTerrena, FRIrish Food Processors/ABP, IEMoy Park (Marfrig), UK2 Sisters Food Group, UK
2
2,040
7
497
8
487
355
14
13
362
353
1511
416
1
2,525
727
5 3
1,546
410
558
4
941
10
450
912
6
470
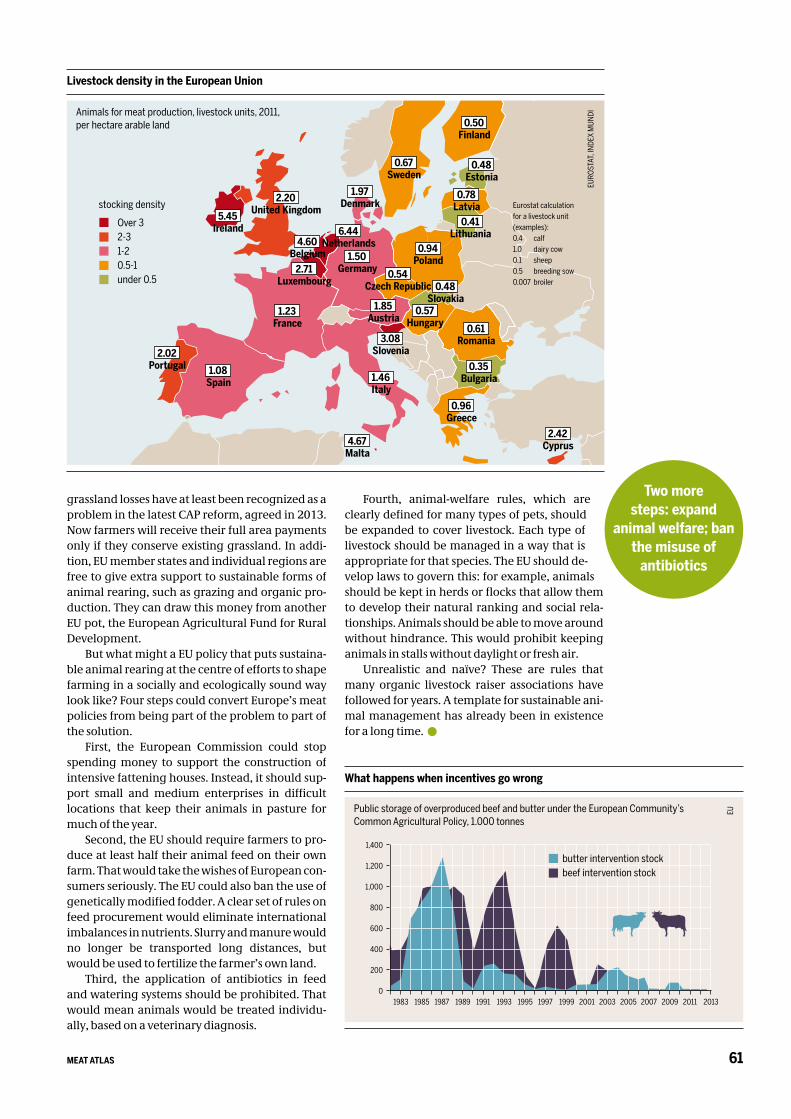
61MEAT ATLAS
grassland losses have at least been recognized as a problem in the latest CAP reform, agreed in 2013. Now farmers will receive their full area payments only if they conserve existing grassland. In addi-tion, EU member states and individual regions are free to give extra support to sustainable forms of animal rearing, such as grazing and organic pro-duction. They can draw this money from another EU pot, the European Agricultural Fund for Rural Development.
But what might a EU policy that puts sustaina-ble animal rearing at the centre of efforts to shape farming in a socially and ecologically sound way look like? Four steps could convert Europe’s meat policies from being part of the problem to part of the solution.
First, the European Commission could stop spending money to support the construction of intensive fattening houses. Instead, it should sup-port small and medium enterprises in difficult locations that keep their animals in pasture for much of the year.
Second, the EU should require farmers to pro-duce at least half their animal feed on their own farm. That would take the wishes of European con-sumers seriously. The EU could also ban the use of genetically modified fodder. A clear set of rules on feed procurement would eliminate international imbalances in nutrients. Slurry and manure would no longer be transported long distances, but would be used to fertilize the farmer’s own land.
Third, the application of antibiotics in feed and watering systems should be prohibited. That would mean animals would be treated individu-ally, based on a veterinary diagnosis.
Fourth, animal-welfare rules, which are clearly defined for many types of pets, should be expanded to cover livestock. Each type of livestock should be managed in a way that is appropriate for that species. The EU should de-velop laws to govern this: for example, animals should be kept in herds or flocks that allow them to develop their natural ranking and social rela-tionships. Animals should be able to move around without hindrance. This would prohibit keeping animals in stalls without daylight or fresh air.
Unrealistic and naïve? These are rules that many organic livestock raiser associations have followed for years. A template for sustainable ani-mal management has already been in existence for a long time.
Two moresteps: expand
animal welfare; banthe misuse of
antibiotics
Livestock density in the European Union
Animals for meat production, livestock units, 2011, per hectare arable land
EURO
STAT
, IND
EX M
UNDI
Eurostat calculation for a livestock unit (examples): 0.4 calf1.0 dairy cow0.1 sheep0.5 breeding sow0.007 broiler
4.60Belgium
0.35Bulgaria
0.54Czech Republic
1.97Denmark
1.50Germany
0.48Estonia
5.45Ireland
0.96Greece
1.08Spain
1.23France
1.46Italy
2.42Cyprus
0.78Latvia
2.71Luxembourg
0.57Hungary
4.67Malta
6.44Netherlands
1.85Austria
0.94Poland
2.02Portugal
0.61Romania3.08
Slovenia
0.48Slovakia
0.50Finland
0.67Sweden
2.20United Kingdom
0.41Lithuania
Over 32-31-20.5-1under 0.5
stocking density
What happens when incentives go wrong
Public storage of overproduced beef and butter under the European Community’s Common Agricultural Policy, 1.000 tonnes
EU
0
200
400
600
800
1,000
1,200
1,400
1983 1987 1991 1995 1999 2003 2007 2011 20131985 1989 1993 1997 2001 2005 2009
butter intervention stockbeef intervention stock
MEAT ATLAS62
AUTHORS AND SOURCESFOR DATA AND GRAPHICS
10–11 THE RISE OF THE GLOBAL MARKET, by Christine Chemnitz p.10: FAO Food Outlook, June 2013. p.11: FAOSTAT. OECD FAO agricultural outlook, 2013-2022.
12–13 CONCENTRATION: ECONOMIES OF SCALE BUT LESS DIVERSITY, by Kathy Jo Wetter p.12: FAO Food Outlook, June 2013. p.13: Leatherhead Food Research, ETC Group
14–15 MAKING PRODUCTS FORM ANIMALS: THE SLAUGHTER INDUSTRY, by Marcel Sebastianp.14: Riva Caroline Hodges Denny, Between the Farm and the Farmer’s Market: Slaughterhouses, Regulations, and Alternative Food Networks. Auburn, Alabama 2012. p.15: FAOSTAT
16–17 BRIGHT PINK IN THE COLD CABINET, by Annette Jensenp.16: Euromonitor international, Fast food in China, 2013. Viveat Susan Pinto, Are store additions by food retail chains sustainable? Business Standard, Mumbai, Sept. 13, 2013. p.17: Euromonitor international, Datagraphic: A Panorama of Packaged Food, Oct. 10, 2013
18–19 FREE TRADE VERSUS SAFE FOOD, by Shefali Sharm and Karen Hansen-Kuhnp.18: Bertelsmann-Stiftung/ifo Institut, Die Transatlantische Handels- und Investitions-partnerschaft (THIP), 2013. p.19: USDA ERS
20–21 THE HIDDEN COST OF STEAK, by Reinhild Benningp.19-20: OECD, Agricultural Policy Monitoring and Evaluation, 2012. OECD database
22–23 WHY FARMS KILL FISH: BIODIVERSITY LOSS ON LAND AND IN WATER, by Tobias Reichertp.22: OECD, Agricultural Policy Monitoring and Evaluation, 2012. p.23: FAO, Livestock’s long shad-ow, 2006 ; The European Nitrogen Assessment. Sources, Effects and Policy Perspectives, 2011
24–25 A SPECIES-POOR PLANET, by Kathy Jo Wetterp.24: FAO, Livestock’s long shadow, 2006. p.25: ETC Group; Keith O. Fuglie et al., Research Investments and Market Structure in the Food Processing, Agricultural Input, and Biofuel Industries Worldwide, USDA ERS, 2011. Sarah Beth Moore et al., Heritage breeds: Saving chickens and cows from extinction, Medill Reports, June 3, 2011
26–27 ANTIBIOTICS: BREEDING SUPERBUGS, by Kathrin Birkelp.26: EWG, Superbugs invade American supermarkets, April 2013. p.27: EMA, Sales of veterinary antimicrobial agents in 25 EU/EEA countries in 2011, Third ESVAC report, 2013. BVL, Zoonosen-Monitoring, Berichte zur Lebensmittelsicherheit, 2010
28–29 WHEN THE TANK IS RUNNING DRY, by Manfred Krienerp.28-29: A. Y. Hoekstra, M. M. Mekonnen, The water footprint of humanity, Twente 2011. p.29: Nippon Ham Annual Report FY 2011. www.waterfootprint.org
30–31 THE GRAIN IN THE FEED TROUGH, by Stephan Börneckep.30-31: WWF, Meat eats land, 2011. p.31: FAO: Challenges and opportunities for carbon sequestration in grassland systems, 2010.
32–33 THE EMERGENCE OF A LATIN AMERICAN SOY EMPIRE, by Michael Álvarez Kalverkampp.32-33: USDA ERS: Agriculture in Brazil and Argentina, 2001; FAOSTAT database; USDA GAIN: Argentina Oilseeds and Products, 2012; Indec, Intercambio Comercial Argentino, Jan. 23, 2013; Soybeans: U.S. Export Trend is up, Share of World Exports is Down, Global AgInvesting, Sept. 26, 2013. p.33: Indec database
34–35 THE CLIMATE COST OF CATTLE, by Stephan Börneckep.34: EWG, Meat Eater’s guide to climate change and health, 2011. p.35: FAO, Tackling Climate Change through livestock, 2013
63MEAT ATLAS
36–37RANCHERS IN THE RAINFOREST, by Thomas Fatheuerp.36: Millenium Ecosystem Assessment, 2005. p.37: FAO; Instituto Nacional de pesquisas especiais (Inpe); Rhett A. Butler, Brazil: satellite data suggests rise in Amazon deforestation over past year, mongabay.com, Sept. 12, 2013
38–39 THE GLYPHOSATE IN YOUR BURGER, by Heike Moldenhauerp.38: USDA ERS, USGS Pesticide National Synthesis Project. p.39: FAO Statistical Yearbook 2012, www.centerfordoodsafety.org. Red universitaria de ambiente y salud, El consume de agrotóxicos en Argentina aumenta continuamente, June 23, 2013
40–41A PLETHORA OF POULTRY: CHICKENS TAKE THE LEAD, by Shefali Sharmap.40: FAO, Global livestock production systems, 2011. p.41: DSW report, 2012; FAO, Food Outlook 11/2012. FAO, Statistical Yearbook 2013
42–43 WHERE KEEPING CHICKENSIS WOMEN’S WORK, by Francisco Maríp.42-43: Juliet Karuki et al., Women, Livestock Ownership and Food Security. In: Bridging the Gender Gap: Women, Livestock Ownership and Markets in Eastern and Southern Africa, ILRI 2013. p.43: A. J. Kitalyi, Village chicken production systems in rural Africa; D. X. Tung, Smallholder poultry production in Vietnam: marketing characteristics and strategies; E. F. Guèye, Gender aspects in family poultry management systems in developing countries; all FAO 1998–2005
44–45 IMPORTED CHICKEN WINGS DESTROY WEST AFRICAN BUSINESSES, by Francisco Maríp.44: Indexmundi/USDA database. p.45: FAO, Livestock sector development for poverty reduction, 2012
46–47 DISQUIET IN THE DEVELOPED WORLD, by Patrick Holdenp.46: WHO/ FAOSTAT databasis; J. Kearney, Food consumption trends and drivers. Philosophical Transactions of the Royal Society, Biological sciences, 2010. p.47: OECD FAO Agricultural Outlook 2013–2022, 2013. CME Daily Livestock report, Dec. 20, 2011, with USDA, Livestock, Dairy, and Poultry Outlook, Nov. 15, 2013
48–49HALF A BILLION NEW MIDDLE-CLASS CONSUMERS FROM RIO TO SHANGHAI, by Sascha Zastiralp.48: FAO, Mapping supply and demand for animal-source foods to 2030, 2011. p.49: OECD FAO Agricultural Outlook 2013–2022, 2013. FAOSTAT database
50–51 URBAN LIVESTOCK KEEPING, by Wolfgang Bayer and Ann Waters-Bayerp.50-51: World Bank/FAO, Urban Agriculture, For Sustainable Poverty Alleviation and Food Security, 2008. p.51: pluckandfeather.com, Urban Livestock in Oakland, 2011
52–53 TURNING SCRUB INTO PROTEIN, by Evelyn Mathiasp.52: ILRI/Mario Herrero, Food security, livelihoods and livestock in the developing world, 2010. p.53: FAO, Pastoralism in the new millenium, 2001, with additions
54–55 IN SEARCH OF GOOD FOOD, by Ursula Hudson and Carlo Petrinip.54: FAO Statistical yearbook, 2012. p.55: Maike Kayser et al., Analysis of Differences in Meat Consumption Patterns. International Food and Agribusiness Management Review, 2013. Steven McFadden, Unraveling the CSA Number Conundrum, thecalloftheland, Jan. 9, 2012
56–57VEGETARIANISM: MANY ROOTS, MANY SHOOTS, by Dietmar Bartzp.56: USA, Gallup 2012, Europe: Nationale Verzehrstudie II, 2008, with estimates by author, India: Hindu-CNN-IBN State of the Nation Survey, 2006. p.57: stats.grok.se
58–59 WHAT TO DO AND HOW TO DO IT: INDIVIDUALS AND GROUPS, by Ruth Shave and Stanka Becheva p.58: viacampesina.org. p.59: FAOSTAT database. FAO, Edible insects, 2013
60–61A GREENER POLICY FOR EUROPE, by Tobias Reichertp.60: GIRA, Richard Brown: Structure & dynamics of the European Meat Industry, 2010/11–2015, Brussels 2012. p.61: Eurostat/Index mundi database. EU, The Common Agricultural Policy explained, 2004, and DairyCo Market Information, Nov. 26, 2013
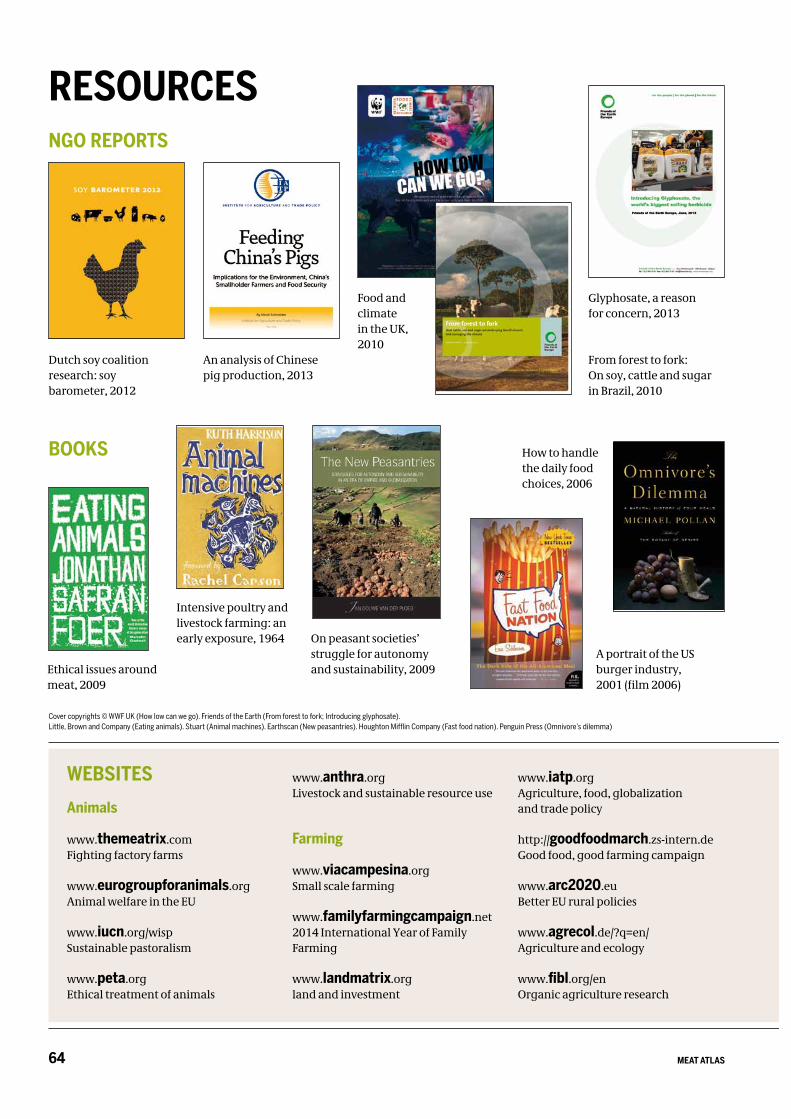
MEAT ATLAS64
Animals
www.themeatrix.com Fighting factory farms
www.eurogroupforanimals.org Animal welfare in the EU
www.iucn.org/wisp Sustainable pastoralism
www.peta.org Ethical treatment of animals
www.anthra.org Livestock and sustainable resource use
Farming
www.viacampesina.org Small scale farming
www.familyfarmingcampaign.net 2014 International Year of Family Farming
www.landmatrix.org land and investment
www.iatp.org Agriculture, food, globalization and trade policy
http://goodfoodmarch.zs-intern.de Good food, good farming campaign
www.arc2020.eu Better EU rural policies
www.agrecol.de/?q=en/ Agriculture and ecology
www.fibl.org/en Organic agriculture research
RESOURCES
WEBSITES
NGO REPORTS
From forest to fork: On soy, cattle and sugar in Brazil, 2010
Dutch soy coalition research: soy barometer, 2012
Glyphosate, a reasonfor concern, 2013
BOOKS
Intensive poultry and livestock farming: an early exposure, 1964
Ethical issues around meat, 2009
On peasant societies’ struggle for autonomy and sustainability, 2009
Food andclimate in the UK, 2010
A portrait of the US burger industry, 2001 (film 2006)
How to handle the daily food choices, 2006
An analysis of Chinesepig production, 2013
Cover copyrights © WWF UK (How low can we go). Friends of the Earth (From forest to fork; Introducing glyphosate). Little, Brown and Company (Eating animals). Stuart (Animal machines). Earthscan (New peasantries). Houghton Mifflin Company (Fast food nation). Penguin Press (Omnivore’s dilemma)
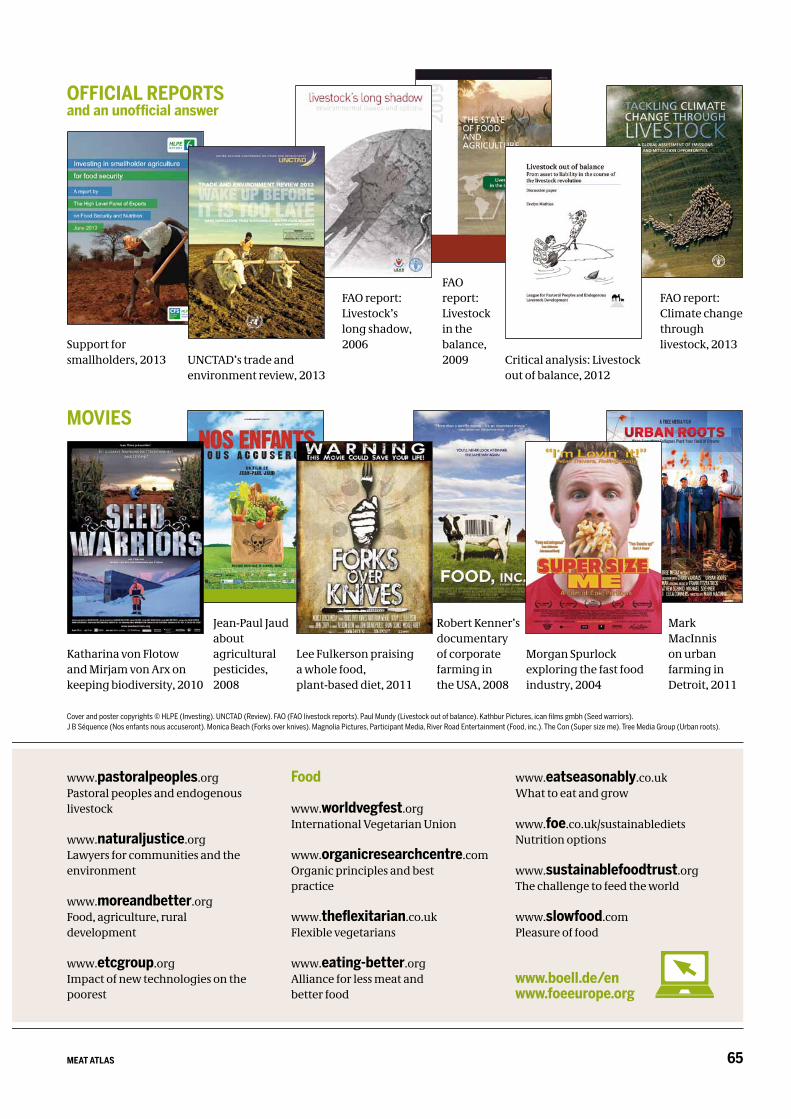
65MEAT ATLAS
MOVIES
www.pastoralpeoples.org Pastoral peoples and endogenous livestock
www.naturaljustice.org Lawyers for communities and the environment
www.moreandbetter.org Food, agriculture, rural development
www.etcgroup.org Impact of new technologies on the poorest
Food
www.worldvegfest.org International Vegetarian Union
www.organicresearchcentre.com Organic principles and best practice
www.theflexitarian.co.uk Flexible vegetarians
www.eating-better.orgAlliance for less meat and better food
www.eatseasonably.co.uk What to eat and grow
www.foe.co.uk/sustainablediets Nutrition options
www.sustainablefoodtrust.orgThe challenge to feed the world
www.slowfood.com Pleasure of food
www.boell.de/enwww.foeeurope.org
Morgan Spurlock exploring the fast food industry, 2004
Robert Kenner’s documentary of corporate farming in the USA, 2008
Lee Fulkerson praising a whole food, plant-based diet, 2011
Jean-Paul Jaud about agricultural pesticides, 2008
Katharina von Flotow and Mirjam von Arx on keeping biodiversity, 2010
Mark MacInnis on urban farming in Detroit, 2011
OFFICIAL REPORTSand an unofficial answer
FAO report: Livestock’s long shadow, 2006
FAO report: Livestock in the balance, 2009
FAO report: Climate change through livestock, 2013
Critical analysis: Livestock out of balance, 2012
Support for smallholders, 2013 UNCTAD’s trade and
environment review, 2013
Cover and poster copyrights © HLPE (Investing). UNCTAD (Review). FAO (FAO livestock reports). Paul Mundy (Livestock out of balance). Kathbur Pictures, ican films gmbh (Seed warriors). J B Séquence (Nos enfants nous accuseront). Monica Beach (Forks over knives). Magnolia Pictures, Participant Media, River Road Entertainment (Food, inc.). The Con (Super size me). Tree Media Group (Urban roots).
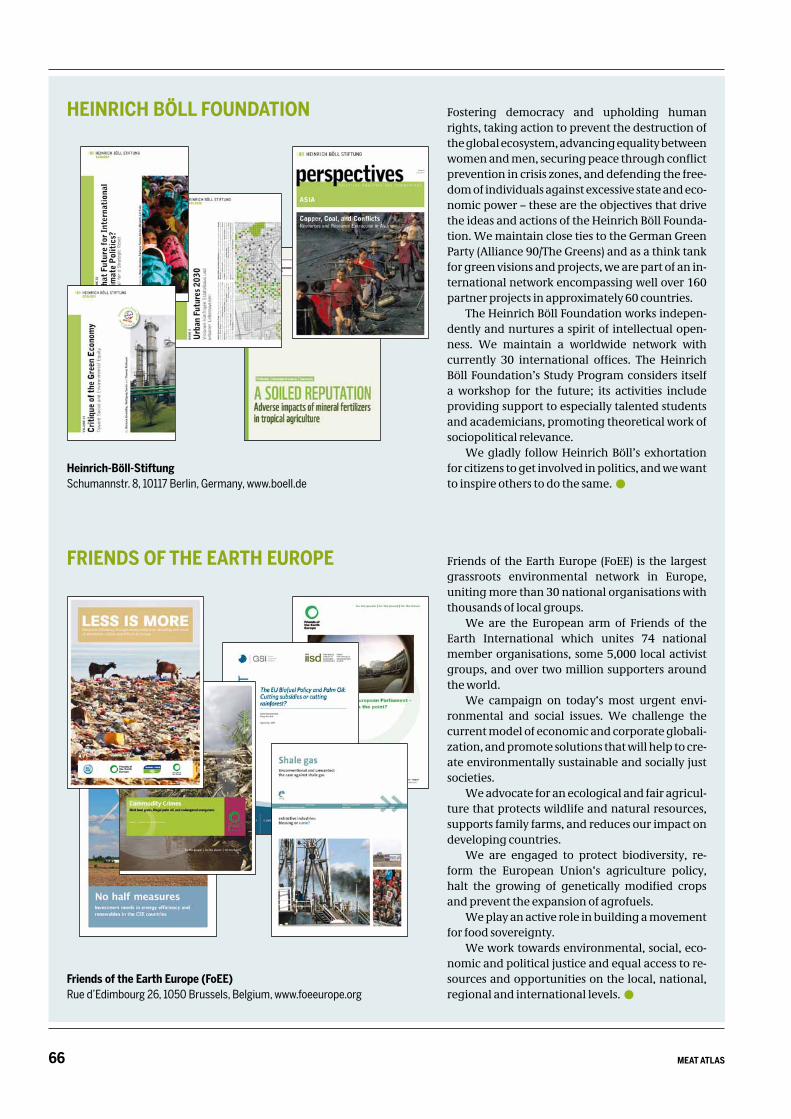
MEAT ATLAS66
HEINRICH BÖLL FOUNDATION
FRIENDS OF THE EARTH EUROPE
Fostering democracy and upholding human rights, taking action to prevent the destruction of the global ecosystem, advancing equality between women and men, securing peace through conflict prevention in crisis zones, and defending the free-dom of individuals against excessive state and eco-nomic power – these are the objectives that drive the ideas and actions of the Heinrich Böll Founda-tion. We maintain close ties to the German Green Party (Alliance 90/The Greens) and as a think tank for green visions and projects, we are part of an in-ternational network encompassing well over 160 partner projects in approximately 60 countries.
The Heinrich Böll Foundation works indepen-dently and nurtures a spirit of intellectual open-ness. We maintain a worldwide network with currently 30 international offices. The Heinrich Böll Foundation’s Study Program considers itself a workshop for the future; its activities include providing support to especially talented students and academicians, promoting theoretical work of sociopolitical relevance.
We gladly follow Heinrich Böll’s exhortation for citizens to get involved in politics, and we want to inspire others to do the same.
Friends of the Earth Europe (FoEE) is the largest grassroots environmental network in Europe, uniting more than 30 national organisations with thousands of local groups.
We are the European arm of Friends of the Earth International which unites 74 national member organisations, some 5,000 local activist groups, and over two million supporters around the world.
We campaign on today‘s most urgent envi-ronmental and social issues. We challenge the current model of economic and corporate globali-zation, and promote solutions that will help to cre-ate environmentally sustainable and socially just societies.
We advocate for an ecological and fair agricul-ture that protects wildlife and natural resources, supports family farms, and reduces our impact on developing countries.
We are engaged to protect biodiversity, re-form the European Union‘s agriculture policy, halt the growing of genetically modified crops and prevent the expansion of agrofuels.
We play an active role in building a movement for food sovereignty.
We work towards environmental, social, eco-nomic and political justice and equal access to re-sources and opportunities on the local, national, regional and international levels.
Friends of the Earth Europe (FoEE)Rue d’Edimbourg 26, 1050 Brussels, Belgium, www.foeeurope.org
Heinrich-Böll-StiftungSchumannstr. 8, 10117 Berlin, Germany, www.boell.de
U3

U3
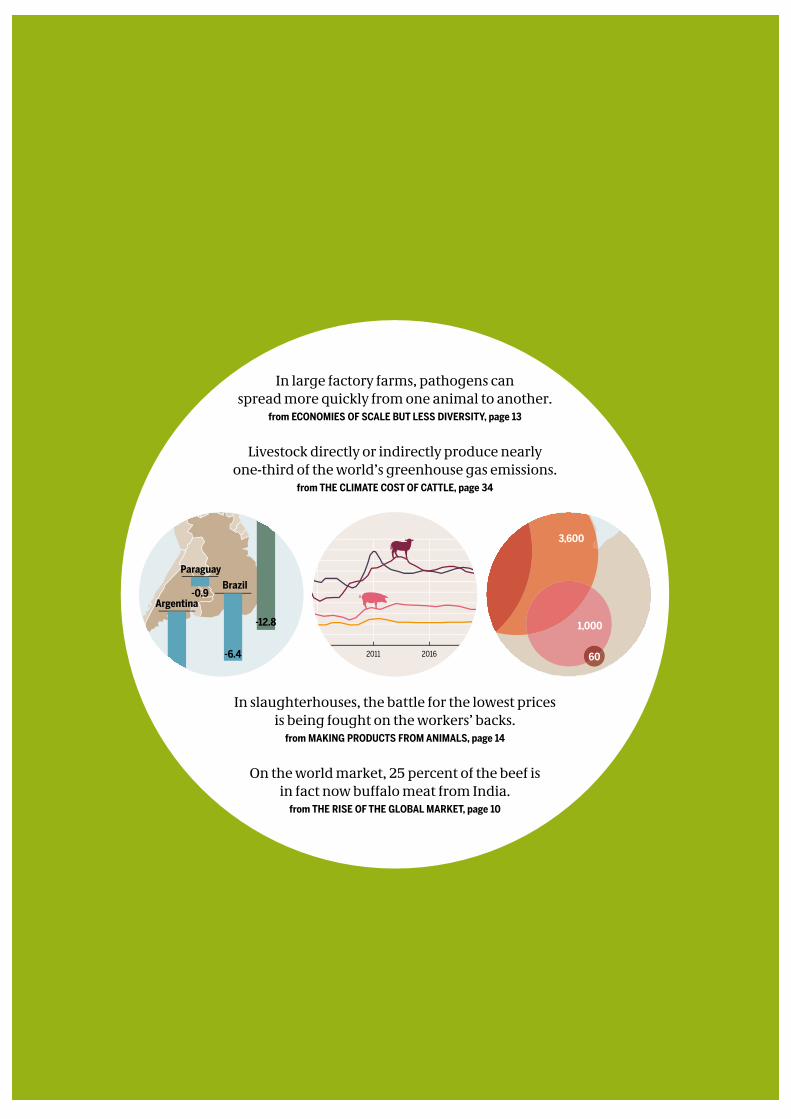
In large factory farms, pathogens canspread more quickly from one animal to another.
from ECONOMIES OF SCALE BUT LESS DIVERSITY, page 13
Livestock directly or indirectly produce nearly one-third of the world’s greenhouse gas emissions.
from THE CLIMATE COST OF CATTLE, page 34
In slaughterhouses, the battle for the lowest prices is being fought on the workers’ backs.
from MAKING PRODUCTS FROM ANIMALS, page 14
On the world market, 25 percent of the beef is in fact now buffalo meat from India.
from THE RISE OF THE GLOBAL MARKET, page 10
1991 1996 2001 2006 2011 2016 20210
1000
2000
3000
4000
5000
2015 2019 2021
beef, veal poultry
pigsheep, goats
2013
3,600
1,000
60
6,000–6,500
2
2009
1986
Middle East/ North Africa
+0.2
Sub-Saharan Africa
+0.1
Commonwealth of Independent
States
-0.2
-0.9
South America
-12.8
Asia
-2
North America
-1.6
Total land outside EU used for soybeans, million hectares
0
8
10
12
2001 2005 2010
14
Oceania
0.0
Argentina
Paraguay
-6.4
Brazil
16